
Abstract
Research in the United States has emphasized the importance of anti-immigrant and anti-Hispanic hostility to galvanize shared identities and a sense of linked fate that is electorally mobilized around the pan-ethnic Latino identity. With survey data on the electoral behavior of South American immigrants in the United States and Spain spanning a decade (2006-2018), this article gauges how critical hostility is for electoral mobilization. The findings suggest that—despite very different institutional settings, hostility levels, elite strategies, and political mobilization patterns—South American immigrants are forging remarkably similar patterns of political preferences and engagement across both sides of the Atlantic. The overtime and comparative perspective calls into question that hostility is the main driving force behind Latino electoral participation and block voting in the United States and prompts greater attention to the socioeconomic status of Latinos and mobilization by political parties.
Despite the vast internal diversity among Hispanics in terms of country origins, Latino politics has been successful in the United States. The forging of a Latino pan-ethnic identity in the United States and its use for political agency are strategic reactions to the categorization of the population of Latin American origin and ancestry as Hispanic (see, e.g., Barreto, 2010; Jones-Correa, 1998). Under the flag of Latino “issues,” an otherwise fragmented electorate has sustained a political coalition that has afforded it with political leverage in U.S. politics (De la Garza & Yang, 2019).
The Latino pan-ethnic identity has developed over time in the United States both as a result of positive incentives provided by the opportunity structure for group mobilization and as a consequence of the conflictual dynamics engendered by anti-immigrant—and in particular anti-Mexican—hostility, discrimination, and prejudice (e.g., Gutierrez et al., 2019). Hostility dynamics are seen as being at the heart of the political mobilization and solid Democratic voting base among many Hispanics in the United States, particularly given the discrepancy between Hispanics’ conservative values and preferences on social issues and their partisan leanings (e.g., Jacobson, 2019). Previously, Hispanics had been more openly—and somewhat successfully—courted by the Republican party by appealing to their conservative values (Sears et al., 2016), but the majority—more than 60% since 2008—continue to lean toward the Democratic party (Lopez et al., 2016).
While there is considerable evidence to support this view of the development of a Latino pan-ethnic identity and voting block in the United States, this article—aided by a comparison of the political behavior of South American immigrants in the United States and in Spain between 2006 and 2018—examines two aspects that have been largely overlooked thus far: partisan mobilization and the socioeconomic status (SES) of Hispanics. The Spanish case informs the analysis of the U.S. case and raises questions about the central role afforded in the United States to hostility in explaining Latino electoral behavior.
Spain is home to one of the largest South American emigrant communities outside the Americas (see the “Introduction” to this Special Issue). However, the social category of “Latinos” (or of “Hispanics”) is not commonly used by Spanish political elites or state institutions. In Spain, there is no census category of Hispanics. As Suárez-Orozco and Páez (2002) argue, the term Latino is to a large degree one that acquires full meaning only in the United States. Instead, references to the particular national communities (Ecuadorian, Colombian, Dominican, Peruvian, etc.) prevail. Hence, the dominant “social categorization” does not foster the emergence of “Latino politics” in Spain.
Moreover, the politicization of immigration and the hostility against immigrants in Spain is lower than in the United States and less polarized than in many other European countries (Heath & Richards, 2019). For example, the conservative party in Spain—the Partido Popular (People’s Party, PP)—has been relatively moderate in its anti-immigrant rhetoric and positions (Morales et al., 2015; Ruedin & Morales, 2019). 1 Nevertheless, as we demonstrate in this article, South American immigrants show patterns of partisan leaning toward the progressive parties in Spain—primarily the Partido Socialista Obrero Español (Spanish Socialist Workers’ Party, PSOE), but also other smaller center-left parties—that suggest the formation of a voting block, as has happened in the United States over decades. This constitutes a puzzle: Why would this “block voting” partisanship—seemingly at odds with conservative moral and cultural preferences—emerge among South American immigrants in Spain where anti-Hispanic hostility is not a rallying driver? As we reveal, the relevance of SES in Spain calls for further examination in the United States as well.
South American Immigrants in the United States and Spain
In the United States, the largest share of the Hispanic population is of Mexican and Caribbean origin and, primarily, formed by second or subsequent generations; in Spain, these origin groups are a marginal minority among Latin American immigrants, where first generations from South American countries are the most numerous group (see the “Introduction” to the Special Issue). Therefore, this article focuses exclusively on first-generation South American immigrants because they are the most comparable subgroup in the United States and Spain. They are also a less studied subgroup in terms of their integration, and our comparison brings insights into the similarities and differences with the Hispanic population at large in the United States.
According to the 2013-2017 American Community Survey 5-year estimate, around 10% of the nearly 59 million Hispanics in the United States are of South American origin, and they are primarily foreign-born first-generation immigrants (Noe-Bustamante, 2019; U.S. Census Bureau, 2017). South Americans constitute the largest share of all Latin American immigrants in Spain: around 80% (Instituto Nacional de Estadistíca, 2020b). In both countries, they are heavily employed in working-class occupations. More than 24% of the South American population in the United States is employed in service occupations, 22% in sales and office occupations, and 12% in natural resources, construction, and maintenance occupations (U.S. Bureau of Labor Statistics, 2018). They are disproportionately represented in these occupations that only employ 48% of the overall U.S. population. In Spain, they are also disproportionately represented in the least qualified and lower paid occupations in the labor force, with more than 60% employed in low-skilled service (hospitality, personal services, and sales) and manual labor (agriculture, fisheries, mining, industry, and construction) sectors, compared with 30% for the Spanish population (Instituto Nacional de Estadistíca, 2020a).
Hostility as a Driver of Latino Electoral Mobilization
The 2000 census declared Hispanics the largest minority in the United States. Ever since, a narrative has developed among political, and even intellectual, elites that immigration from Latin America is too large and different from other immigrant groups who had successfully integrated (Huntington, 2004; Zolberg, 2008). Hostile rhetoric toward Hispanics reached new heights amidst the 2016 presidential campaign. In those elections, immigration became a central issue, with Donald Trump often referring to Hispanic immigration as an “invasion,” and depicting Hispanic immigrants—especially Mexicans—as criminals and disloyal citizens (Reilly, 2016).
Latino political behavior scholars have pointed to the mobilizing effects of hostile political rhetoric targeting Hispanics, resulting in greater turnout for all origin groups, as it fosters greater group solidarity and the use of a pan-ethnic (Latino) identity (Barreto & Woods, 2005). Latino voters from all origin groups who were angry at the 2016 Republican candidate’s attacks on the group were “more likely to engage in political activities such as donating to campaigns, contacting government officials, and protesting during and shortly after the 2016 election” (Gutierrez et al., 2019, p. 960).
Considering the limited existing evidence on partisan get-out-the-vote (GOTV) targeting of the Hispanic population in the United States (Hajnal & Lee, 2011), much of the existing argument about the development of a sense of linked fate and the formation of a voting block in the U.S. scholarship on Hispanics rests on the effects of hostility and shared experiences of institutional discrimination (De la Garza & Yang, 2019; Gutierrez et al., 2019). Nevertheless, more recent scholarship acknowledges the increasing investment in GOTV mobilization of Latino voters by Democratic presidential candidates in 2008 and 2016 (Searle & Abrajano, 2019). Media coverage of the 2020 Biden campaign suggests that targeted GOTV mobilization of Hispanics may have contributed to his victory in key battleground states such as Arizona and Nevada. Hence, we should ponder whether GOTV strategies by either or both of the main parties in the United States may be as powerful in mobilizing Latino voters (if not more) as hostility and discrimination.
By contrast, despite the fivefold surge in the foreign-born population from 3% (in 1998) to 16% (in 2010, at the peak of the immigration flows), anti-immigrant hostility in Spain has remained moderate compared with other European countries. Spaniards tend to display more positive attitudes toward immigration and immigrants than the average European (see Heath & Richards, 2019). Spanish surveys consistently show that Latin Americans attract the most positive attitudes of all immigrant origins. For example, a survey conducted in 2016 (Centro de Investigaciones Sociológicas, survey number 3161) asked respondents as to which group of immigrants they preferred or liked more, and 21% mentioned Latin Americans as a whole or specific nationalities. On the other end, when asked about the groups that they disliked most, only 3% mentioned Latin Americans in general or any specific nationality, compared with 15% who mentioned Romanians and 22% who mentioned Moroccans, Arabs, Muslims, or (pejoratively) “Moors.” Indeed, in Spain, hostility toward Latin American immigrants is relatively low, and surveys indicate that they are in privileged positions of the racial hierarchy, right after native Spaniards.
To our knowledge, there is no survey targeting only Latin American immigrants in Spain, and we have no information on their pan-ethnic identification with the “Latino” category. Nevertheless, several associations formed by Latin American immigrants have embraced pan-Latino causes and identities (Morales et al., 2009). The incipient diffusion of a vague Latino identity in Spain is also evident from the blossoming of Latino media, Latino products, and Latino events in the past two decades. 2 Yet, thus far, this incipient pan-ethnic Latino identity has not been mobilized electorally, and political parties have not yet truly targeted immigrant communities for national-level general elections.
Following this discussion, the ensuing complementary expectations guide our comparison of the political engagement of South Americans in the United States and Spain:
Expectation 1: If anti-immigrant hostility (structural and candidate driven) is the main driving force of Latino electoral mobilization, we would expect turnout rates for South Americans in the United States to be higher than in Spain across all election years studied, but especially so for the years when the Republican party and candidates were emphasizing anti-immigrant rhetoric and policies (i.e., 2016 and 2018).
Expectation 2: Given that Hispanics tend to be more conservative in their social and moral values than the average population, and that the main reason posited for their progressive leanings in the United States is the reaction against the anti-immigrant stance of Republicans, we should expect that the absence of such marked hostility from the centre-right PP in Spain would lead to South American immigrants not displaying differential party choices in Spain. Hence, we expect consistently higher leanings toward the Democratic party in the United States than for the PSOE and progressive parties in Spain.
Expectation 3: If GOTV mobilization efforts are major drivers of Latino electoral mobilization, we would expect turnout rates for South American immigrants in the United States to only be considerably higher than in Spain when both parties (but, particularly, the Democratic party) heavily invest in mobilizing Latino voters (2008 and 2016). Although automatic administrative voter registration in Spain facilitates turnout, GOTV mobilization is still essential for new voters even where voting is relatively easy, and the Spanish context is less favorable in terms of GOTV efforts.
Expectation 4: Given the low levels of hostility against South Americans in Spain and the limited GOTV efforts in that country, the SES of South American voters should be a more structuring factor of both turnout and vote choices in Spain than in the United States.
Data Sources
We use survey data on the electoral behavior of South American immigrants in the United States and Spain. We focus exclusively on first-generation foreign-born South American immigrants who have naturalized and are United States/Spanish citizens at the time of interview.
To obtain a large enough sample size in each country, we have postharmonized and pooled a number of surveys that included immigrant respondents in each of the countries. For the United States, we have pooled eight surveys conducted between 2006 and 2018: the 2006 Latino National Survey, the 2008 and 2016 Collaborative Multiracial Postelection Study, and the five 2010-2018 Pew Pre-election National Surveys of Latinos. For Spain, we have pooled 25 surveys conducted between 2008 and 2018, all from the Centro de Investigaciones Sociológicas databank: the electoral surveys of 2008, 2011, 2015, and 2016, as well as numerous political barometers and the Spanish General Social Surveys of 2013, 2015, and 2017. This provides us with a sample of 550 South American-born naturalized immigrants for the United States and a sample of 1,761 South American–born naturalized immigrants for Spain. The sample is larger for Spain because there were more surveys to draw from and the vast majority of Latin American respondents were first-generation, naturalized, and born in South America. Table 1 provides the main descriptives of both subsamples.
Descriptive Statistics of the Samples.
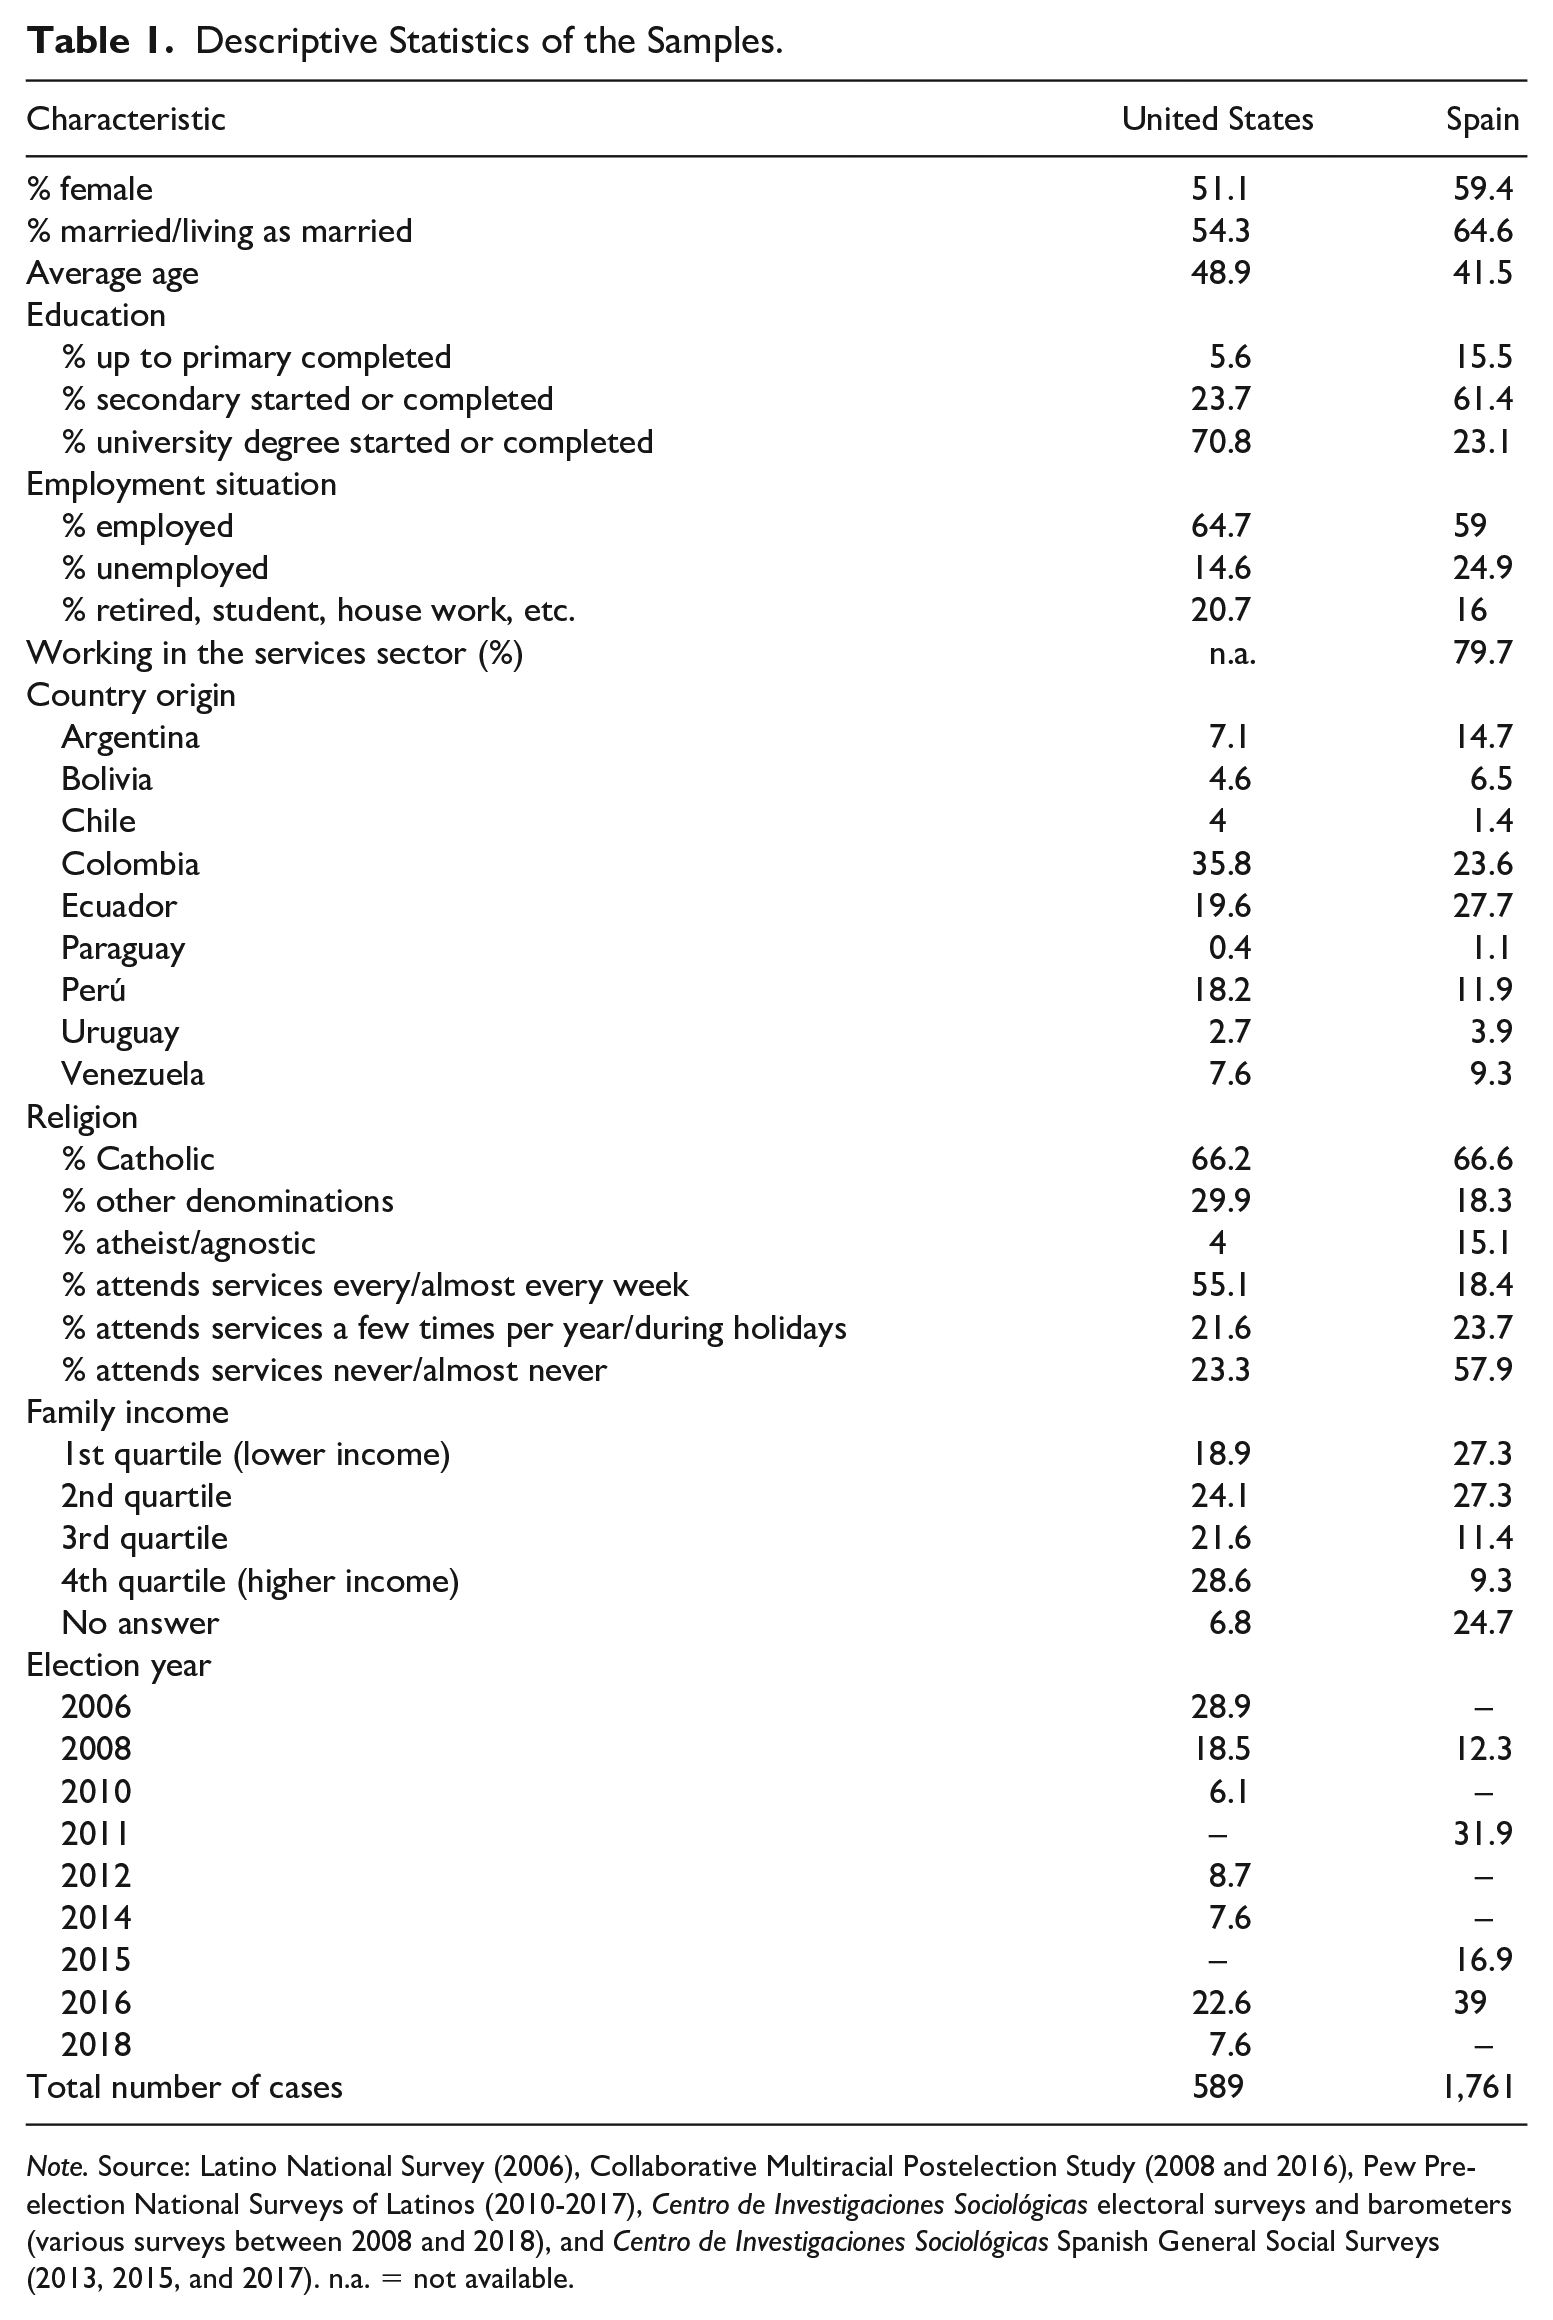
Note. Source: Latino National Survey (2006), Collaborative Multiracial Postelection Study (2008 and 2016), Pew Pre-election National Surveys of Latinos (2010-2017), Centro de Investigaciones Sociológicas electoral surveys and barometers (various surveys between 2008 and 2018), and Centro de Investigaciones Sociológicas Spanish General Social Surveys (2013, 2015, and 2017). n.a. = not available.
The South American population in Spain is more feminized, younger, with lower levels of educational attainment, more vulnerable to unemployment, and highly concentrated in the service sector. In the United States, it is more religious and apparently wealthier. Nevertheless, South Americans in Spain are considerably more religious than the average Spanish population (among whom 23% are atheists and 70% never attend religious services). In both countries, the South American population is diversified across the various countries of origin, with higher shares of Colombian, Ecuadorian, and Peruvian immigrants.
Turnout
First, we examine the turnout of South American immigrants in both countries. 3 The average declared turnout rate for South Americans is 71% in Spain and 75% in the United States, which is in the expected direction of greater mobilization in the United States, although the gap between the two groups is small. This compares with an average declared turnout rate of 83% in Spain and 79% in the United States for the overall population, which means that the turnout gap with the overall population is considerably larger in Spain. Yet Figure 1 indicates that the variance in turnout is higher in the United States than in Spain, even when focusing solely on presidential elections: It oscillated between more than 90% in 2008 (when Obama first won) and 68% in the 2012 elections. Although the sample size for the United States is too small to allow for meaningful analyses across countries of origin, the analysis of the Spanish data reveal considerable turnout gaps by country of origin, with Argentinians and Venezuelans voting at rates around 80% and Bolivians and Ecuadorians at around 65%.
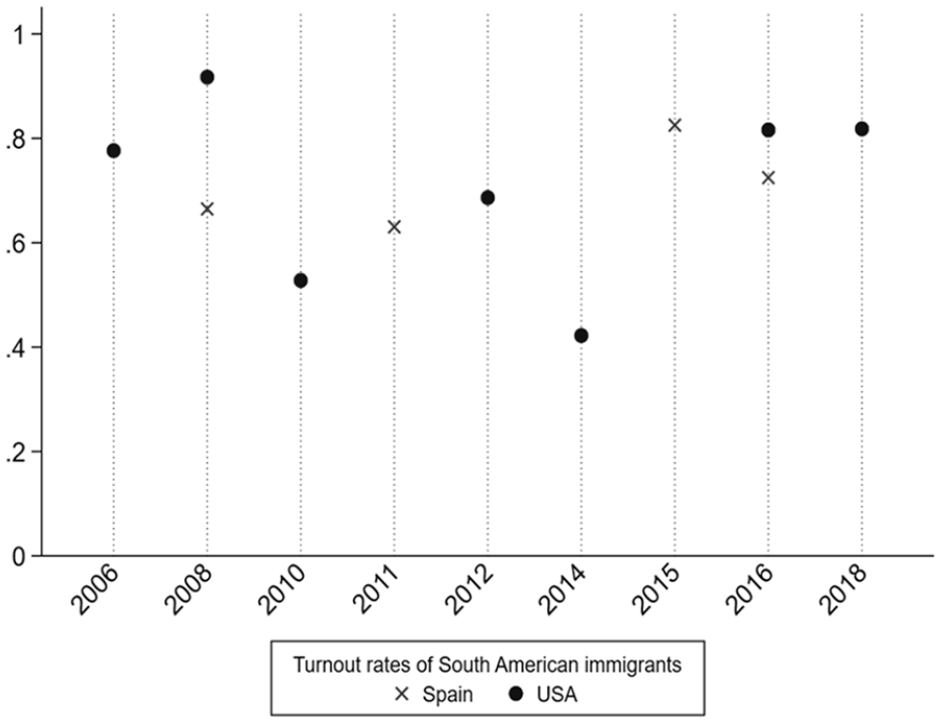
Turnout rates of South American immigrants over time in the United States and Spain, 2006-2018.
While the high levels of turnout might be surprising compared with overall Latino turnout rates in the United States, they are consistent with evidence showing that naturalized immigrants vote at higher rates than native-born citizens (Pantoja et al., 2001) and that South Americans have higher levels of educational achievement.
Since the differences in turnout could be driven partly by the disparities in the demographic characteristics of South Americans in both countries, we estimate multivariate logistic regression models. In addition to the standard SES factors, we control for religious affiliation and church attendance, given that they are powerful correlates of participation in the United States (Lasala-Blanco, 2014).
Figure 2 displays the results obtained per country. The figure plots the predicted probabilities for the variables and values of interest included in the regressions in each country (black circle points), with the 95% confidence intervals (gray horizontal lines). We estimated two models for Spain: one with the same variables as in the United States and a second expanded model with variables on occupation and class that were not available in the U.S. surveys. Alas, attitudinal variables were not systematically available in the surveys. 4 We find a number of differences in the factors that shape the electoral participation of South Americans in each country.
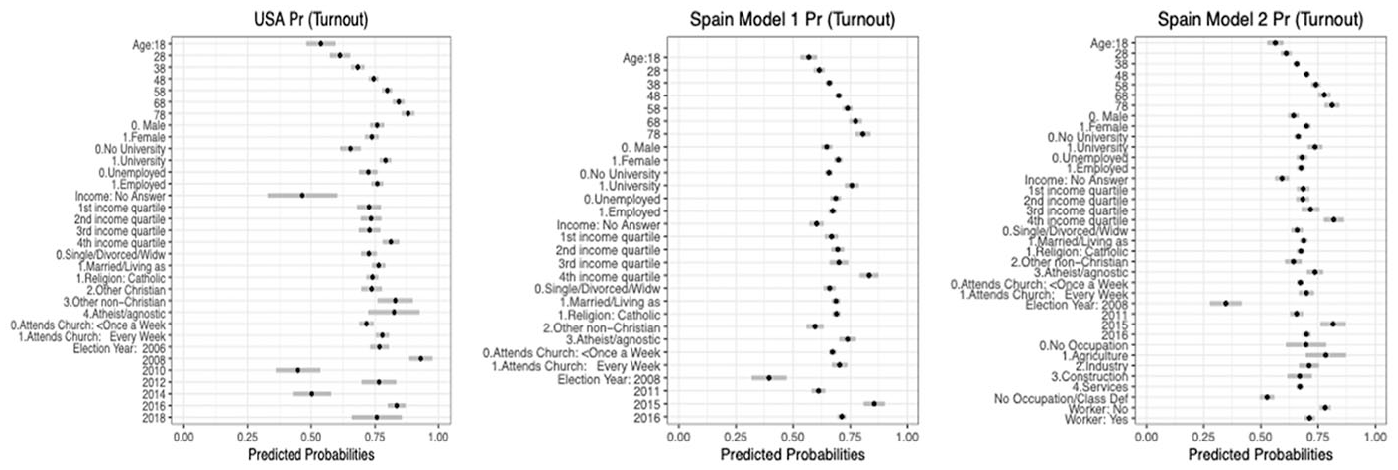
Predicted probabilities of turnout for South American immigrants in the United States and Spain, 2006-2018.
Demographic Characteristics and Socioeconomic Status
Age is positively and linearly related to turnout in both countries. 5 By contrast, sex is not a significant predictor in the United States, but South American women in Spain seem more likely to turn out to vote than men (significant at the 90% confidence level). There are no significant differences by marital status.
Moreover, the core factors that determine economic inequalities—educational attainment, income, occupation, and so on—are more consequential for turnout rates in Spain than in the United States. Indeed, although higher levels of educational attainment are significantly associated with turnout in both countries, income and social class are also major predicting factors of turnout in Spain. South American immigrants at the top 25% of the income distribution in Spain are more likely to turn out, and the gap with those at the bottom 25% is sizable and larger than the gap found for educational attainment. Although the findings for income in the United States are in the same direction, the differences are not statistically significant and much smaller, suggesting that educational achievement is the most determining factor. In Spain, consistent with the findings for income, South American immigrants with a working-class occupation are less likely to turn out than those in upper- and middle-class occupations, but more than those with no declared occupation (Model 2).
Religiosity, GOTV Mobilization, and Hostility
Models of turnout afford an important role to GOTV mobilization. Four main types of organizations contribute to such mobilization: churches, political parties, advocacy organizations, and trade unions. Unfortunately, we do not have direct measurements of GOTV mobilization, but we can use some indirect ones.
If church-based mobilization were a driving force of turnout among South American immigrants, we should find that respondents who declare a religious affiliation and, especially those who attend religious services more often, should turn out to vote in greater numbers. However, our findings suggest that religious affiliation and the degree of religiosity does not drive turnout in either country. Atheists and agnostics have a somewhat higher probability to turn out to vote than those who declare a religious affiliation, but the differences are not statistically significant. Attending religious services every week does not significantly mobilize South American immigrants to vote in either country.
We find, nevertheless, interesting variation in turnout probabilities by electoral year, suggesting that GOTV efforts are consequential for the turnout of South American immigrants in the United States. The 2008 and 2016 presidential elections saw a higher probability to turn out than several midterm elections, as is usually the case. Nevertheless, the highest mobilization was not achieved in 2016 with Trump’s candidacy and anti-immigrant hostility but in 2008 with Obama’s first presidential race. It is noteworthy that the combination of hostility and important issues like abortion—prominent in the 2016 election and known to polarize Latino partisan opinion—did not result in a greater probability of voting in 2016 than in 2008 for South American immigrants in the United States. Moreover, the turnout probability for the 2018 midterms (during Trump’s presidency) is not significantly different from that of the midterms of 2006 or 2012, despite the markedly hostile rhetoric and policies of the Trump administration. These findings, jointly considered, suggest that targeted GOTV efforts by political parties, which was most intense in 2008, may be a more powerful turnout driver than anti-immigrant hostility for South American naturalized citizens in the United States.
Moreover, the results for Spain suggest that turnout is steadily increasing over time among South American naturalized citizens without an obvious connection to changes in GOTV mobilization efforts and despite being (on average) poorer and less educated than their U.S. counterparts.
In sum, consistent with our expectations, results suggest that turnout among South American immigrants is most affected by GOTV mobilization in the United States and SES factors in Spain. Turnout is somewhat higher in the United States than in Spain, especially in presidential elections where both parties court and try to mobilize Latino voters in battleground states like Texas and Arizona. In Spain, turnout is more structured by socioeconomic factors than in the United States. This, taken alongside the fluctuations of turnout rates over time in the United States—which are consistent with the magnitude of the mobilization efforts by both parties—makes us wonder whether in the absence of such mobilizing drivers Latino turnout may be shaped by socioeconomic inequalities. South Americans have high rates of educational attainment within the Latino population, and they have consistently turned out at higher rates than the overall Latino population in the same elections.
Party Choice
As discussed in previous sections, the Hispanic vote in the United States tends to be—for the most part, and with the exception of Cubans—solidly Democratic. This is attributed to the anti-immigrant position of the Republicans and, particularly, their increasingly hostile rhetoric toward Hispanic immigration that binds Hispanics into a Latino voting block for the Democrats. In Spain, given the more moderate population and party elites’ attitudes toward immigration and immigrants, and the limited hostility toward Latin Americans, we expect that South American naturalized immigrants should not behave differently from the average Spaniard in terms of vote choices.
Table 2 shows that, indeed, the block-voting behavior is considerably higher in the United States than in Spain. Around two thirds of South Americans vote for the Democratic party in the United States, and the gap is larger when we exclude third parties and fully dichotomize the choices (Section 2 in Table 2). Regardless of operationalization, there is around a 30 percentage points gap favoring Democrats. Instead, the gap between PSOE and PP is much smaller, at around 10 percentage points (Section 1 in Table 2). Nonetheless, this still means that South American immigrants are more likely to vote for the PSOE than the average Spanish voter by 5 percentage points.
Party Preferences of South American Naturalized Immigrants in the United States and Spain, 2006-2018.
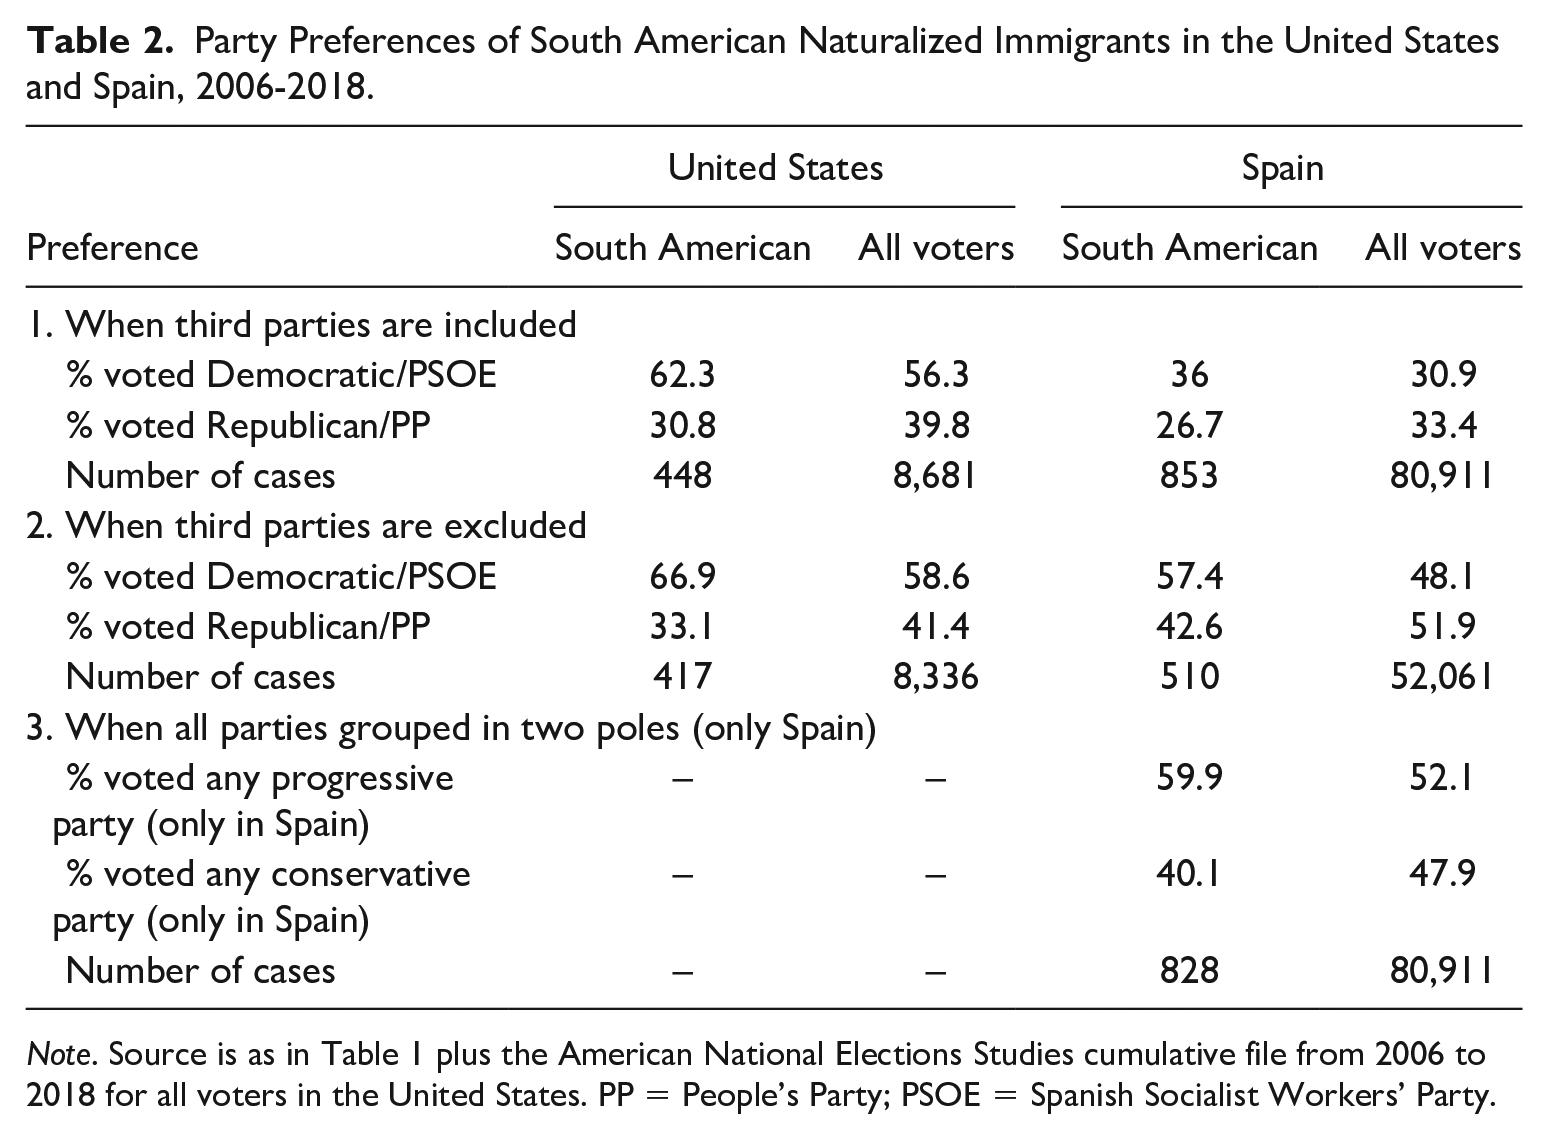
Note. Source is as in Table 1 plus the American National Elections Studies cumulative file from 2006 to 2018 for all voters in the United States. PP = People’s Party; PSOE = Spanish Socialist Workers’ Party.
Yet the Spanish party system is a multiparty one with a heterogeneous set of choices throughout the country and multiple subnational party systems with their own specificities and regional parties competing even for national legislative elections. Hence, dichotomizing the voting choice set is better for appropriate comparisons with the United States. Therefore, we also display the party choice distribution when votes for third parties are ignored (Section 2 in Table 2) and when party choices are grouped into a binary progressive versus conservative parties set (Section 3 in Table 2). Doing this, we find that South American immigrants favor progressive parties over conservative parties by a 15 percentage points (Section 2) and a 20 percentage points (Section 3) margin, respectively. Moreover, the gap with the average Spanish voter in the propensity to vote for PSOE/progressive parties increases to 9 percentage points (Section 2) and 8 percentage points (Section 3), respectively.
While lower than the levels of block voting that we find in the United States, these results suggest that a milder form of partisan allegiance to progressive parties is developing among South Americans in Spain, despite the absence of a strong rallying force around anti-immigrant and anti-Latino hostility. In fact, Figure 3 suggests that such a pattern seems to be steadily and gradually strengthening over time. In the United States, the trend is less clear, with the 2014 midterm elections as an outlier of what otherwise seems a solid Democratic voting base. With the exception of 2008 and 2014, the Democratic block-voting pattern of South Americans in the United States is stronger than that of their counterparts in Spain for progressive parties. In 2008, the Republican candidate (McCain) was perceived to be friendlier to Latinos and favoring comprehensive immigration reform. Consistently, the Republican party received a larger share of the South American immigrant vote that year.
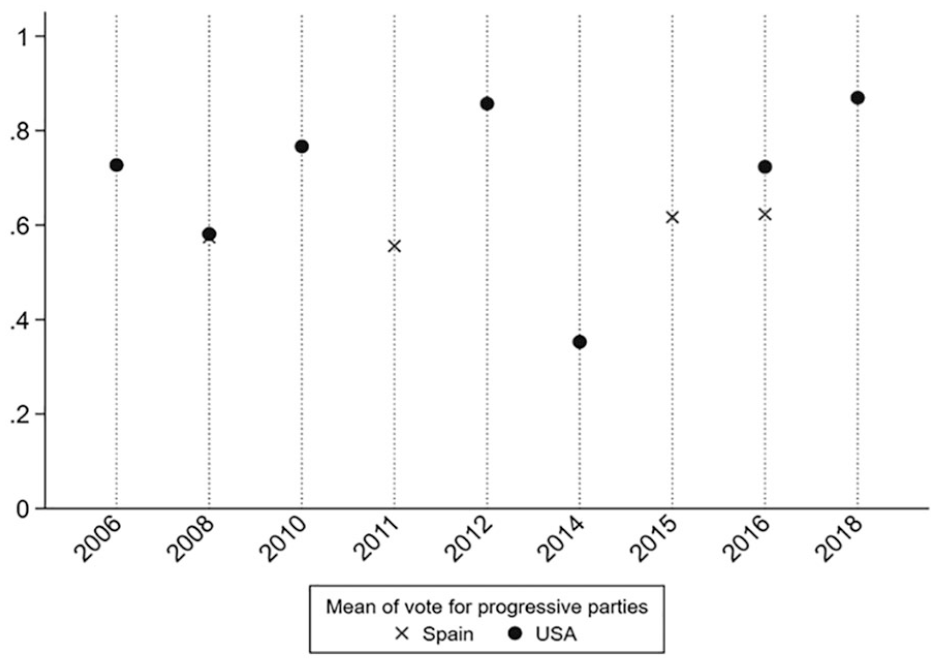
Voting rates for progressive parties of South American immigrants, 2006-2018.
Indeed, when we examine variation around party choice by country of origin, the findings reinforce the view of a solidly Democratic voting block among South Americans in the United States across all country origin groups; whereas, in Spain, we find that Bolivians and Venezuelans depart from the general pattern of preference for progressive parties and lean toward conservative parties, especially the latter. The case of Venezuelans deserves further future study, as it is a markedly anti-Chávez recent migration wave, and the political leanings they bring from Venezuela could freeze similarly to how the anti-Castro position of the Cuban exile has made them a solid Republican voting base.
As with turnout, we examine with multivariate logistic regressions the correlates of party voting choice for both countries (Figure 4). 6
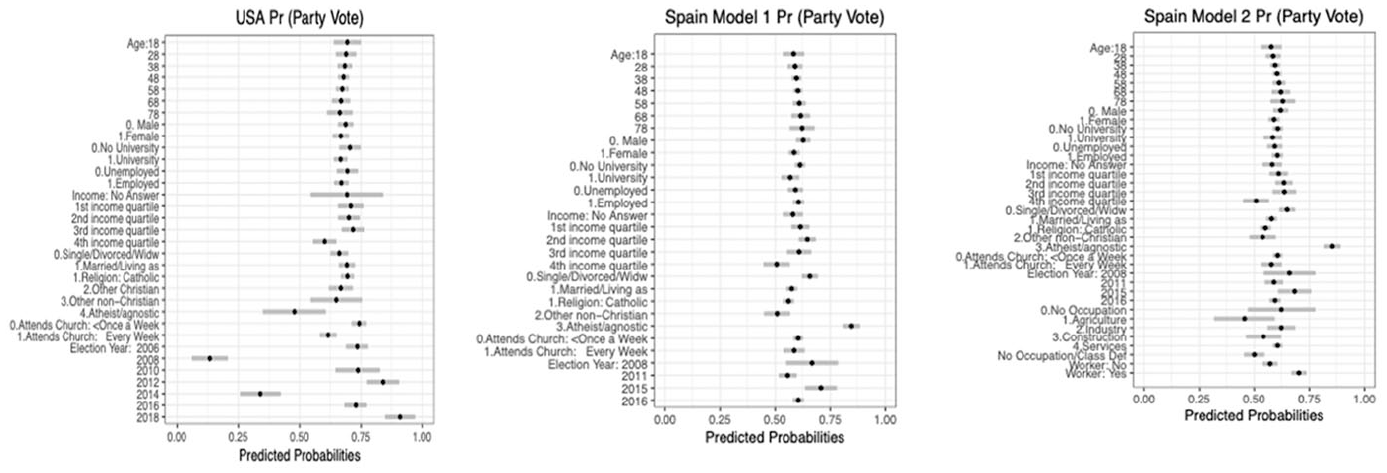
Predicted probabilities of voting for progressive parties for South American immigrants in the United States and Spain, 2006-2018.
Demographic Characteristics and Socioeconomic Status
While we find very little social structuration of party choice in the United States, SES is considerably more consequential in the Spanish case. In Spain, South American immigrants who are in the highest quartile of the income distribution are somewhat less likely to vote for progressive parties (for statistical significance levels of 90%), and reversely those in working class occupations are more likely to vote for progressive parties. Hence, an incipient form of “class” voting seems to be shaping up among South Americans in Spain.
Religiosity, GOTV Mobilization, and Hostility
As discussed in the previous section, churches can be places of political mobilization, and for both the United States and Spain we find that religiosity discourages progressive voting. For the United States, while religiosity and service attendance did not affect turnout, we find that frequent church attendance depresses voting for the Democrats. In Spain, South Americans who declare a religious affiliation are less likely to vote for progressive parties, regardless of their church attendance.
In relation to the possible effect of GOTV mobilization and anti-immigrant hostility, our findings are mixed. The probability of voting for the Democratic party is not at its highest when anti-immigrant hostility is most patent (2016) or when GOTV efforts are most intense (2008 and 2016). Instead, we find that (once other factors are controlled) the 2018 elections resulted in the highest probability to vote for the Democrats (coinciding with an intense mobilization campaign during the midterm elections) and that the 2008 presidential election (when anti-immigrant rhetoric was low) depressed the probability of voting for the Democrats.
Conclusions and Discussion
This article aimed at reconsidering the link between anti-immigrant hostility and electoral mobilization for Latinos in the United States, aided by the comparison with the lesser known and intriguing case of the electoral behavior of Latinos in Spain. To ensure comparability, the analyses draw on novel pooled postharmonized survey data on first-generation naturalized South Americans between the mid-2000s and 2018. The findings call into question the widespread view that hostility is the main driver of both the electoral mobilization and the Democratic leanings of Latinos as a voting block in the United States.
First, in relation to turnout, we found that electoral mobilization of South Americans is on average higher in the United States than in Spain, and these average turnout rates entail a smaller turnout gap with the overall population in the United States than in Spain. Nevertheless, we also found that turnout rates for South Americans fluctuate considerably across the period studied and not only following a midterm/Presidential election logic, whereas we find a gradual but steady increase in turnout for this group in Spain. Indeed, contrary to Expectation 1, turnout was not higher in the United States across all election years, and neither was it for elections when hostility was at its highest (2016 and 2018), as turnout levels are comparable to those in Spain for 2015. Indeed, consistent with Expectation 3, we find that decisive GOTV efforts may be more consequential than hostility, as the 2008 Presidential elections saw the highest levels of South American turnout at a time when anti-immigrant rhetoric was the lowest within the studied period.
Second, in relation to the party choice of South American immigrants, while we found that Democratic leanings in the United States are on average higher than for the PSOE or progressive parties in Spain, this was not so for every election (contrary to Expectation 2). Indeed, in 2008, South Americans in the United States opted for the Democrats as much as their counterparts in Spain did for progressive parties, and in 2014 only around 40% voted Democratic, which is considerably lower than the lowest vote share for progressive parties in Spain (approximately 55%). Moreover, if anything, South Americans seem to behave more as a “voting block” in Spain than in the United States, as their progressive leanings are steadier and gradually increasing despite the very limited hostility and GOTV efforts.
Third, consistent with Expectation 4, we found a greater socioeconomic structuration of both turnout and vote choice for South Americans in Spain. Whereas older, better educated, and wealthier South Americans are more likely to turn out in both countries, the effect of income is stronger in Spain. Unfortunately, the U.S. surveys tend not to record respondents’ occupations, so we were not able to assess its relevance in that country, but we found that South Americans with working-class occupations are less likely to vote in Spain. While there is no indication that educational achievement or income drives party choice among South Americans in the United States, we found that income and occupation are powerful drivers of vote choice in Spain.
Therefore, one of the key contributions of this article—which is consistent with the 2020 U.S. presidential election results (Narea, 2020)—is to highlight the complex relationship between hostility, mobilization, and the electoral behavior of immigrant groups. If hostility were the key explanatory factor in reinforcing a feeling of linked fate among Hispanics, mobilizing them against the aggressor, we would not find similar levels of turnout in this community in 2008 (one of the least hostile campaigns) and in 2016 (one of the most). Our findings also suggest that there is more to the effect of GOTV efforts than meets the eye. By looking at turnout only, one could wrongly assume that the mobilization strategies of the 2008 Obama campaign was what led to the highest turnout levels for South Americans. Yet 2008 stands out as one of the elections when South Americans were the least likely to vote for the Democrats.
Instead, what our overtime comparison of the United States and Spanish cases suggests is the integrative and mobilizing potential of acceptance (or reduced hostility). An environment where there is less hostility may result in better political integration outcomes, as a feeling of acceptance by the receiving society can motivate immigrants to gradually become more engaged in politics. Turnout rates for South Americans in the United States were at its highest in 2008—a campaign with low anti-immigrant rhetoric and when both Democrats and Republicans were reaching out to Hispanics. John McCain, the Republican candidate, was an immigration reform champion and seen as one of the least hostile (even friendly) Republicans toward Hispanic immigrants and the immigration agenda. Consistently, the 2008 election stands out as the one where South Americans were more likely to turnout, rather than 2016, the one with the most hostile rhetoric directed toward Hispanics. Consistent with the integrative context hypothesis, turnout rates in Spain have been sustained and gradually increasing over time in a context of limited hostility against Latin Americans and similarly limited targeted party GOTV mobilization efforts. More research is needed to better understand this interaction between acceptance/hostility and partisan mobilization effects on the electoral behavior of Latinos and other minorities, and better survey data are required to fully assess the potential role of SES factors.
Footnotes
Declaration of Conflicting Interests
The authors declared no potential conflicts of interest with respect to the research, authorship, and/or publication of this article.
Funding
The author(s) disclosed receipt of the following financial support for the research, authorship, and/or publication of this article: This article and its open access publication is based upon work funded by COST Action 16111 EthmigSurveyData (![]() ), supported by COST (European Cooperation in Science and Technology) and funded by the Horizon 2020 Framework Programme of the European Union; the University of Oxford; the Universidad Autónoma de Madrid, and the Casa de Velázquez in Madrid.
), supported by COST (European Cooperation in Science and Technology) and funded by the Horizon 2020 Framework Programme of the European Union; the University of Oxford; the Universidad Autónoma de Madrid, and the Casa de Velázquez in Madrid.
Notes
Author Biographies
![]() ).
).
![]() ).
).