
Abstract
Protest event analysis is a key method to study social movements, allowing to systematically analyze protest events over time and space. However, the manual coding of protest events is time-consuming and resource intensive. Recently, advances in automated approaches offer opportunities to code multiple sources and create large data sets that span many countries and years. However, too often the procedures used are not discussed in details and, therefore, researchers have a limited capacity to assess the validity and reliability of the data. In addition, many researchers highlighted biases associated with the study of protest events that are reported in the news. In this study, we ask how social scientists can build on electronic news databases and computational tools to create reliable PEA data that cover a large number of countries over a long period of time. We provide a detailed description our semiautomated approach and we offer an extensive discussion of potential biases associated with the study of protest events identified in international news sources.
Introduction
The analysis of contentious politics has a long tradition in social science. One of the key methods in this field is protest event analysis (PEA), a form of content analysis that allows to systematically collect, quantify, and process large amounts of information on political protest across time and countries (Hutter, 2014a, 2014b). Protest event data has usually relied on newspaper coverage as data source, and, mostly on manual coding. Yet the manual coding of protest events across time and space is intensely time consuming. This poses an important challenge to study large numbers of countries and to cover extensive periods of time. In this article, we ask how social scientists can build on electronic news databases and computational tools to create reliable PEA data that cover a large number of countries over a long period of time. Answering this research question requires addressing two challenges: (a) building a procedure to identify unique protest events across multiple news sources and (b) assessing the reliability and validity of the collected data.
Following the suggestions by Nardulli et al. (2015), we develop a multistep procedures that combines automated preselection of relevant documents and manual coding to obtain a high-quality data set with a reasonable cost and time frame. Nardulli et al. (2015) propose automating the extraction of simple factual content from text and, then, employing human coding to identify the content that requires more interpretation. Our approach is very much in line with this strategy, we apply an extended natural language processing (NLP) tool pipeline in order to identify relevant news stories prior to the manual coding of protest events from them. Our decision to rely on automated NLP for the coding of the data required the linguistic homogeneity of our sources. Following the lead of Beissinger and Sasse (2014), we chose to retrieve and code protest events reported by 10 English-speaking news agencies—all we could find in the 30 countries covered by our study. Our approach can be easily reproduced, thanks to our detailed presentation of the procedure we follow.
In addition, we provide a detailed evaluation of the reliability and validity of our data. Concerning the manual coding part, we have reached acceptable intercoder reliability. Furthermore, we compare our data with existing data, drawn from both automated and manual coding, to provide a thorough assessment of its biases. Last, the comparison of our data with other existing protest event data shows that the sources we used mainly introduce the expected biases when using international instead of national sources: the events included in our data set are more newsworthy for an international audience, that is they are more likely to take place in the capital, they are larger events and they are more likely to occur in times when the international community focuses on a given country. Other than this, they do not seem to vary systematically from data sets based on the coding of national sources.
The article is structured as follows. First, we discuss existing approaches to study protest events and highlight the main limits of events derived from news sources. Second, we present our procedure for the automated selection of news sources on protest events and the actual coding. Third, we compare our data with data from a source that used automated coding (Integrated Crisis Early Warning System [ICEWS]) and with data based on the manual coding of national news sources. In the conclusion, we highlight the strength and weaknesses of our approach. We also discuss future challenges for the development of semiautomated PEA.
Strengths, Weaknesses, and Advances in PEA
The study of protest events contributed to important advances in the field of social movement research (see Earl et al., 2004, for a review of these contributions). Over time, the tools available to study protest events evolved, gaining in precision and becoming more reflexive about the biases associated with this method (Hutter, 2014a). Any PEA method captures only a segment of the events that take place in a given place and time (Ortiz et al., 2005). Hence, it can never fully reflect the flux of protest events in real life. Most empirical research in this field build on newspaper sources to study protest events, therefore researchers introduce biases associated with media coverage of protest events in their research. Our understanding of these biases has advanced thanks to critical work in this field (Amenta et al., 2009; Earl et al., 2004; Ortiz et al., 2005; Rafail et al., 2019). Ortiz et al. (2005) point to four types of bias: event characteristics, contextual factors, media structure, and research process. The first three types correspond to selection bias such as size and intensity of the event, its proximity to a news agency, the issue attention cycle, the profit motives and corporate interests of media and their sponsors (see Earl et al., 2004; Ortiz et al., 2005, for a detailed discussion). The good news is that these biases tend to be stable over time and that, when events are reported in the news, there are few factual mistakes (or descriptive bias) only missing information about the goals of the movements (Earl et al., 2004).
Among the characteristics of events that contribute to their featuring in the news, media proximity is a good predictor of protest event inclusion in the news (Amenta et al., 2017, Earl et al., 2004). This means that the closer an event is to a media outlet, the more likely that the event will feature in the press. However, this geographical proximity depends on mobilization intensity (Rafail et al., 2019). These authors identify a saturation effect, heightened mobilization results in media attention up to the point of saturation when there is no longer room for additional protest events in the news.
In recent years, the development of electronic sources and NLP tools facilitated the use of multiple sources (Jenkins & Maher, 2016). Some are critical that building from more sources will improve the quality of the data (Ortiz et al., 2005), however we believe that it solves some problems associated with newspaper selection bias. A multisource approach allows to (a) increase the proximity between media and protest when working on multiple countries; (b) avoid news saturation when protest is widespread across countries; and (c) include media that pursue different political interests. Yet this requires to be aware of conflicting bias across sources (Earl et al., 2004) and to develop methods to identify duplicate events to avoid counting single events multiple times and, therefore, contributing to a misrepresentation of protest waves.
In fact, problems associated with duplicate identification of single events plague PEA methods that build on automated tools (Schrodt, 2012; Wang et al., 2016). These new tools offer the possibility to monitor protest events (and conflict) over large periods of time and space. However, they fall short of some of their promises when it comes to providing reliable and valid data about protest (and conflict) in real time. Studies show that these tools tend to decontextualize events (focusing on single sentences in a text document). Thus, they fail to recognize whether, when, and where the event took place. Wang et al. (2016), working on a selected subset of events from GDELT, find that only one in two events included reports about a real-life protest event. In addition, they find that ICEWS is stronger to identify protest events but still features about 20% of duplicate events. In addition, these new tools suffer from a lack of transparency about their built-in components. It is difficult for researchers to evaluate the procedures used to select events and therefore to assess potential biases.
In the light of these debates about PEA, we ask how social scientists can build on electronic news databases and computational tools to create reliable multisource PEA data that cover large numbers of countries over long periods of time. Following Zhang and Pan (2019), we provide detailed information about the procedure that we develop so it can be used by others to expand our semiautomated approach for PEA. In addition, we develop a set of tests to evaluate and discuss potential biases in our data that inform researchers who will work with this data and more generally those who use PEA.
Developing a Multistep, Semiautomated Approach for PEA
Our goal is to introduce a procedure that allows to retrieve information about protest across multiple sources and to study protest events that take place across multiple countries, in our case 30, over a long period of time, 16 years. In order to do that, we derive protest events from news agencies that publish in English and we develop a multistep approach building on NLP tools to move from the five million document retrieved in the electronic news archive to a manageable amount of documents to implement manual coding. Table 1 summarizes our approach, which consists of a series of selection steps to reduce the number of documents to be coded manually, reducing it to less than 1% of the total amount of documents first identified. This table highlights the dramatic decrease in the number of documents when moving from the universe of news reports identified through keyword searching in multiple sources to the universe of documents containing only those documents most likely to report about protest events. In spite of this drastic reduction, the manual coding required, in total, 642 working days for a single person. We had a team of 35 graduate students to perform the task over a period of 6 months. This already highlights one of the major challenges for a multisource approach, the sheer amount of data to process. Following Nardulli et al. (2015), we argue that the use of NLP tools allows to reduce the quantity of documents that human coders need to process while maintaining the standards of manual coding to build the final data set.
NPL Pipeline for the Selection of Documents and Sampling for Manual Coding of Protest Events.
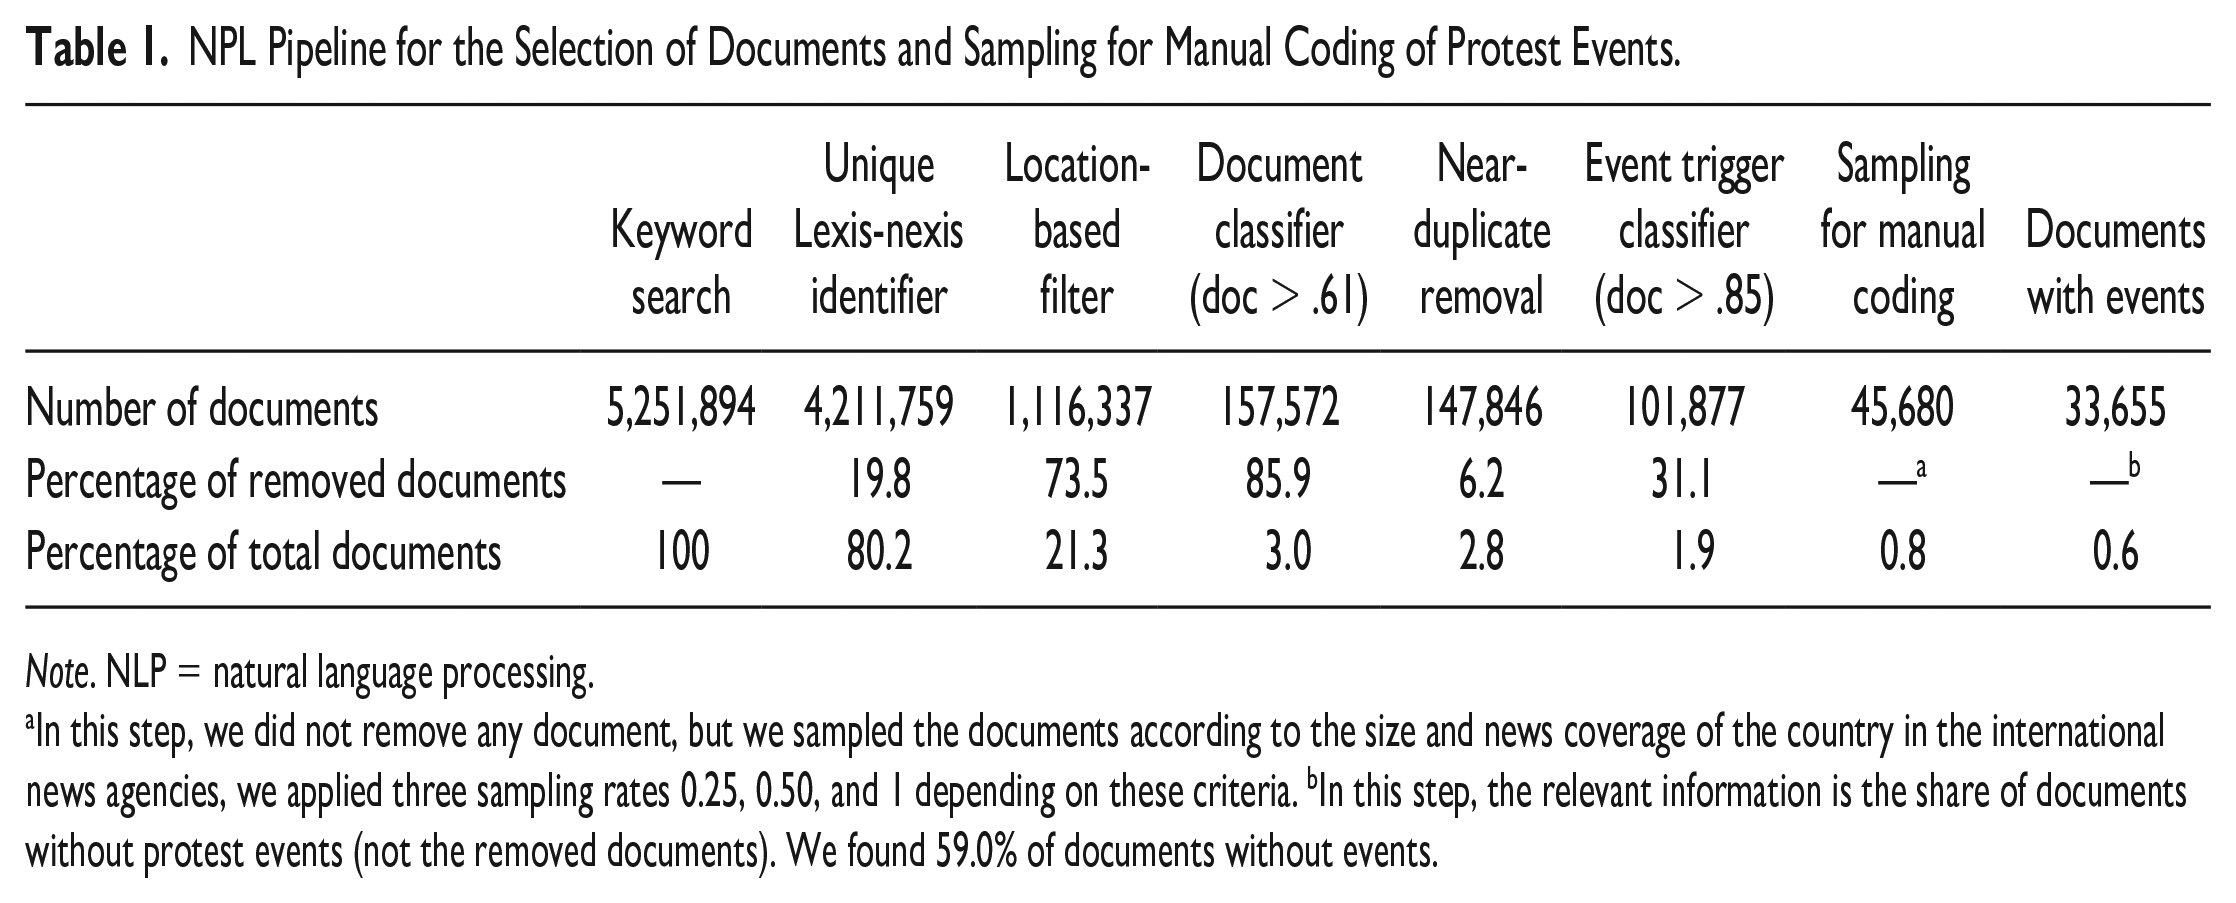
Note. NLP = natural language processing.
In this step, we did not remove any document, but we sampled the documents according to the size and news coverage of the country in the international news agencies, we applied three sampling rates 0.25, 0.50, and 1 depending on these criteria. bIn this step, the relevant information is the share of documents without protest events (not the removed documents). We found 59.0% of documents without events.
Semiautomated Selection of Protest Events: An NLP Approach
The first step consists in the extraction of relevant news reports. We obtain news reports from the LexisNexis data service. 1 We use 10 English-language newswire agencies 2 and retrieve news reports published in the 16-year period from 2000 to 2015. We aim at including as many news agencies as possible in order to cover as precisely as possible the different regions and countries included in our study. In this way, we follow the multisource approach to PEA (Jenkins & Maher, 2016). The search query comprises about 40 keywords that describe different protest actions. 3 We opt for a query that is little constrained: It retrieves as many relevant documents as possible, even at the expense of obtaining a large share of irrelevant documents that need to be filtered out in later stages. This search returns an initial set of 5.2 million news reports.
Among these 5.2 million documents, we end up with only about 2% of documents reporting about protest events. This number is comparable if not higher than what appears in other similar studies (Oliver, 2019). The first challenge is to identify and eliminate irrelevant documents. This is a big challenge both for automated procedures and for manual coding. For automated coding, the difficulty lies in the imbalance in the number of events compared with the number of nonevents, which makes it difficult to identify recurrent patterns that allow learning how protest events are presented. For manual coding, the large number of irrelevant documents forces human coders to read many documents containing no events in order to identify the few reported events. To go from such an amount of documents to a set of documents that can be coded manually with a reasonable deployment of resources, we performed the following steps 4 :
We removed duplicate documents.
We used a metadata filter to discard documents not associated with any of our countries of interest.
We implemented a supervised document classifier and a supervised protest mention classifier that jointly try to distinguish relevant documents from irrelevant ones.
Full duplicates make up 20% of all retrieved documents, and they can be quickly removed based on document identifiers. However, we also face the problem of very similar reports that only differ in the wording of one or two sentences. A large part of these near-duplicates is due to news agencies rewriting the same news story over the course of the day as events unfold. Furthermore, news agencies sometimes share news among themselves. To remove near-duplicates, we compare all documents with the SpotSigs algorithm (Theobald et al., 2008). SpotSigs detects near-duplicates in two steps. First, anchor words—in our case, the search terms from the document retrieval—are combined with short chains of adjacent content terms in order to create robust document signatures. Second, documents are matched on the basis of a (multi)set Jaccard similarity between the document signatures. 5 We identify groups of news reports with a Jaccard similarity of 0.75 or higher and keep only one report of each group in our corpus. 6 Our corpus contains about 6% of such near-duplicate documents. However, these two steps by no means solve the duplicates problem. It is still possible that the same or different news agencies report on the same event in very differently worded documents at different points in time. Thus, prominent events are reported on in different contexts— for example, when they occur and when their consequences are debated in courts or in parliament or when the government reacts to them or when they are commemorated on later occasions.
In addition to the problem of duplicates, location also poses a problem. News reports can be irrelevant in terms of the geographic scope of our analysis. The question whether a story is relevant for any of our 30 countries is straightforward to answer, since virtually all news reports in our corpus come with metadata that also includes a list of countries associated with the contents of the report. We filter out documents that do not feature any of our countries of interest. For countries for which we already have a high retrieval rate (e.g., the United Kingdom, France, and Germany), we additionally discard documents in which this country is not among the top-ranked and in which no other of our 30 countries was found. Thus, we aim at up-weighting the share of sampled documents for countries where only few news reports are available 7 .
This location-based filtering is the most important step in reducing the number of irrelevant documents, it removes all the documents drawn from countries outside Europe 8 with about three quarters of documents removed (73.5%). The lion’s share of the reduction is due to the removal of documents that do not feature any of our 30 countries of interest. Only 3.5% of documents are discarded because of the up-weighting procedure. Nevertheless, the up-weighting has the intended effect, since it slightly increases the share of documents from smaller countries.
Next, we apply a combination of a document classifier and an event-trigger classifier to further eliminate irrelevant documents. 9 The document classifier is trained on a set of 7,500 documents, which have been manually classified into relevant (i.e., mentioning recent protest events in Europe) and irrelevant ones. We cannot go into the full details of this classification model here. Suffice it to say that the model follows a classic bag-of-words approach—which means that we consider all the words in the document irrespective of sentence structures and grammatical rules—and includes a number of steps that have empirically been shown to produce the most informative bag-of words representations (Sebastiani, 2002). The classification model correctly identifies 94% of all the irrelevant documents. As this amounts to hundreds of thousands of documents due to class imbalance, the model is a major part of our filtering procedure.
We combine this model with a more fine-grained approach, an event-trigger classifier that allows us to further improve the identification of relevant documents. Thus, the bag-of-words assumption of the document classification model does not adequately address the diverse wording of protest events. Consider the two sentences, “workers go on strike” and “strike a goal,” when taking into account all the words in a document irrespective of sentence structures (that is the bag of word approach), we are not able to capture these nuances. We therefore fit another classification model for the identification of event mentions in the text. As training data, we use 518 documents that political scientists annotated at the word level for protest event mentions. We instructed political scientists to mark word spans which, according to their judgment, most directly denote protest events. This means that we identify not only single words that refer to protest but also specific combinations of words commonly used to refer to protest events; for instance—word spans such as “take to the streets,” “violent demonstration,” “signed a petition,” and “carried banners.” With this model, we aim to reduce the automated identification of protest-relevant documents to the problem of predicting whether some span of words refers to a protest event. In the NLP community, a word like “threw” in “threw stones” is sometimes called an event trigger (ACE, 2005). The model eventually predicts, for a common noun (like “demonstrations”) or verb (like “threw”), whether it syntactically governs a likely protest event phrase (like “threw stones”). Again, we cannot go into the details of the approach here either. Suffice it to note that it is easy to use this model for the identification of protest-relevant documents: if the classification model finds no event trigger in a document, then this document gets filtered out. As the model associates probability estimates with all the triggers that it identifies in a document, we take the highest probability that the model assigns to one of the triggers as its estimate of the relevance of that document.
To fine tune the two models, we experimented with the combination (ensemble) of the two. For this purpose, we used a set of about 14,000 documents, which the document classification model identified as relevant and then checked manually. Eventually, we define a document as relevant if both classification models find it relevant, otherwise the document is declared irrelevant. We tune the combination such that it achieves a higher precision and recall on this data set than the document classification model alone. We keep this setting for the final filtering of documents for manual annotation. The document classification model filters out 86% of input documents, and the event trigger classification model another 30% of the remaining documents. After applying the two classifiers, we are left with just above 100,000 documents classified automatically as relevant.
A manual test of the two classifiers on 1,000 documents shows that there are only very few relevant documents among those filtered out by the classifier models, and this applies for different countries and action forms. In other words, the share of false negatives is consistently low in all tested circumstances (2.8% on average). The event trigger model has been shown to work better for some countries (like Hungary or the United Kingdom) than for others (Spain). Moreover, the inverse problem of false positives still looms large. Although the share of irrelevant documents drops very rapidly beyond the selection threshold, it still remains sizable.
Manual Coding of Protest Events
In the manual coding, the goal is to retrieve information on all politically motivated, unconventional actions in the selected countries and time period. To this end, we employ a simplified version of the PEA approach established by Kriesi et al. (1995) and further elaborated by Hutter (2014, 2014a). Since the corpus of relevant documents proved to be too large to manage for manual coding, we had to further reduce it by a random sampling procedure. Thus, for countries for which we selected a large sample of documents, we decided to manually code only 25% of the documents, 10 for countries with an average number of documents, we sampled 50% of all the documents for manual coding, 11 and for very small countries with only a few hundred news reports, all the reports did go to manual coding. 12
The first step of the manual coding procedure consists in the identification of relevant events. For the identification of relevant events, our human coders did not rely on a theoretical definition of relevant protest actions, which might be conceptually precise but practically very difficult to implement. Instead, coders identified relevant events based on a detailed list of unconventional or noninstitutionalized political action forms. We asked coders to select all mentions of protest actions listed in the description of Table 2 as relevant. The definition of events in news wire documents proved to be a rather difficult task. First of all, a news wire may contain a summary of different types of political events with the relevant protest event being mentioned inter alia and easy to be overlooked. Second, a relevant document may contain references to more than one protest event, often times it may refer to a series of events in the same location (in this case the same city), which may be difficult to separate from each other—for example, a demonstration and a violent clash with the police that involves a subgroup of the demonstrators, a barricade, and a street theatre. The news wire may also report on different contemporaneous events in different cities in the same country—for example, demonstrations in the capital, but also in several minor centers across the country. Although we established clear rules how to deal with such situations, it proved to be difficult to apply them in practice. Third, one and the same protest event may be referred to several times in the document, but it may not always be easy to detect that it is actually the same event that is referred to. Fourth, a given event may be reported in passing in a news wire which focuses on another event in a different country.
Action Form and Issue Categories Used in the Manual Coding.
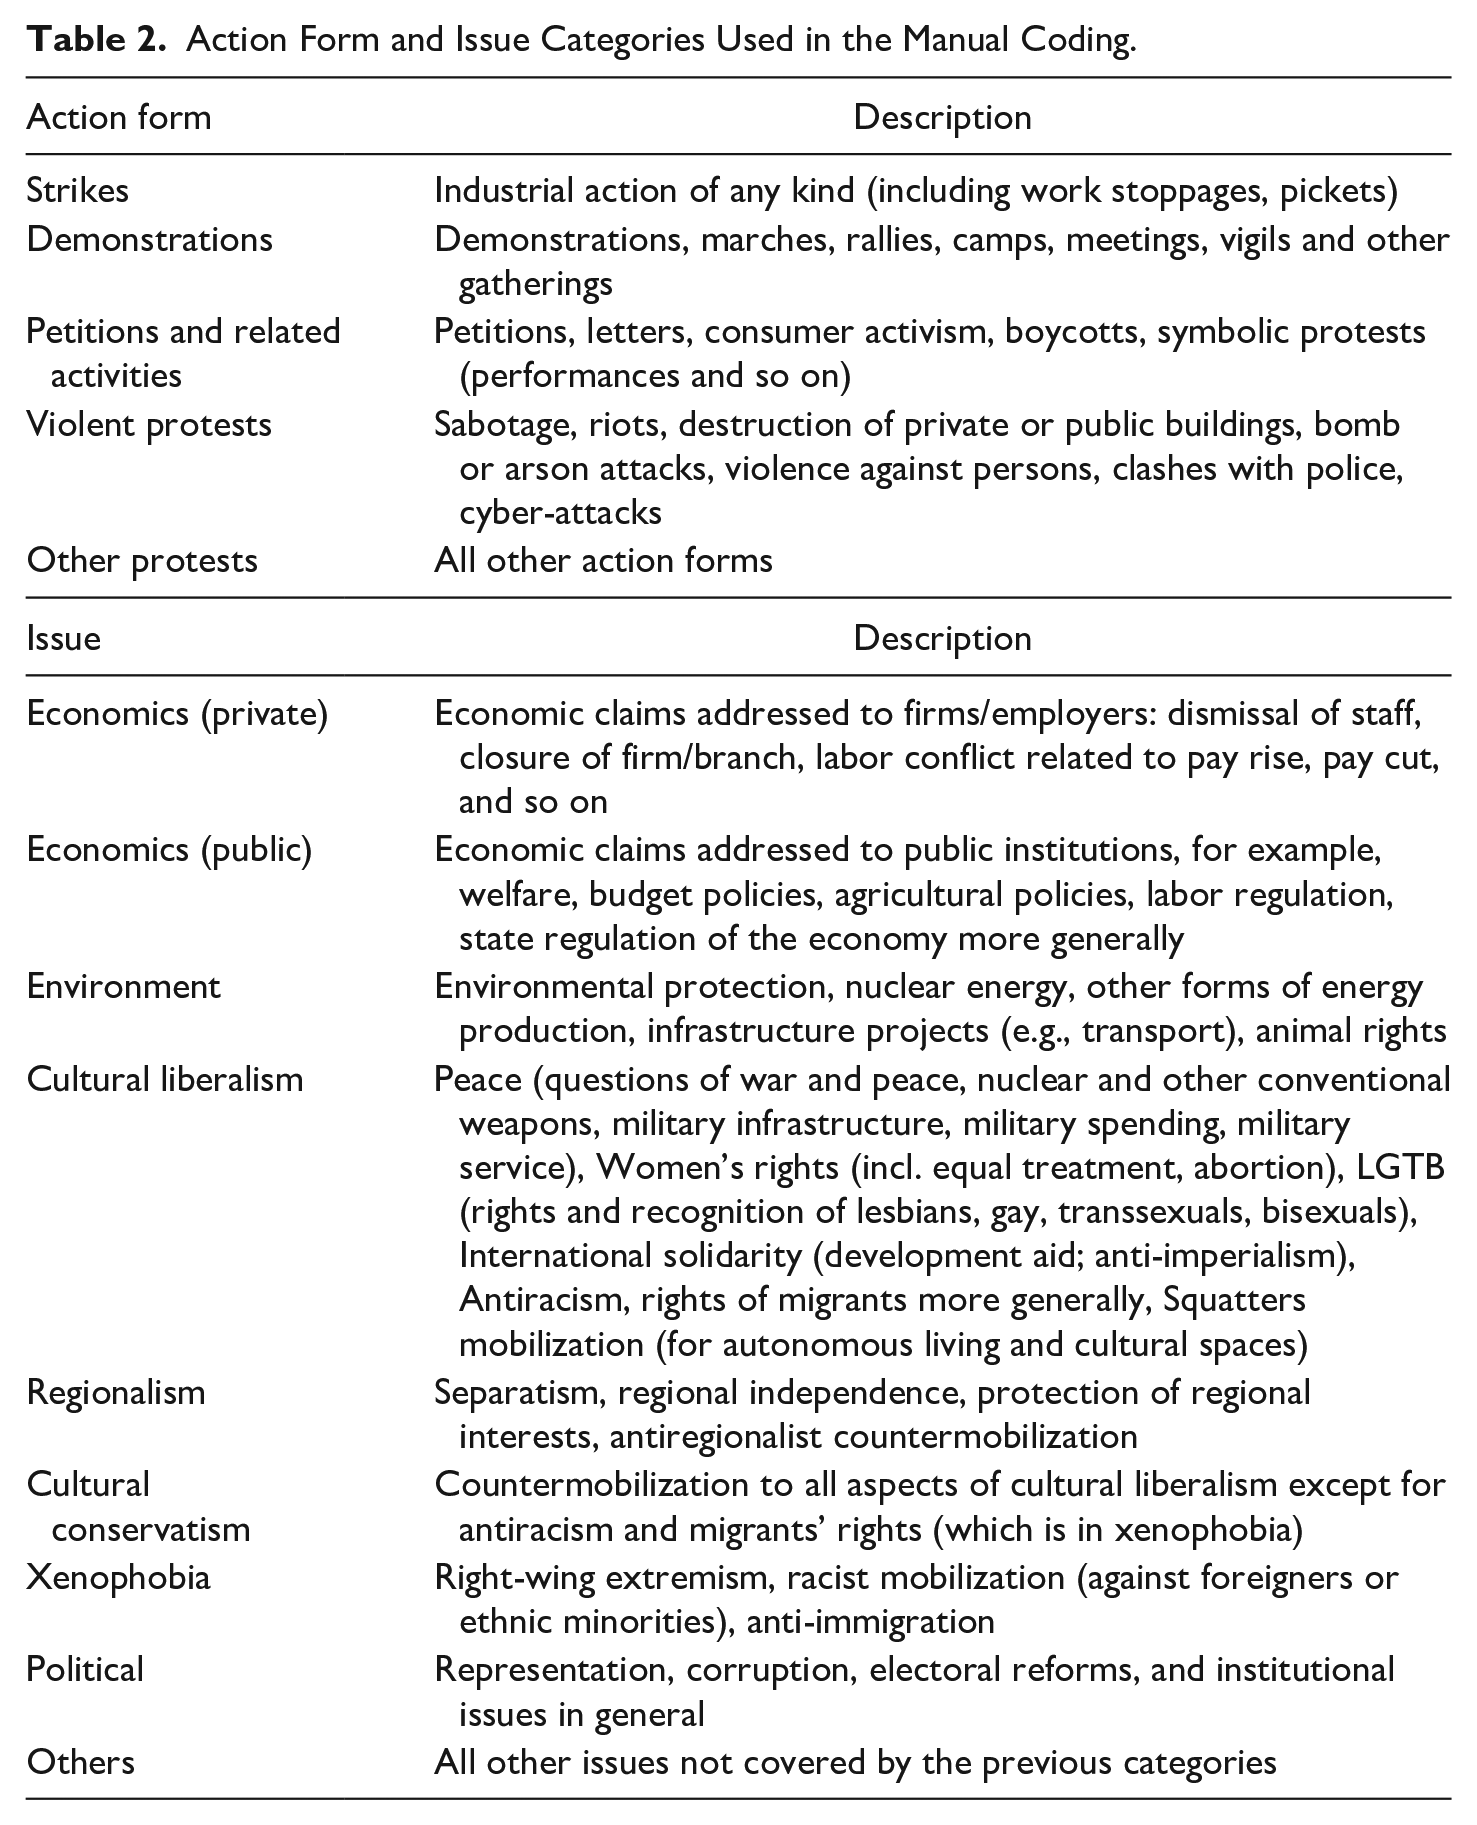
Our definition of an event is that it is unique in terms of the combination of the action form, its timing, and its location at the city level. Hence, two descriptions of protest events in a document are equal if they happen on the same day, in the same city, and with the same action form. If one or more of these key elements of protest events differ, coders were expected to code multiple events.
In spite of all efforts to filter out irrelevant documents, we ended up in the manual coding phase with 59.0% of irrelevant documents. 26.3% of the documents were false positives that did not contain any events at all. In other words, only 33,655 of the 45,680 documents sampled included some information on events (see last column in Table 1). In addition, however, another 32.6% of documents contained only information on events that were already reported in other documents. Most of these documents containing duplicates of events only were identified by the manual coders as they went through the selected documents (27.3%), but a substantial share (5.3%) also consist of duplicates from documents containing only events that were already coded by different coders from other documents. This confirms that even the most sophisticated (semi)automated selection procedure is not able to eliminate the problem of events’ duplicates in a fully satisfactory manner. This points to the need for further work on automated filtering.
Once the human coders separated single events from each other, they coded the following limited number of variables for every event: the date of the event, the location of the event (if possible indicated at the level of communities), the action form, the issue addressed by the protest, the actors participating in or organizing the protest event as well as the number of participants (see Table 2, for the list of issue categories). We made a test of the quality of this manual coding with intercoder agreement scores collected right before and during the coding. More precisely, 14 coders received the same 65 documents at different times during their coding. We measure the level of agreement for both the identification of events and for the coding of the event attributes. We focus on the most important attributes, which are the actors, issues, and number of participants. For the identification of the events, we assess whether two coders agree on the date, country, and action form triples of every event they identify in the same document. Since this is an open-ended identification task—theoretically, there is an infinite number of possible date-country-action combinations, we report the unweighted F1 score that indicates the ratio of matched events to the sum of matched and nonmatched events. The averaged F1-score over all possible pairs of the 14 coders is 0.60 with a standard deviation of 0.06. The rather low F1-score reflects the difficulty of the task for the coders to identify an event.
As for the event attributes, we first aggregate the matches and nonmatches for the different attributes of each event which a pair of coders jointly identify in the same document. Second, we report Cohen’s Kappa on the aggregated number of agreements. For each attribute, there is a fixed number of classes, which implies that our measure of agreement needs to be chance corrected. The average of Cohen’s Kappa is 0.57 (standard deviation of 0.13) for the actors, 0.53 (0.13) for the issues, and 0.45 (0.06) for the number of participants. It has been highlighted that the guidelines for the interpretation of Cohen’s Kappa values are oftentimes misleading (Gwet, 2014). However, values from 0.40 to 0.60 are usually defined as fair to good. It may be surprising that these values are not better, given the limited number of variables to be coded and the low number of categories we used in our codebook. But this shows that the task of coding protest events from news wire sources is difficult, even for human coders, let alone for machines.
External Validation of the Data
As already discussed, it is well known that protest event data is subject to selection bias (Amenta et al., 2017; Earl et al., 2004; Ortiz et al., 2005; Weidmann, 2016). The fact that our sources are news agencies that publish in English leads to specific potential biases. Some of these biases are related to event characteristics. Thus, violent events, events organized by established political forces or events that coincide with important policy decisions carry more news value and are reported more often by news sources in general (Amenta et al., 2009; Oliver & Maney, 2000). Other biases are linked to the organization of the news agencies themselves (Andrews & Caren, 2010) and to the presence of news agency in a country (Wu, 2000). Hence, we first assess the presence of the 10 news agencies that we used as sources for our research in the 30 countries included in our study. Table 3 shows that together the 10 news agencies have offices in all the countries except Cyprus and Luxembourg. In most countries, there are more than one news agency operating (this is the case in 22 of our 30 countries) and in the largest countries, such as France, Germany, and Italy, news agencies are located in more than one city. This shows that our multisource approach offers a sound coverage of most, if not all, of the countries that we study.
Location of News Agencies in the 30 Countries.
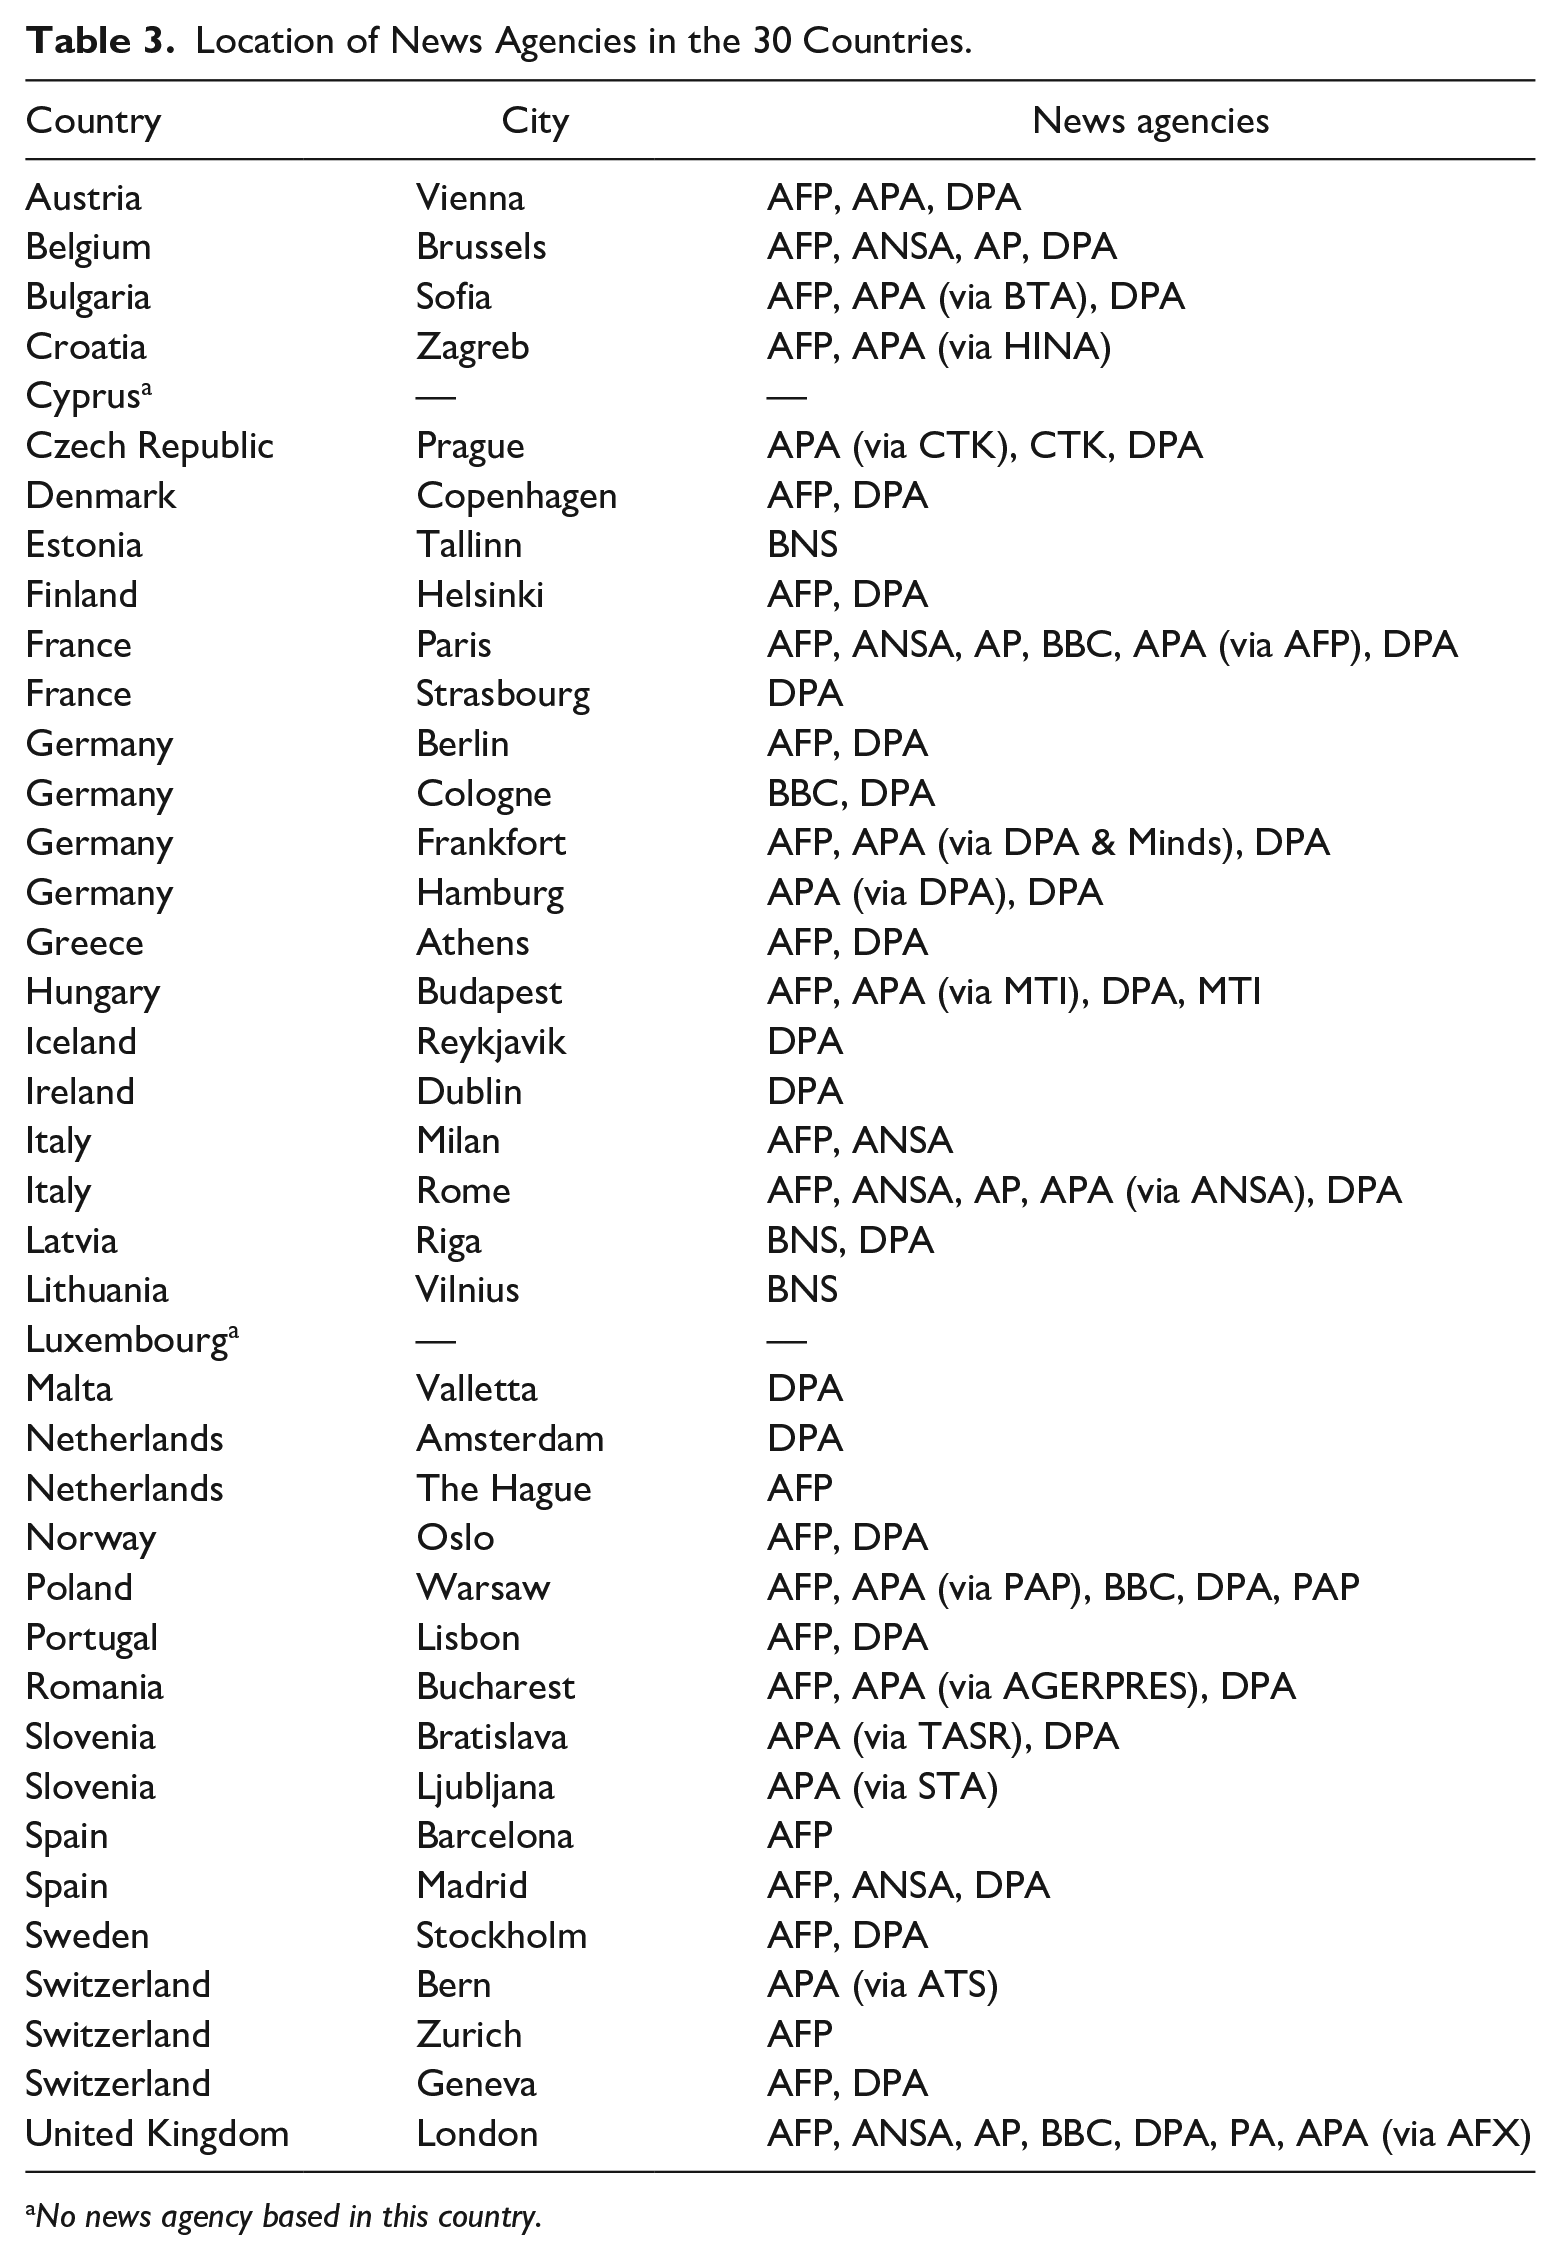
No news agency based in this country.
In addition, to externally validate the quality of our data, we compare it with two other types of data sets on protest events. First, we compare our data with the data from the ICEWS (Boschee et al., 2015). The ICEWS event data “contain about 30 million ‘stories’ that are parsed and coded using NLP techniques based on word graphs using a specially developed ontology based on CAMEO” (Ward et al. 2013, pp. 1-10). The data come from a large number of media sources that span international, regional, national, and local sources. Compared with our semiautomated approach, the event detection is performed fully automatically. The news wires are processed by the commercial software BBN ACCENT, which applies a range of natural language tasks and dictionary lookups for the automated recognition of events. Among other types of events, ICEWS event data also include information on demonstrations for all the 30 countries and almost all years (all the years from 2001 up to and including 2014) covered by our study. For the specific action form of demonstrations, the comparison with ICEWS data should allow us to show to what extent our own data differ from or improve on a data set created by fully automated procedures.
Second, we compare our semiautomated data set with different data sets based on the manual coding of national newspaper articles and news reports for a sub-set of Northwestern, Eastern, and Southern European countries. These data sets have been collected by different teams of researchers and therefore cover different periods of time. 13 They allow us to confront the number and types of events that we find in the newswires published in English to the events found in the national press. This allows us to estimate potential biases related to the relative sparsity of our data. This comparison can establish which kinds of events make it into the international press, and which events are systematically excluded.
Comparison With the ICEWS Data
The most important question is whether the overall level of demonstrations and the dynamics of the time-series provided by our data are similar to the corresponding levels and dynamics provided by ICEWS. Figure 1 allows a comparison of the levels and trends in the two time-series over all countries. The graph on the left shows the monthly aggregated numbers of protests, the one on the right the 5-monthly moving averages. First, it is clear that the level of the ICEWS time-series is far higher than that of our data. As it turns out (not shown here), the monthly discrepancies between the two series do not follow a systematic pattern but their development is rather stationary. This implies that the discrepancies between the two data sets are independent from a specific time period and thus specific events. The discrepancies are most likely the result of overreporting of demonstrations in the ICEWS data. This can be shown by a detailed qualitative analysis of the largest country-specific monthly differences (Wueest & Lorenzini, 2020). Thus, the ICEWS data contains events that would have been classified into other action form categories by our human coders (e.g., violent demonstrations) or not considered as protest event at all (e.g., police violence). Finally, it is also very likely that the ICEWS data contains many duplicates of events, just as our data set did before we cleaned it manually.
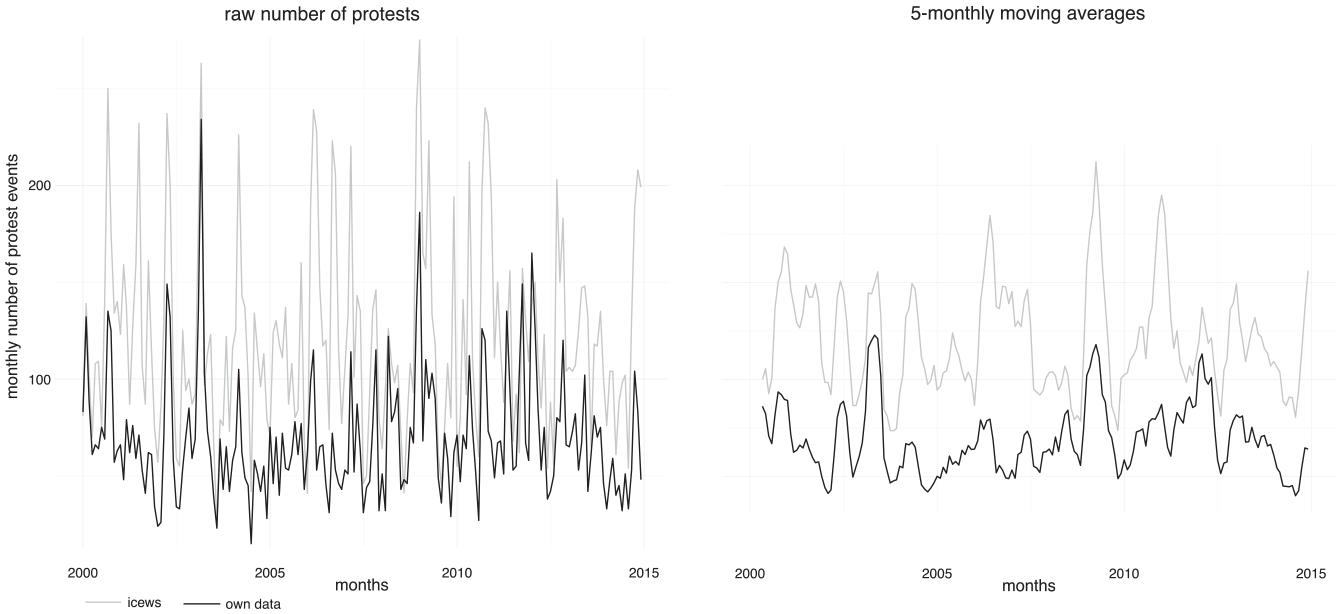
Monthly number of protests (left) and 5-monthly moving averages (right) for ICEWS and our own protest data.
Second, with regard to the development over time, the ICEWS data has many peaks, while our data only shows three substantial ones: the Iraq war demonstrations in 2003, the protests following the meltdown of the global financial system in 2008, and the protests during the Eurozone crisis in the years after 2010. This may be a result of the greater number and range of sources used by ICEWS. Third, the comparison of the raw numbers on the left and the 5-monthly moving averages on the right shows that for descriptive and visual analyses, the smoothed data provide a better idea of what is going on.
The discrepancies between the two types of data vary a lot from one country to the other. Figure 2 shows the distribution of correlation coefficients for the time series related to the number of protests across our 30 countries for different levels of aggregation and varying degrees of smoothing. On average, we get a closer congruence of the two data sets for both a higher level of aggregation and a higher degree of smoothing. If we compare quarterly time series instead of monthly series, the median for the correlation coefficients increases from 0.51 to 0.58. If we additionally increase the degree of smoothing, the median correlation coefficient increases to the maximum of 0.66 for the time series with 10-quarterly moving averages. By increasing the degree of smoothing and level of aggregation, we can thus assume that some of the coding and selection errors are straightened out and the data sets become more comparable. However, while the average congruence increases, so does the spread among the countries. The comparison of the time series with the 10-quarterly moving averages is the most extreme. While the two data sets correlate with an impressive 0.98 for Greece, the correlation is clearly negative for Finland (−0.25). Hence, we face a trade-off between the average level and the variation of the two data. Testing different combinations of smoothing and aggregation, we conclude that the comparison of the monthly aggregated time series that are smoothed by a 5-monthly average offers the best solution to this trade-off. The correlation for Finland still is virtually nonexistent (0.06), but besides this singular odd result, no other country has a lower correlation coefficient than 0.20.
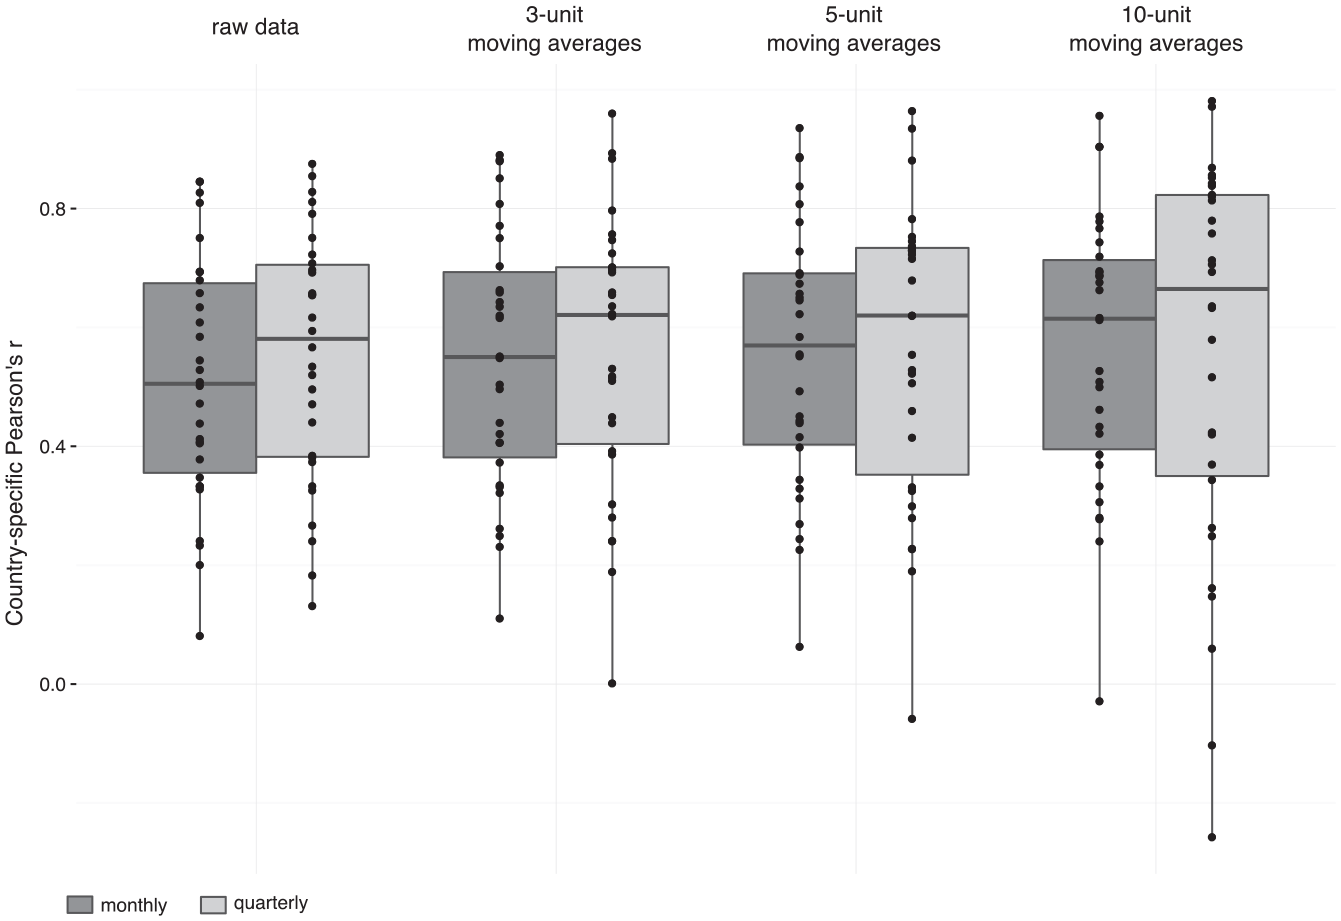
Country-specific correlations between ICEWS and our own data for different levels of aggregation (monthly, quarterly) and different types of moving averages (3, 5, or 10).
More detailed analyses (Wueest & Lorenzini, 2020) show that the size of the differences depends on the region. Differences are higher for Northwestern and Southern Europe than for Central- and Eastern Europe. This can be explained by the fact that the newer democracies in Central and Eastern Europe are less well covered by international news agencies. In consequence, the selection bias in the sources of both data sets is smaller. Furthermore, the size of the country is positively correlated with the discrepancies between the two data sets. Given that international news agencies are more present in larger countries, the number of protest events reported in both data sets is larger which also implies potentially larger discrepancies. The sampling probabilities which we applied for our manual coding for reasons of feasibility are likely to have induced some bias into the data generation, too, which is why we weight for sampling probabilities in the analyses of our data. Finally, we do not find any systematic discrepancies between specific news agencies or years covered for the two data sets.
Comparison With Data Based on National News Sources
For the comparison with national news sources, we rely on detailed data mainly for three countries—one in each region: Hungary, Spain, and Germany. These data have been graciously provided by other researchers. For Hungary, we rely on data from (Ondřej & Vráblíková, 2019), 14 from Martín (2020) for Spain, and from Hutter (2014b) for Germany. The Hungarian data comes from the national news agency, while the Spanish and German data come from the national press. Table 4 and 5 present a comparison of our data with the data from the national sources with respect to three criteria that are particularly critical for the question of bias: action form, location, and size of the protest events. Overall, the discrepancies we find with regard to these three criteria are largely related to the way news wires operate and to the specific criteria of newsworthiness they apply. In other words, they are related to the source we use, which, as already pointed out, displays some well-known biases.
Forms of Action by News Source for the Three Countries (Percentages).
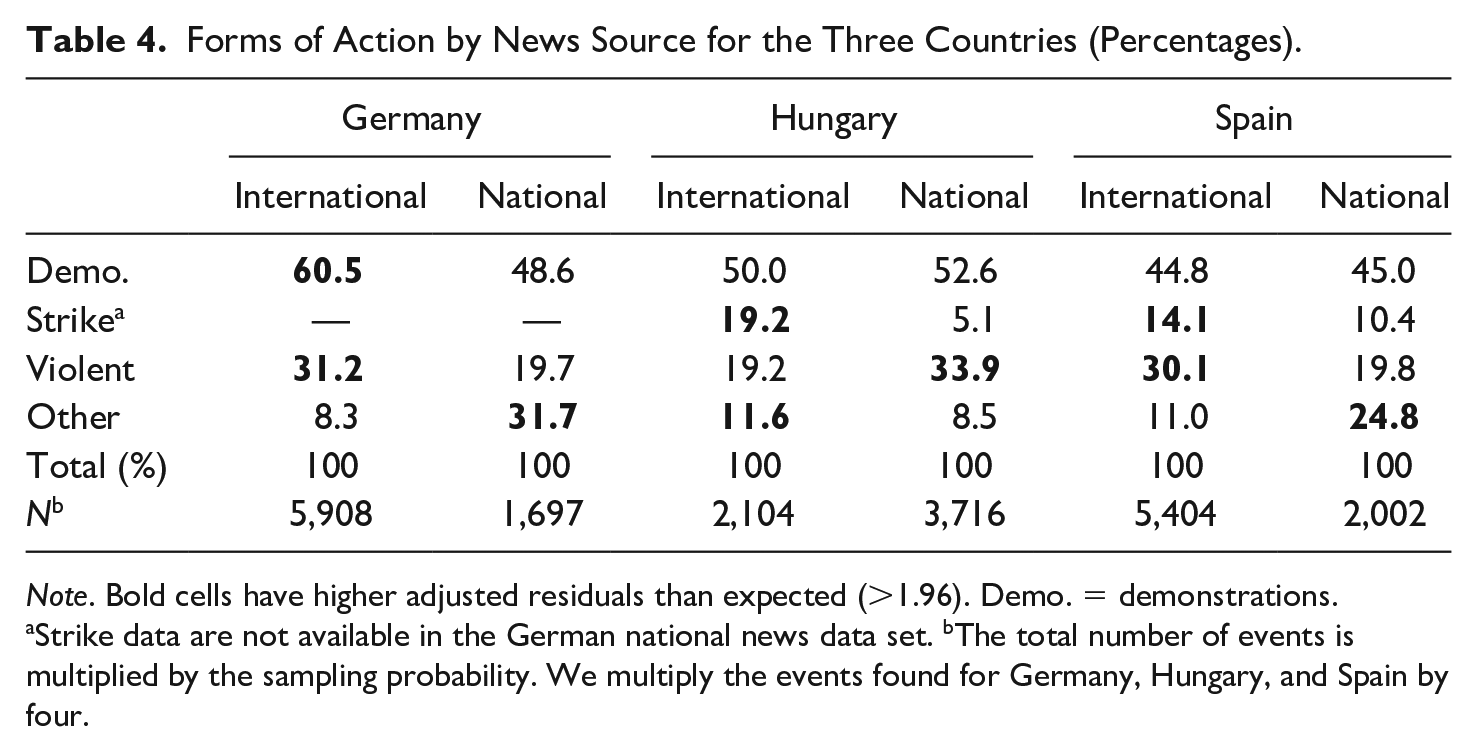
Note. Bold cells have higher adjusted residuals than expected (>1.96). Demo. = demonstrations.
Strike data are not available in the German national news data set. bThe total number of events is multiplied by the sampling probability. We multiply the events found for Germany, Hungary, and Spain by four.
Location and Size by News Source for the Three Countries (Percentages).
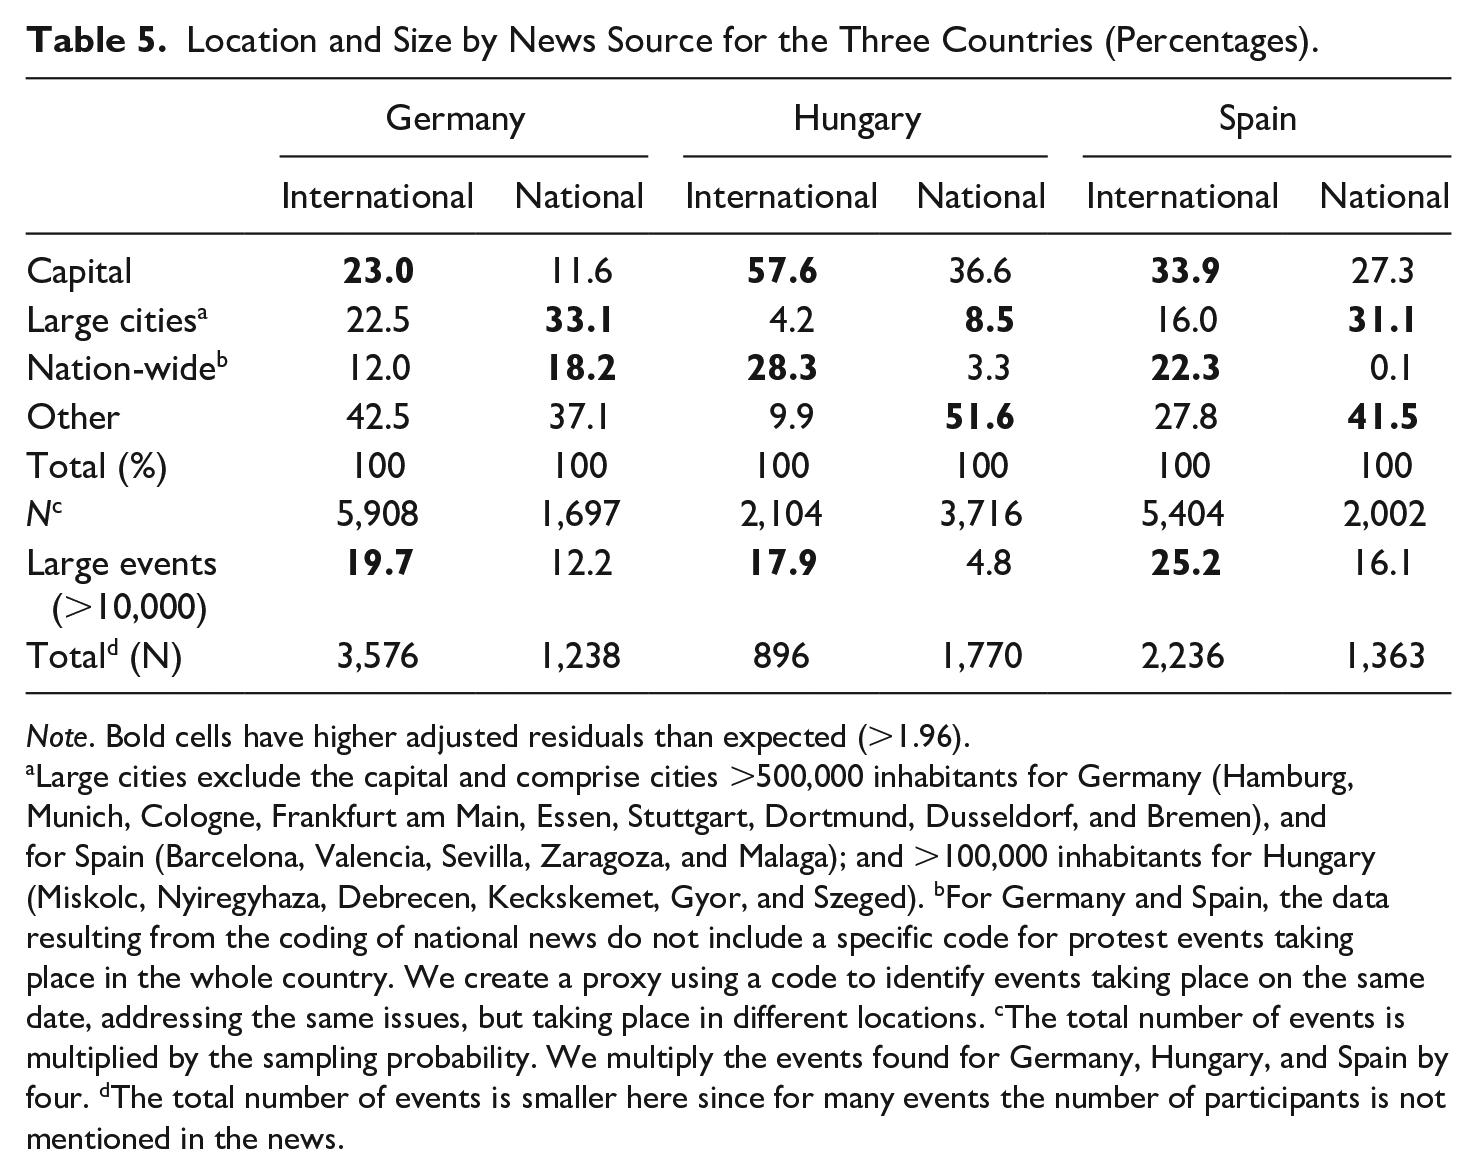
Note. Bold cells have higher adjusted residuals than expected (>1.96).
Large cities exclude the capital and comprise cities >500,000 inhabitants for Germany (Hamburg, Munich, Cologne, Frankfurt am Main, Essen, Stuttgart, Dortmund, Dusseldorf, and Bremen), and for Spain (Barcelona, Valencia, Sevilla, Zaragoza, and Malaga); and >100,000 inhabitants for Hungary (Miskolc, Nyiregyhaza, Debrecen, Keckskemet, Gyor, and Szeged). bFor Germany and Spain, the data resulting from the coding of national news do not include a specific code for protest events taking place in the whole country. We create a proxy using a code to identify events taking place on the same date, addressing the same issues, but taking place in different locations. cThe total number of events is multiplied by the sampling probability. We multiply the events found for Germany, Hungary, and Spain by four. dThe total number of events is smaller here since for many events the number of participants is not mentioned in the news.
First, with respect to action forms, we find that demonstrations represent about half of the events, irrespective of the source—the German data are not comparable in this respect, because they do not include any strikes. For Hungary and Spain, international sources report a larger share of strikes than the national ones. Regarding violent action, we observe differences between national and international sources but these vary across countries. While in Hungary, the national sources report more violent events, in Spain they include fewer. The country-specific differences with regard to the reporting on violence are related to the fact that violence in Hungary often occurs in rural regions, which is missed by international news agencies, while in Spain, violence is mostly committed by ETA, an organization that is very much attended to by international news wires. Table 4 also shows that other forms of action represent a smaller share of all actions reported for Spain in the international news (11.0% compared with 24.8% in the national news). Similarly, in Germany, international news include fewer “other action forms” because it is very difficult to capture the unconventional forms of protest which are lumped together in the residual category. For example, action forms such as environmental activists sitting in trees in order to prevent them from being cut, or environmentalists intercepting whaling ships with rubber boats are very difficult to capture systematically.
The comparison with regard to location presented in Table 5 reveals that international news sources overreport protest taking place in the capital of each one of the three countries, and in the country as a whole in two out of the three cases (in Hungary and Spain, but not in Germany). This is again a result of the way international news wires operate: they pay greater attention to the events in a country’s capital, and often report in a summary fashion on events taking place simultaneously in different locations in the same country. The German data are again not entirely comparable with respect to the summary category “country as a whole,” which explains why we do not find a corresponding discrepancy in this case. Third, the residual category, other locations, appears more frequently in the data drawn from national than international sources. This is the case in Hungary and in Spain. Last, news wires are also selective with regard to the size of protest events as measured by the number of participants: they clearly focus on large events, while smaller events tend to escape them. This is particularly true of a small country like Hungary without an English-language newswire of its own, but less so for larger countries. Thus, we find the same effect, but to a reduced extent for Germany, but not for Spain, where our news agencies seem to have been rather representative with regard to the size of the events.
Table 6 reports the explanatory power of different sets of predictors that account for the news worthiness of specific protest events. We run a logistic regression on protest events reported in the international news to identify the sets of predictors that account for the reporting of protest in the international news in comparison with national news. We introduce our sets of predictors following a stepwise approach, the predictors include the three features of protest events discussed above (location, size, and action form), as well as the year of the protest event, the issue addressed, and the actors participating in the event. We run the logistic regression separately for six countries that is the three countries already discussed above (Germany, Hungary, and Spain) and three additional ones (Poland, the Netherlands, and the United Kingdom).
Explanatory Power of Differents Sets of Predictors Across Countries (Pseudo R2 for Logistic Regressions).
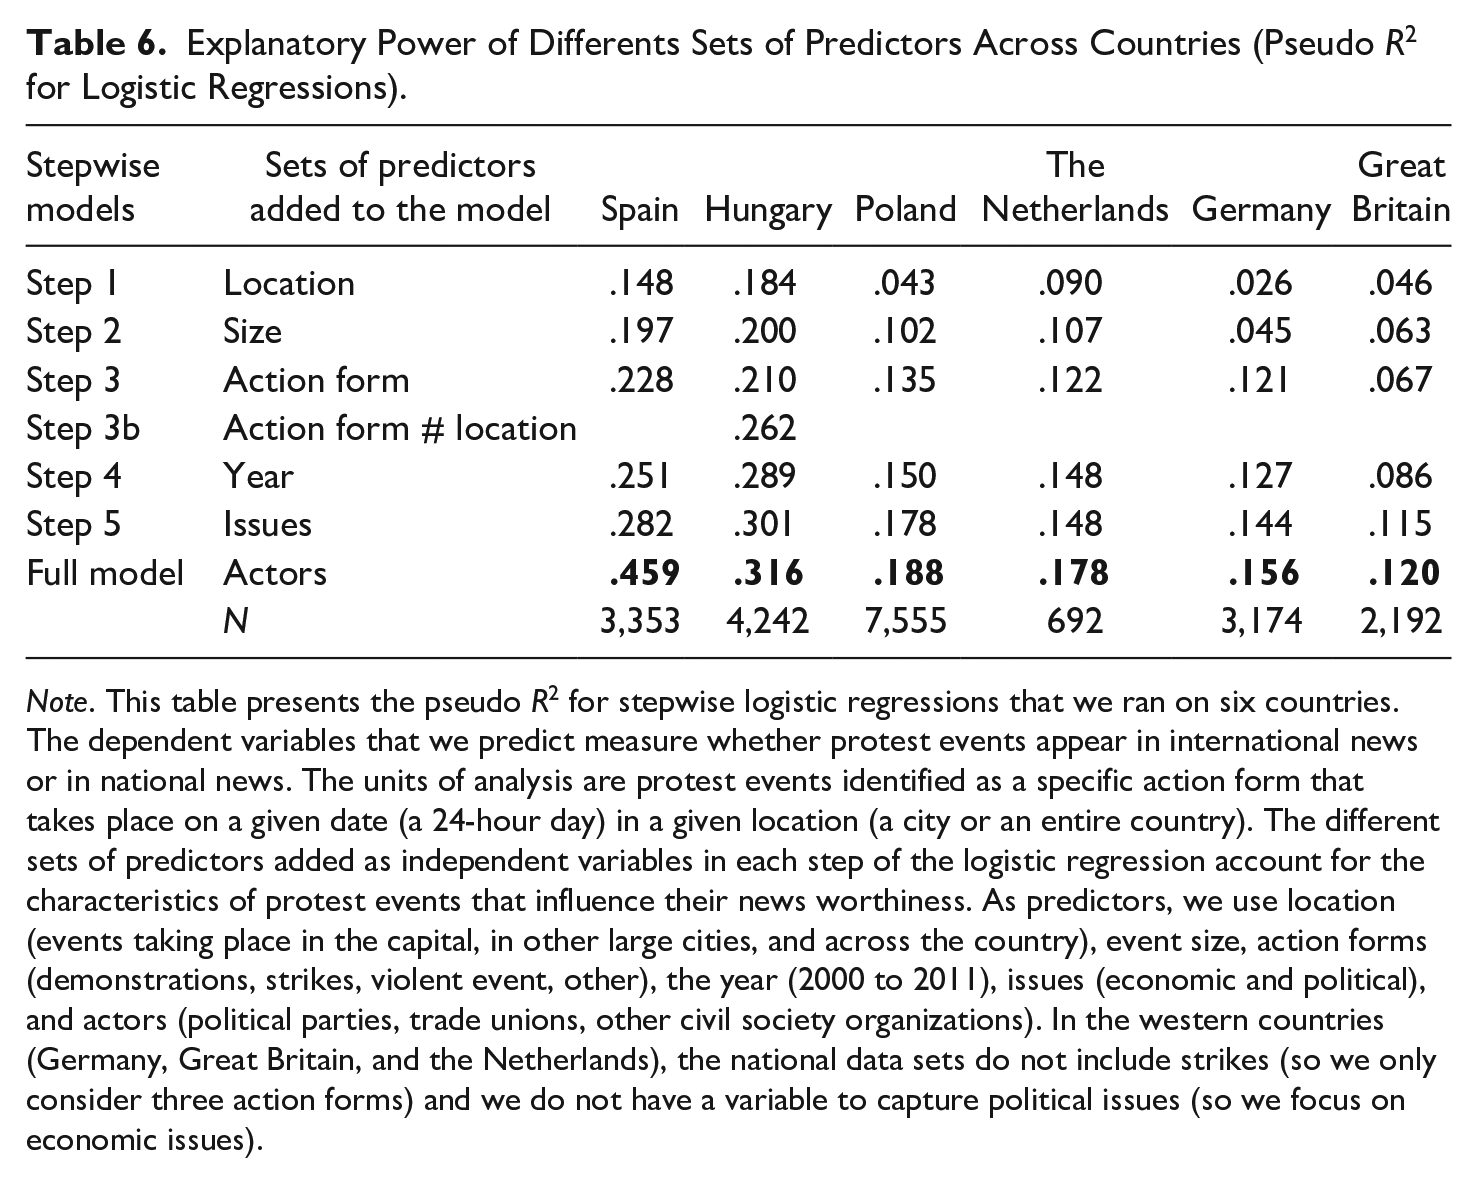
Note. This table presents the pseudo R2 for stepwise logistic regressions that we ran on six countries. The dependent variables that we predict measure whether protest events appear in international news or in national news. The units of analysis are protest events identified as a specific action form that takes place on a given date (a 24-hour day) in a given location (a city or an entire country). The different sets of predictors added as independent variables in each step of the logistic regression account for the characteristics of protest events that influence their news worthiness. As predictors, we use location (events taking place in the capital, in other large cities, and across the country), event size, action forms (demonstrations, strikes, violent event, other), the year (2000 to 2011), issues (economic and political), and actors (political parties, trade unions, other civil society organizations). In the western countries (Germany, Great Britain, and the Netherlands), the national data sets do not include strikes (so we only consider three action forms) and we do not have a variable to capture political issues (so we focus on economic issues).
Looking first at the predictive power of the full model, the results show that the predictive power of the set of six predictors is largest for Hungary and Spain, two countries which do not have their own English-language news-wires; in Spain, we explain as much as 45.9% of the discrepancies and in Hungary 31.6%. By contrast, the explanatory power of the predictors is lowest for Germany (15.6%) and Great Britain (12.0%), two large countries with their own English-language news wires. In these cases, the discrepancy is more difficult to predict by our set of predictors, because it is less likely to hinge on the way international news wires operate, but depends on idiosyncrasies of the respective sources. Poland (with 18.8% explained) and the Netherlands (with 17.8% explained) fall in between the two types of countries: in these two countries, differences between protest events that appear in the international or in the national news also tend to be difficult to account for with our set of predictors of news worthiness.
Looking at specific sets of variables, we observe that in Spain and Hungary, the location of the events already carries a strong explanatory power (14.8% and 18.4%, respectively). This is exactly what we expected based on the way international news wires operate, focusing on events that take place in the capital, in large cities, or across the whole country. However, in the other four countries, the location of the events plays a more limited role in accounting for the reporting of the event in the international news (between 9% in the Netherlands and 2.6% in Germany). Adding the size of the events, further increases the predictive power by 4.9% in Spain and by 5.9% in Poland. By contrast, in Hungary, size alone adds little predictive power to the model. Yet when we include action forms, as well as the interaction between action forms and location, the model accounts for 26.1% of the variance between international and national news reporting. More generally, adding action forms to the model brings little in terms of its explanatory power (between 0.4% in Great Britain and 3.3% in Poland), the only exception being Germany where the action forms adds 7.6% to the explanatory power. In this large country, with more than one domestic news agency, the action form accounts for differences in reporting when comparing international with national news, while the location and size are less important.
The table reveals smaller variations across countries when we add predictors accounting for years, issues, and actors. The only exception for these three sets of predictors refers to the high predictive power of actors in Spain. In this case, adding political parties, trade unions, and other civil society organizations as predictors increases the predictive power of the model by 17.7%. This is related to two distinct features of the international press: (a) it pays more attention to events that are not organized by political parties, trade unions, and other civil society organizations (such as the indignados movement and related protest actions) than the national news; and (b) international news is less likely to account for the presence of these actors in the protest event. Overall, our comparison of international and national news sources shows that biases stemming from international news sources correspond to media attention biases—in particular, a focus on large protest events that take place in the capital or in the entire country.
Conclusion
We have described our procedure for identifying and coding protest events in 30 European countries during the period 2000-2015. We applied a hybrid procedure that combines the strengths of machines and humans in coding a broad set of political events. We relied on an extended NLP tool pipeline in order to identify relevant news documents prior to the manual coding of protest events from them. While we can be quite confident that the share of relevant documents filtered out by our selection procedure is very low (close to 5%), we should keep in mind that even low percentages of false negatives may still make for large absolute numbers, given that we have filtered out millions of documents which were originally selected based on the keywords. Our selection procedure was also not able to exclusively identify relevant documents, as it turned out that roughly a fourth (26.3%) of the documents selected did not contain any events. Moreover, roughly a third of the documents (32.6%) contained only duplicates of events that have been already reported in other documents.
In the manual coding phase, the task was two-fold: identify all the relevant events in a given document and then code a limited number of attributes. As our reliability tests indicate, both of these tasks proved to be difficult even for manual coders, but we achieved a reasonably good quality of coding.
The comparisons of our data set with a data set produced by fully automated procedures (the ICEWS data on demonstrations) and with data sets produced by manual selection and coding (selected data sets for several countries from the three regions) suggests that each type of data has its advantages and disadvantages. The ICEWS data provide many more demonstrations than our data set, but our detailed analysis suggests that this is, at least partly, due to overreporting on the part of ICEWS. The dynamics over time are quite similar for some countries (e.g., Greece), but very different for others (e.g., Finland). We have uncovered some of the factors responsible for the discrepancies, but in the final analysis we are unable to tell which type of data is better able to reproduce the “real” dynamics. With regard to the comparisons with data sets produced by manual selection and coding, we detected a number of discrepancies that are clearly linked to the way international news wires operate: they tend to pay particular attention to large events taking place in the national capital or “in the whole country,” and to events during peak protest periods in a given country. These factors are best able to explain the discrepancies for countries without their own national English-language news agency. For the countries that have such news agencies, we were less able to account for the discrepancies between our data and the data manually identified and coded in national news sources.
Our study offers a detailed discussion of a semiautomated approach to retrieve protest events from international news agencies. In addition, it provides key insights into the biases that this method carries into the final data set. New research in the field combines the automated study of text and images to identify protest in social media (Zhang & Pan, 2019). In addition, more research is needed to combine sources written in different languages and to study on symbolic action forms that are most difficult to identify for both human coders and machines.
Footnotes
Declaration of Conflicting Interests
The author(s) declared no potential conflicts of interest with respect to the research, authorship, and/or publication of this article.
Funding
The author(s) disclosed receipt of the following financial support for the research, authorship, and/or publication of this article: The projet was supported by ERC grant Nr. 338875 and by SNF grant Nr. 100017_146104.