
Abstract
Bucky’s Tuition Promise (BTP) at the University of Wisconsin–Madison offers generous financial aid to low-income, in-state students. Unlike many similar programs at other public universities, financial eligibility for BTP depends solely on a family’s adjusted gross income (AGI), rather than on the Expected Family Contribution (EFC) from the Free Application for Federal Student Aid (FAFSA) or some function of the poverty line. This program design aims to make eligibility simpler and more transparent for students and their families and thereby to encourage application and matriculation. We investigate the implications of the program design for who does and does not receive additional institutional aid, with a particular focus on the marginal group of BTP-eligible students who lack federal Pell Grant eligibility. With this analysis, we aim to motivate a broader discussion of different notions of equity in financial aid administration and the tough trade-offs implicit in simplifying eligibility criteria.
In American higher education, students from low- and moderate-income families are underrepresented at the most resource-intensive colleges and universities. In the past quarter century, a substantial body of research literature has demonstrated that “achievement gaps” in high school do not suffice to explain the income gaps in enrollment at top colleges and universities in both the public and private sectors (e.g., Dillon and Smith 2017; Hoxby and Avery 2013). This residual gap suggests a role for financial factors. Potentially important deterrents to enrollment in well-resourced institutions include the actual (or “net”) price (i.e., the sticker price minus grant aid) that students face, lack of information regarding potentially large differences between a particular student’s net price and the institution’s sticker price, and uncertainty about how the net price will evolve over time as the student completes their degree.
Private colleges and universities in the U.S. have long relied on “high-tuition, high-aid” pricing strategies, and many public research universities have shifted to this form of pricing in recent years (Cook and Turner 2022). At many colleges, the level of grant aid provided to low- and moderate-income students has increased markedly, such that the “net price” of attending an elite university may be lower than what a student would pay to attend a community college or regional, open-access, four-year institution (Cook and Turner 2022; Hoxby and Turner 2013). Public universities (particularly the most selective flagships) also have increased the grant support they offer, particularly to in-state students, while the most selective private universities offer full grant aid to meet students’ financial need. 1 Engaging in price discrimination via financial aid offers allows colleges to obtain economically diverse student bodies while avoiding the substantial revenue loss that charging all students the same low price would entail. 2
Because colleges only reveal their net prices well after students submit their applications, students must form expectations about them as part of the process of deciding which colleges merit an application. Put differently, students and their families face substantial uncertainty regarding the affordability of specific colleges while making decisions about standardized testing, college visits, and college application submission. The college choice process often spans months: Students apply to a set of institutions, subsequently apply for financial aid, wait for admissions and financial aid offers, and then make matriculation decisions. Given the manifold burdens the process imposes on students (and their parents), they may refrain from applying to colleges and universities that they perceive to be unaffordable (Hoxby and Turner 2013). Logically, transparency in college pricing matters. Families cannot (fully) respond to prices that they do not (yet) know. In addition, because earning a college degree typically takes (at least) four years, expectations of price stability matter for families’ choices.
The University of Wisconsin–Madison (UW–Madison) offers an interesting case study within the ecosystem of state university financial aid programs. In 2018, it initiated a program called Bucky’s Tuition Promise (BTP), named after beloved UW–Madison mascot Buckingham Ulysses Badger, better known as “Bucky.” BTP covers full tuition and mandatory fees for in-state students with household adjusted gross incomes (AGIs) below a set threshold. Initially set at $56,000, the AGI cutoff has risen incrementally since the program’s inception and was $65,000 for the 2023–2024 school year. As then-Chancellor Rebecca Blank noted, “Many low- and middle-income families in Wisconsin are simply uncertain whether they can afford to send their child to UW–Madison. Our goal is to ensure that anyone who is admitted can afford to be a Badger” (Blank 2018). In addition to lowering the net price of attending UW–Madison for some students (Marifian 2023), BTP also increased the salience, transparency, and stability of the expected net price. Specifically, BTP eligibility depends on family income rather than with measures that may be less salient to families, like the Expected Family Contribution (EFC) from the Free Application for Federal Student Aid (FAFSA). 3
Like the designers of means-tested transfer programs such as TANF (Temporary Assistance for Needy Families) or SNAP (Supplemental Nutrition Assistance Program), the creators of financial need measures for student aid allocation should pursue fair and equitable eligibility criteria that do not impose heavy administrative burdens on families. In doing so, they face a trade-off between the simplicity of the need measure (and the eligibility rules that build upon it) and the precision with which the rules target institutional aid. Eligibility for federal financial aid, along with the more general need-based aid allocated by institutions, typically relies on the complex nonlinear EFC formula, which uses data on student and family income, (some) assets, and family characteristics from the FAFSA. Importantly, the EFC formula determines eligibility for the Federal Pell Grant. 4
Using FAFSA data for undergraduate students admitted to UW–Madison in fall 2016, 2017, or 2018, we show that needs assessment based on the EFC formula yields a somewhat different group of eligible students than the income-based formula used for BTP. Of the admitted students who were eligible for Pell Grants, BTP, or both, 17.6 percent were eligible for Pell but not BTP, while 10.6 percent were eligible for BTP but not Pell. In this article, we focus on understanding the divergence between Pell Grant eligibility and BTP eligibility.
Our examination of BTP illustrates that the way colleges and universities measure financial need can have a substantial impact on the distribution of grant-based financial aid. We begin with an overview of prior policy efforts and research about the importance of clearly communicating students’ financial aid eligibility. We then outline the terms of Bucky’s Tuition Promise before presenting evidence on the alignment between traditional (i.e., federal student aid) needs assessment and the income-based needs assessment used for BTP.
Institutional Aid Policy and Needs Assessment
In recent decades, rising tuition levels, growing endowment levels, and persistent underrepresentation of low- and moderate-income students at prestigious colleges and universities have raised questions about whether students other than the most affluent could afford a college degree. The first question concerns the absolute generosity of grant aid, where the posted tuition less grant aid determines net price. The second concerns how well students and their families discern the net price and how (and how much) they use this information in decision-making.
Institutional aid initiatives
Early in the 21st century, top public and private universities began to increase the availability and transparency of aid delivery, driven both by institutional mission and political factors. 5 Princeton University was a first mover in the private sector, introducing a “no loan” policy in 2001, which pledged to meet students’ full financial need (i.e., cost of attendance 6 less EFC) with grants. Harvard University and other private universities soon followed. Highly selective public universities like the University of Michigan, the University of Virginia, and the University of North Carolina launched similar initiatives in the 2000s.
Among elite institutions, size and geographic differences affect the design and implementation of aid programs. Consider the way an institution’s size affects the costs of aid programs. As an example, the fact that UW–Madison enrolls about 6.5 times as many undergraduate students as Princeton University 7 implies that increasing per-student grant aid by a constant dollar level for the same share of the student body would be 6.5 times more expensive for UW–Madison than for Princeton. This helps explain why, compared to their public counterparts, elite private universities often meet a higher fraction of a student’s financial need with grants while also extending grant aid to students further up the income distribution. 8 In addition, elite private universities face a national market, whereas public universities prioritize in-state students as part of their mission. Because the distribution of income varies widely across states, public universities may need to use different institutional financial aid strategies to recruit students from low- and moderate-income families. 9
The programs implemented by public universities share some common features while differing in the terms and transparency of awards. Branding the program with a catchy name and marketing hook appears important, as demonstrated by the Go Blue Guarantee (University of Michigan), the Carolina Covenant (University of North Carolina at Chapel Hill), AccessUVA (University of Virginia), Aggie Assurance (Texas A&M), Terrapin Commitment (University of Maryland), and BTP. 10 Table 1 presents a sample of key institution-specific aid programs introduced at public universities since 2004.
Exemplar Public University Grant Aid Programs

These programs tend to differ on two margins: (1) how far they extend up the income distribution (or, more broadly, the distribution of family capacity to pay) and (2) the measures used to determine a student’s financial need. Some programs (and earlier versions of current programs), like the Buckeye Opportunity Program (The Ohio State University), follow federal student aid determination and define program eligibility in relation to the Pell Grant. 11 Others, like the Carolina Covenant, use the federal poverty threshold for eligibility. Several programs, including BTP, assess financial need based on family income, in some (but not all) cases defined using AGI from federal tax forms. Among programs using family income criteria, eligibility thresholds vary: the University of California system’s Blue & Gold Opportunity Plan uses a threshold of $80,000, while the University of Virginia’s AccessUVA program sets an upper limit of $100,000 (and also uses an asset test).
Net price transparency and the application stage
One factor in the underrepresentation of low- and moderate-income students at the most resourced colleges and universities, including state flagship institutions and highly ranked private institutions, is that these students are less likely to apply than are affluent students with similar academic qualifications (Dillon and Smith 2017; Hoxby and Avery 2013). Hoxby and Avery (2013) note that much of the supply of high-achieving, low-income students comes from high schools and communities where application to selective colleges and universities is not the norm. They characterize these students as “one-offs,” noting that selective colleges’ traditional high school visits often miss these students, who may not have counselors or other trusted adults who can help them navigate the process of selective admissions. While limited guidance about application strategies is one factor at play, research from Avery and Kane (2004) and Hoxby and Turner (2013) shows that limited information about net price and aid availability also deters application.
Some federal policy efforts nominally increase information about net price. 12 For example, the federal government introduced a “FAFSA4caster” tool in 2007, and the Higher Education Opportunity Act of 2008 required colleges to post net price calculators. However, the utility of these tools has been called into question. Students and their families likely find the available tools cumbersome to access, and Perna, Wright-Kim, and Jiang (2019) find evidence of inaccuracies in the net price calculators in many cases. Moreover, these tools require that parents and students make a proactive effort to learn about net price at each specific institution.
For colleges and universities that offer generous need-based financial aid, identifying students who would benefit from information about net price and aid availability presents a challenge. Perhaps one advantage for public universities relative to private universities is that the geographic unit of a state enables targeted outreach that is not possible at a national scale. Although the impact on student application behavior is hard to assess, statewide media strategies are one tool available to public universities. 13 Public universities also may be able to send notifications to all high schools in the state, a strategy that would be infeasible for a university with a national reach.
An alternative strategy is a direct outreach effort that aims to identify high-achieving, low-income students who are strong candidates for admission and alert them to their likely program eligibility. Using an information experiment they conducted in cooperation with administrators at the University of Michigan, Dynarski et al. (2021) show that clear communication about the availability of full financial aid at a flagship can generate a large effect on the enrollment of high-achieving students from disadvantaged backgrounds. Michigan’s HAIL Scholarship, which guaranteed low-income resident students four years of free tuition upon admission, entailed extensive, personalized outreach to free and reduced-price lunch (FRPL)–eligible 14 high school students who likely would be academically eligible for admission. Dynarski et al. (2021) estimate a 15 percentage point increase in the enrollment rate of HAIL-eligible students (27 percent versus 12 percent) at the University of Michigan from the intervention. 15
Several features distinguish the HAIL program from the broad-based announcements of public university grant aid programs and may preclude the adoption of similar programs in other states. A key feature of the HAIL program’s design is its use of state administrative data to identify individual students in the target population—those who are high-achieving (and as a result likely academically qualified for the University of Michigan) and high-need. To identify students on the academic achievement margin, Dynarski et al. (2021) take advantage of the fact that all high school students in Michigan take the ACT (later the SAT). In states like Virginia that lack a “universal testing” program for the ACT/SAT, such identification would not be possible. To identify students on the need margin, Dynarski et al. (2021) use administrative data on FRPL receipt. While FRPL receipt effectively identifies many very low-income students, state education agencies and public colleges generally lack the more detailed information on parents’ financial circumstances required to identify students with relatively low incomes who do not qualify for (or do not apply for) FRPL but who nevertheless would be eligible for need-based financial aid.
One alternative to personalized outreach that provides a “guarantee” of funding (as did the HAIL program) uses demographic information, including residential address, and standardized test scores to identify students who are likely candidates for admission and likely eligible for need-based financial aid. For example, the Expanding College Opportunities (ECO) program studied by Hoxby and Turner (2013) followed a strategy of identifying target students based on likely eligibility at a national level; the program provided general information (with salient examples) to help students understand the importance of grant aid in driving a wedge between the posted level of tuition and net price. Unlike the HAIL program, the ECO program did not aim to increase applications to a particular institution; nor did it provide certainty to students or their parents about grant aid eligibility.
The simple design of BTP allows an equally simple and direct messaging strategy consisting of public announcements of the qualifying income threshold. This approach offers both clarity and transparency to students and their families. However, dimensions of family resources beyond current income meaningfully impact the capacity to pay for college. For instance, available assets, particularly but not exclusively relatively liquid assets, may impact the capacity to pay. Neglecting assets in needs assessment (and, consequently, in aid allocation) may lead to the mistargeting of need-based aid and may generate equity and efficiency costs that undermine the benefits of simple rules.
Needs assessment and net price
Awarding grant aid for higher education based on financial need requires articulating and codifying rules for determining how much students from different family circumstances can afford to pay for college. Eligibility for federal financial aid such as the Pell Grant (and subsidized student loans) begins with the completion of the FAFSA, which collects information about income (from federal tax returns) and some assets for both the student and her parents, along with indicators of family size and composition. 16 A nonlinear formula transforms these data inputs to produce the EFC. For students with an EFC less than the cost of attendance (COA), the federal Pell Grant equals the lower of COA minus EFC and the statutory maximum Pell. Universities allocate other aid, including grants from other institutional sources, to determine a student’s net price. As noted above, the lag between application and aid determination forces students to make college application choices with incomplete information about the aid they will receive.
While EFC correlates with family income (AGI), the correspondence is far from one to one. Three aspects of the FAFSA’s needs assessment generate divergence:
Parents’ assets: Needs assessment includes assets such as brokerage accounts, rental properties, and business investments; note that the FAFSA calculations do not include home equity (of primary residence) or retirement accounts.
Student’s income and assets: Needs assessment includes students’ income from employment, so a student who works full time during the summer faces a higher EFC and, consequently, lower financial aid.
Family structure: Family size increases the level of income exempt from consideration as available to pay for college (the so-called “income protection allowance”) and thereby reduces the expected contribution from family income, while the number of children in the family currently in college reduces the EFC proportionately. 17
In this article, we ask how the federal financial aid formula aligns with other indicators of capacity to pay, particularly income-based measures such as AGI, which families may find more salient. Using BTP as our case study, we show that these metrics differ and document the nature and extent of the divergence as well as the characteristics of the students and families for whom they diverge.
Bucky’s Tuition Promise: Program Details
At a board of regents meeting on February 8, 2018, Chancellor Rebecca Blank unveiled BTP, a UW–Madison financial aid program described as a “commitment to Wisconsin resident students.” The program guarantees incoming resident first-year undergraduates eight consecutive semesters of coverage of tuition and fees via grants and scholarships (four consecutive semesters for incoming transfer students) if their household AGI on the FAFSA is less than or equal to a preannounced threshold near the state median. In the program’s first year (2018–2019), the threshold was set at $56,000. BTP is a last-dollar award, meaning that it applies after all other sources of financial aid. As such, students whose other grants and scholarships fully cover tuition and fees do not receive additional funds from BTP, but they still receive the promise for future years. Students who were BTP-eligible but not Pell-eligible received a large increase (almost $10,000) in grant aid (Marifian 2023, Figure 14). In the first year of the program, BTP students accounted for 18.4 percent of UW–Madison’s 4,318 incoming fall freshmen and transfer students from Wisconsin.
BTP’s program design prioritizes simplicity and transparency. Several design aspects contribute to the program’s simplicity. A single measure determines financial eligibility, and the selected measure (AGI) is one that families already know or can easily obtain from their tax return (in contrast to criteria based on federal poverty level benchmarks, EFC, or Pell eligibility, which are neither well-known nor easy to determine). By forgoing a BTP-specific application, the program minimizes application costs and information frictions. The FAFSA, which is required to receive any need-based financial aid at UW–Madison, is the only application needed to be considered for BTP. Furthermore, the Office of Student Financial Aid automatically assigns eligible students to the program. Students need not know about BTP to receive the offer.
Several other elements of BTP ensure transparency of eligibility criteria and award coverage for students and families. After the initial year of the program (2018–2019), announcement of the AGI threshold came well in advance of the application deadline. In addition, the university made a financial commitment that eliminates any uncertainty about the minimum level of financial aid coverage that eligible students will receive for four years of undergraduate education. Specifically, because coverage is defined as “full tuition and fees” (rather than a dollar level, e.g., $10,500) and does not require annual recertification of AGI eligibility, families need not worry about how future changes in tuition levels or family financial circumstances would affect their level of coverage in subsequent years. 18
Overall, the behavioral impact of BTP may follow from three margins. First, students and families may respond to the transparency and public announcement of BTP by applying to UW–Madison when they otherwise would not have. Second, some students—particularly those eligible for BTP but not Pell Grants—receive greater financial aid with the introduction of BTP, with the matriculation response indicative of the price elasticity of demand. Third, the “guarantee” aspect of BTP may independently increase application and matriculation by reducing uncertainty regarding tuition and fees in future years.
The origins of Bucky’s Tuition Promise
In the months and years after her initial announcement of BTP, Chancellor Rebecca Blank successfully championed the program and garnered support from both the Wisconsin public and the private donors needed to fund the program, which was estimated to cost $825,000 annually per class, or $3.3 million annually across all classes. 19 Although Blank was involved from the early stages, the development of what would eventually become BTP was led by Derek Kindle, then UW–Madison’s director of student financial aid (July 2016–March 2020), and Nicholas Hillman, a professor in UW–Madison’s department of educational leadership and policy analysis.
Public communications about BTP have highlighted, among other things, the importance of designing a program that prospective students and their families could easily understand. Chancellor Blank, reflecting on the program after the first BTP cohort’s graduation, said, “The beauty was in its simplicity. Financial aid can be confusing to prospective students. We stripped away the complexity” (Erickson 2022a).
Kindle, now the vice provost for enrollment management, generously shared details of their early-stage thought processes. 20 He began by noting that, although EFC is a “cleaner measure to use” from an aid administrator’s standpoint, it falls short for students and families: “EFC means absolutely nothing to a prospective student who hasn’t yet completed a FAFSA, and it doesn’t mean anything to the public.” This observation guided the design of BTP: “We said ‘no matter what the program is, we don’t want more than three criteria. And the criteria have to be so easy or obvious that a student, if they don’t know it already, can easily find it in middle school.’” In the end, the criteria were Wisconsin residency, completing a FAFSA, and household income at the median or below. Kindle recognized that this decision to prioritize a few simple criteria differentiated BTP from other programs.
Another feature that distinguishes BTP from other promise programs—like the Go Blue Guarantee in Michigan—is the omission of assets from the eligibility criteria. According to Kindle, UW–Madison financial aid administrators considered the inclusion of assets, as assets can be helpful for identifying the target population and distinguishing among families with similar income levels but different capacities to pay for college. But Kindle understood that using assets to screen out the families who were not “truly needy” could undermine the design goal of using simple and clear criteria. He describes the trade-off: “How many people does this account for, and do we want to risk people not understanding what assets are?” After analyzing the data, they determined that it would “cost more in either public understanding or the value of the program to add in criteria to weed those people out” and that it would be better to just give them money. He describes this as a “cost of doing business.”
Institutional Data from Wisconsin
Our data come from student-level administrative records at the Office of Admissions and Recruitment (OAR), the Office of Student Financial Aid (OSFA), and the Registrar’s Office (RO) at UW–Madison. These records include data on undergraduate admissions applications, FAFSA submissions, UW–Madison financial aid offers, and enrollment outcomes. Because we are interested in understanding the relationship between BTP eligibility and Pell eligibility, our analyses will focus on the financial measures that determine a student’s eligibility for each of these programs.
As discussed above, the only financial criterion for BTP eligibility is that the household’s (student and parents combined) AGI (as reported on the FAFSA) falls at or below a preannounced threshold—approximately the state median AGI. Table 2 shows the evolution of the threshold over time and the number of matriculants receiving BTP in each year. The data we analyze include many of the line items from the FAFSA used in the formula that determines the EFC, such as household structure and the income and asset measures from both parents and students. We also observe race/ethnicity, parents’ education, and location of residence within the state.
Bucky’s Tuition Promise Eligibility and Scale

SOURCE: Data from Erickson (2018, 2019, 2020, 2021, 2022b).
Sample restrictions
We seek to compare alternative measures of financial need for recent cohorts with application decisions unaffected by BTP. To that end, we begin with the set of Wisconsin resident applicants for first-year undergraduate admission to UW–Madison for academic years 2016–2017 through 2018–2019 who also applied for financial aid (i.e., submitted a FAFSA). The 2018 application deadline for spring and transfer admission occurred after the February 2018 announcement of BTP, so to avoid capturing any students who applied in response to the policy announcement, we limit our sample to undergraduates who applied for first-time fall admission. We also exclude independent students, 21 a relatively small group among first-time fall undergraduates at UW–Madison, because the EFC computation differs substantially for them (not least because the FAFSA does not require them to report parental income). Finally, except for Table 5, which provides a comparison of applicants, admitted students, and enrolled students, we restrict our analyses to admitted students. FAFSA filing rates for first-year resident admitted students equal 77.2, 84.6, and 86.0 for the 2016–2017, 2017–2018, and 2018–2019 application cohorts, respectively.
Variable definitions and construction
Financial variables (income, assets, etc.) come directly from the FAFSA. To reduce the influence of extreme outliers on the means (while leaving the medians unaffected), we winsorize financial variables at the 1st and 99th percentiles. 22 All “household” variables combine student and parent measures (i.e., household assets = parent assets + student assets). Student demographic variables include indicators for female, underrepresented minority, FRPL receipt, and attendance at a rural high school, as well as standardized ACT/SAT score. Underrepresented minority includes students who identify as African American, Hispanic/Latino(a), American Indian, Native Hawaiian/Other Pacific Islander, or underrepresented Asian (Cambodian, Hmong, Laotian, or Vietnamese). FRPL receipt is based on the FAFSA and covers students whose family income is below 185 percent of the federal income poverty guideline ($46,435 for a family of four in 2018–2019). 23 The indicator for attendance at a rural high school is defined using the National Center for Education Statistics (NCES) locale classifications and criteria 24 and includes the “Rural – Distant,” “Rural – Fringe,” and “Rural – Remote” categories. To construct the standardized SAT/ACT variable, we begin with the ACT composite score and SAT total score variables. 25 We separately standardize each variable across all undergraduate applicants (including transfer students, independent students, and nonresidents) within an application year; to account for students who submit both ACT and SAT scores, we take the mean of the two standardized measures.
EFC and AGI, Pell and BTP
Four (or five) kinds of students
Motivated by the institutional setup, especially by the unique focus of BTP’s eligibility rules on AGI, we focus the bulk of our empirical analysis on four (and sometimes five) groups defined by AGI and EFC. Specifically, we define these groups based on whether their relevant AGI lies above or below the $56,000 eligibility cutoff in place for the first BTP cohort in fall 2018 and where their EFC lies relative to the cutoff values that define eligibility for full (and sometimes partial) Pell Grant eligibility for the fall 2018 cohort.
Table 3 cross-tabulates AGI and EFC for the fall 2016–2018 admission cohorts at UW–Madison. We focus on admitted students rather than on all applicants because admits have greater policy relevance. We focus on admitted students rather than on matriculants because matriculants are likely to be selected based on aid offers. We show later in this section how admitted students differ on key characteristics from all students who applied. Focusing on these cohorts allows us to consider an “untreated” admitted student population, in the sense that BTP did not exist for the fall 2016 and fall 2017 cohorts and only affects post-application behavior for the fall 2018 cohort. This choice has the cost that these cohorts, now most of a decade in the past, may differ from current cohorts. Combining three cohorts empowers the signal relative to the noise.
Joint Distribution of EFC and Household AGI (Cell Percent): Fall 2016, 2017, 2018 WI Admits

SOURCE: Authors’ calculations using FAFSA data for Wisconsin residents who were admitted to UW–Madison for freshman enrollment in fall 2016, 2017, or 2018.
NOTE: The sample excludes independent students and transfer students. All financial variables are winsorized at the 1st and 99th percentiles. Household variables are the sum of student and parental variables. Households’ EFC and AGI are binned. For academic year 2018–2019, students with household AGI at or below $56,000 were eligible for BTP, while students with EFC at or below $5,486 were eligible for the Federal Pell Grant. The maximum Federal Pell Grant award in 2018–2019 was $6,095. AGI = adjusted gross income; BTP = Bucky’s Tuition Promise; EFC = Expected Family Contribution.
The rows in Table 3 represent bins of EFC, with the first three rows (i.e., zero, 1–3,000, and 3,001–5,486) implying some Pell eligibility for the fall 2018 cohort, and the remaining rows implying no Pell eligibility. The maximum EFC for Pell eligibility for the 2016 and 2017 cohorts was somewhat lower, at $5,234 and $5,328, respectively (Ma and Pender 2023). For all cohorts, an EFC of zero implies eligibility for the maximum Pell Grant, while a positive EFC less than or equal to the maximum Pell EFC implies partial Pell eligibility. The columns in Table 3 represent bins of AGI, with the first two columns (i.e., 0–35,000 and 35,001–56,000) implying BTP eligibility and the third and fourth columns implying no BTP eligibility.
We take three important patterns away from Table 3. First, a strong majority (82.6 percent) of the sample (admitted students who submitted a FAFSA) qualify for neither Pell nor BTP. 26 Second, a sizable fraction of admitted students, around 11.4 percent for these cohorts, finds itself eligible for both BTP and Pell, though only about 4.6 percent of students (40.7 percent of those eligible for BTP and Pell) receive the maximum Pell Grant. Third, small—but hardly trivial—numbers of students fall into the off-diagonal cells, denoting eligibility for one of BTP and Pell but not the other. Specifically, for these cohorts, 3.7 percent of students qualify for Pell but not BTP, and 2.3 percent qualify for BTP but not Pell. For this last group of students, BTP brings substantial grant aid to a population not previously eligible for it. The discussion that follows considers the differences in individual and household characteristics and behaviors that land admitted students in one of the off-diagonal cells, particularly the “BTP, no Pell” cell.
Table 4 offers descriptive statistics for the four groups from the 2016, 2017, and 2018 fall admission cohorts. Gender varies little among the four groups; all four include a modestly disproportionate share of female students. Students from underrepresented minority groups make up roughly one-fifth of both Pell-eligible groups but only 7 percent of the remaining two groups. One-quarter of the students eligible for both Pell and BTP also received FRPL. This makes sense given that FRPL eligibility keys in on household income relative to the poverty line—130 percent for a free lunch, 185 percent for a reduced-price lunch—but also generally requires an explicit take-up decision. Students from rural high schools have a slight overrepresentation in the No BTP, Pell group.
Student Demographics: Fall 2016, 2017, 2018 WI Admits

SOURCE: Authors’ calculations using FAFSA data for Wisconsin residents who were admitted to UW–Madison for freshman enrollment in fall 2016, 2017, or 2018.
NOTE: The sample excludes independent students and transfer students. All financial variables are winsorized at the 1st and 99th percentiles. Columns indicate categories of students based on eligibility for BTP and the Federal Pell Grant in academic year 2018–2019. See also notes for Table 3. BTP = Bucky’s Tuition Promise; FRPL = free and reduced-price lunch; AGI = adjusted gross income.
In contrast to some of the demographics, the standardized test scores show a very strong ordering, with the mean increasing strongly and steadily from left to right in Table 4. The two Pell-eligible groups lie 0.22 and 0.13 standard deviations below the mean, while the BTP, no Pell group lies 0.09 standard deviations above it. As expected, given how we define our categories, the two BTP-eligible categories have relatively low average AGI: around $29,600 for the Pell-eligible and about $40,000 for the Pell-ineligible. In contrast, the no BTP, Pell group has an average of nearly $70,000, and the group ineligible for both BTP and Pell has an average of approximately $170,000. We have more to say about the (perhaps) surprisingly high average for the no BTP, Pell group below.
Table 5 supports our focus on admitted students by displaying some average characteristics for the 2016, 2017, and 2018 fall cohorts for applicants, admits, and enrolled students. Most variables vary little across the groups; put differently, for most variables, we see very little “selection on observed variables” moving from application to admission to enrollment. This claim holds strongly for FRPL status, rural status, and AGI. In contrast, as we move from application to enrollment, the data reveal a modest decline (in levels; it is large in proportional terms) in the fraction of students identifying as underrepresented minorities, while the fraction female increases substantially for admits relative to applicants. The data also reveal a large increase in average test score from application to admission, consistent with the selective admissions process at UW–Madison, followed by a modest decline in the average test score among enrolled students, which presumably reflects students with high test scores for whom UW–Madison served as an (ex-post unnecessary) safety school. As cautious empiricists, we have examined all the tables we present for all three groups, but in the interest of space and the reader’s attention and interest, we spare them this heap of qualitatively repetitive findings.
Student Demographics for BTP, No Pell Students

SOURCE: Authors’ calculations using FAFSA data for Wisconsin residents who applied to UW–Madison for freshman enrollment in fall 2016, 2017, or 2018.
NOTE: The sample is restricted to students with household AGI at or below $56,000 and who were not eligible for the Federal Pell Grant. The sample excludes independent students and transfer students. All financial variables are winsorized at the 1st and 99th percentiles. BTP = Bucky’s Tuition Promise; FRPL = free and reduced-price lunch; AGI = adjusted gross income.
Targeting BTP
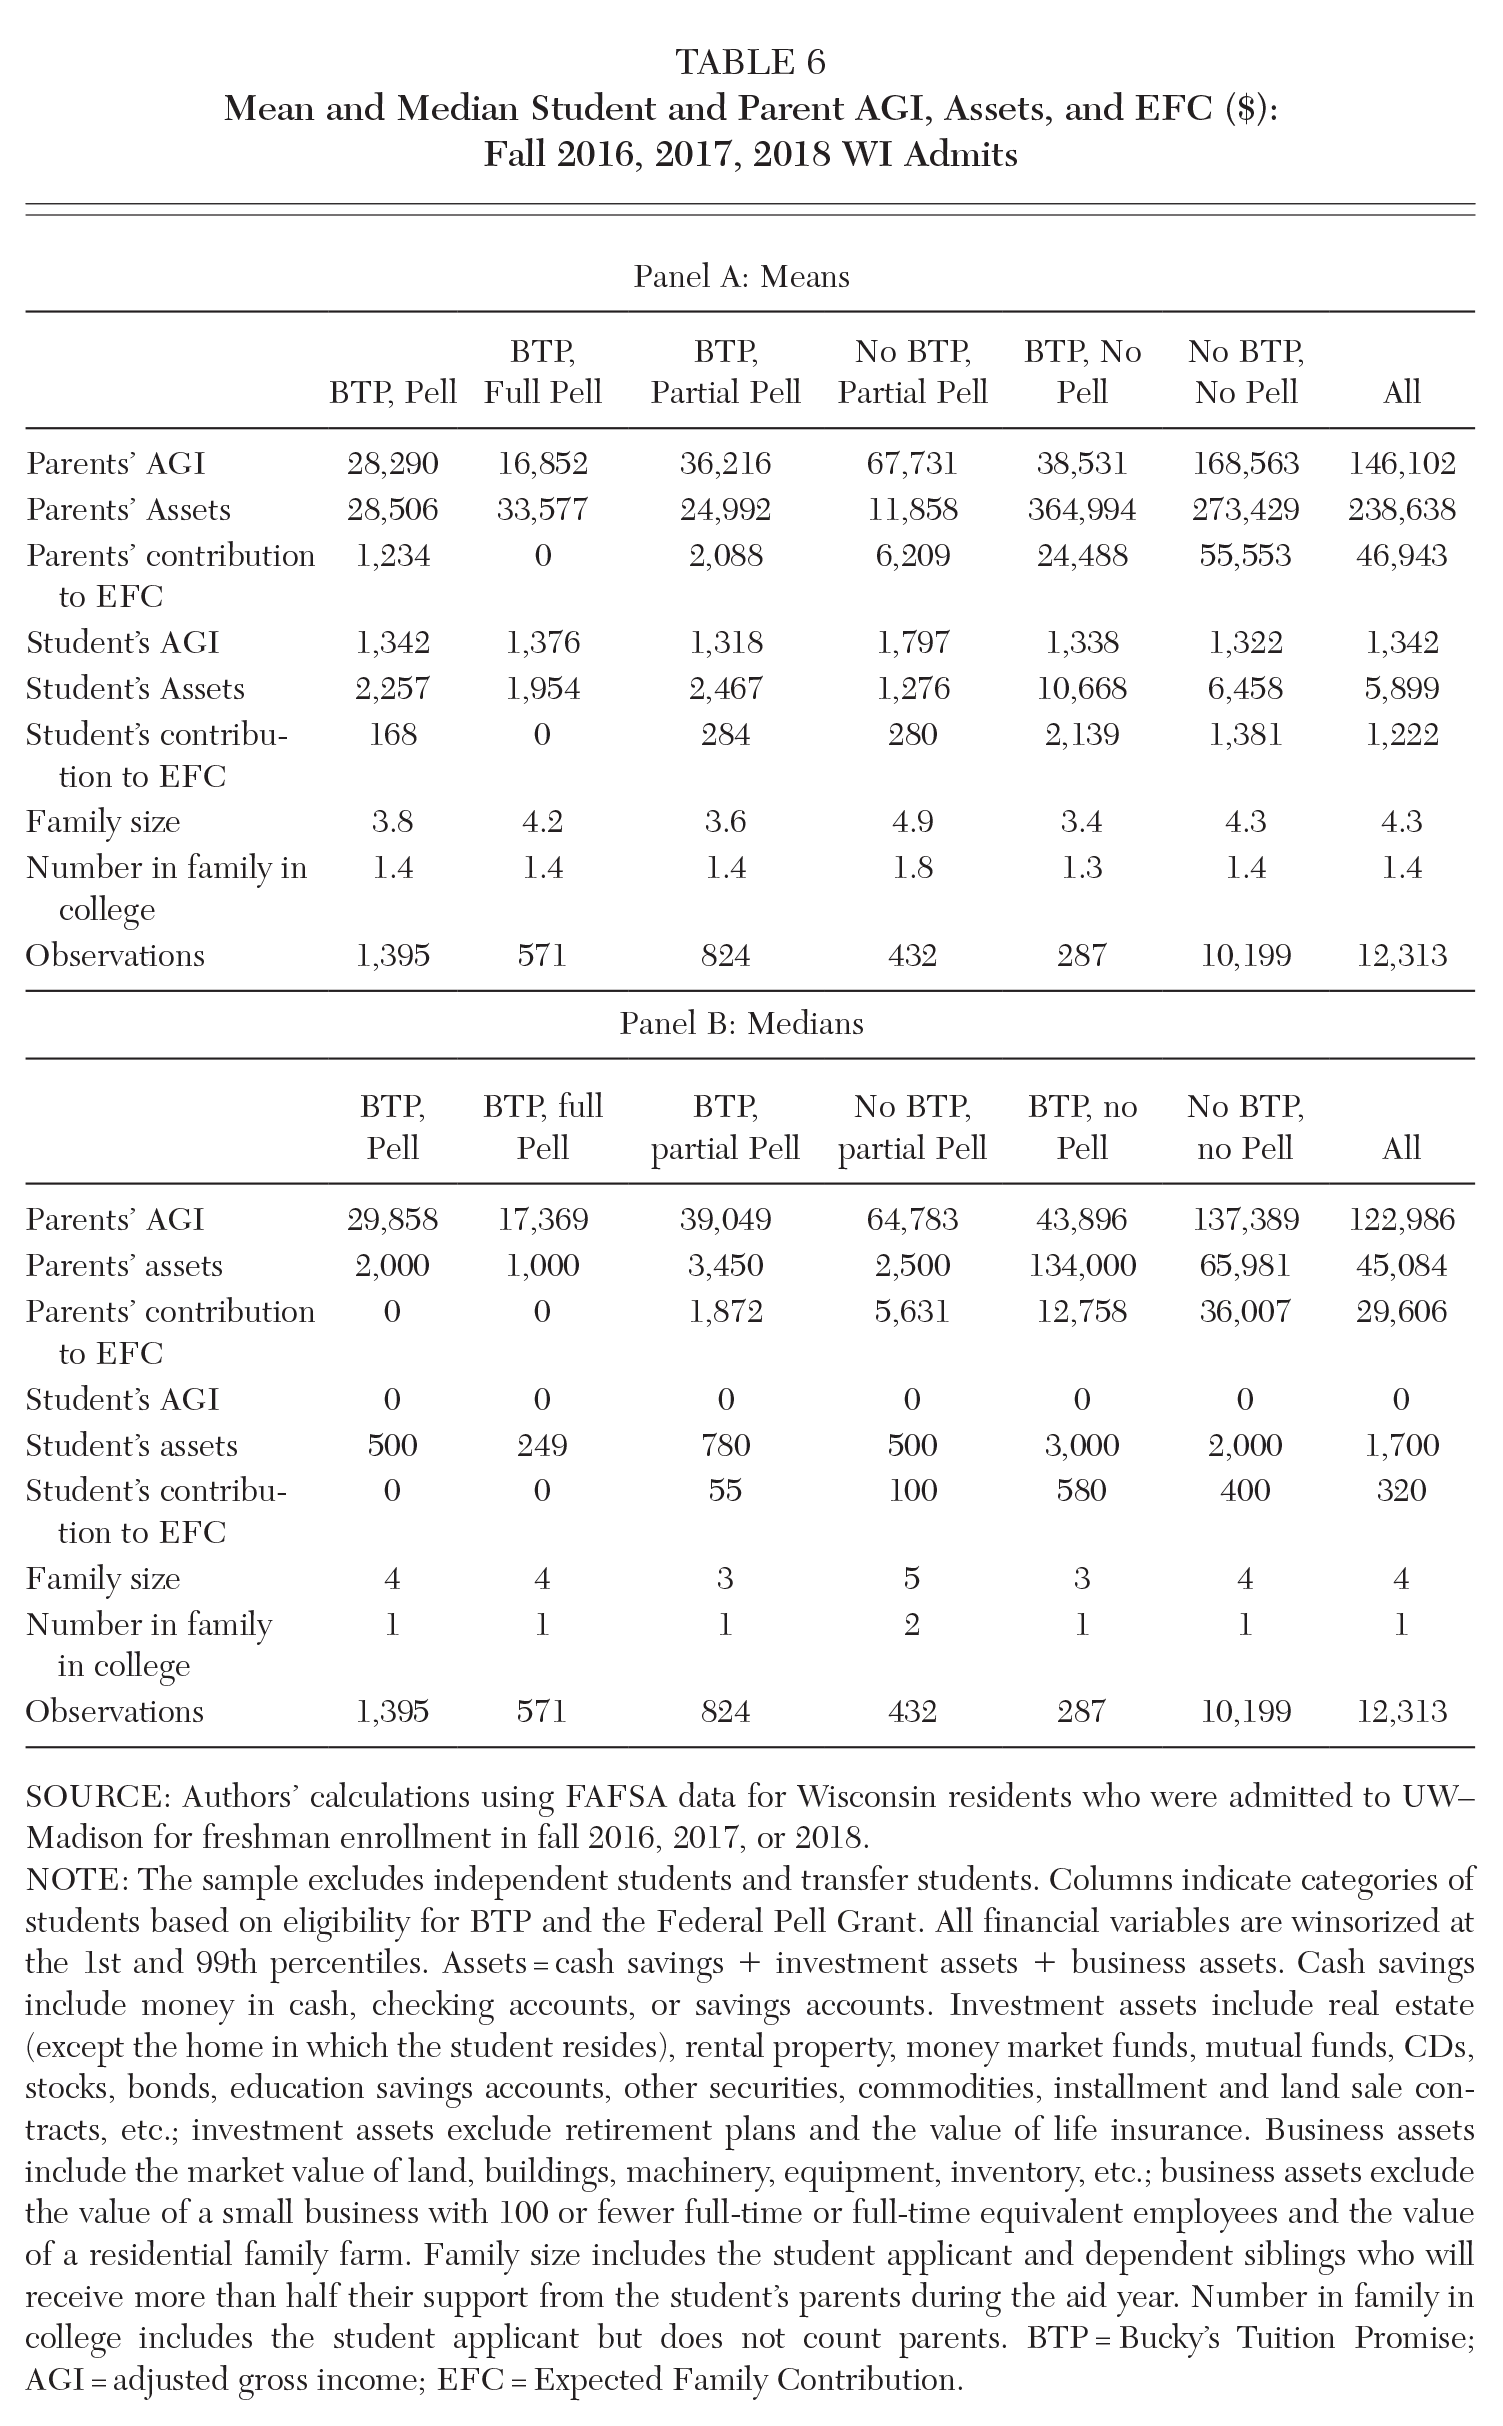
Panels A and B of Table 6 present the means and medians, respectively, of parental and student AGI, assets, and EFC, along with family size and the number of family members in college. Summing up the means (but, of course, not the medians) of student and parent values of AGI, assets, and EFC yield the household values, where it is the household values that determine both BTP eligibility and Pell eligibility (and where “household” in this context means specifically the tax unit). 27 Columns 2 through 6 correspond to the five categories based on BTP and Pell eligibility defined in the preceding section, with column 7 in each table giving overall means and medians. We present both means and medians because the unconditional distributions (and some of the conditional ones) for the asset and income variables have notable right tails, with some families reporting high incomes and substantial asset holdings.
Mean and Median Student and Parent AGI, Assets, and EFC ($): Fall 2016, 2017, 2018 WI Admits
SOURCE: Authors’ calculations using FAFSA data for Wisconsin residents who were admitted to UW–Madison for freshman enrollment in fall 2016, 2017, or 2018.
NOTE: The sample excludes independent students and transfer students. Columns indicate categories of students based on eligibility for BTP and the Federal Pell Grant. All financial variables are winsorized at the 1st and 99th percentiles. Assets = cash savings + investment assets + business assets. Cash savings include money in cash, checking accounts, or savings accounts. Investment assets include real estate (except the home in which the student resides), rental property, money market funds, mutual funds, CDs, stocks, bonds, education savings accounts, other securities, commodities, installment and land sale contracts, etc.; investment assets exclude retirement plans and the value of life insurance. Business assets include the market value of land, buildings, machinery, equipment, inventory, etc.; business assets exclude the value of a small business with 100 or fewer full-time or full-time equivalent employees and the value of a residential family farm. Family size includes the student applicant and dependent siblings who will receive more than half their support from the student’s parents during the aid year. Number in family in college includes the student applicant but does not count parents. BTP = Bucky’s Tuition Promise; AGI = adjusted gross income; EFC = Expected Family Contribution.
The tables foreground the operation of the very different eligibility criteria for BTP and Pell. Mean and median AGI necessarily lie below $56,000 for the BTP-eligible groups; the conditional distribution skews left for these groups, with the mean below the median. Similarly, the mean and median AGI necessarily lie above $56,000 for the no-BTP groups, with a strong right skew in both cases, as one expects for the right tail of a conditional income distribution. A larger family affects the EFC, and thus Pell eligibility, by increasing the income protection allowance, while having no effect on BTP eligibility. This feature of the EFC calculation accounts for the substantially larger average family size for the no BTP, partial Pell group. Similarly, families with other children in college also enjoy a substantially reduced EFC; this too feeds into the larger average family size for the no BTP, partial Pell category. Finally, and not at all surprisingly, on average the vast majority of household income comes from parents rather than the student.
Tables 7 and 8 enrich our understanding of parental assets. As one would expect based on the low amounts of student-held assets in Table 6, analogous versions of these tables with household rather than parental assets tell the same story. Table 7 has a format parallel to the tables already considered but presents both means and medians in the same panel. So, for example, in the BTP, full Pell column, parents on average have $7,172 in cash savings, but the median parent has only $800 in cash savings, signaling a highly right-skewed distribution. Recall that we winsorize the financial variables—with separate winsorizing for each asset class and the total—which accounts for the failure of mean parental cash savings, investment assets, and business assets to sum to the mean of overall parental assets. Table 8 presents the joint distribution of parental AGI and assets. Bin boundaries for the AGI repeat those from Table 3, while bin boundaries for assets lie at the quintiles of the empirical distribution. Each cell presents the count of observations in the cell, the row percentage (i.e., the percentage of observations in the row in that cell), and the column percentage.
Parental Assets ($): Fall 2016, 2017, 2018 WI Admits

SOURCE: Authors’ calculations using FAFSA data for Wisconsin residents who were admitted to UW–Madison for freshman enrollment in fall 2016, 2017, or 2018.
NOTE: The sample excludes independent students and transfer students. All financial variables are winsorized at the 1st and 99th percentiles. Parents’ contribution from assets refers to the parents’ asset contribution to the EFC. Parents’ ages are constructed as age on December 31 of the FAFSA aid year. See also notes for Table 6. Columns indicate categories of students based on eligibility for BTP and the Federal Pell Grant. BTP = Bucky’s Tuition Promise; AGI = adjusted gross income; EFC = Expected Family Contribution.
Joint Distribution of Parents’ AGI and Assets: Fall 2016, 2017, 2018 WI Admits

SOURCE: Authors’ calculations using FAFSA data for Wisconsin residents who were admitted to UW–Madison for freshman enrollment in fall 2016, 2017, or 2018.
NOTE: The sample excludes independent students and transfer students. All financial variables are winsorized at the 1st and 99th percentiles. AGI = adjusted gross income.
We first remind the reader that the assets reported here exclude many of the assets that most parents hold, including their home, a business with 100 or fewer employees, retirement accounts, and life insurance, because the FAFSA instructs applicants to exclude them. With all those exclusions in mind, the asset numbers seem (in some sense) surprisingly large. Second, mean and median assets only reach levels consistent with covering multiple years of education at UW–Madison for parents in the BTP, no Pell and the no BTP, no Pell categories. The differential treatment of assets under BTP, which ignores them in calculating eligibility in pursuit of simplicity and transparency in the eligibility rules, and under the EFC, which very much takes them into account, yields the stark differences revealed in Table 8. Third, investment assets make up (by far) the largest component of mean assets for these households. Though somewhat to the side of our primary preoccupations, one could have an interesting discussion about the asymmetric treatment of households who invest in a fancy home that they actually live in versus households that invest in apartment buildings that other people live in and/or in the stock market.
Fourth, and finally, the top two rows of Table 8, which correspond to BTP-eligible households, contain 132 people with more than $303,501 in assets and another 166 with assets between $86,977 and $303,501. From certain perspectives, these households embody the equity “cost of doing business” of the simple AGI eligibility rule for BTP.
Conclusion
Need-based financial aid in higher education aims to promote efficient investments in human capital by ameliorating credit constraints and to improve equity both within cohorts and over time via increased intergenerational mobility. Targeting need-based aid involves conceptual decisions about the nature of financial need as well as very practical decisions regarding the measurement of need, and these decisions have implications for the administrative burden on both citizens and the state associated with financial aid programs. This article has engaged these broad general issues with a detailed consideration of the “case study of convenience” provided by the introduction of BTP at the UW–Madison and access to relevant administrative data.
Our analysis shows that the straightforward income-based criterion for BTP eligibility produces somewhat different recipients than does the EFC criterion for Pell eligibility. In our data, 3.7 percent of students qualify for Pell but not BTP, while 2.3 percent qualify for BTP but not Pell. Families with more resources than the very poorest students (i.e., those eligible for full Pell Grants) drive the divergence. Digging into the data, the divergence highlights two differences between the criteria. First, BTP ignores assets, while EFC pays attention to (a selected subset) of them. Second, BTP ignores family composition, while EFC does not. Families eligible for BTP but not Pell tend to hold nontrivial assets of the sort the EFC pays attention to, while families eligible for Pell but not for BTP tend to have higher incomes but also larger families and/or additional family members in college.
Is formulaic needs assessment (using the EFC calculation from the FAFSA) more “targeted” than measures that rely on the more limited information of family income? It is worth emphasizing the need for additional inquiry to pinpoint the exact nature of the asset measures driving the divergence. Illiquid assets associated with self-employment yield a far different assessment of capacity to pay than, say, a large second home or a large brokerage account. Details matter in sorting this out, and there is much more work to do.
Whatever advantage in targeting the EFC-based calculation possesses entails substantial costs in terms of complexity of administration and lack of transparency regarding the availability of need-based financial aid. In contrast, BTP has the benefit of simplicity. The AGI on which it relies is verifiable, non-manipulable, and inexpensive to provide, which reduces administrative burden all around and makes it easy for students and parents to determine eligibility. 28 Fully realizing the benefits of this transparency likely requires a comprehensive dissemination strategy to reach parents and students, including those who would be the first in their families to attend college or from areas where college-going is not the norm. As of this writing, we are unaware of efforts to measure awareness of BTP among Wisconsin parents and students, particularly those likely to be income-eligible and strong candidates for admission.
Our analysis of institutional grant aid allocation relates to the broader question of the equity, efficiency, and complexity of federal needs assessment formulas tied to the FAFSA. Spring 2024 witnessed the chaotic implementation of changes in the federal formula mandated by the FAFSA Simplification Act (2020). Even as recasting the EFC concept as the Student Aid Index (SAI) is largely cosmetic, a number of formulaic changes will impact who does—and does not—receive Pell Grants and other types of aid subject to the needs assessment formula. For instance, the SAI no longer takes account of the number of family members in college when determining families’ capacity to pay.
The evaluation of different metrics for needs assessment ultimately calls for measurement of the behavioral response to program design. Highly refined targeting of need and identification of capacity to pay for college may have little return if the resulting administrative burden is so high that students do not take up benefits. On the other hand, “simple” criteria may provide disproportionate benefits outside of the target group (and these students may be particularly responsive to changes in aid), thus resulting in considerable inefficiency in the expenditure of scarce financial aid dollars.
Finally, we offer some further thoughts that should inform future research in this space. First, we see nothing sacrosanct about either the EFC or the SAI. The literature would benefit from analytic consideration of many of the dimensions of needs assessment that underlie these summary measures, including the asset classes and asset amounts that warrant exclusion from ability-to-pay calculations. Second, the measurement challenges associated with needs assessment increase with AGI. We expect few measurement concerns when using AGI alone for long-term SNAP recipients. In contrast, families with an AGI just below the BTP cutoff sometimes have substantial assets of various types. Thus, tiered needs assessments that rise in detail and complexity with AGI may merit consideration. Third, opportunities to creatively use existing state administrative data (or to strategically enhance the content of state administrative data systems) deserve investigation.
To close, we return to the theme of the volume in which this article appears, namely, former UW–Madison Chancellor Becky Blank. Though BTP did not originate with Becky, when it landed on her desk, she ran with it. That she chose to do so should come as no surprise given the considerations that animated both her research and her policy and administrative work: careful attention to issues of measurement and to behavioral responses to programmatic incentives, a deep concern with the least well-off in American society, and a relentless focus on practicality.
Footnotes
NOTE: We are grateful to Diane Schanzenbach, Leslie McGranahan, John Dreger, Nicholas Hillman, Derek Kindle, Hanns Kuttner, Shane Maloney, Lesley Turner, Bonniejean Zitske, our audience at the September 2024 CESifo education group meetings, and the many participants at the Authors’ Conference in Memory and Honor of Rebecca M. Blank in February 2024.
The research reported here was supported by the Institute of Education Sciences, U.S. Department of Education, through Award #R305B150003 to the University of Wisconsin–Madison. The opinions expressed are those of the authors and do not represent views of the Department of Education or the University of Wisconsin–Madison.
Notes
Elise A. Marifian is an applied microeconomist interested in understanding the causes and consequences of inequality and poverty. She studies questions at the intersection of public economics and labor economics, with a current focus on topics in higher education, child care, and criminal justice.
Jeffrey A. Smith is Paul Heyne Distinguished Chair in Economics and Richard Meese Chair in Applied Econometrics at the University of Wisconsin–Madison. He studies the applied econometrics of program evaluation, with a substantive focus on social and educational programs and a methodological focus on heterogeneous treatment effects.
Sarah E. Turner is Souder Family Endowed Chair and University Professor of Economics and Education at the University of Virginia. Her research areas of expertise include the economics of education, labor economics, and higher education policy.