
Abstract
Over many years, the research and writing of Rebecca Blank provided insightful analysis of poverty and the social safety net in the U.S. A number of lessons can be drawn from her work—about the social safety net and about policy-relevant scholarship—that remain crucial. Blank’s work shows us the importance of considering heterogeneity among those who live in poverty. It highlights the patchwork nature of the social safety net as well as the role played by both geographic variation and race in determining antipoverty policy in the U.S. Her lessons on scholarship include the value of measurement and of high-quality research that considers both benefits and costs of policies. Finally, Blank’s work shows us that the perception that “nothing works” to reduce poverty misinterprets history and ignores a growing body of evidence.
In 1997, Rebecca M. Blank published It Takes a Nation: A New Agenda for Fighting Poverty (henceforth referred to as ITAN). The book provided a comprehensive treatment of poverty and associated public policies and a persuasive critical response to the misinformation that was common in the discussions of welfare reform in the 1990s. The book built on Blank’s research on the U.S. social safety net over a 20-year period and was favorably reviewed when it was published. 1 We revisited ITAN and the broader portfolio of Blank’s work in preparation for writing this article and quickly came to the realization that it is nearly impossible to have new insights about the safety net that she had not already thought and written about more than 20 years ago. Recognizing the breadth and depth of Blank’s contributions, we decided to center this article around many of the lessons that can be drawn from her work—about the social safety net and about policy-relevant scholarship—that are still important today.
Table A1 in the online appendix presents a sampling of Rebecca Blank’s work on the social safety net in the 20 years after she received her PhD. It begins with her first publication, in the Journal of Public Economics in 1985, and includes many other papers published in peer-reviewed journals as well as edited volumes, several of which she coedited. In addition to her original academic scholarship about the safety net, Blank sought to distill the essence of the academic literature to a broader audience, as evidenced by her overview articles in the Journal of Economic Literature and the Journal of Economic Perspectives, as well as by her work on ITAN. She was particularly skilled at effectively communicating the state of poverty and the efficacy of antipoverty programs in ways that were persuasive to both researchers and policymakers. 2 The work highlighted here demonstrates her dedication to research on the social safety net and the significant contributions she made to this literature over the course of decades.
Rebecca Blank’s Lessons About Poverty and the Safety Net
Lesson #1: Poverty cuts across demographic groups and neighborhoods. Analyzing people in poverty as a homogeneous type impedes our understanding of the problem and our ability to find solutions
In the last decade, we have consistently misunderstood the nature of poverty in America, believing that it is more behavioral, more ghetto-based, and more a problem experienced by people of color. Hence, for many middle-income Americans, the poor have come to seem alien and less “like us” than they actually are. (Blank 1997a, 5)
In order to assess the evolution of the social safety net in aiding households in poverty, we must first understand the characteristics of those households as well as the drivers of poverty. In the first chapter of ITAN, Rebecca Blank (1997a) emphasizes that “there is no one ‘face’ of poverty in America” (13). Households in poverty fall into every demographic group and live in most types of neighborhoods, and a failure to understand this hinders both the development of public programs and the ways in which scholars analyze them. Most notably, the common simplification of people in poverty into an often racialized and behavior-based narrative has fed division and indifference from those in higher-income brackets and from policymakers.
In ITAN, Blank used data from the March Current Population Survey to illustrate heterogeneity across households in poverty in 1993 (Blank 1997a, 16, Figure 1.1). For those under the official poverty line, Blank examined the distribution by subgroup, including education, race, and household structure. We update this analysis in Figure 1, presenting both Blank’s original analysis for 1993 households and current households in 2021. 3 Blank’s 1993 analysis distinctly demonstrates that the distribution of those in poverty across demographic characteristic largely reflects the general distribution of households in the U.S. For example, in 1993, white households made up the largest share of all households in the U.S. and also made up the largest share of those in poverty. Blank also highlighted that a significant share of the households in poverty were single-parent families and households with less than a high school education. In 2021, we again see that the distribution of those in poverty reflects the overall U.S. distribution. As the U.S. becomes more racially diverse, white households make up a slightly smaller share of households in poverty. One significant change from 1993 is the large increase in the number of households in poverty that have attained a high school degree or more education. As discussed elsewhere in this volume by Barrow, Schanzenbach, and Rivera, the impact of education on improving poverty status has declined as individuals with high school through college degrees constitute higher shares of people in poverty.
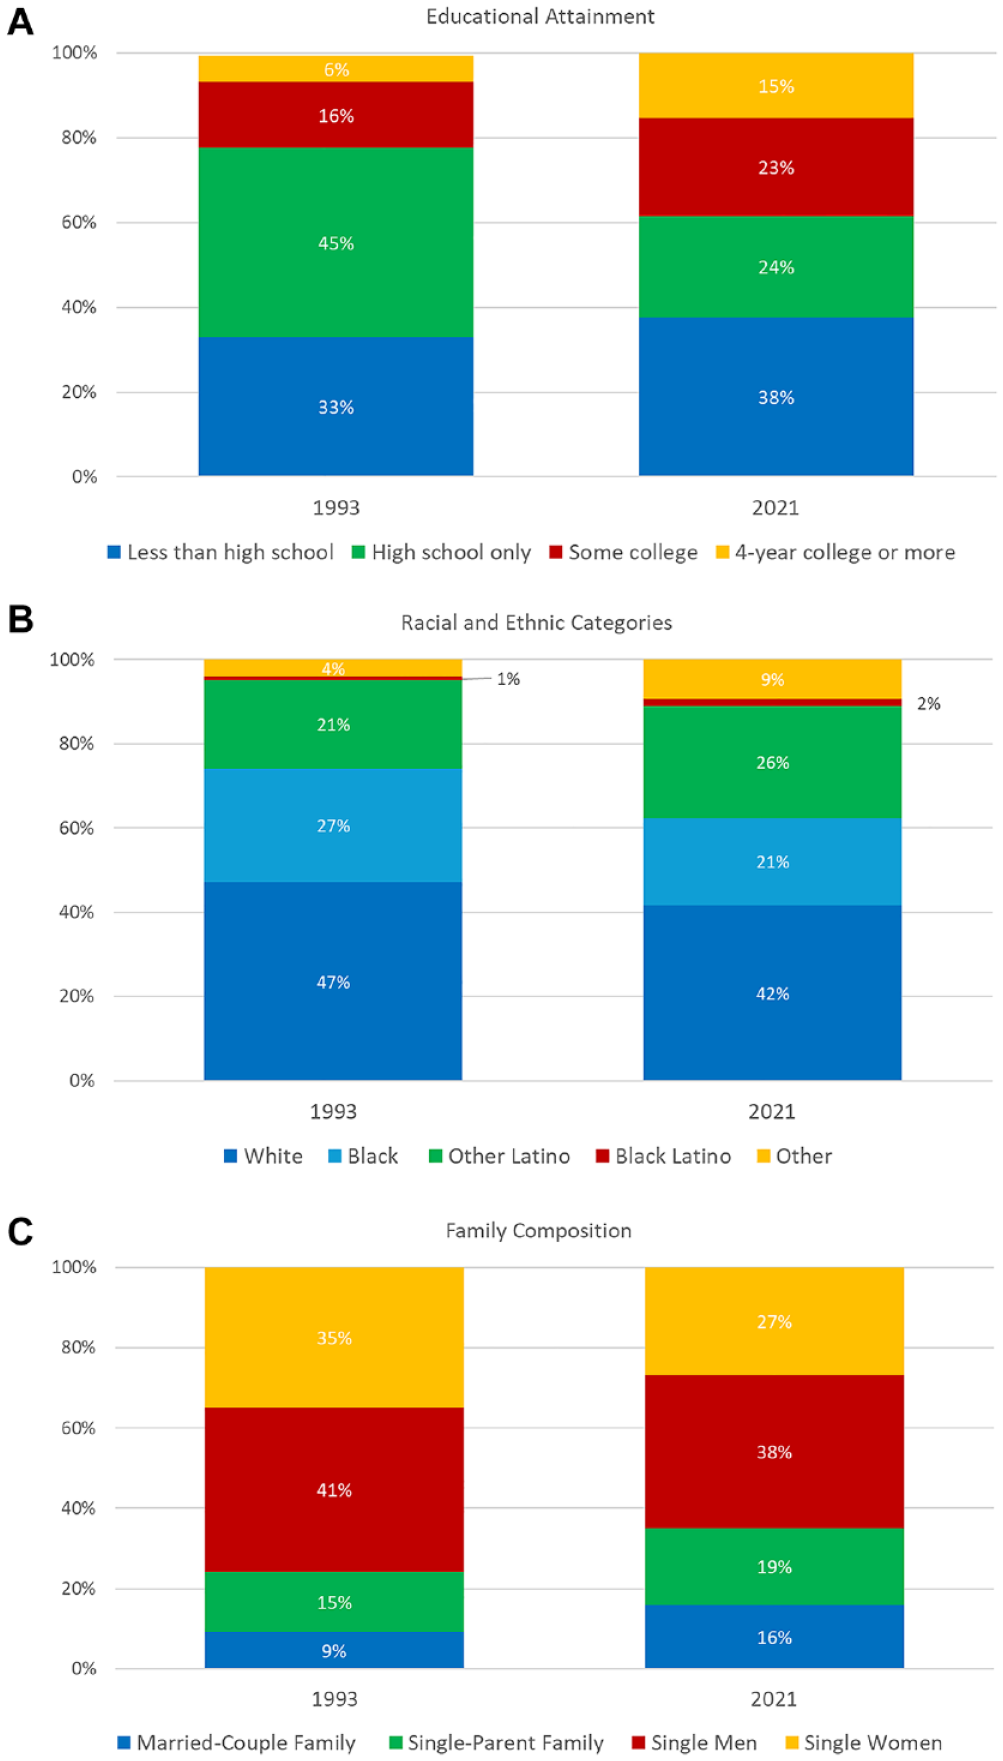
Composition of Families in Poverty
Lesson #2: The U.S. safety net is a patchwork of programs rather than a coherent set of policies
Much of the research analyzing the use of public assistance is limited. . . . It focuses only on one public assistance program, typically Aid to Families with Dependent Children. . . . [A]s a result we know little about the interactions between eligibility and recipiency across a variety of assistance programs. (Blank and Ruggles 1992)
Blank was best known for her work on Aid to Families with Dependent Children (AFDC) and welfare reform. At the same time, her writings also illustrate the importance of the full set of benefits for which families were eligible. The U.S. social safety net was not designed as a coherent system meant to prevent poverty and improve well-being. Instead, it is made up of a number of means-tested programs that were designed at different times with different goals and different intended (but partially overlapping) beneficiaries. In her work, Blank highlighted a fundamental duality to the social safety net: although these programs were designed independently, we have to consider them in totality to understand how we as a society do (or do not) support low-income households.
There is a lot going on in what we have come to call the “safety net.” 4 Low-income families with children might receive cash benefits through Temporary Assistance for Needy Families (TANF), the program that replaced AFDC, and low-income elderly or individuals with disabilities may be eligible for cash benefits through the Supplemental Security Income (SSI) program. Families can receive food assistance through the Supplemental Nutrition Assistance Program (SNAP), formerly called Food Stamps; through the Special Supplemental Nutrition Program for Women, Infants, and Children (WIC); and through school breakfast and lunch programs. They might receive public health insurance through Medicaid or the Children’s Health Insurance Program (CHIP). Finally, they might receive refundable tax credits through the Earned Income Tax Credit (EITC) or the Child Tax Credit (CTC). Many families participate in several of these programs, and it is rare for families to participate in only one (Moffitt 2016; Schmidt, Shore-Sheppard, and Watson 2024a). Figure 2, from Schmidt, Shore-Sheppard, and Watson (2021), illustrates patterns of self-reported program participation from the 2016 Current Population Survey Annual Social and Economic Supplement. 5 Among less-educated single-mother families with at least one family member enrolled in Medicaid, 63 percent also report receipt of SNAP, 61 percent are imputed to be eligible for refundable tax credits, and 21 percent report receipt of cash transfers through TANF or SSI. Only 11 percent do not report participating in any of these other programs.
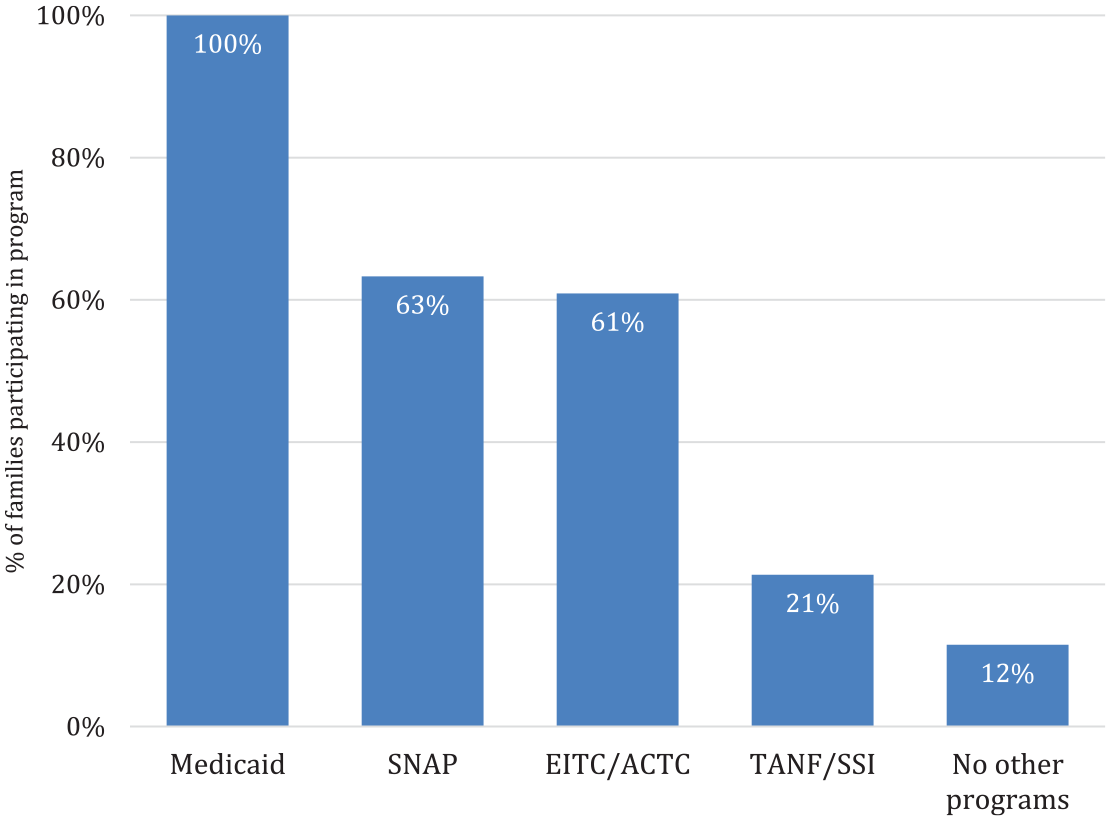
Participation in Other Safety Net Programs, Among Single-Parent Medicaid Recipient Families, 2016
In a world where families participate in multiple programs simultaneously, it is important to think about the value of the entire package of benefits for which families are eligible. Column 1 of Table 1 reprints Table 3.2 from ITAN (Blank 1997a, 96) and shows how, in 1994, benefits from different programs worked together to affect the material resources available to low-income families. In column 1, Blank considers a single-parent family in Maryland with no earnings and therefore no eligibility for the EITC—the household benefits are limited to AFDC and SNAP. In columns 2 and 3, she considers single parents with part-time and full-time work at minimum wage. Now EITC-eligible, these households receive fewer means-tested benefits. Columns 4 through 6 present the material resources for similar families in 2019. In comparison to 1994, earnings, the EITC, and the CTC play a much larger role, due to a higher minimum wage, an expanded EITC, and the adoption of the CTC. SNAP benefits are higher for families with no earnings but lower for working families since benefits phase out as earnings rise. TANF benefits have risen on paper in the state of Maryland, but as we discuss below, there is significant heterogeneity across states in the importance of cash welfare.
Effects of Combined Transfer Programs on Take-Home Income, Single Mother with Two Children

SOURCE: Data from Blank (1997a), U.S. Department of Labor (2023), Urban Institute (2022), eFile (n.d.), USDA Food and Nutrition Service (2023), Silberman (2018), Census Bureau, Federal Reserve Bank of Minneapolis, Shantz et al. (2020), Social Security National Press Office (2019), and Tax Foundation (n.d.).
NOTE: Estimates are for families in Maryland. We assume earners work at minimum wage ($4.25 in 1994 and $10.10 in 2019). Part-time work is defined as 1,250 work hours per year, and full-time work is defined as 2,000 work hours per year. 2019 SNAP calculations include both the standard and maximum shelter deductions. All amounts are in 1994 real dollars. Child care costs are excluded for simplicity.
Work by Schmidt, Shore-Sheppard, and Watson (2016, 2023) builds on that same idea, using a multiprogram safety net eligibility and benefit calculator. They use a simulated eligibility approach where benefits are imputed for a fixed national sample of single-parent families, assuming 100 percent take-up of benefits for which families are eligible. 6 This approach allows the isolation of policy-induced variation in generosity. Figure 3 reflects the total cash and food package for which a typical single-parent family would be eligible in 2019. The shaded areas (from bottom to top) reflect cash transfers through TANF, the federal EITC, the state EITC, the refundable portion of the CTC, and SNAP. It is clear that cash transfers through TANF make up only a relatively small part of the overall benefit package, even before accounting for incomplete take-up. Overall, the data show that analyzing one program in isolation might miss an important part of the story and that households must navigate an often complex and ever-changing system of programs to receive the full assistance for which they are eligible. We expect families to take advantage of multiple programs, but we do not always make it easy for them, as is documented in a growing literature on administrative burden. 7
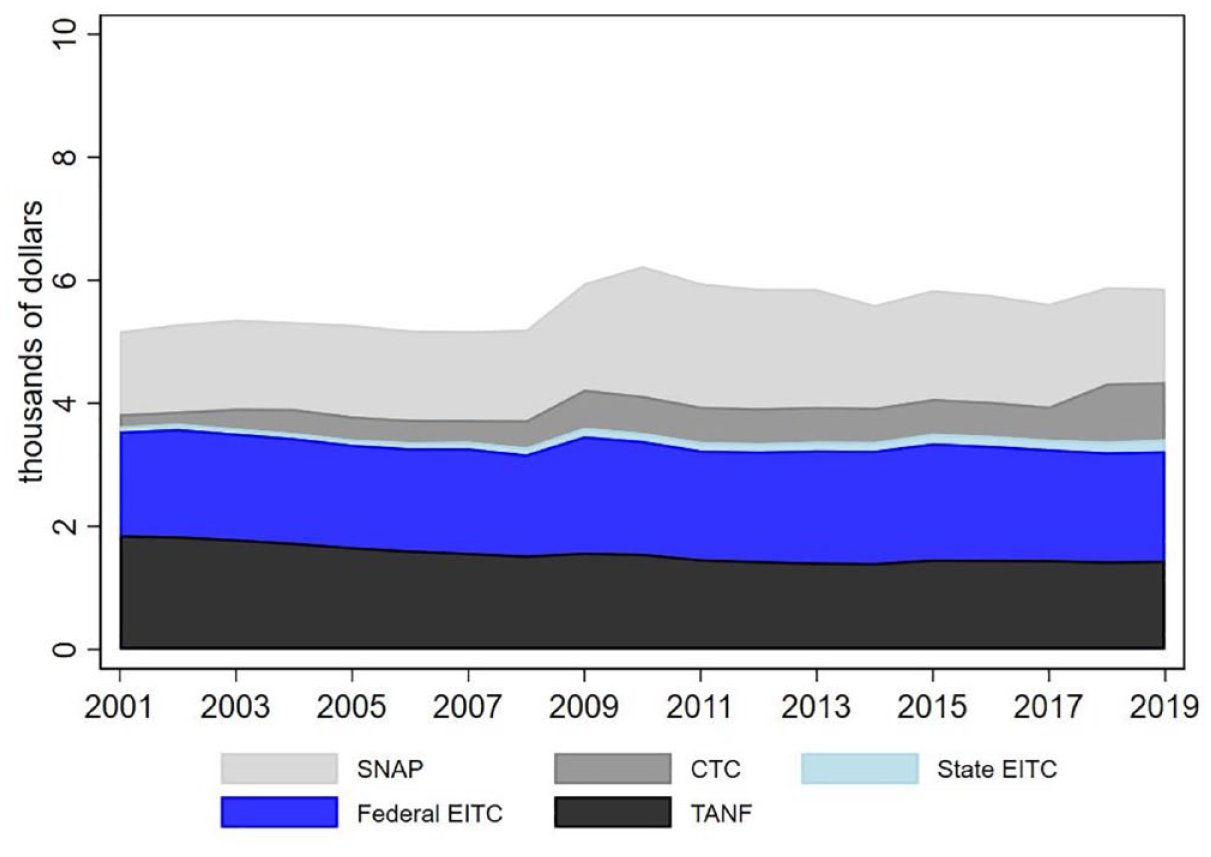
Imputed Safety Net Benefits by Program and Year, 2001–2019
Lesson #3: We will continue to shift away from cash toward in-kind benefits and toward programs emphasizing work
The current thrust of policy reform is to target existing programs more narrowly, limiting whom they serve, emphasizing services and noncash support over cash assistance, and demanding that recipients satisfy particular behavioral requirements. Thus, cash support for single parents becomes time limited and strongly linked to work behavior. (Blank 1997a, 220)
The Personal Responsibility and Work Opportunity Reconciliation Act (PRWORA) was signed into law in 1996, the culmination of Clinton’s promise to “end welfare as we know it.” ITAN was published in the immediate aftermath of welfare reform, and in the book and subsequent scholarship, Rebecca Blank wrote extensively about what we might expect to see in the following years: a continued shift away from cash benefits, additional expansions of in-kind benefits, and greater emphasis on work and other behavioral requirements as conditions of benefit receipt. 8
PRWORA replaced the old AFDC entitlement program with TANF. It changed the funding mechanism for the program from a matching grant to a block grant and imposed time limits, work requirements, and sanctions on recipients. It also gave states significant authority to experiment with their welfare policies. As expected, these changes led to a continued decline in the importance of cash assistance. Figure 4 presents calculations done by the Center on Budget and Policy Priorities (CBPP) that illustrate the number of families receiving cash benefits from AFDC/TANF for every 100 families with children under the federal poverty line. In 1996, 68 percent of these families received cash welfare; by 2019, only 23 percent did.
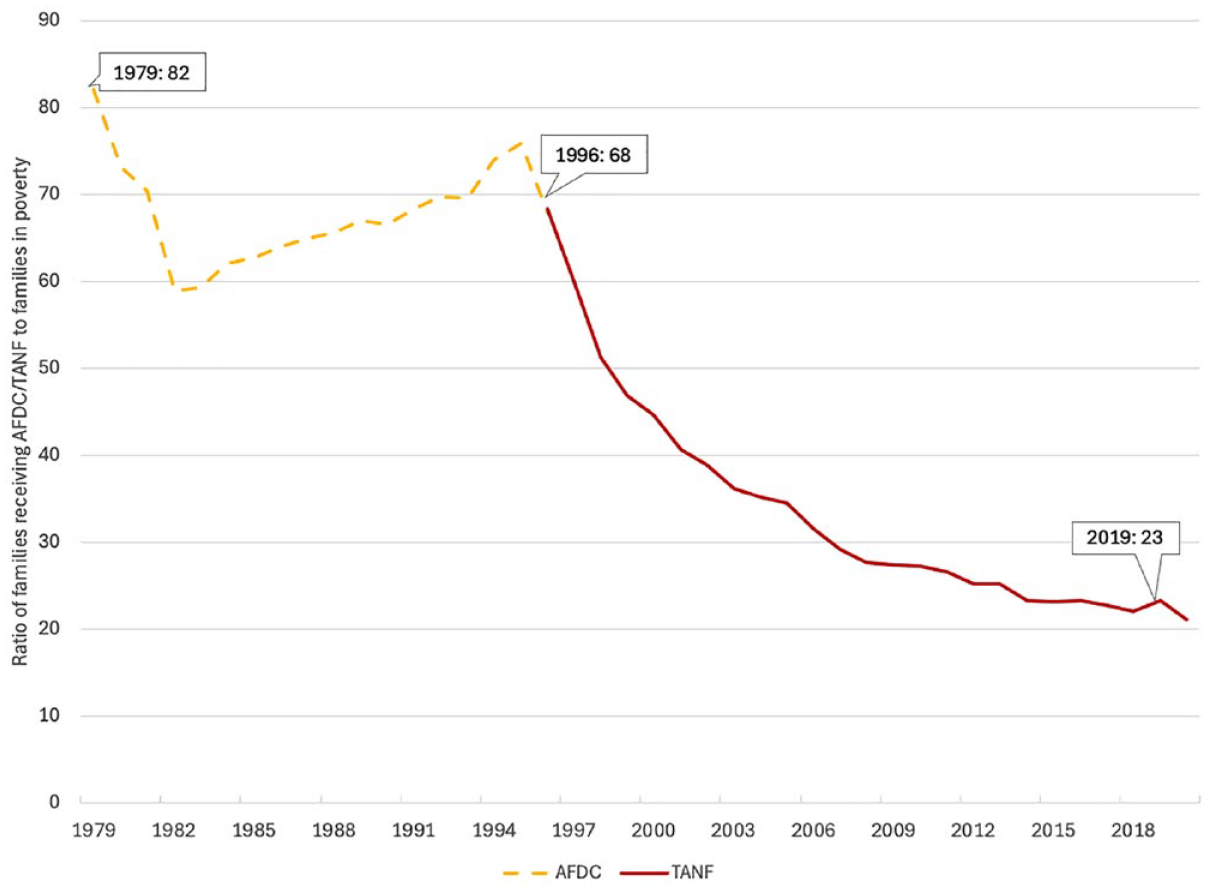
National AFDC/TANF-to-Poverty Ratio, 1979–2020
At the same time that TANF was falling in importance, major policy changes expanded other programs aimed at low-income families. For example, the 1997 Balanced Budget Act established the Children’s Health Insurance Program. The passage of the Affordable Care Act in 2010 was intended to expand Medicaid eligibility to everyone with income below 138 percent of the federal poverty level (FPL) as of 2014, although after the U.S. Supreme Court’s 2012 decision to make the expansion optional to the states, not all states took up the expansion. The CTC was initially enacted as a nonrefundable credit in 1998, but policy changes throughout the next decade expanded both the dollar amount and the partial refundability of the credit. The 2009 American Recovery and Reinvestment Act (ARRA) expanded the EITC, and between 1986 and 2020, state EITCs were enacted in many states. Figure 5 illustrates how caseloads in these programs grew as a result of these and other policy changes, significantly shifting the safety net away from cash toward in-kind benefits and tax credits conditioned on work (see also Hoynes and Schanzenbach 2018; Moffitt 2015). In addition, there have been recent efforts to increase or add work requirements to the in-kind programs, such as SNAP and Medicaid. 9
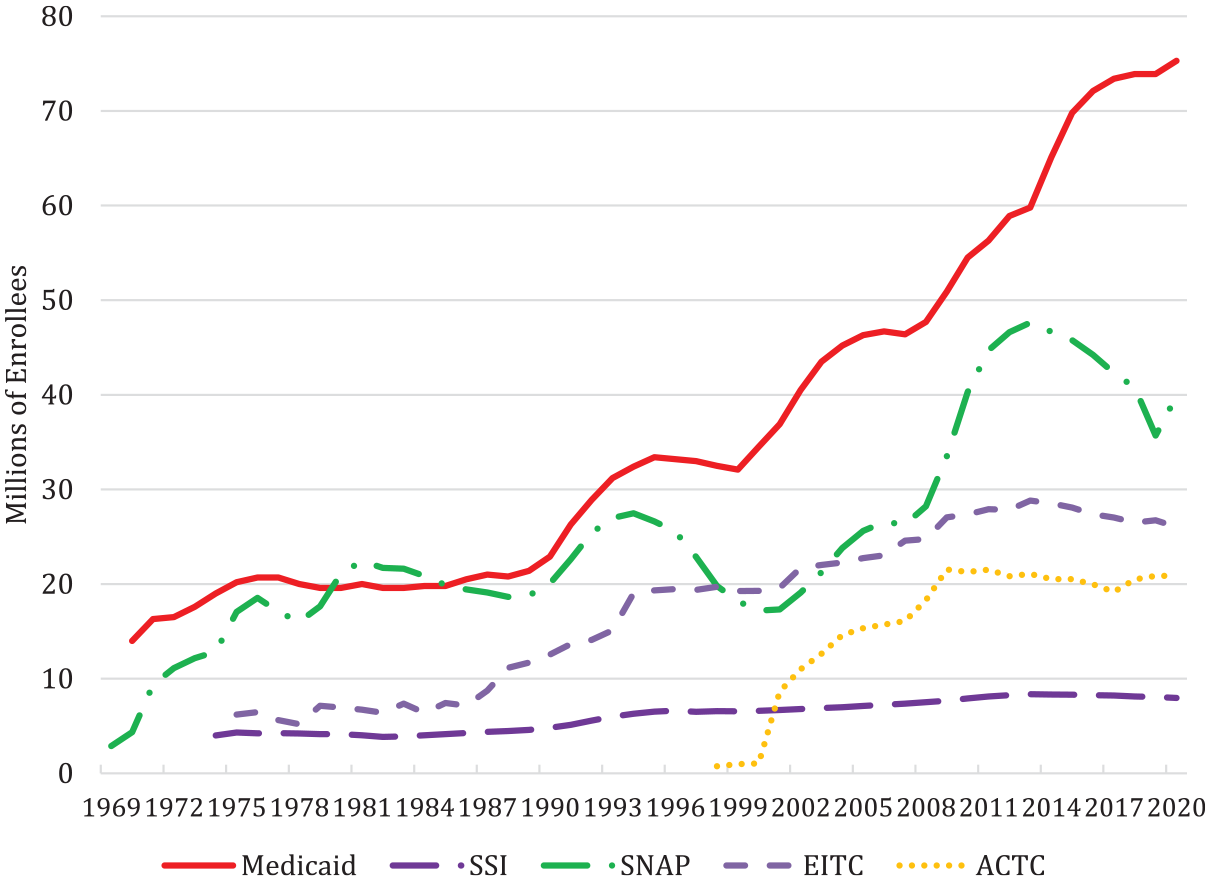
Program Caseloads, 1969–2020
One major exception to these trends was pandemic relief. During the pandemic, the U.S. government greatly expanded access to multiple assistance programs and the level of assistance that they provided (see Bitler, Hoynes, and Schanzenbach 2020, 2023). These changes directly and significantly improved household economic outcomes. For example, the SNAP program was expanded through higher benefits, more flexible determinations of eligibility, and additional emergency benefit allotments—all of which resulted in reduced household and child poverty (Wheaton and Kwon 2022). The expanded CTC provided much larger and unconditional cash payments to low-income families with children and reduced reported hardships and food insecurity (Ananat et al. 2022; Pilkauskas et al. 2022). In addition, these credits had, at most, a small impact on labor force participation (Ananat et al. 2022; Schanzenbach and Strain 2023). 10 Finally, the addition of federal Economic Impact Payments that gave expanded unconditional cash assistance to most kept many families out of poverty (Parrott 2022). The pandemic relief quickly provided cash transfers to families and demonstrated that providing these transfers could be effective in reducing poverty. 11
Lesson #4: Geographic differences in safety net benefits are important
The current major U.S. welfare program available to low-income households, AFDC, varies greatly between states. . . . Is it fair if the same household faces very different welfare options in different parts of the country? (Blank 1985)
The U.S. is different from many other industrialized countries in that much of the power in designing welfare policies is in the hands of subnational governments, primarily the states. This dispersion of program control has led to wide variation in program characteristics across localities. Rebecca Blank’s first published paper, in the Journal of Public Economics in 1985, focused on state-level differences in AFDC benefits and raised the question of whether the differences across states in the benefits available to low-income families were equitable. 12
Large differences across states in benefit generosity are still a defining feature of the U.S. social safety net. Figure 6 uses the safety net generosity calculator mentioned above and illustrates how average potential annual TANF benefits for a fixed national sample vary by state. As this analysis considers the same set of households, variation comes only from differences in program rules. Large variation exists, with states in the South being the least generous. Annual potential TANF benefits range from under $500 per year to more than $3,000.
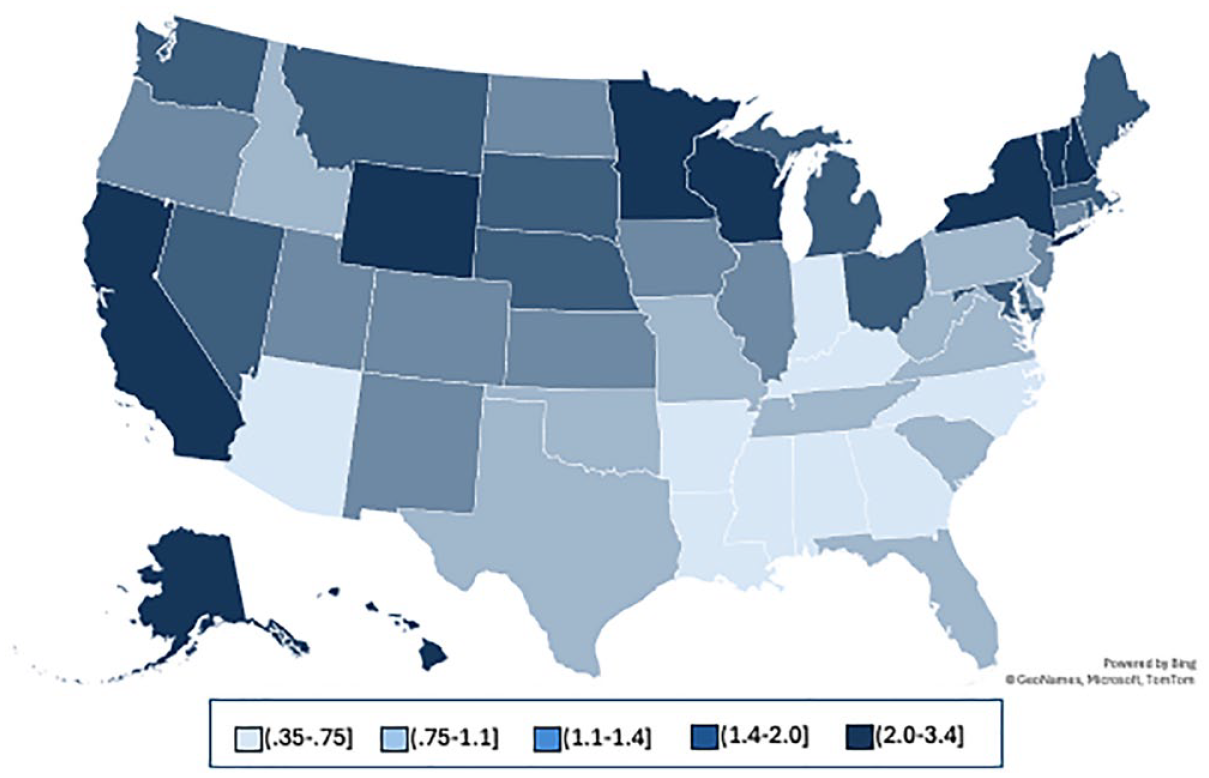
Average Potential Annual TANF Benefits (Thousands of $) for Simulated Sample, 2019
Rebecca Blank’s insights—about the patchwork nature of the safety net, as well as about which programs were likely to grow post welfare reform—are also important here. Figure A1 in the online appendix uses the calculator to illustrate the total cash-plus-food-assistance safety net package (including TANF, SNAP, and the federal and state EITC and CTCs). While there is still significant variation across states, the federal food assistance and tax programs work to offset these differences and make the minimum benefit level much higher than it would be under TANF cash assistance alone. The annual cash-plus-food-assistance benefit package per family ranges from almost $5,000 to just over $9,000. Overall, when states are given significant discretion over safety net generosity, we see large differences across states. However, the shift away from cash welfare toward federal programs like SNAP and the refundable tax credits helps to equalize these differences across states. 13
Lesson #5: Race plays an important role in the evolution of the safety net
. . . [M]uch of the impetus towards more centralized regulations and rules in the 1960s occurred because of concern over how these programs were being run by many states, where racist exclusions and arbitrary rule making were all too common. (Blank 1997a, 92)
As discussed by Rebecca Blank in ITAN, much of the design of the social safety net in the U.S. was shaped by race, a fact that, while well-understood by other social sciences, has not always been a principal focus in economic analyses. Black families have been excluded from participation in safety net programs via a variety of mechanisms, including program design (the ways in which the policies themselves are shaped by race), implementation (the ways in which individuals of different racial and ethnic groups may be treated differently by the execution of program rules), and economic context (the ways in which the systems surrounding the safety net might differ by race). For example, in a world where assistance is tied to work, differential employment opportunities by race may affect the way the safety net works in practice.
These issues were present at the beginning of the federal government’s involvement in antipoverty policies. In response to the Great Depression, a national program of income support for single mothers (that would be later renamed as AFDC) was created in 1935 with the passing of the Social Security Act. 14 Southern congressmen resisted a fully federal program and negotiated for significant state-level discretion in the eligibility requirements, benefit levels, and implementation. This state-level discretion allowed states to discriminate against Black and immigrant families both explicitly and implicitly (Floyd et al. 2021). For example, as the number of families on the caseload increased from the 1940s through the 1960s, many Southern states, and areas with large Black populations, imposed man-in-the-house and suitable home policies that excluded mothers who cohabited or had relationships with men. 15 The interpretation of these policies was often subjective, and their enforcement led to a disproportionate decline in participation of nonwhite families (Fuller 2023).
Starting in the 1960s, the War on Poverty, civil and welfare rights movements, a set of favorable Supreme Court decisions, and the establishment of legal services led to a reduction in these forms of discrimination and an overall rise in the AFDC caseload (Floyd et al. 2021; Goodman-Bacon and Cunningham 2021). 16 Figure 7 plots the share of families receiving cash assistance through AFDC and TANF that are Black. It indicates a steady increase in the share of Black families on the caseload from the 1950s to 1975, consistent with a loosening of discriminatory practices toward eligible Black families. Seeing more Black families utilizing welfare, many political figures and media institutions pushed back with negative, inaccurate, and racially coded portrayals of welfare recipients. 17 As attitudes towards AFDC recipients became increasingly racialized, AFDC experienced large budget cutbacks and a loosening of standardized procedures in the final decades of the 20th century, culminating in the passage of PRWORA and the creation of TANF in 1996 (Floyd et al. 2021). Figure 7 again shows the impact of these policy changes on the caseload. The share of Black families enrolled in AFDC begins to fall steadily after 1975. This trend persisted even as the racialized portrayal of welfare recipients was increasing.
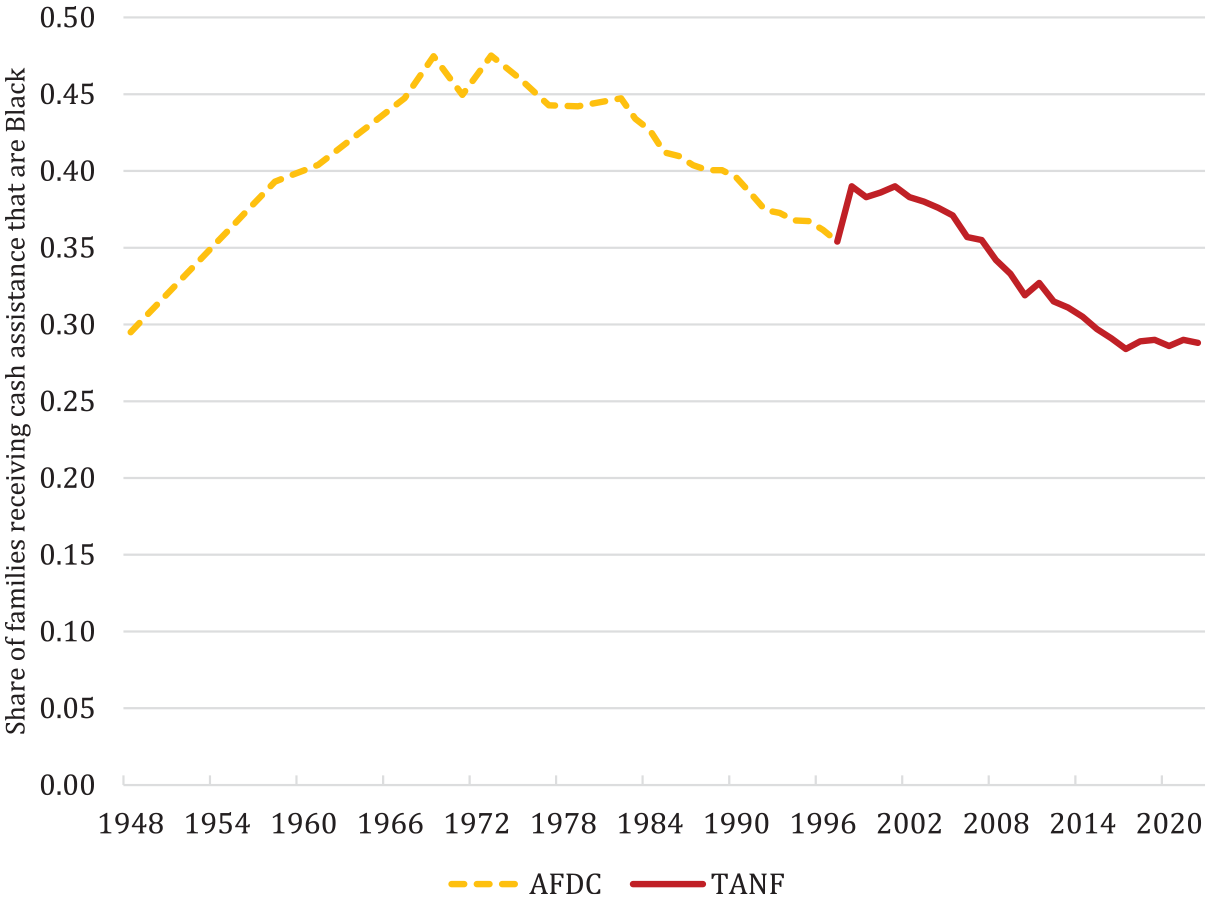
Percentage of AFDC/TANF Caseloads That Are Black, 1948–2022
As noted above, TANF continued the trend of increasingly localized cash assistance policies and also saw a decrease in federal oversight. Recent research has quantified the impact of providing states with more discretion over welfare policy on heterogeneity in program generosity by race. Evaluating the first 20 years of TANF, researchers found that a higher share of Black recipients in a state leads to a smaller amount of TANF funds spent on cash assistance (Hardy, Samudra, and Davis 2019) and an increase in funds spent on discouragement of single-parent households (Parolin 2021). These benefit differences play a significant role in the Black–white poverty gap. In addition, aspects of the implementation of programs that allow for discretion also produce local differences by race. Black TANF recipients are more likely to be sanctioned and report worse experiences in work programs than white TANF recipients (Bonds 2006; Schram et al. 2009). Moreover, research has shown that these differences in generosity do not apply exclusively to cash assistance. Administrative burdens often reduce the efficacy of the social safety net in helping minority families rebound from adverse events (Parolin, Cross, and O’Brien 2023). For example, the social safety net was less protective in reducing poverty rates of Hispanic and immigrant households during the Great Recession (Bitler, Hoynes, and Kuka 2017), and SNAP provided smaller benefit increases to Black and Hispanic households during COVID-19 (Bitler, Hoynes, and Schanzenbach 2023).
Finally, Blank’s work highlighted the importance of race in understanding both the sources of poverty and the efficacy of the social safety net in alleviating it. In ITAN, Blank points out how discrimination in housing, employment, and education often increase the likelihood that minority households fall under the poverty line and also limit their ability to pull themselves out of it (Blank 1997a, 21). The systems working in tandem with these social programs often cause differing levels of program impact and participation by race. For example, Kuka and Stuart (2022) show that Black unemployed workers are less likely to take up unemployment insurance benefits than are white unemployed workers. These results are partially explained by lower pre-unemployment earnings and differences in region of residence. More optimistically, program expansion can reduce racial disparities. Hardy, Hokayem, and Ziliak (2022) find that EITC expansions led to a larger increase in employment for Black households compared to white households and, as a result, reduced the Black–white income gap for households in the bottom half of the income distribution. Buchmueller et al. (2016) show that the Affordable Care Act Medicaid expansion reduced racial gaps in health insurance coverage.
Rebecca Blank’s Lessons About Scholarship
Lesson #6: Better measurement improves how we conceptualize and fight poverty
Always remember that measurement matters. (Blank 2010)
When Rebecca Blank was named the Eleanor Roosevelt Fellow in 2010 by the American Academy of Political and Social Science, she ended her induction remarks (Blank 2010) with the above statement. The importance of effective measurement can be clearly seen in Blank’s work on defining poverty. Until recently, U.S. policymakers and researchers defined the poverty threshold as three times a family’s subsistence food budget, a statistic derived from data compiled in 1955. This measure was invariant to changes in taxes and in-kind benefits, as well as to changes in the composition of household costs, including rising child care and housing prices, and as such provided an overly simplistic understanding of poverty. Blank noted in 2008 that “the official poverty thresholds are numbers without any valid conceptual basis” (Blank 2008). Further, since social assistance was shifting away from cash benefits toward in-kind and tax credits, using this measure led to an inaccurate belief that the social safety net did nothing to reduce poverty.
For years as an academic, Blank pointed out the issues with the official poverty measure and suggested changes. When she joined the Obama administration in 2009 as the under secretary of the Commerce Department for Economic Affairs, she proposed that the government establish a new additional measure: the Supplemental Poverty Measure (SPM). The SPM provides a broader definition of poverty that, most importantly, incorporates programs and policies that impact household resources (i.e., taxes, in-kind benefits, child support payments, and work expenses [Blank and Greenberg 2008]).
With its broader consideration of household resources and expenses, the SPM provides a much more accurate measure of poverty and of economic hardship and a clearer link to policymaking. A Congressional Research Service Report in 2022 pointed out that “the official poverty measure provides a consistent historical view of poverty in the United States, but the SPM may be better suited to helping congressional policymakers and other experts understand how taxes and government programs affect the poor” (Dalaker 2022, 1). Because of Blank’s work on the SPM, annual census poverty reports now show the number of people removed from (or falling into) poverty by each individual program and type of expense (see, for example, Shrider and Creamer 2023). 18 The SPM was a key benchmark used to compare policies in the 2019 National Academies Consensus Study Report, A Roadmap to Reducing Child Poverty. It also allowed scholars to determine the relative importance of various pandemic-era programs on poverty reduction (e.g., Bitler, Hoynes, and Schanzenbach 2023) and to measure the impact of the termination of those programs on poverty rates.
Lesson #7: We should study both costs and benefits
. . .[I]t is striking how frequently the argument “this program has one bad effect and therefore should be abolished” is made, without a recognition that there may be benefits to these programs that offset their costs. . . . To judge the effectiveness of public assistance programs, we need to look at both their advantages and their disadvantages and weigh them together. (Blank 1997a, 134)
In ITAN, Rebecca Blank expresses frustration with the existing debate over welfare policies, which often focused on the negative effects and disincentives of programs and paid no attention to the benefits. This emphasis on program disincentives was partly due to the misperceptions about those in poverty discussed earlier in Lesson #1. If people mistakenly believe that individual behavior rather than unfortunate circumstances cause poverty, they are predisposed to focus on the incentive costs of programs rather than the benefits. Furthermore, this focus on individual behavior shifts attention from children, who are more likely to experience poverty than any other demographic group and who have little control over household resources.
However, this emphasis was also due in part to the state of the economics literature on public programs at that time. Figure 8, reprinted from Aizer, Hoynes, and Lleras-Muney (2022), shows the evolution of economics research published in top field and general-interest journals on safety net programs. From 1970 through 2000, the research landscape was clearly dominated by papers on incentives. But over the 20 years from 2000 to 2020, papers examining benefits become more prevalent. Research can more effectively inform public policy if that research can provide evidence on the benefits of these programs as well as the costs.
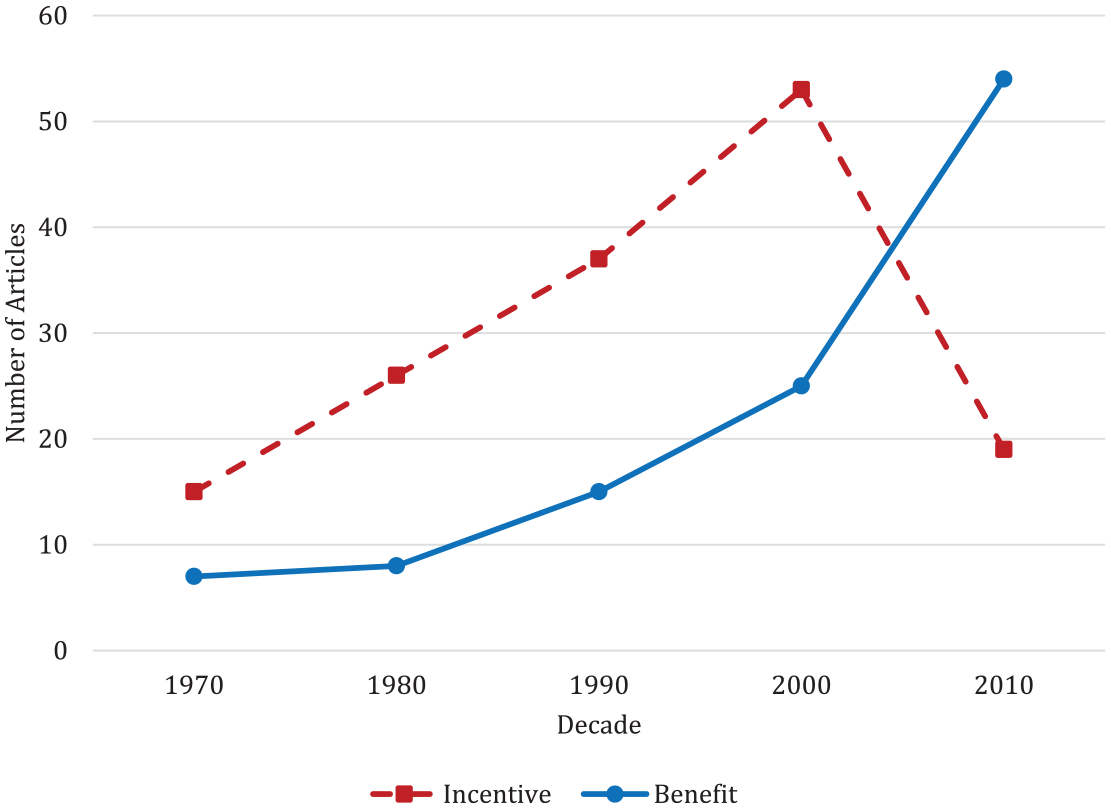
Research Articles on Incentives and Benefits over Time
Lesson #8: High-quality research is important
Rather than viewing social science as a group of competing studies which all say different things (the view one sometimes receives in the popular media), there are ways to distinguish between good and bad research; one should give serious attention to those results based on the most credible research methodologies, and give less attention to other conclusions. (Blank 1997a, xxii)
The importance of high-quality, credible research is a theme in much of Rebecca Blank’s work. One major contribution of ITAN is its persuasive use of social science methods and the ways in which Rebecca Blank was able to convey research findings clearly to policymakers.
Since the publication of ITAN, there has been a substantial increase in the number of articles written about safety net programs. Figure A2 in the online appendix uses the data from Aizer, Hoynes, and Lleras-Muney (2022) to illustrate the number of papers focused on different programs, in five-year increments. A few key points emerge. First, the relative size of safety net programs influences the choice of researchers to study those programs. For example, as cash assistance through TANF shrank, fewer papers were written about the program (see also Ziliak [2016] on this point). We see a similarly increasing research profile on SNAP, EITC, and Medicaid as these programs grow in size and become a more important component of the safety net.
A second point is that the structure of programs affects the ability to estimate causal effects. The substantial variation across states and over time in the generosity of AFDC benefits discussed above made it easier for scholars to analyze the effects of AFDC on a number of outcomes. Programs that varied only at the federal level were more difficult to study and required research designs that found within-program control groups. Examples include the county-level rollout of the Food Stamp Program analyzed by Hoynes and Schanzenbach (2009) and comparisons between families with different numbers of children to analyze effects of the EITC (see, for example, Evans and Garthwaite 2014; Hoynes, Miller, and Simon 2015). The dramatic increase in papers on Medicaid in the past 10 years of the sample is partly due to the greater importance of the program but also partly due to the 2012 Supreme Court decision that made the ACA Medicaid expansion optional to the states, a decision that launched hundreds of papers examining the expansion in a difference-in-differences framework.
In addition, the work of Rebecca Blank strongly influenced the overall trend of research on cash assistance through AFDC and later TANF. Her first paper on this topic was published in 1985, and she wrote extensively about it in the years to follow. Of the papers that make up this time series, a large number were written by Blank, cite her work, or thank her for comments or for providing data.
Lesson #9: “Nothing works” seriously misinterprets history
Out of a frustration with persistent poverty, a nihilistic response has emerged that “nothing works” or, perhaps more appropriately, “nothing the federal government does to fight poverty works.” “Nothing works” seriously misinterprets history and ignores the real successes we have achieved. It also ignores thirty years of knowledge about what works and what does not, accumulated through observation, experience, and program evaluation. (Blank 1997a, 6)
Our final lesson learned from the work of Rebecca Blank, which appears in the introduction of ITAN, was what she considered to be the third and final lesson that emerged from her recounting of the facts about poverty and policy in the U.S. To her, the statement “Nothing works” reflected bad science. We see this statement as encapsulating the motivation behind so much of Rebecca Blank’s extensive and influential body of work: from the creation of the SPM, designed to silence cynics who argued that social programs have no effect on well-being; to her own original scholarship that helped us understand how social programs worked and helped measure the impacts of welfare reform; to her tireless efforts to translate economists’ research into terms that could be understood by policymakers and the general public. We also see it as a rallying cry for those of us working in this area. Pushing back against the notion that “nothing works”—through our research and through the way in which we communicate evidence to policymakers and the general public—is one of the best ways we can honor Rebecca Blank’s remarkable intellectual legacy.
*Refers to online appendix.
Supplemental Material
sj-docx-1-ann-10.1177_00027162241291377 – Supplemental material for Understanding the Social Safety Net: Lessons from the Work of Rebecca Blank
Supplemental material, sj-docx-1-ann-10.1177_00027162241291377 for Understanding the Social Safety Net: Lessons from the Work of Rebecca Blank by Leslie McGranahan, Diane W. Schanzenbach, Paul N. Courant, Lucie Schmidt and Julia Yates in The ANNALS of the American Academy of Political and Social Science
Footnotes
NOTE: We are grateful to Diane Whitmore Schanzenbach and to participants in the Authors’ Conference in Memory and Honor of Rebecca M. Blank for helpful comments and suggestions and to Lily Smetzer and Kate Leafstrand for excellent research assistance.
Supplemental Material
Supplemental material for this article is available online.
Notes
Paul N. Courant is Edward M. Gramlich Distinguished University Professor Emeritus of Economics and Public Policy, Harold T. Shapiro Collegiate Professor Emeritus of Information, faculty associate in the Institute for Social Research, and provost emeritus at the University of Michigan. Courant’s research covers tax policy, poverty and income distribution, gender differences in pay, and university budgeting systems.
Lucie Schmidt is Robert A. Woods Professor of Economics at Smith College and a research associate at the National Bureau of Economic Research. She is a labor and health economist and has written extensively on social safety net programs in the U.S. with a particular focus on interactions between safety net programs.
Julia Yates is an economics doctoral student at the University of Michigan. Her research interests include low-income households and the U.S. social safety net with a focus on how program administration impacts household behavior.
References
Supplementary Material
Please find the following supplemental material available below.
For Open Access articles published under a Creative Commons License, all supplemental material carries the same license as the article it is associated with.
For non-Open Access articles published, all supplemental material carries a non-exclusive license, and permission requests for re-use of supplemental material or any part of supplemental material shall be sent directly to the copyright owner as specified in the copyright notice associated with the article.