
Abstract
Rising opioid mortality coincides with reported rises in child maltreatment since the early 2000s. I consider mechanisms that link the opioid epidemic and child maltreatment, focusing on social disorganization, the geographic and temporal patterns of opioid mortality, and community-level substance use and child maltreatment. I combine data from the ACS, CDC WONDER, and NCANDS in county-level analyses. I show a positive association between adult opioid mortality and child maltreatment that varies over time, and the results suggest a stronger association between opioid mortality and child maltreatment in high-poverty counties. Counties with high levels of residential mobility show negative associations between opioid mortality and child maltreatment when mortality levels are low. These findings bolster arguments that child maltreatment can be decreased by reducing poverty and opioid mortality and by increasing opportunities for residential mobility.
From 2007 through 2017, Child Protective Services (CPS) agencies in the United States oversaw more than 43 million child maltreatment 1 reports. CPS agencies receive federal and local funding and aim to provide services that help protect children from abuse and neglect. CPS generates child maltreatment reports after screening referrals of abuse and neglect in their local county, and each report documents a unique child maltreatment investigation (U.S. Department of Health & Human Services 2021). The rate of child maltreatment reporting climbed 133 percent from 24 per 100,000 children in 2002 to 32 per 100,000 in 2017; the bulk of the growth has occurred since 2010. Notwithstanding the overall rise in reports of child maltreatment, the number of substantiated child maltreatment reports has decreased since the 1990s, albeit leveling off since 2009 (Finkelhor, Saito, and Jones 2020). However, substantiation status of child maltreatment reports is not predictive of child behavioral outcomes like anxiety, depression, anger, socialization, daily living skills, teen parenthood, HIV-risk behaviors, drug use relative to reports where there is an investigation without substantiation (Hussey et al. 2005; Kugler et al. 2019). This suggests that solely focusing on substantiated reports would overlook the extent of children at risk of experiencing adverse outcomes.
Meanwhile, the number of children living with an adult with an opioid 2 use disorder increased by 30 percent from 2002 to 2017 (Bullinger and Wing 2019). Adult drug overdose deaths rose from about 9 to 23 per 100,000 between 2002 and 2017 (author calculation using CDC WONDER [Centers for Disease Control and Prevention Wide-ranging ONline Data for Epidemiologic Research] Multiple Cause of Death), and a larger share of children live with extended family as a consequence of the opioid epidemic (Dolbin-MacNab and O’Connell 2021). These trends demonstrate the increasing social burden of the opioid epidemic in the United States and underscore the need to understand the impact of the epidemic on children in individual households and within communities.
Individual-level research that links adult opioid use to child maltreatment omits the role of social structure. Social structure considerations go beyond the individual characteristics of adults or children and extend to temporal considerations like the chemical composition of drugs (reformulation of OxyContin in late 2010) or community-level considerations such as poverty levels. Research establishes associations between trends in child maltreatment reports—often with a focus on foster care—and drug overdose deaths by noting their spatial and temporal co-occurrence in counties across the U.S. (e.g., Ghertner et al. 2018; Radel et al. 2018; Bullinger and Ward 2021). Work on this relationship is limited in multiple ways. First, it does not situate drug-related mortality and child maltreatment associations in broader social theory and contexts. For example, analyses that omit shifting economic conditions and drug supply variation obscure the role played by underlying drivers of each trend and how those relationships may change over time. Second, child maltreatment reports, rather than foster care placements or substantiated child maltreatment reports, provide a wider measure to understand community-level risks to children and families. Foster care entry is an indicator that a specific child may have had a difficult or risky home environment at a point in time. Additionally, the share of maltreatment reports translating into foster care services decreased about one in seven in 2001 to about one in twelve by 2019 (U.S. Department of Health & Human Services 2003, 2021). Estimates put the range of children who enter for reasons other than maltreatment between 8 and 35 percent depending on various thresholds and whether estimates are at the national or state level (Drake et al. 2021). Given that the trend in maltreatment reports more closely matches the trend in opioid mortality than foster care entry, it may be a better measure to understand the relationship between the phenomena at the community level. Third, data constraints, such as restricted data access and a lack of geographic identifiers, also impede scholarship on these trends. State- or county-specific studies advance understanding for their local context but might miss mechanisms that move national trends. Research that takes advantage of geographic identifiers by combining datasets, using inclusive measures, and situating research in social context would allow researchers to acutely understand contemporary opioid and child maltreatment trends.
Social disorganization theory offers a framework for how the spatial context of drug use affects child maltreatment. The core premise of social disorganization is that concentration of disadvantage within a community (especially poverty and population turnover via residential mobility) leads to the disruption of social control or how effectively a community regulates the behavior of its inhabitants. The reduction of social control thus results in crime and delinquency increases within that community. Communities with less population turnover and smaller shares of the population in poverty have higher social control and reinforced community norms than communities facing high rates of population turnover and poverty. In other words, social disorganization is a structural explanation of how community-level measures like residential mobility, ethnic heterogeneity, and poverty influence social control, which then affects individual-level behaviors and outcomes (Shaw and McKay 1942; Sampson and Groves 1989; Lowenkamp, Cullen, and Pratt 2003) such as substance use or child maltreatment. Maltreatment researchers argue that social control mediates structural factors like residential mobility, ethnic heterogeneity, and economic status to influence child maltreatment rates even when accounting for individual-level variables like family income (Maguire-Jack and Font 2017).
While social disorganization may help explain increases in child maltreatment, research also emphasizes the social consequences of so-called deaths of despair at the community-level. Deaths of despair references dramatic increases in premature deaths attributed to alcohol, suicide, and drugs—particularly opioids–since the turn of the 21st century (Monnat 2016). These deaths were concentrated among non-Hispanic White adults with low levels of educational attainment (Case and Deaton 2015; Monnat, this volume), but such deaths have become widespread among other sociodemographic groups (Plunk, Grucza, and Peglow 2018). Despite the evidence that community-level substance use and social disorganization operate through social control to influence child maltreatment (Freisthler and Gruenewald 2013; Morton 2013), it is unclear whether these associations are independent or complementary and how widespread they may be.
This project advances our understanding of child maltreatment and contemporary opioid mortality trends by considering the role that social disorganization has in undermining community-level protections like social control. I merge county-level data from the American Community Survey (ACS), CDC WONDER Multiple Cause of Death (Centers for Disease Control and Prevention Wide-ranging Online Data for Epidemiologic Research; a mortality vital statistics database), and National Child Abuse and Neglect Data System (NCANDS), to test county-level associations between opioid mortality, social disorganization, and child maltreatment reports from 2007 to 2017. In this article, I seek to answer the following research questions: (1) Is county-level opioid mortality associated with child maltreatment reports from 2007 to 2017? (2) Is the relationship between opioid mortality and child maltreatment different across years? (3) Is the relationship between opioid mortality and child maltreatment different by county-level poverty and residential mobility? I use a fixed effects approach to address these questions and account for unmeasured, time-invariant factors that pertain to each county. Testing these research questions joins research on opioid use and social disorganization to examine how the opioid epidemic may explain child maltreatment trends in the U.S.
Child Maltreatment
Child maltreatment is of great consequence because it affects the health and well-being of young people increasing their propensity for depression and anxiety disorders, substance use, and poorer physical health (Norman et al. 2012). Caregiver substance use is a key risk factor in cases of child maltreatment (Wells 2009). From 2000 to 2017, the share of foster care entries attributable to parental drug use more than doubled from 15 to 36 percent (Meinhofer and Angleró-Díaz 2019). Additionally, child maltreatment is intergenerational because those who experience maltreatment as children are at increased risk of having children who experience maltreatment (Belsky 1993). Researchers also emphasize community-level factors that predict child maltreatment, finding that child maltreatment is concentrated in disadvantaged areas. Key community-level metrics of disadvantage linked to child maltreatment are poverty, single-parent-headed households, population turnover, and educational attainment (Coulton et al. 2007; Maguire-Jack and Font 2017; Fong 2019).
The U.S. Opioid Epidemic
Deaths of despair offers a structural explanation of the geographic patterning of the contemporary opioid crisis, supplementing the decades of research on the opioid crisis in the U.S. Deaths of despair research focuses on the coincidence of joblessness, overprescription of opiates, and deteriorating social ties that cause feelings of despair and loneliness leading to drug—especially opioid—use, alcohol use, and suicide (Case and Deaton 2017). Overprescribing began in the 1990s as members of the American Pain Society published research marking pain as the fifth vital sign 3 (Max et al. 1995). Subsequently, organizations such as the World Health Organization (WHO) called on medical professionals to treat pain more aggressively, and the medical professionals did so, largely by prescribing opioids (Becker 2018). Overprescription treated pain, but the population at greatest risk of using prescription opioids was also susceptible to the consequences of economic restructuring. Economic restructuring came via globalization and automation during the 1990s and early 2000s propelling imports from countries such as China. These trends dramatically changed prospective careers for Americans and resulted in higher unemployment and lower wages for manufacturing-focused labor markets (Autor, Dorn, and Hanson 2013). Deaths of despair literature connects these events and argues that occupations staffed disproportionately by rural non-Hispanic White workers dissipated (Case and Deaton 2015), and the workers who comprise them suffer from widespread chronic pain (Becker 2018). The offshoring of stable careers and exportation of alternative opportunities translated into joblessness and poverty, leading to breakdowns in support mechanisms (Scutchfield and Keck 2017).
The opioid epidemic has become more pervasive over time and categorized into three 4 separate “waves.” The first wave (1990s–2010) related most closely with prescription opioids, the second wave beginning in 2010 with rises in heroin use and mortality coinciding with the reformulation of OxyContin, and the third wave beginning in 2013 with rises in synthetic opioids like fentanyl (Ciccarone 2019). Recent studies argue that family and household structure may protect against several types of opioid use, including prescription pain relievers, heroin, and injecting heroin (Chapman, Verdery, and Monnat 2021). Rises in midlife mortality attributable to drug mortality extends beyond non-Hispanic White adults to include non-Hispanic Black, Hispanic, Native American, Alaskan Native, Asian, and Pacific Islander adults (Woolf et al. 2018; Monnat, this volume). Opioid-related mortality also reaches people with higher levels of educational attainment (Plunk, Grucza, and Peglow 2018), and although opioid mortality is spatially concentrated (Ruhm 2018), it affects people across the rural-urban spectrum (Monnat 2019). From 2015 to 2017, counties with populations of at least 250,000 account for more opioid-related mortality per capita than smaller counties (CDC 2018).
Social Disorganization: A Place-Based Theory of Substance Use and Child Maltreatment
Social disorganization theory posits that socially disorganized places lack normative structure and that a community’s shared values influence informal social control. In socially disorganized places, then, the influence of community norms over individual behavior is diminished, leading to upticks in crime and delinquent behavior (Sampson, Raudenbush, and Earls 1997). Moreover, communities low in formal (e.g., institutional enforcement of community regulations or laws) social control are often also low in informal (e.g., internalization of community norms and values) social control (Sampson 1986), as community resources to augment formal institutions are dependent on the resources of the already disadvantaged community. For example, a community with less income will have less funds to operate formal institutions like CPS that help regulate behavior.
Child maltreatment scholars document several ways that community-level disadvantage and disorganization translate to child maltreatment and explain the spatial concentration of child maltreatment (e.g., Coulton et al. 2007; Maguire-Jack and Font 2017). Living in a disadvantaged neighborhood is associated with higher risk of maltreatment regardless of individual-level poverty status (Maguire-Jack and Font 2017). Socially disorganized communities influence parenting styles such that places with low social control are supportive of harsher discipline for children (Caughy and Franzini 2005). Socially disorganized places influence the effectiveness of local institutions that support positive parenting (Burchinal et al. 2008) and parental investment (Dupere et al. 2010), which are associated with child maltreatment.
Yet research demonstrates mixed support of associations between substance use and social disorganization (e.g., Jones and Adams 2018; Wickes and Hipp 2018). Much of this research focuses on alcohol use, but those that do study opioids find a positive association between family fragmentation and poverty with opioid use in New York neighborhoods (Cerdá et al. 2013). One study that considers temporal trends within a single city shows a positive association between ethnic heterogeneity, population density, and poverty rates with child maltreatment referrals and drug possession at the neighborhood level (Freisthler, Kepple, and Holmes 2012).
Although authors do not always explicitly relate substance use and social control, evidence shows spatial correlation between opioids and other substance use with child maltreatment (e.g., Wolf et al. 2016; Ghertner et al. 2018). Wolf et al. (2016) finds that from 2001 to 2011, prescription opioid hospitalizations are associated with an increased risk of hospitalizations indicative of child maltreatment at the zip code level within a single state. Ghertner et al. (2018) find a similar pattern expanding the analysis to include counties across the U.S. from 2011 to 2014. In a third study, researchers use a series of opioid measures as independent variables (e.g., opioid-related emergency department visits and opioid mortality) as well as multiple dependent variables (e.g., child maltreatment reports and foster care entry) (Bullinger and Ward 2021). Although the results suggest that many of the opioid measures have a positive association with foster care entry, the results regarding child maltreatment reports and opioid mortality find no association. This is perhaps due to different samples between the foster care and child maltreatment report analyses. However, another study focused on the effects of reformulation of OxyContin finds a similar pattern of a positive association for foster care entry and no association for child maltreatment reports (Mackenzie-Liu 2021).
Community-level substance use decreases community social control, which then influences child maltreatment (Freisthler, Needell, and Gruenewald 2005; Freisthler et al. 2008; Freisthler, Michaels, and Wolf 2022). Community-level substance use weakens social control because it may deter institutions that strengthen social controls while also attracting markets that weaken social controls (Freisthler, Needell, and Gruenewald 2005). For example, communities characterized by alcohol and illicit drug use are associated with less social control and lead to higher rates of child maltreatment, independent of individual behaviors, because families in these communities have increased childcare burden (Freisthler et al. 2008). In another example, alcohol outlet density is associated with child maltreatment at the community level, and communities with substance use services are more likely to have lower rates of child maltreatment relative to communities without services (Morton 2013). Opioid hospitalizations predict child maltreatment referrals in a sample of Ohio neighborhoods where concentrated disadvantage was a characteristic of such communities (Freisthler, Michaels, and Wolf 2022).
The Present Study
This article argues that certain characteristics of communities, especially poverty and residential mobility, put children within those communities at greater risk of opioid-related consequences such as maltreatment. This study deepens understanding of these phenomena, by testing county-level relationships nationally from 2007 to 2017; previous work has focused on single states or counties (e.g., Wolf et al. 2016; Freisthler, Michaels, and Wolf 2022) or on brief timespans (e.g., Orsi et al. 2018). Also, other research on opioids and child outcomes tends to focus on foster care entries; however, many children enter care without previously having engaged with the CPS system at all (Drake et al. 2021). Aggregate child maltreatment reports are a measure of risk of harm in a community and, as such, are better suited to this study.
Outside of studies on the effects of reformulation of OxyContin, scholars have not given enough attention to how the association between child maltreatment and the opioid crisis has changed over time. This point is especially salient given the various waves of the opioid crisis (see Ciccarone 2019). During the waves of the crisis, the availability and riskiness of each opioid vary, suggesting that the relationship between opioid mortality and child maltreatment may vary over time. Lastly, even research that broadly considers community-level child maltreatment and opioid associations typically focus on individual-level processes (e.g., parental substance use, child maltreatment reporter sensitivity to risks; Ghertner et al. 2018), which often omit structural and community-level factors that may help explain how aggregate-level characteristics influence individual-level outcomes.
This analysis investigates social disorganization theory as a possible explanation of how community-level characteristics may influence the link between child maltreatment and opioid mortality. Moreover, research that studies these topics does not consider how community disadvantage may moderate the association between substance use and child maltreatment. To begin to address these gaps, I test three hypotheses.
1) There will be a positive association between county-level opioid mortality and child maltreatment reports independent of county-level disadvantage, time trends, and fixed county-level characteristics. Support for this hypothesis is mixed in the literature with null and mixed findings within studies (e.g., Rebbe et al. 2020; Bullinger and Ward 2021; Bullinger, Wang, and Feder, this volume) or positive findings (e.g., Wolf et al. 2016; Ghertner et al. 2018; Orsi et al. 2018).
2) The relationship between opioid mortality and child maltreatment will change across time in concert with the waves of the opioid epidemic. I expect a stronger association between opioid mortality and child maltreatment during the first wave of the epidemic because of how much more common prescription opioid use is than heroin or synthetic opioid use (Ciccarone 2019).
3) The relationship between opioid mortality and child maltreatment will differ by county-level social disorganization. Communities with higher disorganization would predict a stronger association between mortality and child maltreatment due to lower levels of social control. I specifically test residential mobility and poverty given their strong ties to child maltreatment literature (e.g., Coulton et al. 2007; Freisthler, Michaels, and Wolf 2022).
Data and Methods
Data
I combine secondary data derived from the NCANDS, 2007 to 2019; the ACS, 2007 to 2017; and CDC WONDER Multiple Cause of Death, 2007 to 2017, to test my analyses. Social Explorer provides ACS data, which supplies five-year estimates of county-level demographic variables for every county in the U.S. I center the five-year estimates to account for each year from 2007 to 2017 (e.g., ACS 2005–2009 for 2007; ACS 2013–2017 for 2015). NCANDS collects data from CPS child maltreatment reports. Each of the fifty states as well as Washington, D.C., and Puerto Rico participate, but participation varies over time because data submission is voluntary. I use aggregate county-level counts of child maltreatment reports for each calendar year for counties that send files to NCANDS from 2007 to 2017. These submission files have a minimum of 1,000 reports for each county year. Contents of the submission files are censored for counties with fewer than 1,000 reports. To address this, I include counties in supplemental analyses that do not have a submission file each year and vary minimum report thresholds ranging from 250 to 1,000 in increments of 50. A threshold of 250 nearly doubles the number of counties included in the study and increases the county-years by about 60 percent but only increases the population covered from 70 to 76 percent of the U.S. (results not shown; all analyses are available upon request). This supplemental approach has the strength of including more counties, and thus generalizability, but introduces the weakness of unbalancing the data and potentially including incomplete yearly report counts in the analysis. The preferred analyses in the main text are more conservative than the supplemental analyses. Finally, CDC WONDER provides yearly county-level opioid mortality. I use the International Classification of Diseases, 10th edition (ICD-10) codes relevant to opioid overdose including underlying cause of death codes X40-44, X60-64, X85, Y10-Y14 and contributing cause of death codes T40.0-T40.4, T40.6 (see Substance Abuse and Mental Health Services Administration [SAMHSA] overdose data guidelines for full details https://mnprc.org/wp-content/uploads/2019/01/using-icd-10-codes-to-assess-opioid-related-overdose-deaths.pdf). CDC collects public health data that it receives from fifty-seven jurisdictions around the United States; jurisdictions operate at the state- and local-level which retain location specific information such as counties.
Analytic sample
Due to NCANDS censorship, I restrict the analytic sample to counties that submit a file each year from 2007 to 2017. After merging ACS, CDC WONDER, and NCANDS data, NCANDS data censorship limits the sample to 513 counties per year for a total of 5,643 county-years. There are no counties omitted from this sample due to missing or censored CDC WONDER data. These counties comprise about 70 percent of the total population and 72 percent of opioid-related mortality in the U.S. from 2007 to 2017. This sample also accounts for about 30.2 million child maltreatment reports, about 86 percent of the maltreatment reports with a specified county FIPS (Federal Information Processing Standard) code or 70 percent of all reports after accounting for reports without county identifiers. Despite the omission of many counties, these data describe phenomena for a substantial majority of opioid mortality, child maltreatment reports, and the population overall.
Dependent and independent variables
To calculate the dependent variable, I take the log of number of child maltreatment reports per 100,000 child (population under age 18) capita within each county-year to normalize the variable distribution. I use ACS estimates to calculate the child population, and NCANDS provides the number of child maltreatment reports. In preferred analyses, I lag this variable so that the independent and control variables predict reports in the following year which provides temporal ordering in the analysis (unlagged analyses are available upon request).
The primary independent variables are opioid mortality, year, and social disorganization. Due to the left-skew of opioid mortality, I measure mortality by taking the log of the quantity opioid-related mortality per 100,000 adults plus one within each county-year. The year variable ranges from 2007 to 2017, coded categorically. In Figures 1 through 3, below, I show only years that match key periods of the opioid crisis for simplicity, but all years are included in all analyses. Following the practices of previous research (e.g., Lowenkamp, Cullen, and Pratt 2003; Freisthler, Kepple, and Holmes 2012), I measure social disorganization using poverty rate (families of 100,000 below the federal poverty line), racial composition, and residential mobility (whether household of 100,000 moved in past year) within each county-year. I calculate racial/ethnic heterogeneity using the Blau Index (Blau 1977). The index is calculated by subtracting the squared portion of each subpopulation (e.g., non-Hispanic White, Black, Asian, Hispanic, and other) from one; this results in a measure ranging from zero to one, where low values indicate a homogeneous population and higher values indicate a heterogeneous population. To ease interpretation, I multiply this score by 100 so that it is a 0 to 100 scale.
Control measures
I incorporate continuous control measures proportionate to county-year populations for each of the following, ages 25 and older with at least a bachelor’s degree, married family households, and unemployment (calculated for those who are 16 and older in the labor force) of 100,000 population. In the first set of analyses, I include the poverty, residential mobility, and racial composition as controls. In subsequent analyses, they are included as controls when not part of the interaction. For example, in the models that interact poverty and opioid mortality, residential mobility and racial composition are included as controls.
Analytic strategy
First, I provide descriptive statistics overall by select years in Table 1, including transformed and untransformed variables (see full year-by-year breakdown in Appendix C, Table C1). Next, I estimate ordinary least squares (OLS) regressions predicting child maltreatment reports with fixed effects (see estimates in Appendix A, Tables A1 and A2). Fixed effects account for local policies and other unmeasured, time-invariant characteristics of the county and year. I transform the dependent and independent variables in a nonlinear fashion; thus, the coefficients produced by regression are not necessarily indicative of significant associations (Mize 2019). To test for significant associations, I visualize marginal effects at representative values (MER) to show the predicted outcomes with 95 percent confidence intervals. I produce figures for interactions between year and opioid mortality, residential mobility and opioid mortality, as well as poverty and opioid mortality in Figures 2 through 3, below. Tables outlining the MER estimates and tests of differences are included in Appendix B, Tables B1, B2, and B3. I include control variables and county and year fixed effects in all figures.
Descriptive Statistics Including Transformed Variables and Select Years (N = 5,643)
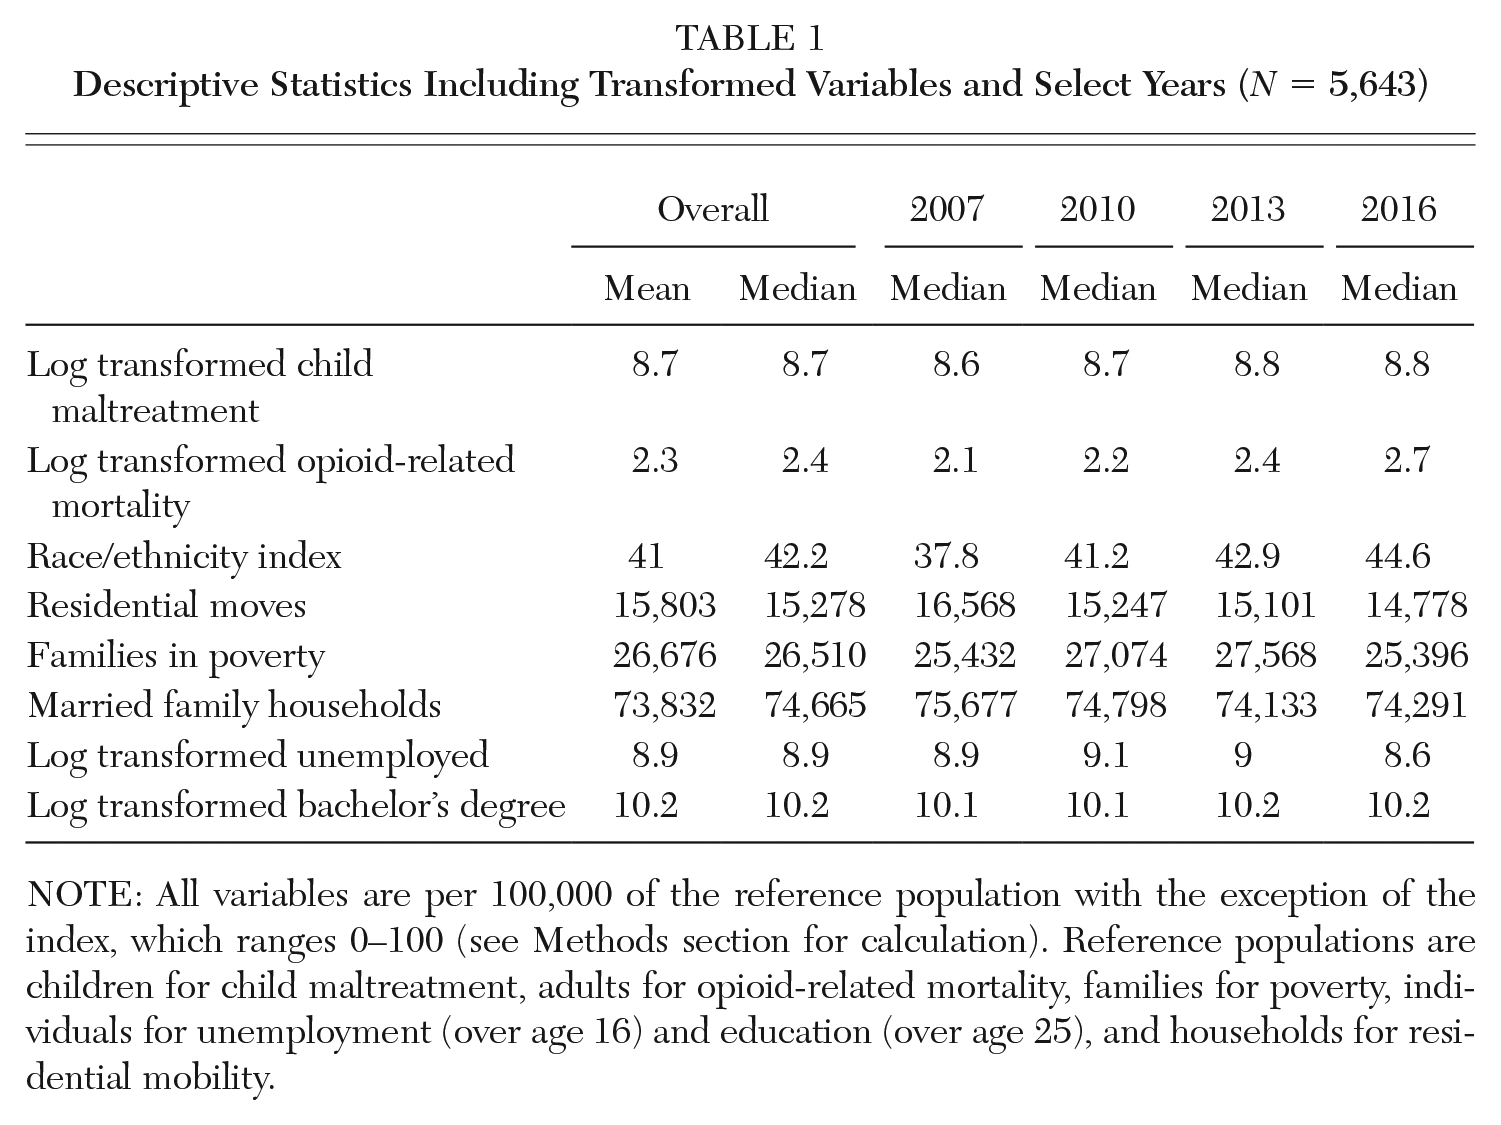
NOTE: All variables are per 100,000 of the reference population with the exception of the index, which ranges 0–100 (see Methods section for calculation). Reference populations are children for child maltreatment, adults for opioid-related mortality, families for poverty, individuals for unemployment (over age 16) and education (over age 25), and households for residential mobility.
Results
In Table 1, I show mean and median descriptive statistics for the overall sample and then median for select years. The median number of child maltreatment reports across the sample increases over time rising from 5,671 in 2007 to 6,946 by 2016 (Appendix C, Table C1) where the logged value shifts from 8.6 to 8.8 in the same span. There is a similar trend for opioid mortality as the transformed rate rises from 2.1 in 2007 to 2.7 in 2016. The share of families in poverty varies during the period with its peak in the early 2010s. Residential mobility declines through the span. Unemployment increases following the housing crisis but is at its lowest level in 2016. The share of people with a bachelor’s degree or more increases across the span. Counties also become more heterogeneous across the period. In all, these statistics show rising trends in child maltreatment reports and opioid mortality, but poverty and residential mobility do not follow the same pattern on the aggregate. For a full breakdown including all years and untransformed variables see Appendix C, Table C1.
Figure 1 shows the back-transformed interaction between opioid mortality and year predicting child maltreatment reports. The x-axis indicates years ranging from 2007 to 2017 with tick marks for every two years. The y-axis indicates the number of predicted child maltreatment reports per 100,000 children. The legend shows symbols and their corresponding opioid mortality percentile. Red open circles indicate the 10th percentile or lowest level of opioid mortality, blue closed circles indicate 25th percentile, open gray squares indicate the median, black closed squares indicate the 75th percentile, and open turquoise triangles mark the 90th percentile. The tails stemming from each symbol show the 95 percent confidence intervals, and the confidence intervals are wider for the highest- and lowest-percentiles reflecting less precise estimates at the poles. For each year, the lowest percentile of opioid mortality predicts the fewest number of reports with a positive gradient as the percentile rises. Another overt trend is that the predicted number of reports rises across time except for in 2009. Although there is a common trend for opioid mortality, differences are not significant in all years. Differences are least pronounced in 2009 and 2017 where there are no statistically significant differences across opioid mortality percentiles. This figure shows support for the first and second hypotheses that opioid mortality have a positive association with child maltreatment reports and that year moderates the relationship between mortality and child maltreatment reports.
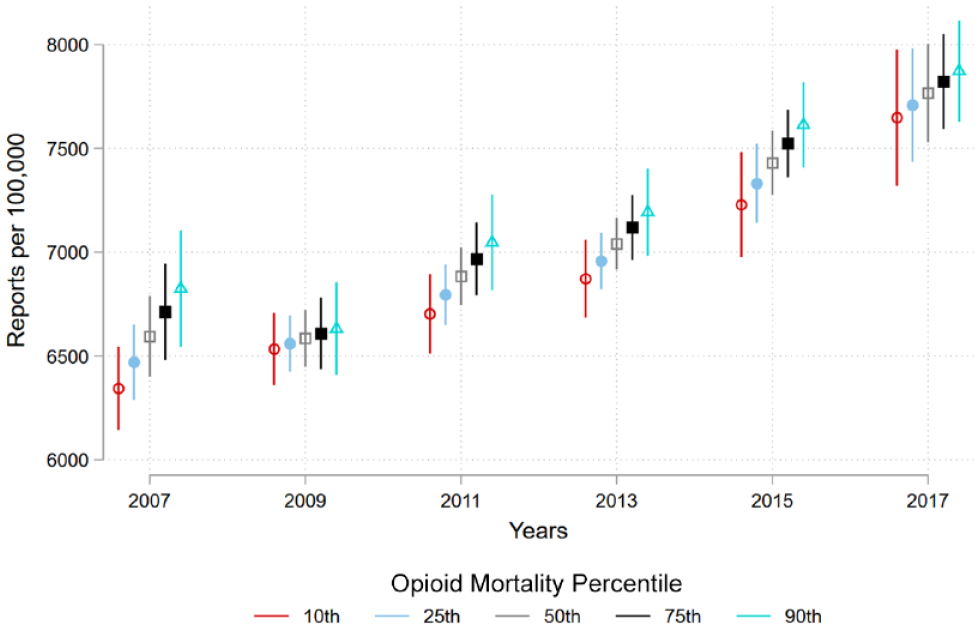
Predicted County-Level Child Maltreatment Reports by Percentile of Opioid Mortality and Year, 2007–2017
Figure 2 plots the back-transformed interactions between opioid mortality and residential mobility. The x-axis shows the percentile of residential mobility including tick marks at 10th, 25th, 50th, 75th, and 90th. The legend is identical to Figure 1. The y-axis shows the predicted number of child maltreatment reports per 100,000 children. The general pattern is cone shaped. As counties have more residential mobility, opioid mortality predicts fewer child maltreatment report for counties in the 50th percentile and lower while the point estimates for the 75th percentile remain the same and increase for the 90th percentile. Additionally, differences across opioid mortality within each mobility percentile vary such that higher levels of opioid mortality predict more reports relative to lower levels of opioid mortality with no significant differences in low residential mobility counties with greater differences as counties have higher residential mobility. These findings do not support hypothesis 3. Though the association between child maltreatment and opioid mortality differ by residential mobility, the relationship between residential mobility and child maltreatment is static at high levels of opioid mortality but has a decreasing association at the median to low levels of opioid mortality.
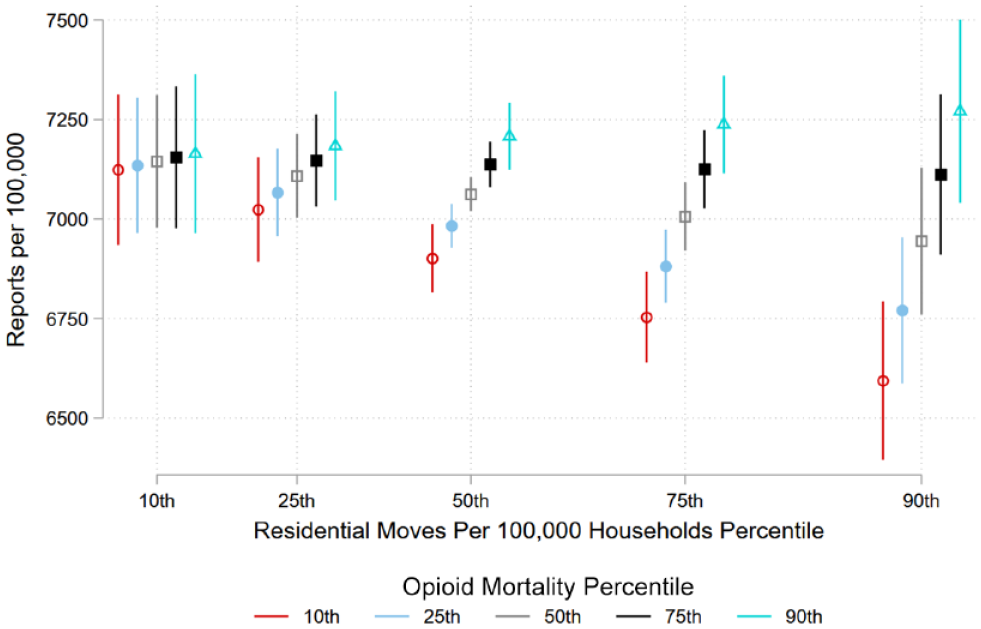
Predicted County-Level Child Maltreatment Reports per Capita by Percentile of Opioid Mortality and Residential Mobility
Figure 3 visualizes the back-transformed interactions of opioid mortality and families in poverty predicting the number of child maltreatment reports. The y-axis charts the number of child maltreatment reports per 100,000 children and the x-axis charts the 10th, 25th, 50th, 75th, and 90th percentiles of family poverty. The legend provides the five markers for opioid mortality percentile going from 10th to 90th identical to Figures 1 and 2. Overall, there is a strong positive association between families in poverty and child maltreatment reports showing that relative to the 10th percentile, counties in the 90th percentile are predicted to have nearly 3,000 more child maltreatment reports per 100,000 children. There are differences within poverty percentile by opioid mortality percentile with evidence of a moderative effect. At higher poverty levels, higher levels of opioid mortality predict more reports relative to low levels of mortality. This suggests that counties with high levels of poverty are more susceptible to child maltreatment related to opioid mortality. Conversely, estimates of the 10th and 25th percentile counties show no statistically significant differences across opioid mortality. These results support hypothesis 3 that the relationship between opioid mortality and child maltreatment reports is stronger in socially disorganized counties.
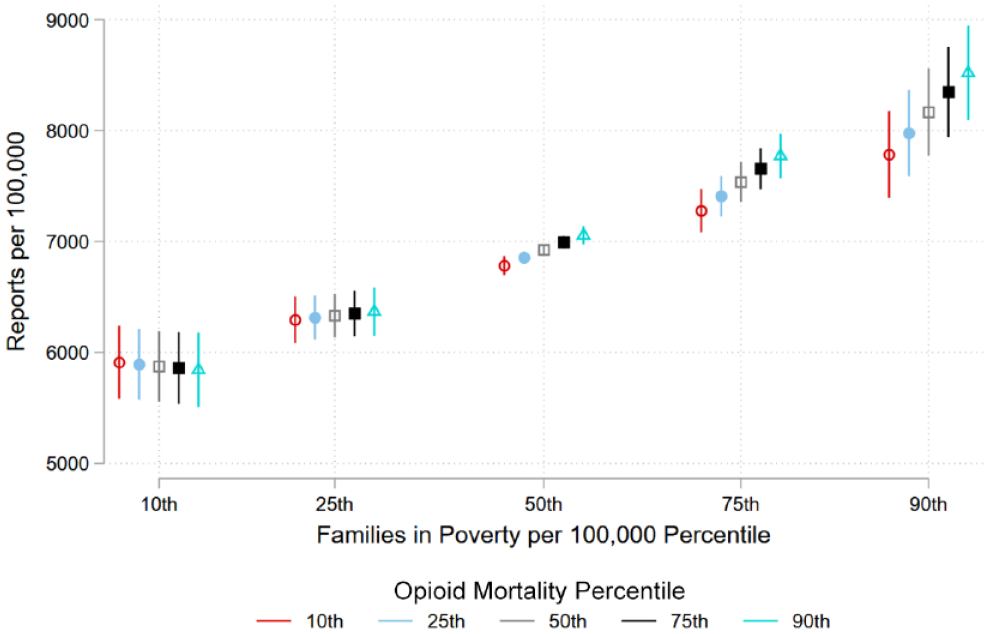
Predicted County-Level Child Maltreatment Reports per Capita by Percentile of Opioid Mortality and Families in Poverty
Limitations of This Study
Recent research indicates that ACS estimates may be less reliable than previously thought (Reardon, Townsend, and Fox 2017). Although these estimates may have flaws, they are of the best available in the U.S. for population-level demographic measures. The primary analyses of this study cover about 70 percent of the population of the U.S. and a similar proportion of opioid mortality and child maltreatment. In supplemental analyses with less conservative restrictions, I expand those numbers to nearly 86 percent of all child maltreatment reports and counties that cover 76 percent of the United States population finding substantively the same results (result available upon request). Even so, the counties that are omitted from this study may operate differently from those included and lead to different conclusions. A similar critique could be levied against the counties that are not included due to censoring on opioid mortality. This literature would benefit from a closer look into these particularly rural areas, especially because much of the community-level child maltreatment research focuses on urban areas. Some studies on this topic find differences across the rural-urban continuum (e.g., Orsi et al. 2018), and this study disproportionately excludes rural counties. Finally, changes to policy or efforts to raise awareness may drive up reports. This may help measure child maltreatment more accurately but may not represent actual changes in child maltreatment trends. However, after accounting for county and year fixed effects, these results show support for statistically significant associations between the independent variables and child maltreatment reports.
Discussion
Across all analyses (see Figures 1, 2, and 3), increases in opioid mortality predict higher rates of child maltreatment reporting. The ongoing argument for this link among child maltreatment scholars is that communities facing substance use challenges have lower levels of social control (Freisthler et al. 2008; Morton 2013; Freisthler, Michaels, and Wolf 2022), which leads to higher rates of child maltreatment. Given the breadth of this study, the results suggest that this argument is generalizable to most of the U.S. during this study period. These results show evidence of an independent relationship between opioid mortality and child maltreatment outside of other county-level metrics of disadvantage. However, several studies do not find the same result (e.g., Rebbe et al. 2020; Bullinger and Ward 2021; Freisthler, Michaels, and Wolf 2022). This incongruence may be explained by several factors such as differences in both geographic and/or temporal samples. For example, Bullinger and Ward (2021) use opioid mortality and child maltreatment reports within California, finding null results despite finding positive results using other measures in the national portion of the study.
In Figure 1, I show evidence that the relationship between opioid mortality and child maltreatment differs across calendar years. The weakest associations between mortality and maltreatment occur in 2009 and 2017 compared to the strongest in 2007. Recent research on families and opioid use show upticks in illicit prescription pain reliever use through 2006 or 2008 depending on the subpopulation before steady declines, followed by upticks in heroin use with an apex from 2011 to 2014–2015 depending on the subpopulation (Chapman, Verdery, and Monnat 2021). This suggests that at the height of these waves when use is most common for each drug (Ciccarone 2019), they share a stronger association with child maltreatment than when waves begin. The temporal relationship is complex because there are both supply-side and demand-side considerations with respect to the opioid epidemic whereby both economic distress (demand side) and opioid supply (supply side) predict opioid mortality (Monnat 2019, this volume). While this analysis finds that time moderates the relationship between opioid mortality and child maltreatment, it does not test specific explanations for this trend. Researchers could refine this finding by studying changes between different opioids across time while taking into account local context given the variation across place in the U.S.
I find mixed support for my third hypothesis that disorganization moderates the relationship between opioid mortality and child maltreatment. I find evidence that county-level residential mobility reduces child maltreatment reports when opioid mortality is low but has no influence on the association when mortality is high (Figure 2). This finding works opposite of what social disorganization literature would predict because population turnover leads to lower levels of social control. This finding is consistent with another study focused on Ohioan neighborhoods where researchers offer an individual-level explanation that people who experience opioid overdose may be less likely to move than people who do not (Freisthler, Michaels, and Wolf 2022). An alternative individual-level possibility is that people who move more often have greater access to inpatient mental health and substance use services relative to people who do not move (Yuan and Manuel 2018), and other community-level research compliments this by noting that areas with substance use services have weaker associations between substance use and child maltreatment (Morton 2013). A macro perspective on this finding is that trends in residential mobility have been decreasing for decades (Frost 2020) as have homeownership rates (Fischer 2002). Combined with a growing literature on disadvantaged residents being stuck in undesirable housing (e.g., Sharkey 2013; Huang, South, and Spring 2017), this may signal that scholars should consider residential mobility differently than in the past. The influence of residential mobility is likely different across counties and an avenue of research may be to consider the link between mobility and child maltreatment by county-level economic disadvantage (see Maguire-Jack and Font 2017) or substance use service access.
For the second finding on social disorganization, opioid mortality has a greater effect on child maltreatment in high-poverty counties than low-poverty counties (Figure 3). The moderative effect of poverty joins the theoretical framework of child maltreatment literature where scholars argue that community-level disadvantage (Maguire-Jack and Font 2017; Dupere et al. 2010) and substance use (Freisthler, Needell, and Gruenewald 2005; Freisthler, Kepple, and Holmes 2012) decrease social control leading to higher rates of child maltreatment. However, this research had yet to consider the interaction between opioid mortality and poverty across counties. Given the negative finding on residential mobility and positive finding on poverty, the results are mixed for hypothesis 3 that social disorganization moderates the relationship between opioid mortality and child maltreatment.
Opioid mortality and child maltreatment are geographically and temporally patterned in similar ways. This is critical because the populations at greatest risk of opioid use are of common childbearing ages (Verdery et al. 2020), foster care placements increasingly implicate guardian substance use (Meinhofer and Angleró-Díaz 2019), and children living with caregivers with an opioid use disorder continues to rise (Bullinger and Wing 2019). The consequences of maltreatment are far reaching. Not only are children at risk of a slew of adverse outcomes such as mental health disorders and substance use (Norman et al. 2012), but they are also at increased risk of having children who then experience maltreatment (Belsky 1993). These analyses signal that communities facing high levels of poverty and opioid mortality may have generations of child maltreatment ahead because of the intergenerational nature of child maltreatment, greater effect sizes in counties of higher poverty rates, and children living in disadvantaged communities being likely to grow into adults who live in similar communities (Chetty et al. 2014).
This study has policy implications at the community-level. The causes of the opioid epidemic are complex including macro-level demographic (Cherlin 2014; Verdery and Margolis 2017) and economic shifts (Case and Deaton 2020), family conflict and breakdown, deteriorating institutional support (Monnat 2020), and opioid supply (Ciccarone 2019, 2021). The findings presented in this study suggest that investing in counties suffering from the highest poverty rates, increasing residential mobility opportunities in communities facing median and lower opioid mortality, and advancing harm reduction efforts to decrease opioid mortality would decrease child maltreatment. Evidence from harm reduction interventions show evidence of decreasing foster care entry but not child maltreatment reporting (Bullinger, Wang, and Feder, this volume). Interventions to weaken the associations of this study rely on rebuilding community-level social controls and reinvestment in institutions that defend against consequences of opioid mortality. Such institutions are most effective by being physically located in communities that they serve and having buy-in from community members.
Footnotes
Appendix A
Appendix B
Appendix C
NOTE: I would like to thank Ashton Verdery, Sarah Font, Rachel McNealey, Megan Evans, Thomas Siskar, and Eric Baumer for their helpful feedback on this project. This research was supported by the Population Research Institute (PRI). PRI is supported by a grant from the Eunice Kennedy Shriver National Institute of Child Health and Human Development (P2CHD041025) and by the Pennsylvania State University and its Social Science Research Institute.
Notes
Alexander Chapman is a PhD candidate in sociology and demography at the Pennsylvania State University. His interests include social networks, substance mis/use, and population health.