
Abstract
Although considerable research looks at the effects of mobility on various outcomes, few studies differentiate between changes schools versus changing dwellings, even though the effects are likely to be different in terms of academic performance. In this paper, we rely on a random effects regression model using a longitudinal survey containing roughly 700,000 families over a 16-year period to differentiate between these two types of mobility. First, we look at the impact that family mobility, defined as a move by at least one parent and at least one child, has on the mathematics scores of the child. Second, we differentiate between residential mobility and school mobility. We find that moving schools and/or houses increases the likelihood of having poor mathematics scores. This effect is particularly evident when both a change in residence and switching schools occur concurrently, which has a multiplicative impact on mathematics scores.
Introduction
Early childhood is an important period in the life cycle that involves a series of key developmental transitions, including starting school, establishing peer networks, hitting developmental milestones, and preparing to leave the family home to pursue goals and aspirations. The opportunities provided to children during the early years are closely linked to adulthood success. Childhood determinants such as adequate parental involvement and support, a stable home environment, social capital, family socioeconomic status (SES), involvement in risky behaviours, and mental health all impact outcomes in adulthood. While these things certainly play an important role, one of the most important indicators of future outcomes is educational attainment (French et al., 2015). For the most part, children with higher levels of educational success during childhood are more likely to attend a post-secondary institution, obtain adequate employment, and have better overall outcomes in adulthood (Caspi et al., 1988; Johnston et al., 2012; Mayger et al., 2017; Rouse, 2007).
While doing well in school is a strong predictor for achievement, access to and acquisition of quality education is not equal. There are disparities in educational opportunities, as some individuals are provided with more opportunities throughout childhood that enable them to prosper in adulthood (Astone and McLanahan, 1994; Scanlon and Devine, 2001). There are various factors that impact an individual's ability to do well in school, including SES, parental resources, social support, and ambition (Coleman, 1988; Hango, 2006; Hendershott, 1989; South and Haynie, 2004). Children from wealthier families tend to have better support, both financially and socially. Parental resources, involvement, and aspirations for their children play a major role in children's access to and acquisition of educational resources and support (Lareau, 2000). That said, a potential contributor to positive child outcomes not often explored in the literature is residential mobility.
Residential mobility is often considered a mechanism for moving to better opportunity (Cotton and Schwartz-Barcott, 2016). While moving is often a decision made by parents, the impact can have negative consequences for children. The literature outlining the relationship between mobility and educational outcomes for children and youth is mixed. Some studies find that residential mobility has little to no effect on the outcomes of children, suggesting that kids are resilient and can manage life changes with ease (Jordan and Graham, 2012; Wu et al., 2024). Other studies have found that mobility can have a positive effect on child outcomes, particularly for families that are moving as a result of economic opportunity (Scanlon and Devine, 2001), as long as the moves aren’t too numerous (Wu and Bernard, 2024). Children that relocate to a new neighbourhood and attend a school with better resources may experience better educational outcomes than children that don’t move, including higher scores on mathematic and reading assessments, a higher likelihood of graduating high school on time, and pursing higher education that is needed for success in the labour market (Hango, 2006).
Conversely, moving can also have a negative impact, particularly for children that come from disadvantaged households (Wu et al., 2024). Children from lower socioeconomic households are more likely to move as a consequence of poor conditions such as inadequate housing and limited economic resources (Lichner et al., 2024). Furthermore, mobility is often observed amongst single-parent households or households with a parental separation (Gabriel et al., 2025), which causes additional challenges. For children from these families, moving during childhood and young adulthood can have a profound impact on health and socioemotional development (Huang et al., 2018). For children that also experience a change in schools, the impact of residential mobility on academic achievement can be profound as it impacts multiple aspects of life that provide stability in the home (Anderson and Leventhal, 2016; Calhoun and Haan, 2026; Tonnessen et al., 2016).
While a considerable body of research links family background and neighbourhood conditions to children's educational success, the interplay between mobility, socioeconomic resources, and social capital remains underexplored. Residential and school mobility are not merely discrete life events; they reflect broader patterns of economic (in)stability and social connection that shape how children experience continuity in learning. Understanding how these dimensions intersect is crucial for identifying the mechanisms through which inequality in academic outcomes is reproduced. This study therefore examines the combined and conditional effects of residential mobility, SES, and social capital on children's mathematics achievement, drawing on longitudinal data to disentangle their independent and interactive influences over time.
We begin with an overview of the literature that looks at the impact of residential and school mobility on academic achievement in early childhood. Empirical results are presented in the following section, which shows the long-term implications of moving on childhood mathematics scores over an 8-year period. The final section highlights the findings and demonstrates how the hurdles faced by children from disadvantaged households can be lessened by recognizing the role of residential and school mobility.
The role of childhood mobility on early academic achievement
Residential and school mobility
Canada has among the highest rates of internal mobility in the OECD, with over 40 percent of households with children under the age of 15 reporting at least one residential move in the 5 years preceding the 2021 Census. These moves are unevenly distributed: younger families, renters, and those in urban centres are most mobile, while homeownership and higher SES are associated with greater residential stability. This level of family mobility is distinctive when compared to many European contexts and underscores the importance of examining the educational consequences of frequent moves in the Canadian case.
The reasons for moving vary widely. Many families relocate to pursue employment, better housing, or access to high-quality schools, while others move under conditions of constraint – such as financial hardship, eviction, or family dissolution (Li, 2012; Lichner et al., 2024; Rumberger, 2003). Even when moves are voluntary, children often experience disruption in their daily routines, schooling, and social networks. Early childhood mobility has been associated with social and emotional strain, reduced stability, and lower academic achievement (Gilman et al., 2003; Ziol-Guest and McKenna, 2014).
The literature on mobility and educational outcomes remains divided. Some studies find that mobility has little or no effect, suggesting that children are resilient and capable of adapting to new settings (Jordan and Graham, 2012; Wu et al., 2024). Others show that mobility can yield positive effects when families move for opportunity and when changes are infrequent (Hango, 2006; Scanlon and Devine, 2001). Children who move to neighbourhoods with greater resources may experience better school quality, improved peer networks, and enhanced academic outcomes. Yet, frequent moves – particularly those tied to instability – tend to undermine these advantages, producing cumulative disadvantage over time (Gruman et al., 2008; Mollborn et al., 2018).
The distinction between residential and school mobility is crucial but often blurred in prior research. Residential moves can occur without a change in school when catchment areas are broad, but when both occur simultaneously, the impact on academic performance is typically amplified (Anderson and Leventhal, 2016; Tonnessen et al., 2016). Changing schools outside of regular grade progression often entails curricular disruption, adaptation to new teaching styles, and the loss of established peer support (Rumberger, 2003; Swanson and Schneider, 1999). Disentangling these two forms of mobility remains a persistent gap in the literature, as few studies can distinguish between the effects of moving homes and the effects of switching schools on children's academic outcomes (Pribesh and Downey, 1999).
Socioeconomic status and educational stability
SES is a powerful determinant of both mobility and educational achievement. Families with higher levels of education, income, and occupational prestige typically move under conditions of choice rather than constraint, often seeking improved housing, safer neighbourhoods, or stronger school districts. In contrast, low-income families are more likely to move in response to eviction, job loss, or inadequate housing (Cotton and Schwartz-Barcott, 2016; Rumberger and Larson, 1988). Such moves are typically short distance, frequent, and involuntary – patterns that generate instability without producing access to better opportunities (Nivalainen, 2004; Schachter, 2004).
Repeated mobility among disadvantaged households thus reflects structural inequality. Children from lower SES households face a higher likelihood of multiple moves, each of which compounds existing educational disadvantage (Schmitt and Lipscomb, 2016). In these contexts, residential instability often coincides with other risk factors – single parenthood, housing precarity, and parental unemployment – that further constrain children's ability to maintain educational continuity (Gabriel et al., 2025; Tucker et al., 1998).
Conversely, children in higher SES families tend to experience fewer academic penalties associated with moving. These families often possess the financial and cultural capital to minimize the negative effects of mobility, whether through private tutoring, parental advocacy, or access to schools with better integration supports (South et al., 2007; Swanson and Schneider, 1999). Prior research suggests that socioeconomic resources act as a buffer, moderating the association between mobility and educational performance. However, most empirical studies model SES as a simple control variable rather than as an explanatory mechanism through which mobility operates. By integrating SES into the analytic framework, we can better understand how economic advantage shapes the consequences – not merely the likelihood – of moving.
Social capital and support networks
Social capital theory provides an additional lens through which to understand the relationship between mobility and academic outcomes. Coleman (1988) conceptualized social capital as the network of trust, norms, and reciprocal obligations that facilitate coordination and cooperation within families and communities. In the context of child development, these networks provide informational and emotional resources that foster educational success (Teachman et al., 1997).
Mobility can disrupt these networks by severing ties between parents, teachers, peers, and neighbours. Children who move frequently may lose access to mentors, extracurricular programs, and consistent peer groups, all of which contribute to academic achievement (Astone and McLanahan, 1994; South and Haynie, 2004). At the household level, repeated moves can reduce parental involvement in schooling due to stress, logistical challenges, and diminished connection with educators (Gruman et al., 2008). The resulting decline in parental engagement can be particularly detrimental to academic performance in subjects like mathematics that rely on cumulative skill development.
Yet, social capital can also act as a protective mechanism. Strong family functioning, active parental support, and stable friendships can mitigate the disruptive effects of moving (Anderson and Leventhal, 2016; Ellickson and McGuigan, 2000). Research shows that children embedded in supportive networks experience smaller academic declines following residential or school changes (Astone and McLanahan, 1991; Hagan et al., 1996). This may be especially true for short-distance movers, who can maintain relationships within the same broader community. Nonetheless, few longitudinal studies examine social capital as a moderating factor using robust empirical measures. The relative importance of social capital vis-à-vis socioeconomic resources remains uncertain, leaving open the question of whether relational stability can offset economic instability in shaping educational outcomes.
Integrating the three mechanisms: gaps and contributions
Taken together, mobility, SES, and social capital represent three dimensions of (in)stability that shape children's educational trajectories. Prior research has typically examined these factors in isolation or treated SES and social capital as secondary covariates. Consequently, the field lacks a clear understanding of how different types of mobility – residential versus school – interact with household resources and social networks to influence academic performance over time.
This study addresses these limitations by integrating all three mechanisms into a single empirical model using a nationally representative longitudinal dataset. We extend prior research in three key ways. First, we distinguish between residential and school mobility to assess whether their effects on mathematics achievement are distinct or compounded. Second, we model how socioeconomic resources buffer children from the adverse effects of moving, providing evidence for conditional effects across the SES gradient. Third, we evaluate the role of social capital – measured through family functioning, social support, and parental engagement as an additional moderator that shapes children's ability to adapt to mobility-related disruptions.
In doing so, we clarify the complex interdependencies among geographic, economic, and relational stability in shaping educational inequality. By situating mobility within broader structures of socioeconomic and social advantage, our analysis provides a more comprehensive account of how children's life chances are stratified through the intersection of place, resources, and relationships.
Research hypotheses
Previous studies suggest that gaps in childhood achievement, particularly in math, occur in the early formulative years of schooling; therefore, examining the role of childhood characteristics is important to understanding educational disadvantage. We test the following three hypotheses: Hypothesis 1. Children who experience both a residential move and a school move between survey waves will show larger declines in mathematics scores than children who experience only one type of move or remain non-mobile. Hypothesis 2. The negative effect of residential and/or school mobility on mathematics scores will be smaller for children from higher socioeconomic households than for those from lower socioeconomic households. Hypothesis 3. The negative effect of residential and/or school mobility on mathematics scores will be smaller for children with higher levels of social capital than for those with lower levels of social capital.
The Canadian educational system introduces a unique dimension to study these hypotheses. Unlike countries with centralized education policies, Canada's education system is provincially administered, with each province and territory determining its own curriculum, grade structures, and assessment practices. While all children attend publicly funded schools that are free at the point of entry, variation in curricula, grade-level cut-offs, and program offerings can amplify the disruption caused by moving between schools, especially if moves involve crossing provincial boundaries. For international readers, this decentralized structure helps explain why residential and school mobility may be particularly consequential for children's academic trajectories in Canada.
Data and methods
Early childhood education has been shown to impact future life outcomes, such as high school graduation, post-secondary attendance, and labour market outcomes. Given the years of schooling children experience between starting school and entering high school is long, it is important to study mathematic scores over a period of time while controlling for changing household characteristics. To capture long-term trends, we utilize the National Longitudinal Survey of Children and Youth (NLSCY), which is a longitudinal survey administered by Statistics Canada to measure childhood outcomes from birth to early adulthood. The purpose of the NLSCY is to track developmental trajectories of Canadian children to better understand the social, emotional, and behavioural components that impact well-being. The NLSCY has a longitudinal survey design and began data collection in 1994/1995 with a representative 1 target population of children between the ages of 0 and 11 and their families in the 10 Provinces.
Beginning with cycle 1, respondents were surveyed every 2 years for a total of eight cycles. The survey follows the same cohort of children, while also adding subsequent cohorts in later cycles to allow for additional analysis of key population groups. The longitudinal sample includes children between the ages of 0 and 11 years of age in the first cycle; therefore, the majority of information collected is from the Person Most Knowledgeable (PMK). The PMK in the household is selected to participate in a household interview that includes a series of questions on child development and behaviour, education, and health and well-being. The NLSCY includes eight collection periods that occurred in 2-year intervals until the final collection period in 2009. The original longitudinal sample includes 16,903 children, with a total of 10,487 children remaining in the survey by cycle 8 2 . The high attrition in the longitudinal sample is due to the inability to trace children and/or parents over time, refusal to participate, and mobility outside of Canada. To account for the high attrition present in the NLSCY, longitudinal weights are assigned to each respondent to reduce the potential bias associated with non-response across cycles. The weighting strategy of the NSLCY allows for adjustments to be made based on a child's probability of selection, which was based on the Labour Force Survey, a representative survey of household labour force activity in Canada. The weights are then adjusted for non-response by adjusting the assigned weight of a responding child to reflect children that did not respond in any given cycle. The final step adjusts for poststratification by ensuring that the weights represent the known population counts of children in Canada. This is done using Statistics Canada population estimates by age, sex, and province. Two final weights are produced for the NLSCY: non-funnel and funnel longitudinal weights. Non-funnel weights provide adjusted population counts that allow for cycle non-response while the funnel weight is based on a child responding to each cycle. Given the population of interest in the paper, funnel weights are used for all estimates.
The NLSCY provides a unique opportunity to understand the impact of family and household characteristics on child outcomes since questions are asked of both the PMK and the child over the course of the survey. A questionnaire is administered to the PMK up to the age of 16, which includes detailed information on parental education, family composition, household characteristics, and place of residence. In addition, a school-based questionnaire is administered starting in kindergarten and a self-complete child questionnaire is administered starting at age 10. We use both the parent questionnaire in each cycle alongside the information collected at the school level on mathematic scores between the ages of 8 and 15. Table 1 provides a list of the variables used in the analysis and the corresponding cycle they are pulled from.
List of variables and reported cycle.
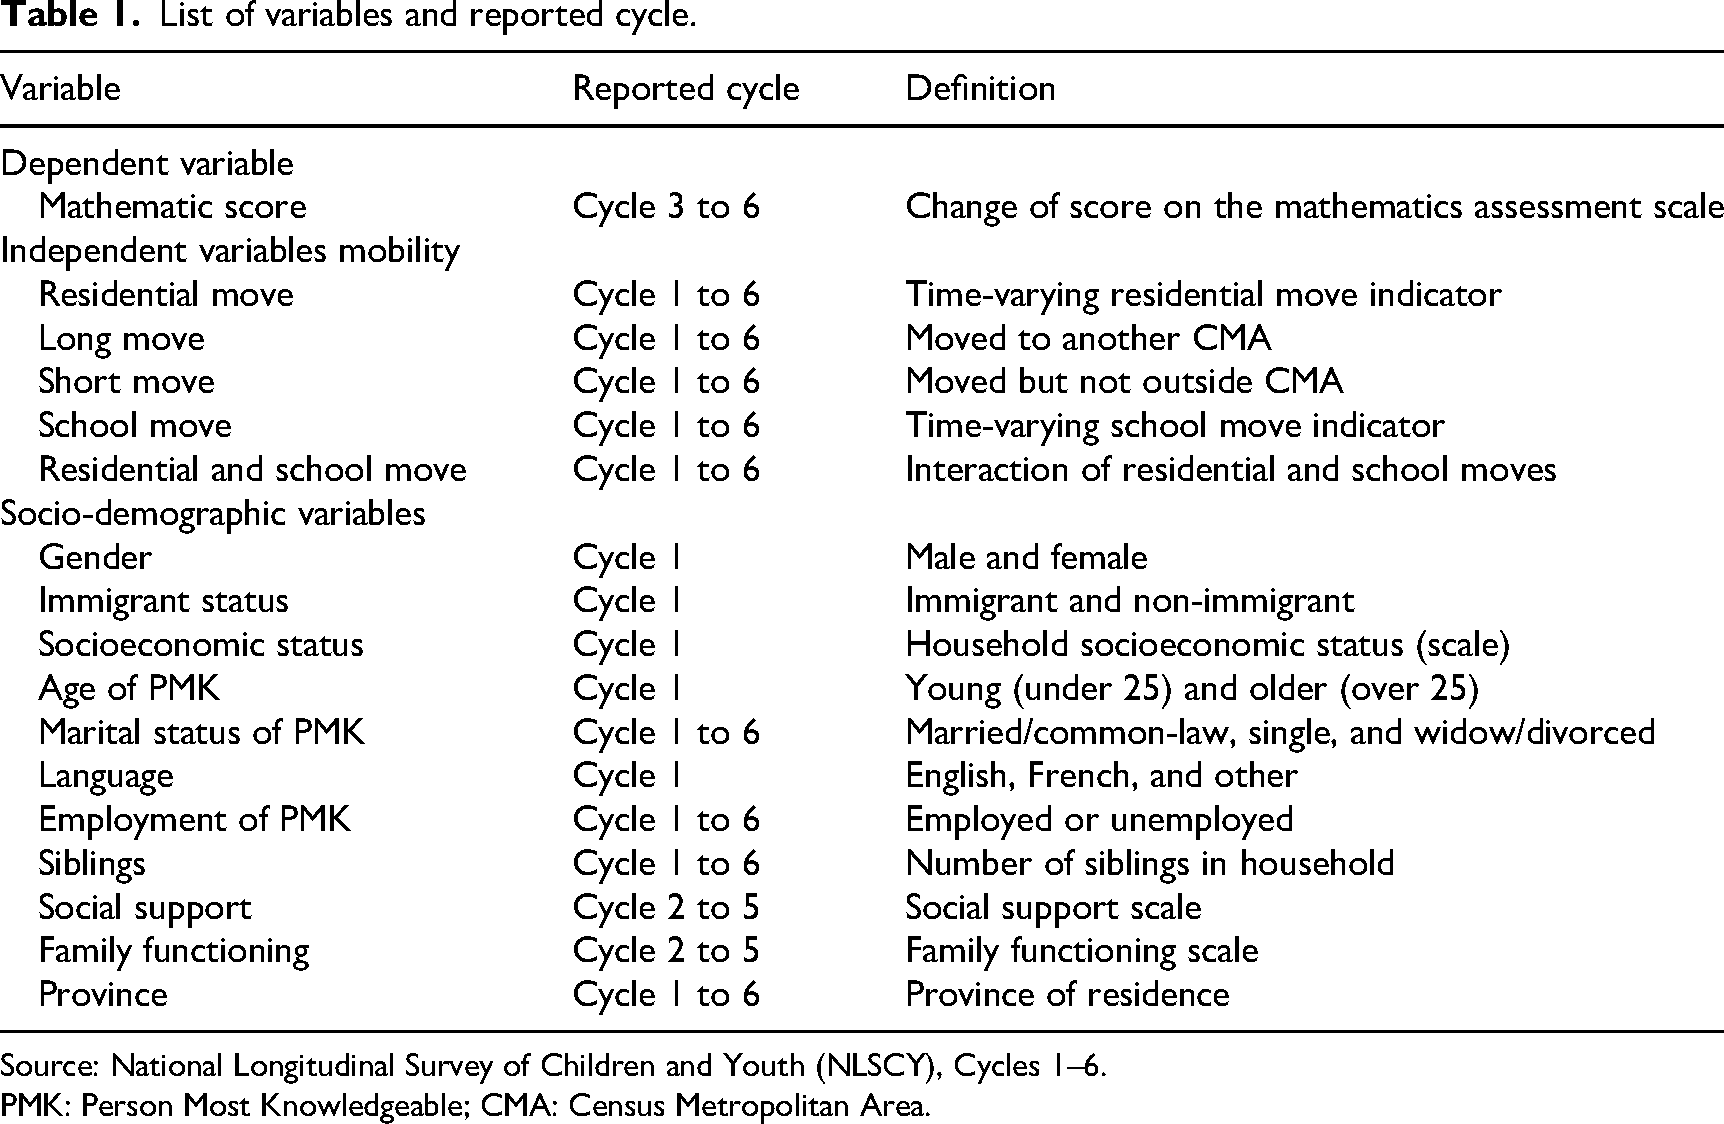
Source: National Longitudinal Survey of Children and Youth (NLSCY), Cycles 1–6.
PMK: Person Most Knowledgeable; CMA: Census Metropolitan Area.
To capture the impact of residential mobility on math scores, we restrict our sample to children between the ages of 4 and 5 in cycle 1. This restriction is to ensure that math scores can be adequately measured over time since the eligibility for the test is based on age. For example, in cycle 3, a mathematics score is only reported for respondents aged 8 and 9. Since data collection occurred every 2 years, children that reported a mathematics score in cycle 3 were aged 4 and 5 in cycle 1. Restricting the sample to this cohort also captures the impact of mobility and other covariates on children in a similar life stage. This cohort of children is likely to be experiencing the same social pressures, achieving similar developmental milestones, and progressing through school at the same time and level.
The final sample includes children that are part of the original longitudinal cohort and responded to all subsequent cycles of the NLSCY up to cycle 6 (the last cycle with reported math assessments), which represents 712,668 children 3 . Children that dropped out of the sample, moved to another country, or died, are removed from the final sample. While there are some children that skipped cycles, the number is small and dropped from the sample 4 .
Mathematics scores and residential mobility
Children who responded in cycles 3 to 6 completed a mathematics skill test based on their grade level. The mathematics test is a shortened version of the Canadian Achievement Test (2nd edition), which measures the ability to do addition, subtraction, multiplication, and division on whole numbers, decimals, fractions, negatives, and exponents (NLSCY User Guide, Cycle 3). A shortened version of the test was developed for the NLSCY and consists of 15 questions. Each child 5 was given a raw (gross) score, which was obtained by adding all the correct answers, as well as a scaled score.
Mathematics scores are reported for cycles 3 to 6; therefore, it is possible to determine an increase or decrease in aptitude over time. Missing scores were dropped from the analysis for each cycle; therefore, children that didn’t have a score in one cycle were still included in the analysis if they reported a score for another cycle. The final sample includes 712,668 children, for a total of four time periods. The mean of math scores across all time periods is 9.7; mean scores for each cycle show a gradual decrease in math test scores over time.
To measure residential mobility, we use reported postal codes from each cycle of the NLSCY. The postal codes are used in conjunction with the Postal Code Conversation File (PCCF+), which assigns them to a range of Statistics Canada standardized geographical areas. To capture mobility between detailed geographical blocks, or neighbourhoods, we use Dissemination Area (DA) 6 as the geographical unit. Each child is assigned to a DA for each cycle; a residential move is defined as a change in DA between cycles. To ensure that the sample is not further restricted, imputation is done for missing postal codes. A missing postal code for any given cycle is imputed with the reported postal code of the subsequent cycle. Respondents that reported a postal code outside of Canada are dropped from the final sample. 7 Although math scores are only reported from cycles 3 to 6, moves between cycles 1 and 6 are used. This is to get a better picture of childhood mobility as earlier moves are likely to impact math scores over time.
Residential mobility is reported in two ways: number of moves and distance of move. For number of moves, the cumulative total is summed together over the entire period being analysed. The cumulative number of moves is used as the key measure of mobility due to the increased likelihood that poor outcomes are more pronounced with each subsequent move. Therefore, it is possible to measure this effect by reporting total number of moves. The distance of a move is calculated for each cycle as children who move longer distances are likely to have a harder time adjusting due the loss of social networks and a corresponding school move. A long-distance move is defined as moving to another Census Metropolitan Area (CMA) or to another province. This is done by assigning each reported postal code to a given CMA and tracking whether a move occurred to another CMA between cycles. A short-distance move is a move that occurs within the same CMA but to another neighbourhood (or DA).
To disentangle the effect of residential and school mobility, a measure of school change is also included. From cycles 1 to 6, the PMK is asked whether a school move had occurred since the last survey. A school move is defined as any change in school that is outside of a normal school change due to grade progression. This information is compiled for each survey year up to and including cycle 6 to determine whether residential mobility still impacts mathematic scores after controlling for school mobility. To understand the possible joint effect of moving both homes and schools, an interaction between total number of residential moves and school moves is included. By showing the interaction, it is possible to gain a deeper understanding of the potential compounding effect of moving both homes and schools.
Independent variables
To fully capture the relationship between mobility and math scores, we control for several co-variates that are likely to mitigate the impact of migration including SES, social capital including household characteristics, and immigrant status. The NLSCY includes a SES variable that assigns a score to a child based on the occupational prestige, educational levels, and economic positions of both the PMK and spouse in the household. The variable is a combination of the following measures: the level of education of the PMK and spouse measured in years of schooling, the prestige associated with the occupation of the PMK and spouse 8 , and overall household income. Each child is then assigned a score based on the combination of the measures above. The final scale ranges from −2.00 to +1.75 and represents a normal distribution for the population. The mean SES score for the sample in this study is −0.0532.
Social capital plays a significant role in the likelihood children will succeed, particularly after experiencing a residential or school move. In an attempt to capture Coleman's key components of social capital, several indicators are used including a social support scale for relationships in the home, with friends, and at school, parental age, marital status, employment status of the PMK, and number of siblings. Starting in cycle 2, the PMK was asked a series of questions related to the relationships their children have with others, including siblings, friends, teachers, and classmates. The objective of these questions was to get information on the child's relationship with others as a proxy for social support. A factor analysis was done using the responses to several questions on child relationships to create a social support scale, ranging from 0 to 24, where a high score is indicative of strong social networks and support. The social support scale is included for the mathematics model and is time-varying from cycle 3 to 5, with a mean of 18.27.
Marital status of the PMK is categorized into married/common-law, single, and widowed/divorced. Most children reside in a married or common-law household, with over 83.1 percent of PMKs reporting being married by cycle 6. Approximately 9.9 percent of children reside in a single-parent household while 7 percent live with a widowed or divorced parent. The employment status of the PMK is included as a control measure to determine if having a parent at home impacts math outcomes. The age of the PMK at the time that the child entered school is included to determine if children with young mothers face additional barriers, as found by Glick et al. (2012). It is expected that older parents have the necessary resources, knowledge, and social capital to help children perform well in school. It is also expected that children who come from two-parent households will do better in school than children who have only one parent or are constantly transitioning between households. Household size is also included to determine how the number of people in the home impacts achievement. Households with only one child may dedicate more time and resources to ensuring that their child does well in school, whereas households with multiple members may have to allocate resources differently (Hango, 2006).
In addition to social support, the NLSCY includes a family functioning scale that identifies the various aspects of family life, including communication between children and parents, responsiveness to child needs, and parental involvement. The final scale is aimed at providing a valid assessment of familial relationships and the quality of parental involvement in children's lives. The final scale includes 12 questions, each containing four response categories, for a total score of between 0 and 36. A high score is indicative of poor family functioning. The family functioning score is included for the mathematics model and is time-varying from cycle 3 to 5, with a mean of 8.31.
Immigrants that land in Canada are more likely to be mobile in the first 5 years after landing; however, migration is less common once settled in Canada. For immigrant parents, it is expected that they will invest heavily their child's education to ensure that they have the best opportunities. Immigrant status is included to capture differences among immigrant and non-immigrant children. Approximately three percent of the sample includes immigrant children. Language is also included as an additional control. It is expected that children whose primary language learned in the home is neither English or French will face additional barriers for mathematics as the assessment tools are designed for children who speak the official languages.
Analytical technique
To understand how mobility impacts scores over time while controlling for other key characteristics such as social capital, household composition, and immigrant status, a longitudinal analysis is done using random and fixed effects. Since there are both time-varying and time-invariant variables, both random and fixed effects are possible techniques for understanding the impact of migration on mathematic scores. Given the complex nature of the data, and the likelihood that variables are omitted in the model, we first conduct a fixed effect model:
Given the limitations of a fixed effects model, and the likelihood that time-invariant characteristics such as immigrant status, gender, and age of PMK at birth are likely to play a role in mathematic scores for children, we also estimate an Ordinary Least Squares Random Effects model:
Descriptive results
Table 2 provides an overview of the sample.
Descriptive overview of sample.
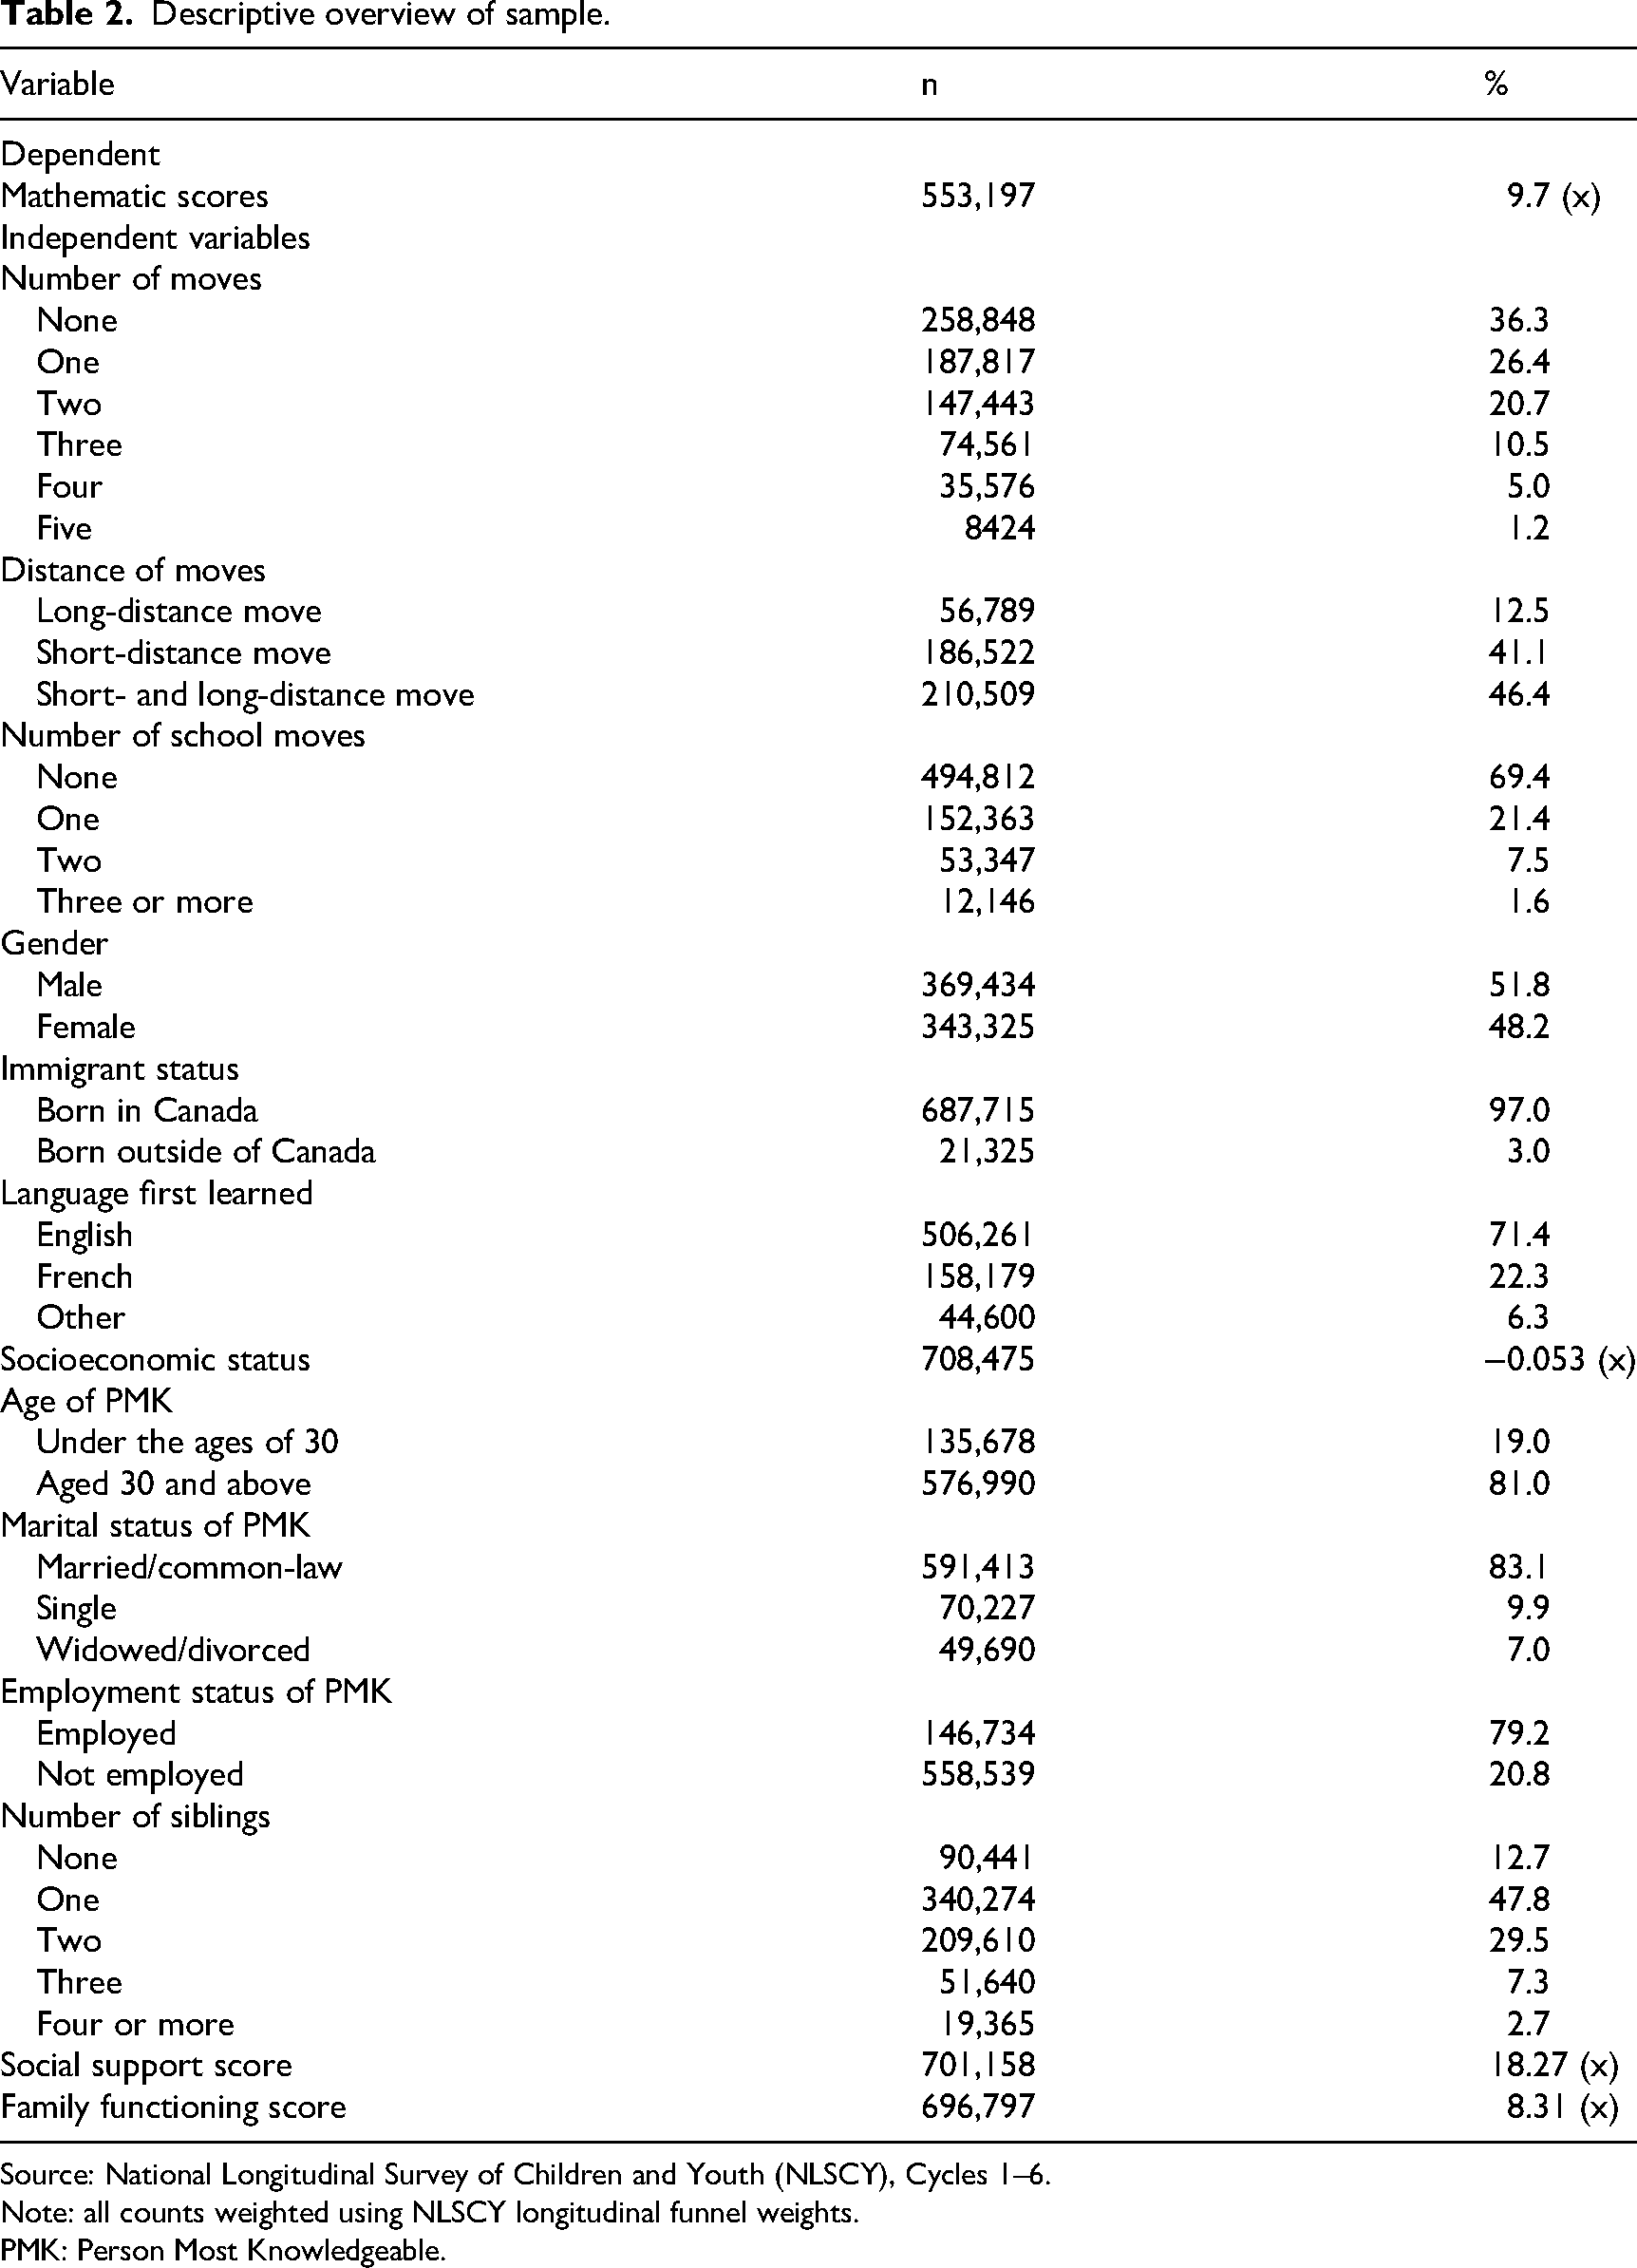
Source: National Longitudinal Survey of Children and Youth (NLSCY), Cycles 1–6.
Note: all counts weighted using NLSCY longitudinal funnel weights.
PMK: Person Most Knowledgeable.
Approximately 36.3 percent of children did not move to a different neighbourhood between cycles 1 and 6. Of the two-thirds of children that did move, 26.4 percent moved only once, while 20.7 percent moved twice and roughly 16.7 percent moved three or more times during the 8-year period. While over two-thirds of children moved at least once, only 30.6 percent moved to another school. This suggests that while children may move to another home, it doesn’t necessarily lead to a school move as well. For children that did move, approximately 12.5 percent experienced a long-distance move, 41.1 percent moved short distances, and 46.6 percent moved to a new neighbourhood outside of a CMA and/or province.
The goal of this paper is to measure the impact of residential and school mobility on early childhood mathematics scores. Depending on how far a child moves, a change in schools may or may not occur at the same time. Conversely, a parent may decide to place their child in another school in order to improve grades, find a new peer group, or simply for convenience. Additionally, a child may move to a new home that results in also moving to a new school. Whatever the reason, it is likely that children who move frequently will experience at least one school move.
Figure 1 shows the percentage of children who move homes and move schools.
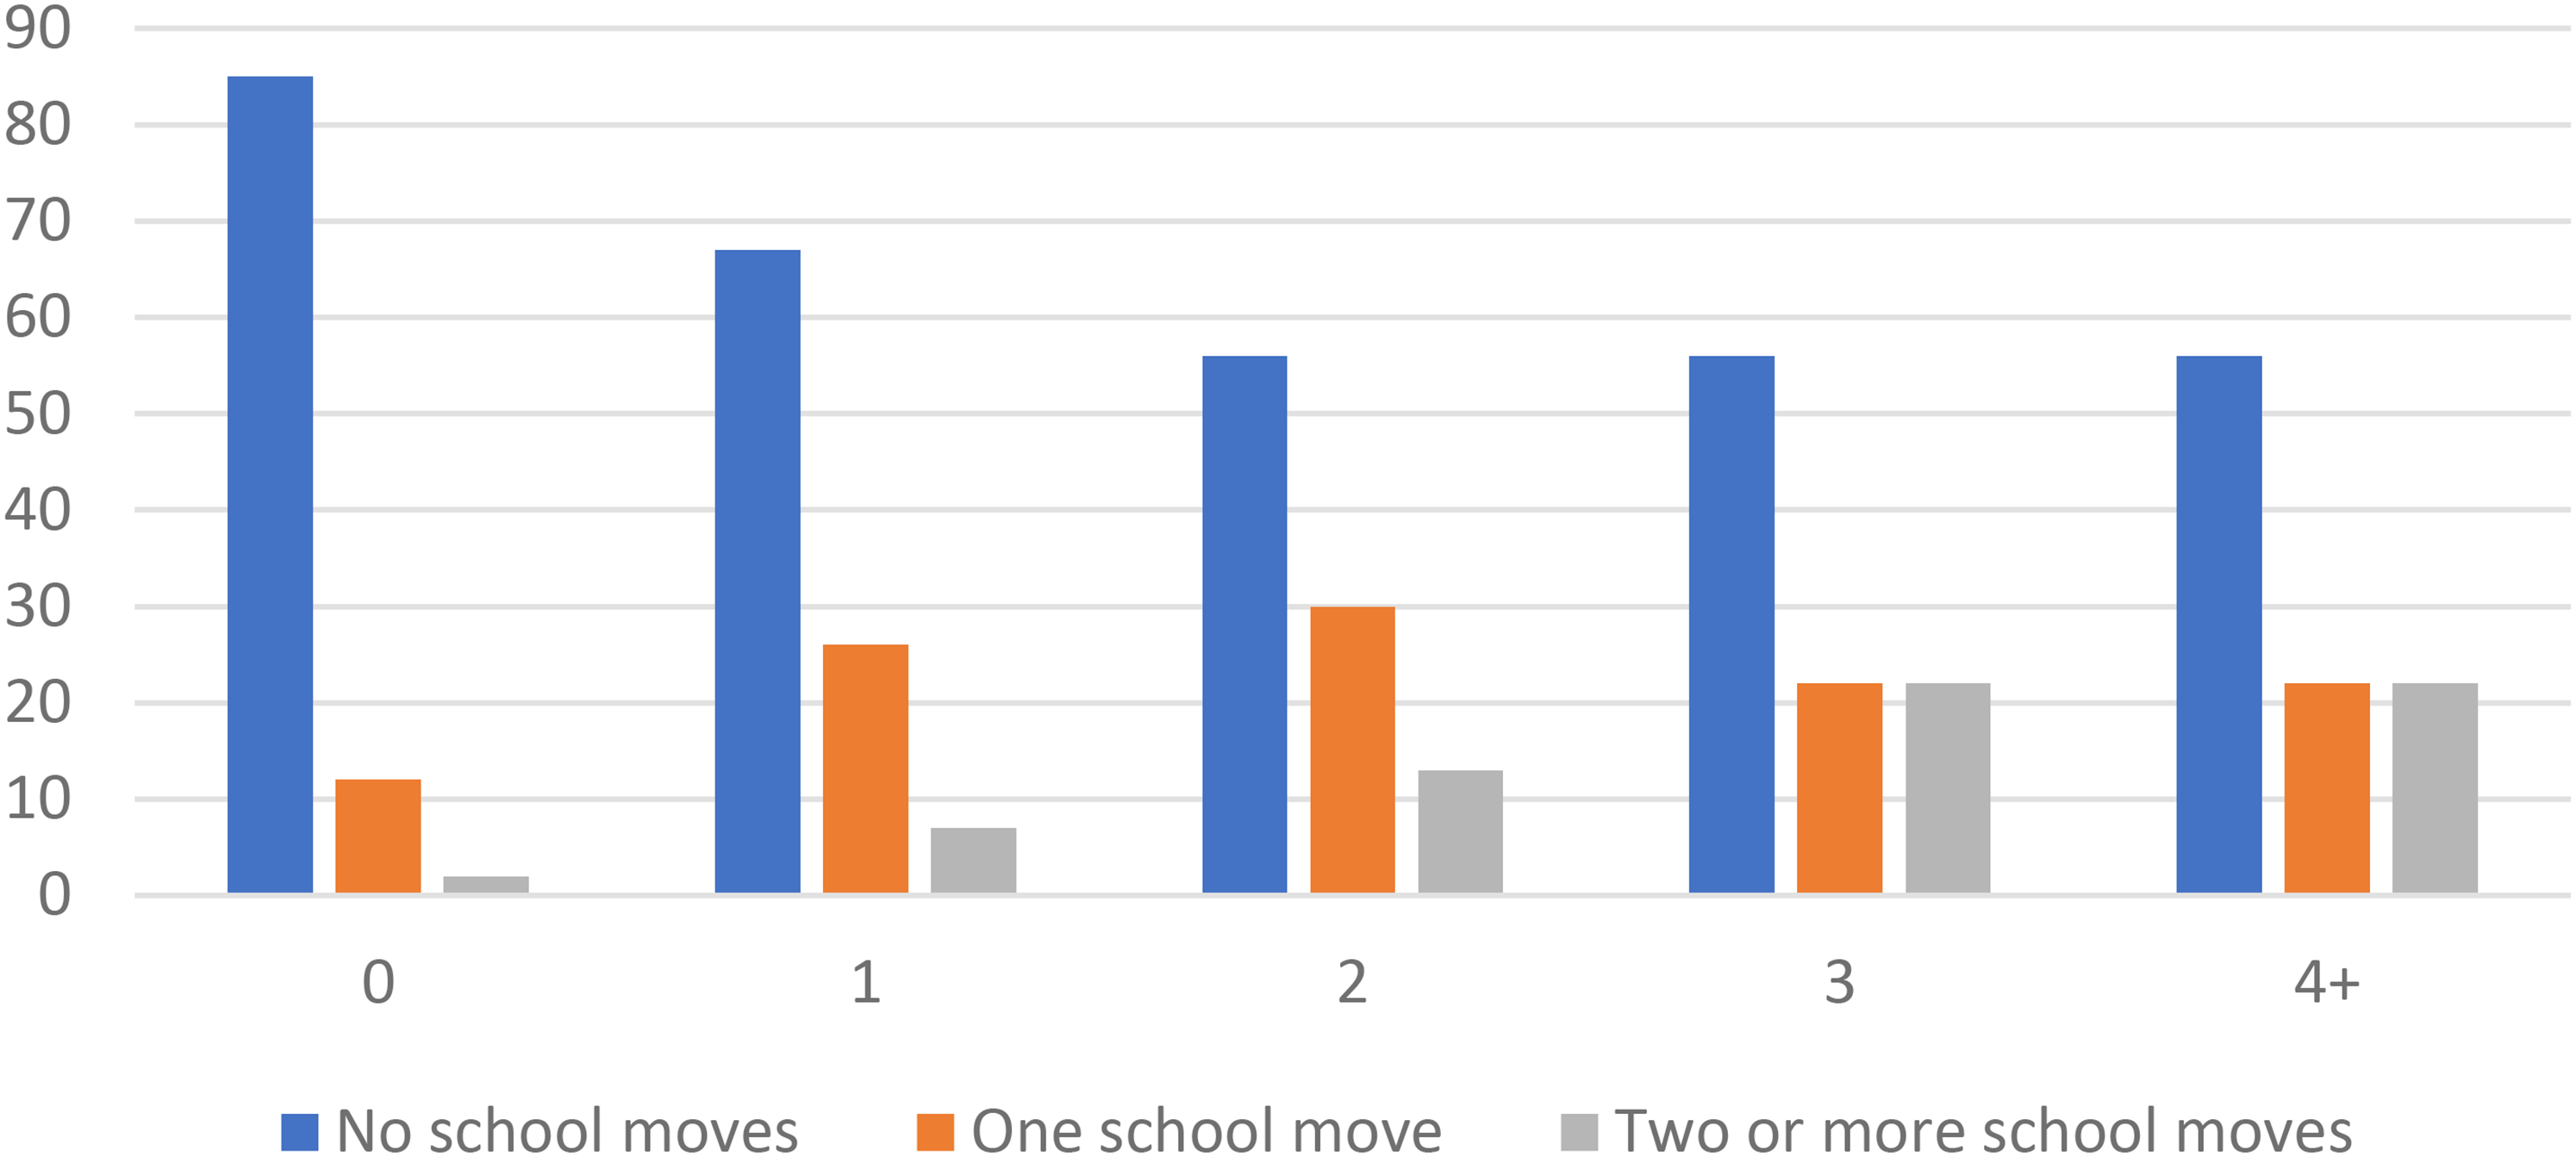
Number of school moves by residential moves, Canada.
The majority of children (85.2%) who didn’t move homes between the ages of 4 and 15 also didn’t move schools. Approximately 12.4 percent of children who didn’t move homes changed schools once, while only 2.5 percent changed schools two or more times. Roughly two-thirds of children who moved to a new home once remained at the same school. In contrast, of children who moved homes four or more times, only 55.8 percent remained at the same school. Children who moved homes at least three times experienced the highest rates of school mobility, with 22.1 percent changing schools two or more times. Overall, as the number of residential moves increases, the likelihood of experiencing a change in school also increases.
SES is one of the strongest predictors of childhood disadvantage. Children from poor socioeconomic households are more likely to move and are, therefore, more likely to have lower mathematics scores. Table 3 shows the mean socioeconomic and mathematic scores by the number of residential and school moves.
Mathematics and socioeconomic scores by type of move.
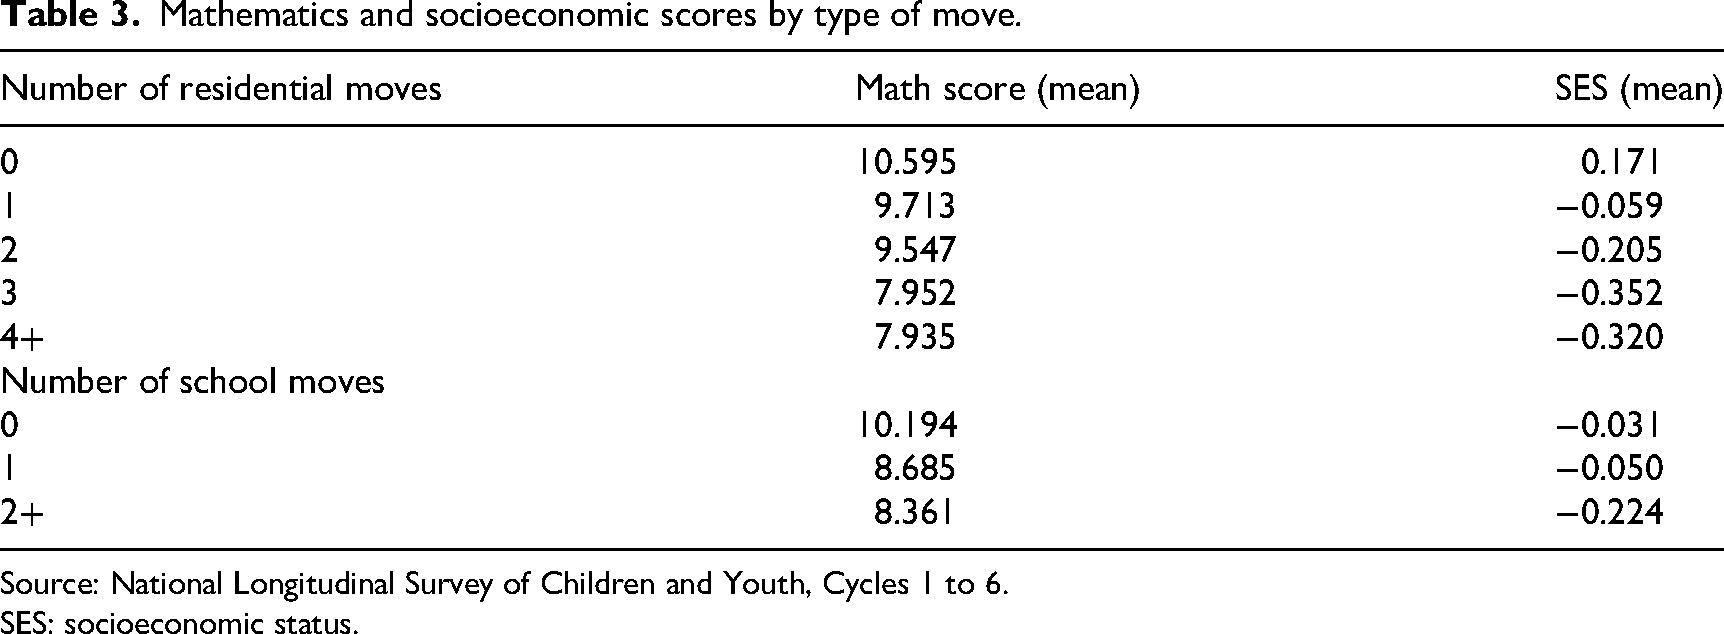
Source: National Longitudinal Survey of Children and Youth, Cycles 1 to 6.
SES: socioeconomic status.
Children who experience frequent residential mobility have lower mathematic scores over time than their non-mobile counterparts. A decrease in mathematics is also experienced among children who experience a change in schools. The same trend is evident for SES: children that move, both homes and schools, are likely to experience a corresponding decrease in SES over time. Overall, children that experience multiple residential or school moves have lower mathematic scores and experience a decrease in SES.
Multivariate results
Table 4 shows the results from the random effects model. Coefficients and robust standard errors are reported along with the associated level of significance. Results are reported as being significant at the p < 0.05 level and are denoted with asterisks.
Impact of mobility on mathematics scores, random effects model.
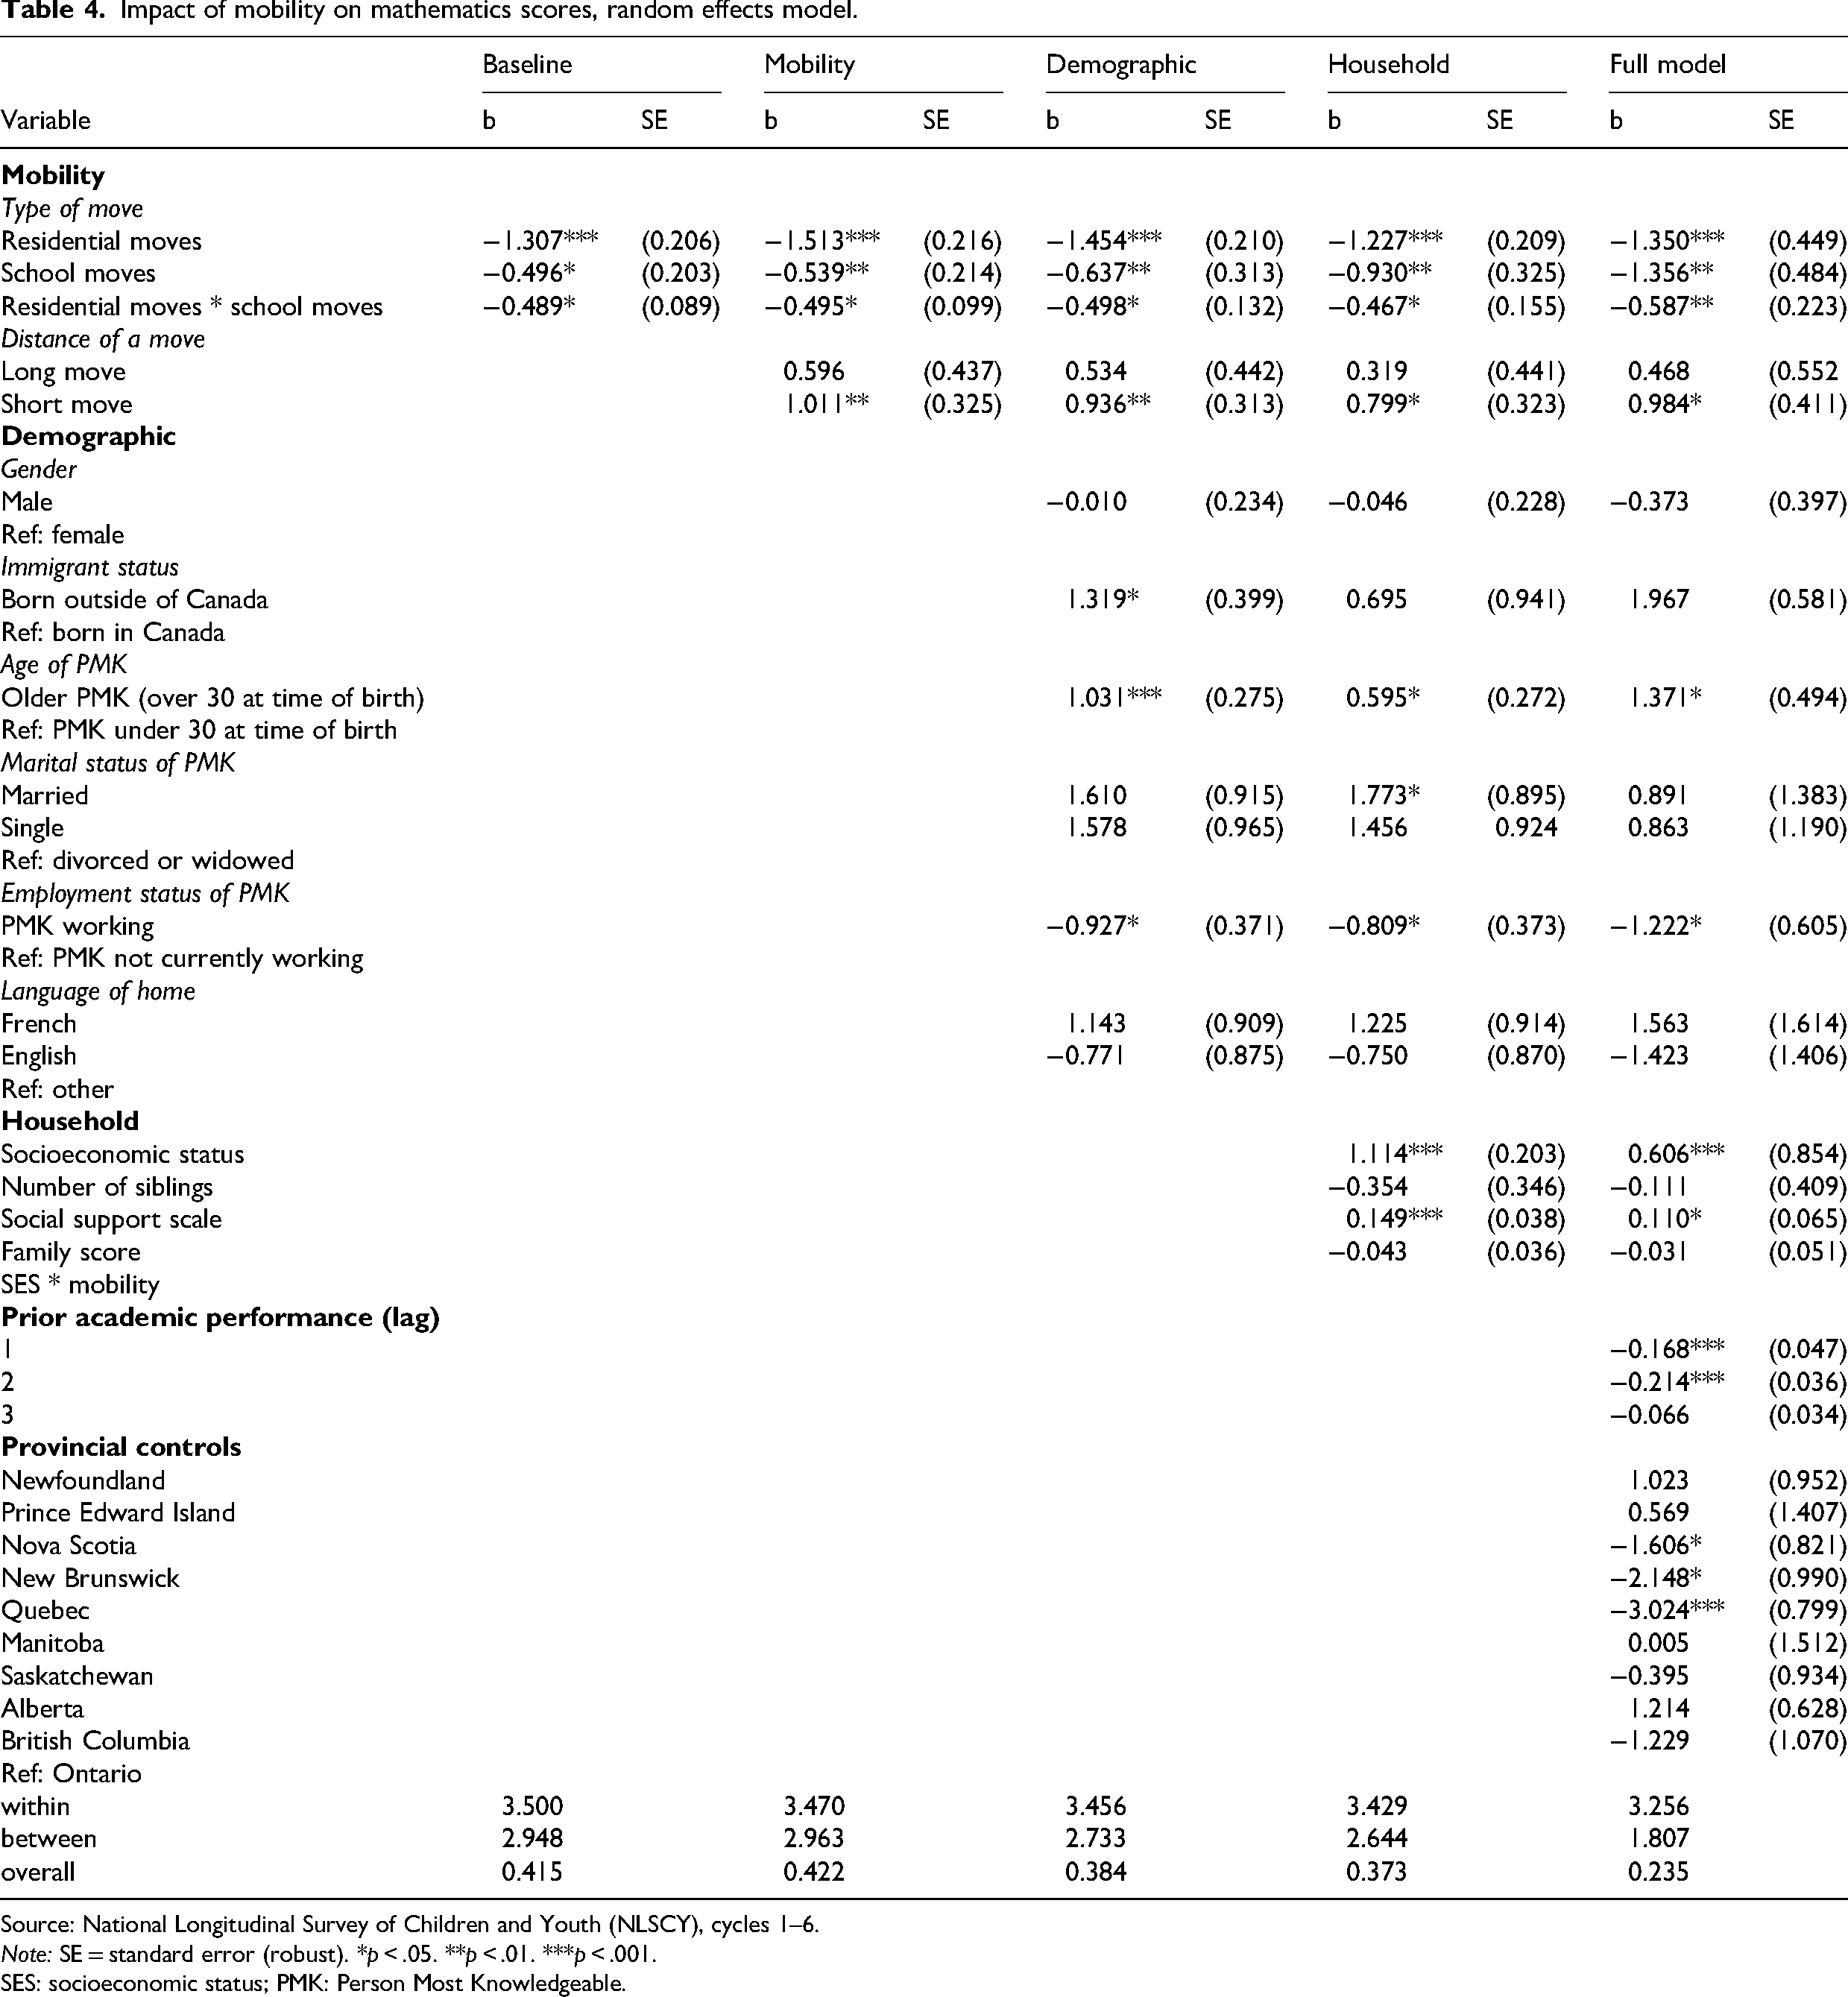
Source: National Longitudinal Survey of Children and Youth (NLSCY), cycles 1–6.
Note: SE = standard error (robust). *p < .05. **p < .01. ***p < .001.
SES: socioeconomic status; PMK: Person Most Knowledgeable.
Multilevel models that use data with repeated measures allow for the calculation of within and between variance to determine how much of the effects are determined by the repeated measure (in this case mathematics scores) across groupings (individual children). Therefore, it is possible to partition out what percentage is between-group effects and within-group effects or at the individual level. The results from the multilevel model above suggest that 11 percent of the effect of mobility on mathematic scores is explained by the variables at the individual level, or simply within children. The between-group effect, or the percentage attributed to the differences between children, is 17.8 percent. The overall effect is 15.8 percent. This suggests that the differences in mathematic scores can be better explained or attributed to differences between children rather than just at the individual level.
The results indicate that the number of residential moves leads to a 1.547 (p = 0.000) point decrease on the mathematics scale over time. This suggests that children who experience a residential move are likely to have an associated decline in mathematics and are, therefore, likely to face a significant disadvantage in mathematics. While this result is not unexpected, the magnitude of the impact for frequent movers is significant. Previous studies have highlighted the importance of moving on mathematic scores; however, it is less clear how multiple moves may pose additional risks. The results indicate that experiencing multiple moves over a short period of time has a significant impact on mathematic achievement after controlling for key socioeconomic and household characteristics.
Moving schools is also significant, with children who move to a different school at least once experiencing a 0.769 (p = .001) point decrease in mathematics test scores over time. Although changing schools doesn’t have the level of disadvantage as moving homes, it suggests that changing schools can impact a child's ability to do well in mathematics, particularly if multiple school moves occur over a short period of time. Given that moving homes and changing schools has an impact on math scores, an interaction between the two is included to show the compounding effect of experiencing both. For children that move to a new home and a new school, there is an additional 0.489 (p = 0.034) decrease in math scores. Therefore, moving to a new home and changing schools has a significant impact on math scores over time.
The results also indicate that the distance of move has a significant impact on mathematic scores over time. The effect of moving to a different CMA or province has a positive effect on math scores; however, it is not significant. In contrast, the impact of moving a short distance (e.g. moving to a different neighbourhood but within the same CMA) has a significantly positive impact on math scores (1.089; p = 0.021). The magnitude of this result is somewhat surprising given that moving, particularly shorter distances, is more common among lower socioeconomic households. The effect of moving shorter distances on math scores is likely a result the reasons for moving, which are not fully captured in this study.
The SES of the household plays a significant role in math scores over time. Children that come from homes with higher SES have a significant advantage: an increase on the SES scale results in a 1.278 (p = 0.000) point increase on the mathematic scale. This suggests that children who have parents with higher educational and occupational prestige, along with household income, are likely to have significantly higher mathematic scores, even if a residential or school move occurs. Therefore, household SES plays a significant role in mitigating the effects of migration.
In addition to SES, social support plays a major role in reducing the impact of migration on mathematic scores. Social capital is measured in the model by including a scale of social support, marital status, employment of the PMK, household size, and language. Children that have a strong support network including numerous family and friends that are actively involved in day-to-day activities experience a 0.177 (p = 0.001) point increase in mathematics over time. Therefore, children who move and retain this network have better mathematic scores than children who don’t. This also aligns with the results on a distance of move as children who move short distances are likely to retain their family and peer networks, and therefore, make the necessary adjustments in school after experiencing a residential and/or school move.
Age of the PMK at the time of school entry is also a significant indicator of math scores. Children with a PMK over the age of 25 experience a 0.765 (p = 0.004) point increase in math. This is likely a result of older PMKs having stronger social networks, higher levels of education, and better employment at the time of birth than younger PMKs. Other measures of social capital, including marital status, employment of the PMK, household size, language spoken in the home, and family functioning have no significant impact on mathematic scores over time.
Immigrant children have higher mathematic scores than their non-immigrant counterparts. Children born to immigrant parents, whether in Canada or outside of Canada, experience a 2.376 (p = 0.046) point increase on the mathematic scale compared to non-immigrant children. Given that immigrant children have likely already experienced a move, whether to Canada or within Canada, this effect is not surprising. Furthermore, as immigrant parents are likely to invest heavily in their child's educational success, having higher mathematic scores than non-immigrant children is consistent with previous studies. Sex doesn’t have a significant effect on mathematic scores over time after controlling for all other characteristics.
Hypothesis 1 (residential + school moves)
Our results support Hypothesis 1. Both residential and school mobility are independently associated with declines in mathematics scores, and these effects are strongest when the two forms of mobility occur concurrently. The interaction term between residential and school mobility is negative and statistically significant, indicating that children who move both residence and school between survey waves experience compounded disadvantages relative to children who are non-mobile or experience only one type of move.
Hypothesis 2 (socioeconomic status)
The findings also provide support for Hypothesis 2. When SES measures are introduced into the step-wise models, the negative coefficients for mobility are attenuated, suggesting that part of the association operates through differences in socioeconomic resources. Moreover, the interaction between SES and mobility shows that children from higher socioeconomic households are less adversely affected by residential and school moves than their peers from lower socioeconomic households. These results are consistent with the argument that socioeconomic resources buffer children against the disruptive consequences of mobility.
Hypothesis 3 (social capital)
Evidence for Hypothesis 3 is more mixed but generally consistent with expectations. Models including measures of social capital show a modest reduction in the negative effects of mobility on mathematics scores, suggesting that supportive networks and parental involvement help children adapt to the challenges of relocation. However, the protective effect of social capital is smaller than that observed for SES, and not all coefficients reach conventional levels of statistical significance. This indicates that while social capital plays a role, it may not be as robust a moderator of mobility's impact as socioeconomic resources.
Discussion
Prior research on childhood mobility has produced mixed findings, with many studies documenting negative associations between repeated moves and standardized test scores, high school attainment, and post-secondary enrolment (e.g. Astone and McLanahan, 1994; Hango, 2006). Other studies suggest that under certain circumstances, mobility can coincide with positive outcomes, depending on the timing of the move, the reasons for relocation, and household resources. For example, Jordan and Graham (2012) found that children with at least one transnational migrant parent reported lower happiness but showed no significant differences in academic performance. Our study builds on this literature by focusing on cases where entire families move, and by explicitly distinguishing between residential and school mobility.
The purpose of this paper was to disentangle the impacts of residential and school mobility and to situate these effects alongside SES and social capital. Using a longitudinal dataset that tracked a nationally representative sample of Canadian children over 8 years, we are able to provide a comprehensive analysis of how different types of mobility influence mathematics outcomes. This design allows us to assess not only the independent effects of residential and school mobility, but also how these effects are conditioned by household resources and social networks.
Our findings show that mobility has predominantly negative consequences for children's mathematics achievement. Both residential and school moves are associated with declines in test scores, and the negative association is largest when children experience both simultaneously. Among the two, residential moves appear to be the stronger driver of disadvantage, suggesting that disruptions tied to neighbourhood change – such as loss of familiar peer groups or community ties – have more enduring effects than school change alone. At the same time, our results demonstrate that mobility does not affect all children equally. Children from higher socioeconomic households show smaller declines in scores, indicating that financial and educational resources buffer against the disruptions caused by moving. Evidence for the protective role of social capital is weaker, but some indicators – particularly parental involvement – attenuate the negative association between mobility and achievement.
The role of social capital warrants closer attention. Although its effects are modest, children embedded in supportive family, school, and community networks experience less pronounced declines in mathematics scores following a move. This suggests that access to stable relationships and peer support can ease the adjustment to a new environment. Retaining friendships when moving short distances, or quickly establishing new ties when entering a new school, appears to help children maintain their academic performance. These results align with prior research emphasizing the importance of relational stability for child development (Coleman, 1988).
Our findings also have important policy implications. While some moves are motivated by opportunities for better housing or schooling, frequent mobility disrupts educational continuity, particularly for children in low-income households. Policymakers could consider targeted interventions to reduce the academic costs of moving. Examples include enhanced orientation programs for newly arrived students, tutoring or mentoring supports to bridge learning gaps, and greater coordination across schools to ensure curriculum continuity. Providing additional resources to families experiencing frequent moves may help prevent mobility from amplifying existing socioeconomic inequalities.
This study is not without limitations. As with most survey-based research, we cannot observe the reasons why families move. Some relocations may be precipitated by children's academic struggles or negative peer environments, which could introduce reverse causality. Similarly, unobserved factors such as family instability or parental employment shocks may influence both mobility and educational outcomes, raising the possibility of omitted variable bias. While we included lagged academic performance to mitigate these concerns, our results should still be interpreted as associations rather than causal effects.
We are also likely underestimating the effect of mobility, since our data only contain information on if a child moves between survey cycles, not how many times it may have occurred. Children who moved multiple times within the 2-year time frame were treated the same as those who moved once.
Despite these limitations, our results underscore the central role of socioeconomic inequality in shaping the consequences of mobility. Children from disadvantaged households experience the steepest declines in mathematics scores when they move, particularly when mobility is frequent or involves both residential and school change. These findings suggest that mobility functions less as an equalizer of opportunity and more as a mechanism that deepens educational inequality. Given that early academic achievement predicts long-term educational and labour market outcomes, these disadvantages may persist into adulthood and reproduce inequality across generations.
Footnotes
Acknowledgements
We wish to thank Anders Holm, David Walters, Michael Buzzelli, and Teresa Abada for providing useful feedback on this article. All remaining errors are the responsibility of the authors alone.
Ethics approval statement
Not applicable. This paper presents research from anonymized secondary data.
Patient consent statement
Not applicable. This paper presents research from anonymized secondary data.
Author contribution statement
AC was responsible for project conceptualization, writing and analysis. MH assisted with project conceptualization, writing and editing the manuscript.
Funding
The authors received no financial support for the research, authorship, and/or publication of this article.
Data availability statement
The administrative data used in this study were accessed under contract from Statistics Canada and cannot be publicly deposited because of confidentiality agreements and privacy legislation. The analytic code (Stata) are available publicly available in the Open Science Framework repository at ![]() . Researchers wishing to access the underlying administrative micro-data may apply to Statistics Canada in accordance with their data-access procedures.
. Researchers wishing to access the underlying administrative micro-data may apply to Statistics Canada in accordance with their data-access procedures.
Notes
1.
Our p-value of 0.068 points us in this direction.