
Abstract
To what extent do people still regard welfare policies as a policy issue owned by left-wing parties? To answer this question, this article studies the extent to which people use government partisanship (right/left) as a shortcut to infer how much public money is allocated to different policy domains and, subsequently, to develop a stance concerning the adequacy of public budgets. We use Spain as a case study, and we build a large database merging 22 representative public opinion surveys (1993 to 2019) with budgetary data by year and policy sector. We find that people use government partisanship as a shortcut to evaluate the level of public spending on social areas: when there is a left-wing party in government, people tend to believe that enough money is being spent on welfare. When there is a right-wing party in government, people tend to consider social expenditure as too low. This relationship holds independently of the actual level of public expenditure and of the economic situation, but it does not hold for expenditure on non-social areas. That is, in Spain the left still ‘owns’ social policies, since people believe these policies are better funded when a left-wing party is in office no matter what the real level of social expenditure is.
Social policies, party ownership and individual attitudes
The literature is clear in recognising the importance of left-wing parties and trade unions to the expansion phase of the Welfare State. Walter Korpi (1978) set the ground for this idea, which was developed later by other scholars (Iversen and Stephens, 2008; Pierson, 2001). However, there is also widespread agreement that party politics has lost relevance in social policy since the 1970s and specially throughout the 1990s and during the Great Recession (Streeck and Schafer, 2013). In difficult times, the ability of left-wing governments to strengthen social spending and social rights is limited (Wagschal and Wenzelburger, 2012): they fear being accused of excessive spending and it is not uncommon to see them deploy economic adjustment strategies that align with the ‘Nixon goes to China’ paradox (Bandau and Ahrens, 2020; Cowen and Sutter, 1998; Krafts, 2017: 2). The belief that social policies are no longer safe with left-wing parties has become a common view for some people, on the basis that even these parties prioritise economics over politics. At the same time, because the crisis has a negative impact on the majority of the population – including voters for right-wing parties – right-wing parties have been forced to refrain from making as many cuts to social spending as they would have desired (Kickert et al., 2015).
In the next pages we evaluate whether the loss of relevance of partisan politics in social policy, as noted in academic literature, is also perceived by most people. We study the extent to which people use government partisanship (right/left) as a shortcut for inferring how much public money is allocated to different policy domains and, subsequently, to develop a stance concerning the adequacy of public budgets. We expect that individuals will be more dissatisfied with the amount of spending on social policies when a right-wing party is in government (and that they will be more satisfied when the left is in government) regardless of the actual social spending and regardless of the country's economic situation. The level of social spending and the economic situation are included in the analyses as controls because they are the main contextual variables shaping citizens’ attitudes towards social expenditures (Dallinger, 2010).
We analyse Spanish data from 1993–2019, a period during which the country experienced successive years of rapid economic growth (e.g., public budgets ran a surplus of 2.5% GDP in 2005) and great recession (e.g., public deficits reached 11.4% GDP in 2009). Between 1993 and 2019, Spain experienced five different governments, each controlled exclusively by either the ‘left-wing’ Spanish Socialist Workers’ Party (PSOE) or the ‘right-wing’ People's Party (PP). Throughout this period, there were no coalition governments, and the ideological divide between these two major political parties remained pronounced, as documented by the Manifesto Project. This political landscape made Spain a compelling case study for our research question. However, since 2020, the political scenario has become more complex, notably with the significant entry of an extreme right-wing party into the national parliament, with welfare chauvinism as one of its issues. We will revisit these developments in the Discussion section.
We created an extensive database merging 22 representative surveys of the Spanish population carried out between 1993 and 2019 by the Spanish Centre for Sociological Research -Centro de Investigaciones Sociológicas (CIS hereafter), – a public body allocated to public opinion research. The surveys (random sample, face-to-face interviews, average sample size of 2500 respondents) asked interviewees to evaluate the adequacy of public spending in various policy sectors: healthcare, education, old-age pensions, unemployment support, public works and defence. Having a broad catalogue of policies with which to compare social policies allows for a more nuanced analysis of the role played by the partisanship of government in changes of public opinion concerning public spending. We also included in this large database carefully elaborated budget data for each policy sector and year, as well as the partisanship of the government (left/right) and an indicator of the economic cycle.
Our analysis builds on the findings of the literature on issue ownership to provide evidence that enhances our understanding of opinion formation within the electorate, particularly regarding the strategies individuals use to develop their social and public policy preferences. In a nutshell, we find that citizens continue to associate social policies with left-wing parties and that government partisanship is a relevant contextual variable in explaining public opinion on social spending. No matter the actual level of public expenditure, citizens are more prone to consider that social policies are adequately funded when a left-wing party is in Government. This shortcut functions when people are asked to evaluate the money spent on social policies, but it does not function for other areas of public expenditure (such as defence or roadworks) and its use is more extensive among left-wing individuals.
The article is organised as follows. In the second section, we review previous research on the variables that can explain people's attitudes towards social and public spending. We also explain our main expectations. In the third section, we discuss data and measurement. In the fourth section, we present our results. Finally, in the fifth section we discuss our results and present conclusions and their implications for further research.
Literature review, framework and hypotheses
People make assumptions about which political party is better able to ‘handle’ different problems facing the country. In the seminal work of Petrocik (1996) ‘handling’ is ‘a reputation for policy and program interests, produced by a history of attention, initiative, and innovation towards these problems, which leads voters to believe that one of the parties (and its candidates) is more sincere and committed to doing something about them’ (Petrocik, 1996: 826). When most voters perceive that one party stands out for its competence or dedication to an issue, then this party ‘owns’ the issue (Stubager and Slothuus, 2013).
Literature on issue ownership has extensively studied this phenomenon. Particular attention has been given to the sources of ‘issue-ownership’ and to its effects in political campaigns to influence voting (Egan, 2013; Petrocik et al., 2003; Rahn, 1993; Stubager and Slothuus, 2013; van der Brug, 2004). Other studies have aimed to disentangle the dimensions of the concept or its adequate measurement (Stubager, 2018; Walgrave and Soontjens, 2019).
In this article we borrow the concept of issue ownership from the above-mentioned literature and bring it to the field of studies on public opinion regarding social policies. For a long time – between the post-Second World War period and 1986 – social democratic governments led the way in implementing redistributive policies that contributed to a sustained decline in inequality (Stephens, 2015). As a result, increasing public spending and a commitment to social policies tend to be attributed to the left, while public order and security policies and economic efficiency have tended to be attributed to the right (Seeberg, 2017).
A substantial body of research has explored the mechanisms by which individuals form opinions on social policies, as well as the micro- and macro-level determinants of these opinions. At the micro level, it is well-established that people's opinions and preferences regarding social policies are primarily influenced by two factors: individual ideology and socioeconomic status (Blekesaune and Quadagno, 2003; Sachweh, 2019). The factors shaping public opinion on social policies at the macro level are more contested (Blomberg and Kroll, 1999; Sevä, 2009), but two contextual variables have been shown to impact preferences for increased or decreased social spending: the economic conditions of the country and the level of public expenditure on social policies (Dallinger, 2010).
In this article, we propose an additional contextual variable that may explain public opinion on social spending and particularly shifts in these opinions: the partisanship of the government. However, before introducing this variable, we will first discuss the two contextual variables identified in previous literature and the debates surrounding their influence.
First, one contextual factor considered as a possible determinant of attitudes towards public spending is the point in the economic cycle at which opinion is measured (Pierson, 1993: 625; Sachweh, 2019; Schlozman et al., 2005; Soroka and Wlezien, 2010; Stevenson, 2001; Stimson, 1991). Using data for the US and for the period 1968–1988, Durr (1993) found support for the hypothesis that a strong economy results in greater support for more public expenditure, while expectations of declining economic conditions push the national ‘policy mood’ to prefer decreases in public spending (also Stevenson, 2001).
However, studies using more detailed data found different effects for different economic indicators. For example, Erikson, Mackuen and Stimson (2002) show that unemployment levels are positively correlated with preferences for increased state intervention in the economy, but an increase in the level of inflation pushes the national policy mood to the right. In the same line, Ferguson, Kellstedt and Linn (2013) revised the works of Durr (1993) and those of Erikson, Mackuen and Stimson (2002) to find no evidence for the claim that people's attitudes react to the economic situation.
Concerning the second contextual variable: the actual level of social spending, many authors argue that, at a general level, individuals recognise policy changes and adjust their policy attitudes accordingly (Page and Shapiro, 1992; Wlezien and Soroka, 2014). In a now classical study, Wlezien (1995) developed a notion of thermostatic public opinion by which ‘the public adjusts its preferences for ‘more’ or ‘less’ policy in response to what policy-makers do’ (Soroka and Wlezien, 2005: 667).
Soroka and Wlezien demonstrated that public preferences for more or less public expenditure do shift in response to changes in public expenditure. When ‘activity in a policy area increases (decreases), the preference for more of a given policy will decrease (increase), other things being equal’ (Soroka and Wlezien, 2010: 23). Similar results have been found by Erikson et al. (2002) and Stevenson (2001), the latter showing that higher social spending causes the policy mood to shift to the right. Interestingly, the thermostat effect varies across countries. In the US and UK, people respond to changes in public spending, but the effects are more pronounced in the UK than in the US (Soroka and Wlezien, 2010, 2014).
Nevertheless, the thermostat theory also has its critics. Hakhverdian (2012) looked at Eurobarometer data for the UK between 1973 and 2006 and found evidence that changes in public budgets are translated into changes in public opinion only under certain conditions. Brooks and Manza (2013) focused on US data from 1984 to 2010 and found that, on average, people's preferences regarding state intervention were not related to actual expenditure levels or the economic situation in the US. The lack of a relationship between economic situation and public opinion would be explained by the fact that, in the context of a crisis, parts of the electorate move in one direction while other sections move in the opposite direction. There would be not ‘one effect’ of contextual changes on public opinion but different effects for different publics (Brooks and Manza, 2013; Clarke et al., 2013)
In this article, we propose an additional contextual variable that may explain public opinion on social spending: the partisanship of the government. As we mentioned previously, social policies are an issue traditionally ‘owned’ by left-wing parties, and this fact can function as a heuristic or cognitive shortcut, i.e., an assumption about the political arena used (sometimes unconsciously) to develop a stance on complex political issues, without necessarily possessing a large body of knowledge about politics, or when people lack full information about the situation (Sniderman, Brody and Tetlock, 1991: 19). From the seminal work of Zaller (1992) the academic literature agrees that mechanisms of opinion formation are not straightforward, and political elites’ discourses shape the formation of political attitudes. This is particularly relevant to understand opinions on public expenses because most people's knowledge of economic and policy decisions is far from perfect (Bartels, 1996; Corr and Plagnol, 2023; Lupia and McCubbins, 1998). Information about public budgets is not easy to obtain even for experts, and few people are motivated to search for complex information (James and Van Ryzin, 2017). These factors make the realm of public opinion on public spending particularly prone to the use of heuristics (Fortunato et al., 2016: 18).
Although the literature has established the importance of heuristics in the formation of political attitudes, these are combined with other elements and influences (Ciuk and Yost, 2016). Party cues do not inhibit individuals’ rational thinking about policy and people's attitudes are also affected by sociodemographic position, by issue salience or by emotions, such as anxiety and risk perception (Albertson and Gadarian, 2015; Bullock, 2011; Ciuk and Yost, 2016).
In this article we evaluate the role of government partisanship on attitudes to social spending controlling for the two alternative contextual variables identified by previous literature as relevant: economic situation and actual level of public expenditure. We expect that, even with the controls, government partisanship will have a predictive effect on people's attitudes, so that when left-wing parties are in office, complaints about insufficient spending on social policies will be smaller. We also expect, on the grounds of the literature presented above, that this effect should be stronger for people with left-wing ideology, since they give particular importance to social policy. And that the effect should not exist for attitudes towards public spending in non-social areas, as the left ‘owns’ social policy but not other policy areas.
Data, variables and models
Data and variables
To address our expectations we need to compare the evolution of people's attitudes towards public expenditure with the actual evolution of these expenditures, paying attention to the differences between periods of left-wing and right-wing government and controlling for the economic situation. To do so, we built a large database merging 22 attitudinal surveys conducted by the Centre for Sociological Research –CIS– between 1993 and 2019. We have data for every year except 2000–2004, when no survey included the battery of questions on public expenditure. Each survey includes face-to-face interviews with about 2500 randomly selected adults (18+) living in Spain at the time of the fieldwork. Spanish nationals and non-nationals are included in every sample; hence surveys are representative of Spanish residents aged 18+ (i.e., people of 18 years and older living in Spain at the time of the fieldwork with Spanish nationality or other). Samples are stratified by region and town size, with a standard error of (±2) for a 95.5% confidence level. The merged database includes 44,715 individuals and 22 years (about 2.500 individuals evaluating public spending in different domains each year).
Regarding the questionnaire items used in the analyses, we decided to measure attitudes towards different policy domains rather than using only a general question about the sufficiency of public spending. Although it is common to find popular resistance in Western countries to increased public spending, people's attitudes are more diverse when asked about specific policies (Bendz, 2015; Eismeier, 1982; Soroka and Wlezien, 2010; Stimson, 1991), and it would not be surprising to find that different policies have different attitudinal determinants.
The battery used in the CIS surveys includes many different policy areas, but to ease the interpretation of results, we chose items related either to social policies (education; healthcare; unemployment protection; old-age pensions) or sovereignty policies (public works; defence).
The CIS has asked about public expenditure using various formulations over the years, and only the following question has had an almost uninterrupted series since the mid-1980s:
Q. As you know, the government devotes the money we pay in taxes to fund public services and benefits. Please tell me if you consider that the government is spending too much, a fair amount or too little in the following areas: education, healthcare, pensions, unemployment protection, defence, public works.
We have included explanatory contextual variables into the attitudinal database created by the aggregation of 22 surveys on: (a) the ideology of the party in power (1 = left or 0 = right); (b) the economic situation (1 = crisis; 0 = else); and (c) the public budget allocated to each area every year. None of these variables has a straightforward operationalisation and our decisions require some explanations. Starting with the economic crisis, having in mind that this variable will be used only as a control we chose to create an indicator that distinguishes years of economic crisis from the rest. Between 1993 and 2019, Spain experienced two economic crises. The periods of economic decline were mainly 1991 to 1993 and 2009 to 2013. As usual when studying the impact of economic changes on individual attitudes, the variable ‘crisis’ was included with one-year lag to leave room for the crisis to have taken effect. The years in which we expect to find an effect for the crises in the logistic regression models are thus 1992–1994 and 2010–2014. However, as the effects of economic crises are likely to be gradual and increasing as the crisis deepens, we combine a descriptive analysis on the basis of graphs with the results of our regression models in order to better explore the effects of the economic crises on attitudes.
The operationalisation of ‘government partisanship’ is a quite simple variable that distinguishes ‘left-wing’ governments and ‘right-wing’ governments. Spain had no coalitions in Government during the period under study. The partisan alignment of the government in power changed four times from 1992 to 2019, but in every case the Government was in the hands of only one of these two parties: The Spanish Socialist Workers Party (Left); or the Popular Party (Liberal-Conservatives); The Spanish Socialist Workers Party (Left) controlled the national government from 1992 to March 1996; in March 1996, the Popular Party (Liberal-Conservatives) won the general elections and held power until March 2004, when the Spanish Socialist Workers Party regained control. The Socialist Party was in power until November 2011, when the Popular Party won the general elections. The Popular Party retained power until July 2018.
During the entire period these two parties were clearly aligned with a “left-wing” or “right-wing” ideology, both in their public statements and in academic databases such as Party Manifesto. Government partisanship is not lagged in the regression models because as, due to the extensive media coverage of general elections, it is clear to most people from the start of the mandate which party is in power.
In relation to the public budget allocated to each area, we devoted considerable time to developing our spending variables. Each series was constructed on the basis of the consolidated general state budgets (Secretary of State for Budgets and Expenditures, 2005-2019) as the main source. We completed these data with information from regional budgets for health and education policies, which are decentralised in Spain (Budgets, Public Accounts and Financing Systems, 2019). Sometimes the expenditure data were provided according to classifications which did not correspond to the substantive categories used by individuals to discuss the role of government and were also therefore adjusted 1 . In addition, the official data were expressed in millions from 2011 (to allow for the effects of inflation -this is why we speak of actual expenditure); and in per capita terms (for reasons of representativeness when analysing the relationship between expenditure variation and people's preferences).
The main focus of this article is to understand how government partisanship shapes individuals’ preferences for more or less public spending, and for that reason we have also included in the regression models an individual level variable on ideology. The original variable asked people to place themselves on a typical 1–10 scale where ‘1’ means left and ‘10’ means ‘right’:
Q. When talking about politics, the expressions left and right are commonly used. By placing ourselves on a scale of 10 boxes, like a thermometer, ranging from 1 to 10, where 1 means ‘furthest to the left’ and 10 means ‘furthest to the right’, in which box would you place yourself?
This variable was recoded into three categories: 1–4: left-wing ideology; 5: center ideology; 6–10: right-wing ideology. As we will explain later, we are not interested in the effect of ideology on attitudes towards public policies (there is a vast literature on this issue) but on its interaction with government partisanship: i.e., ideology at an individual level is included only to better understand how people change opinions depending on the ruling party.
Models and analysis
We performed two types of analysis using the abovementioned database: first, we elaborate graphs showing: (a) the evolution of attitudes towards public expenditure; and (b) the evolution of public spending, in each area under study. They provide an initial indication of the correlation between attitudes and spending and are particularly useful for observing the gradual impact of the economic situation on attitudes.
Second, we ran logistic regression models 2 for each policy area with attitudes towards public spending as the dependent variable. The original questions were transformed into dummy variables to indicate whether people consider funding insufficient (1 = government is spending too little) or whether they consider that the policy is sufficiently funded (0 = government is spending a fair amount + government is spending too much)
For each of the dependent variables, the precise models have this form:
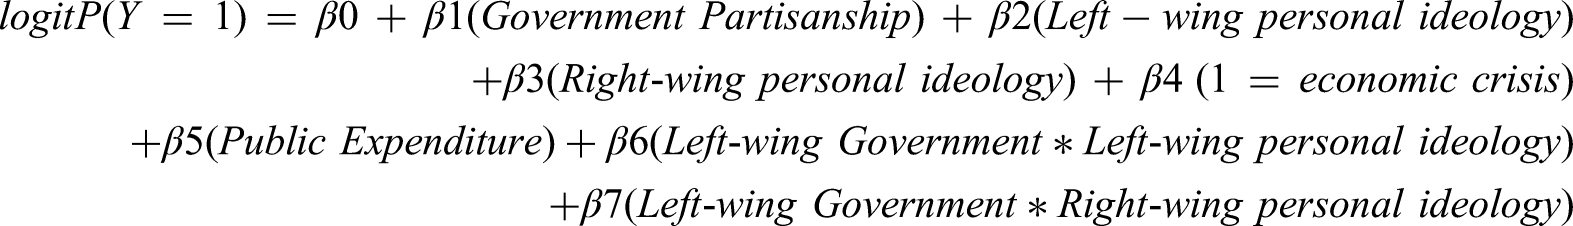
**Government partisanship is included as a binary variable where ‘1’ indicates years of Left-wing governments and ‘0’ indicates years of right-wing governments. Ideology is included as a nominal variable with three categories: 1-left-wing ideology; 2-right-wing ideology; 0-center ideology. The coding is carried out so that the reference category is ‘0-center ideology’. The economic situation is a binary variable where ‘1’ represents years of economic crisis and ‘0’ years with no economic crisis. 3
As we explained in the previous section, based on previous literature we expect that government partisanship will have an effect on people's attitudes to social spending. Particularly, we expect that when left-wing parties are in office, complaints about insufficient spending on social policies will be smaller. We understand this relationship as a manifestation that the left ‘owns’ social policies, and therefore we also expect that this relationship only holds when we ask people to evaluate spending in social areas and not in other areas such as defence, or public works.
We can formalise these expectations in hypotheses to guide the empirical analyses:
H1. Independently of the economic situation of the country and of the actual level of public spending, government partisanship = 1 (left-wing government) will decrease the probability of considering public spending as ‘too little’ when we ask people to evaluate the level of spending in social areas. H2. Independently of the economic situation of the country and of the actual level of public spending, government partisanship = 1 (left-wing government) will have no effect on the probability of considering spending in non-social areas as ‘too little’. H3. Independently of the economic situation of the country and of the actual level of social spending, the interaction between government partisanship = 1 (left-wing government) and left-wing personal ideology will be statistically significant when individuals are asked to evaluate public spending in social areas. That is, the existence of a left-wing government will reduce the probability of evaluating social spending as ‘too little’ more for left-wing individuals than for right-wing individuals.
Results: What explains change in support for public spending?
The evolution of attitudes toward public spending
Figure 1 illustrates how attitudes change over time. It shows the percentage of respondents who consider public expenditure to be ‘too little’ for each policy area at each time point. At first glance, it appears that attitudes differ depending on the policy area. For example, the percentage of respondents who considered defence expenditure to be ‘too little’ remained well below 20% throughout the period; whereas the percentage who considered health and pension expenditure to be ‘too little’ was close to or above 50% for most of the period. However, it is difficult to draw clear conclusions about the influence of the context on attitudinal change just by looking at Figure 1.
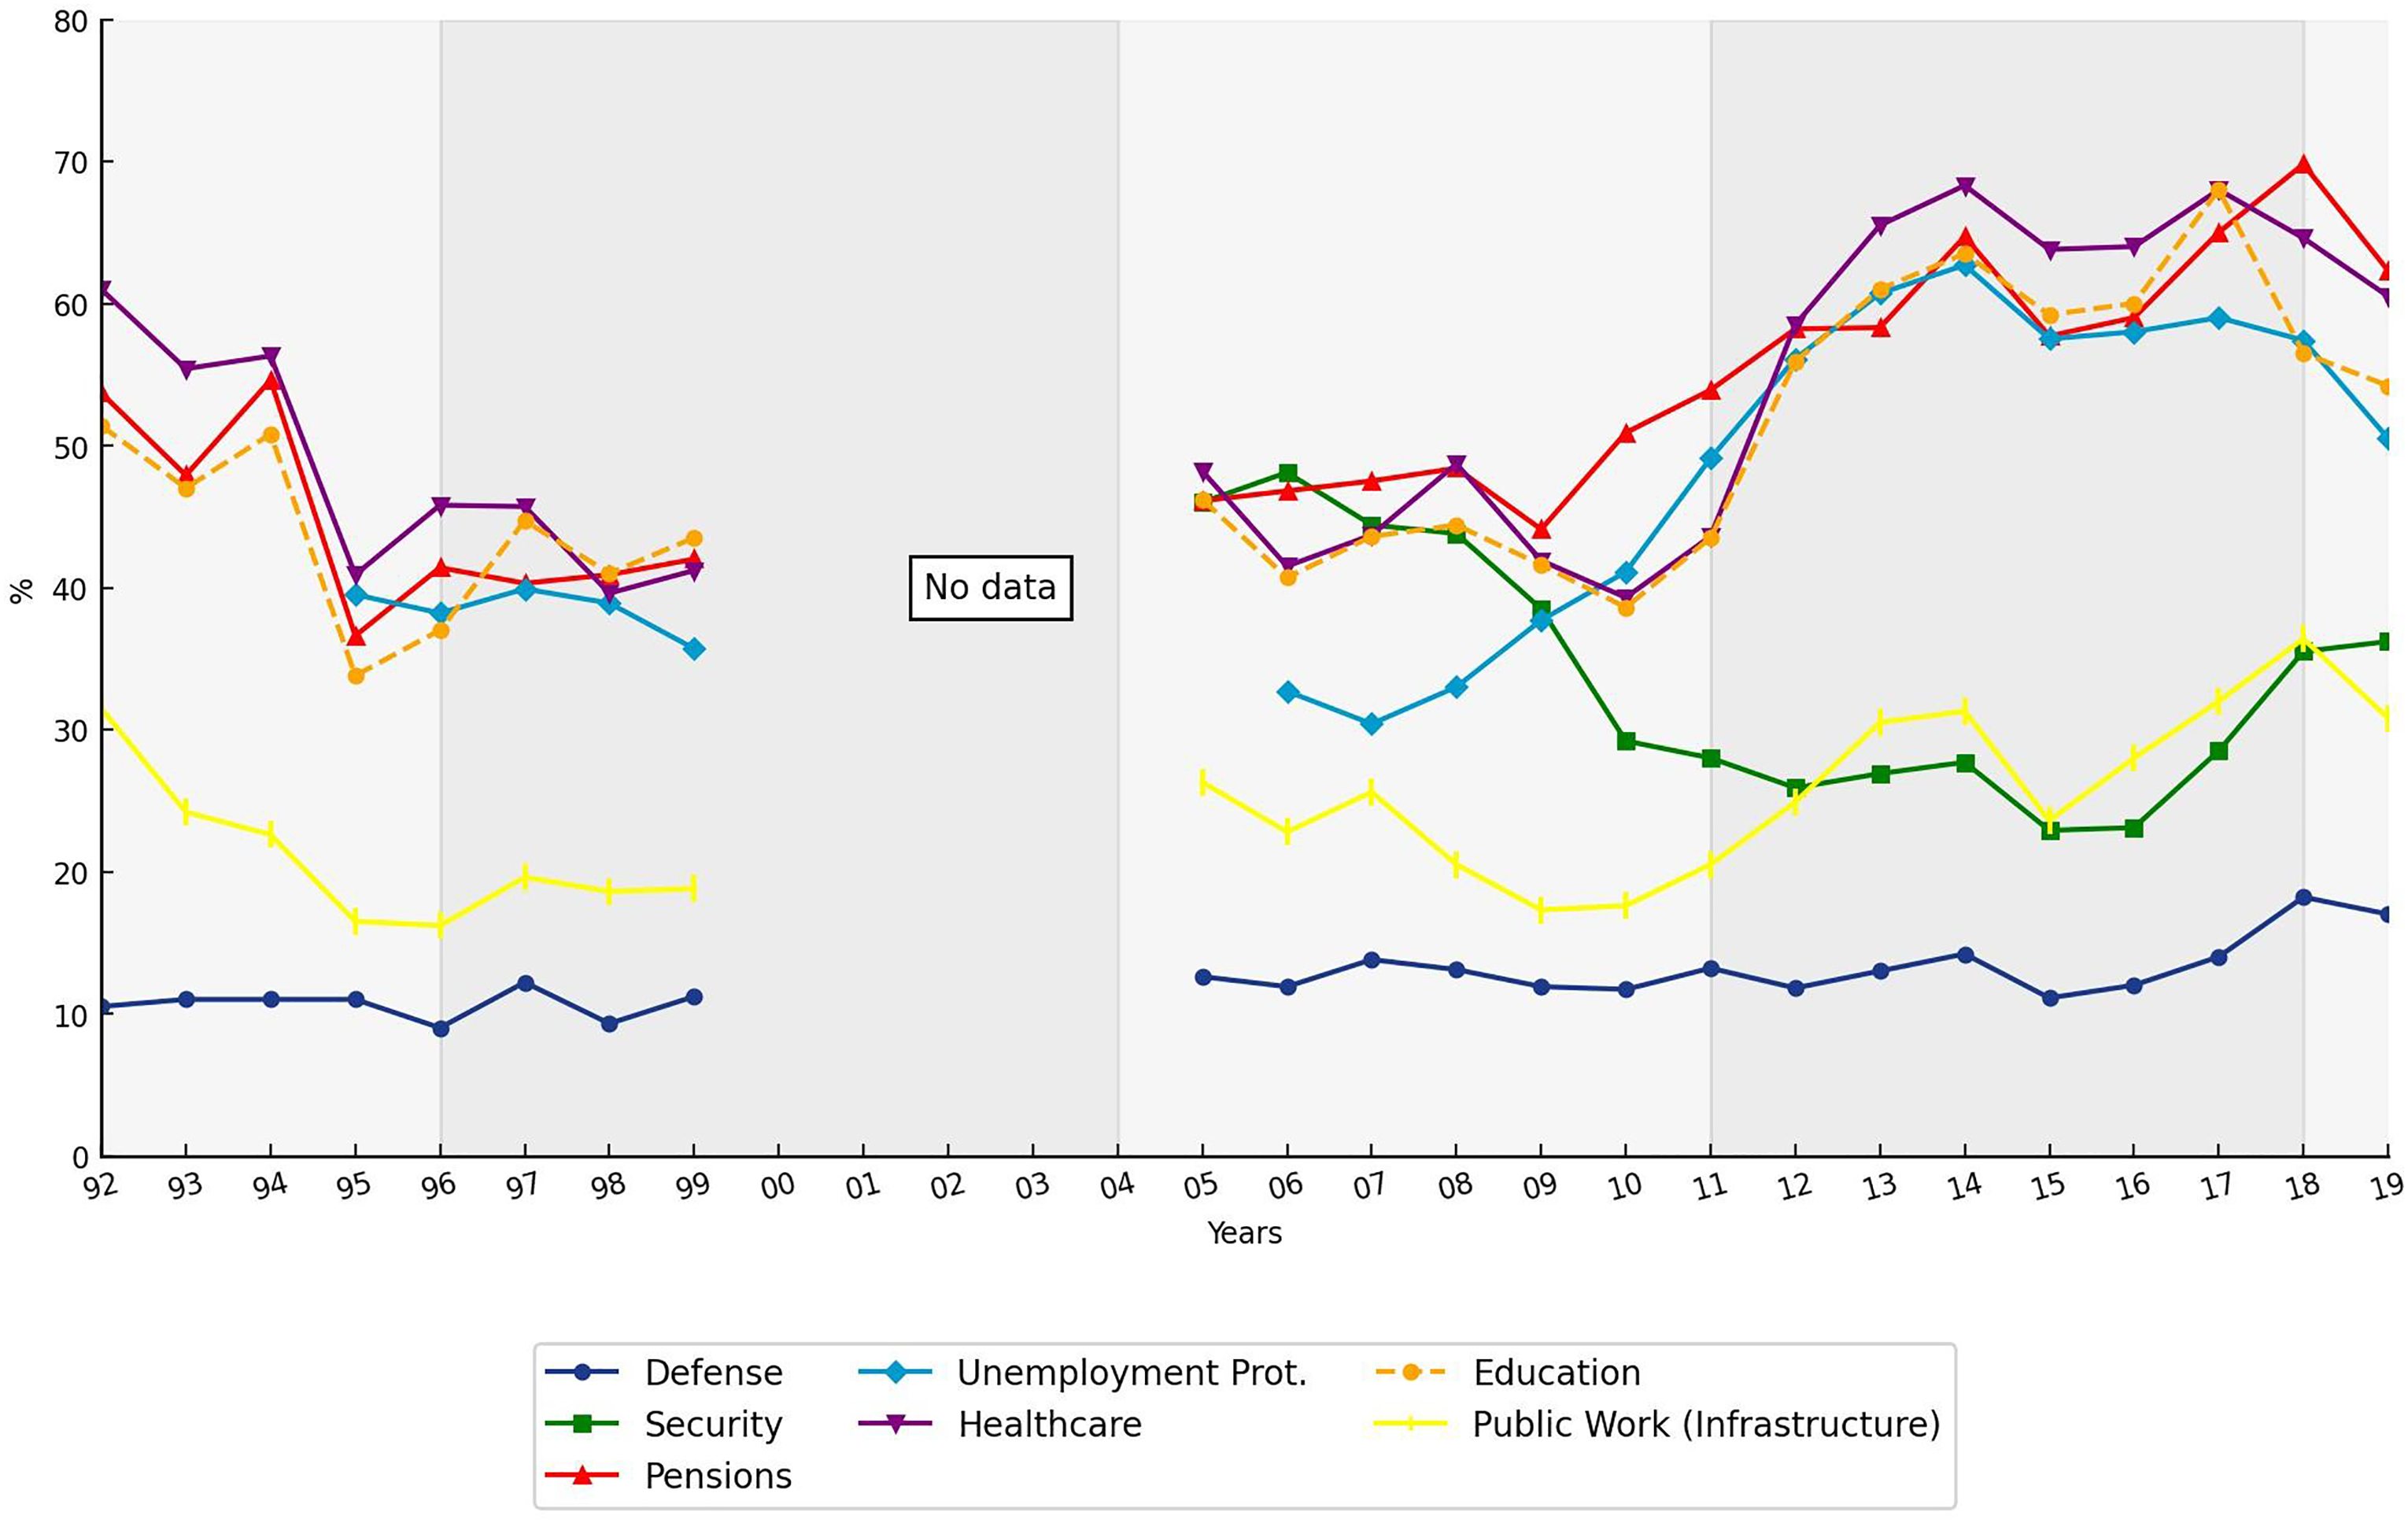
Percentage of respondents saying that public spending in different areas is “too little” (1992–2019). Source: own elaboration with CIS data. Question: “As you know, in Spain the government devotes the money that we pay in taxes to fund public services and benefits. Please tell me if you consider that the government is spending too much, a fair amount or too little in the following areas: education, healthcare, pensions, unemployment protection, defence, public works (infrastructure) and security”.
Focusing on the right-hand side of the figure (from the 2008 economic crisis onwards), we can see that the view that too little was spent on social policies increased enormously from 2010 to 2014. While this could be interpreted as a result of the economic crisis, attitudes towards spending on ‘sovereignty policies’ (public works and defence) remained much more stable during this period.
Comparing the evolution of people's attitudes towards public spending on social and sovereignty policies (Figure 1) with the evolution of the actual spending on these policies (Figure 2) shows that the thermostat theory is not fully applicable. It cannot explain changes in attitudes towards public spending on pensions, which varied during this period despite a sustained increase in public spending. The theory is better able to account for changes in attitudes towards spending on healthcare and education, whose budgets decreased from 2010 until 2014, in parallel with increases in the percentage of respondents considering that the money spent in these areas was ‘too little’. Examining the graphs, it is evident that factors other than the economic situation and the level of public spending influence people's evaluations of the adequacy of public funding. The empty area on the graph corresponds to the period from 2000 to 2004, during which time the battery of questions regarding the adequacy of public spending was not included in any CIS survey.
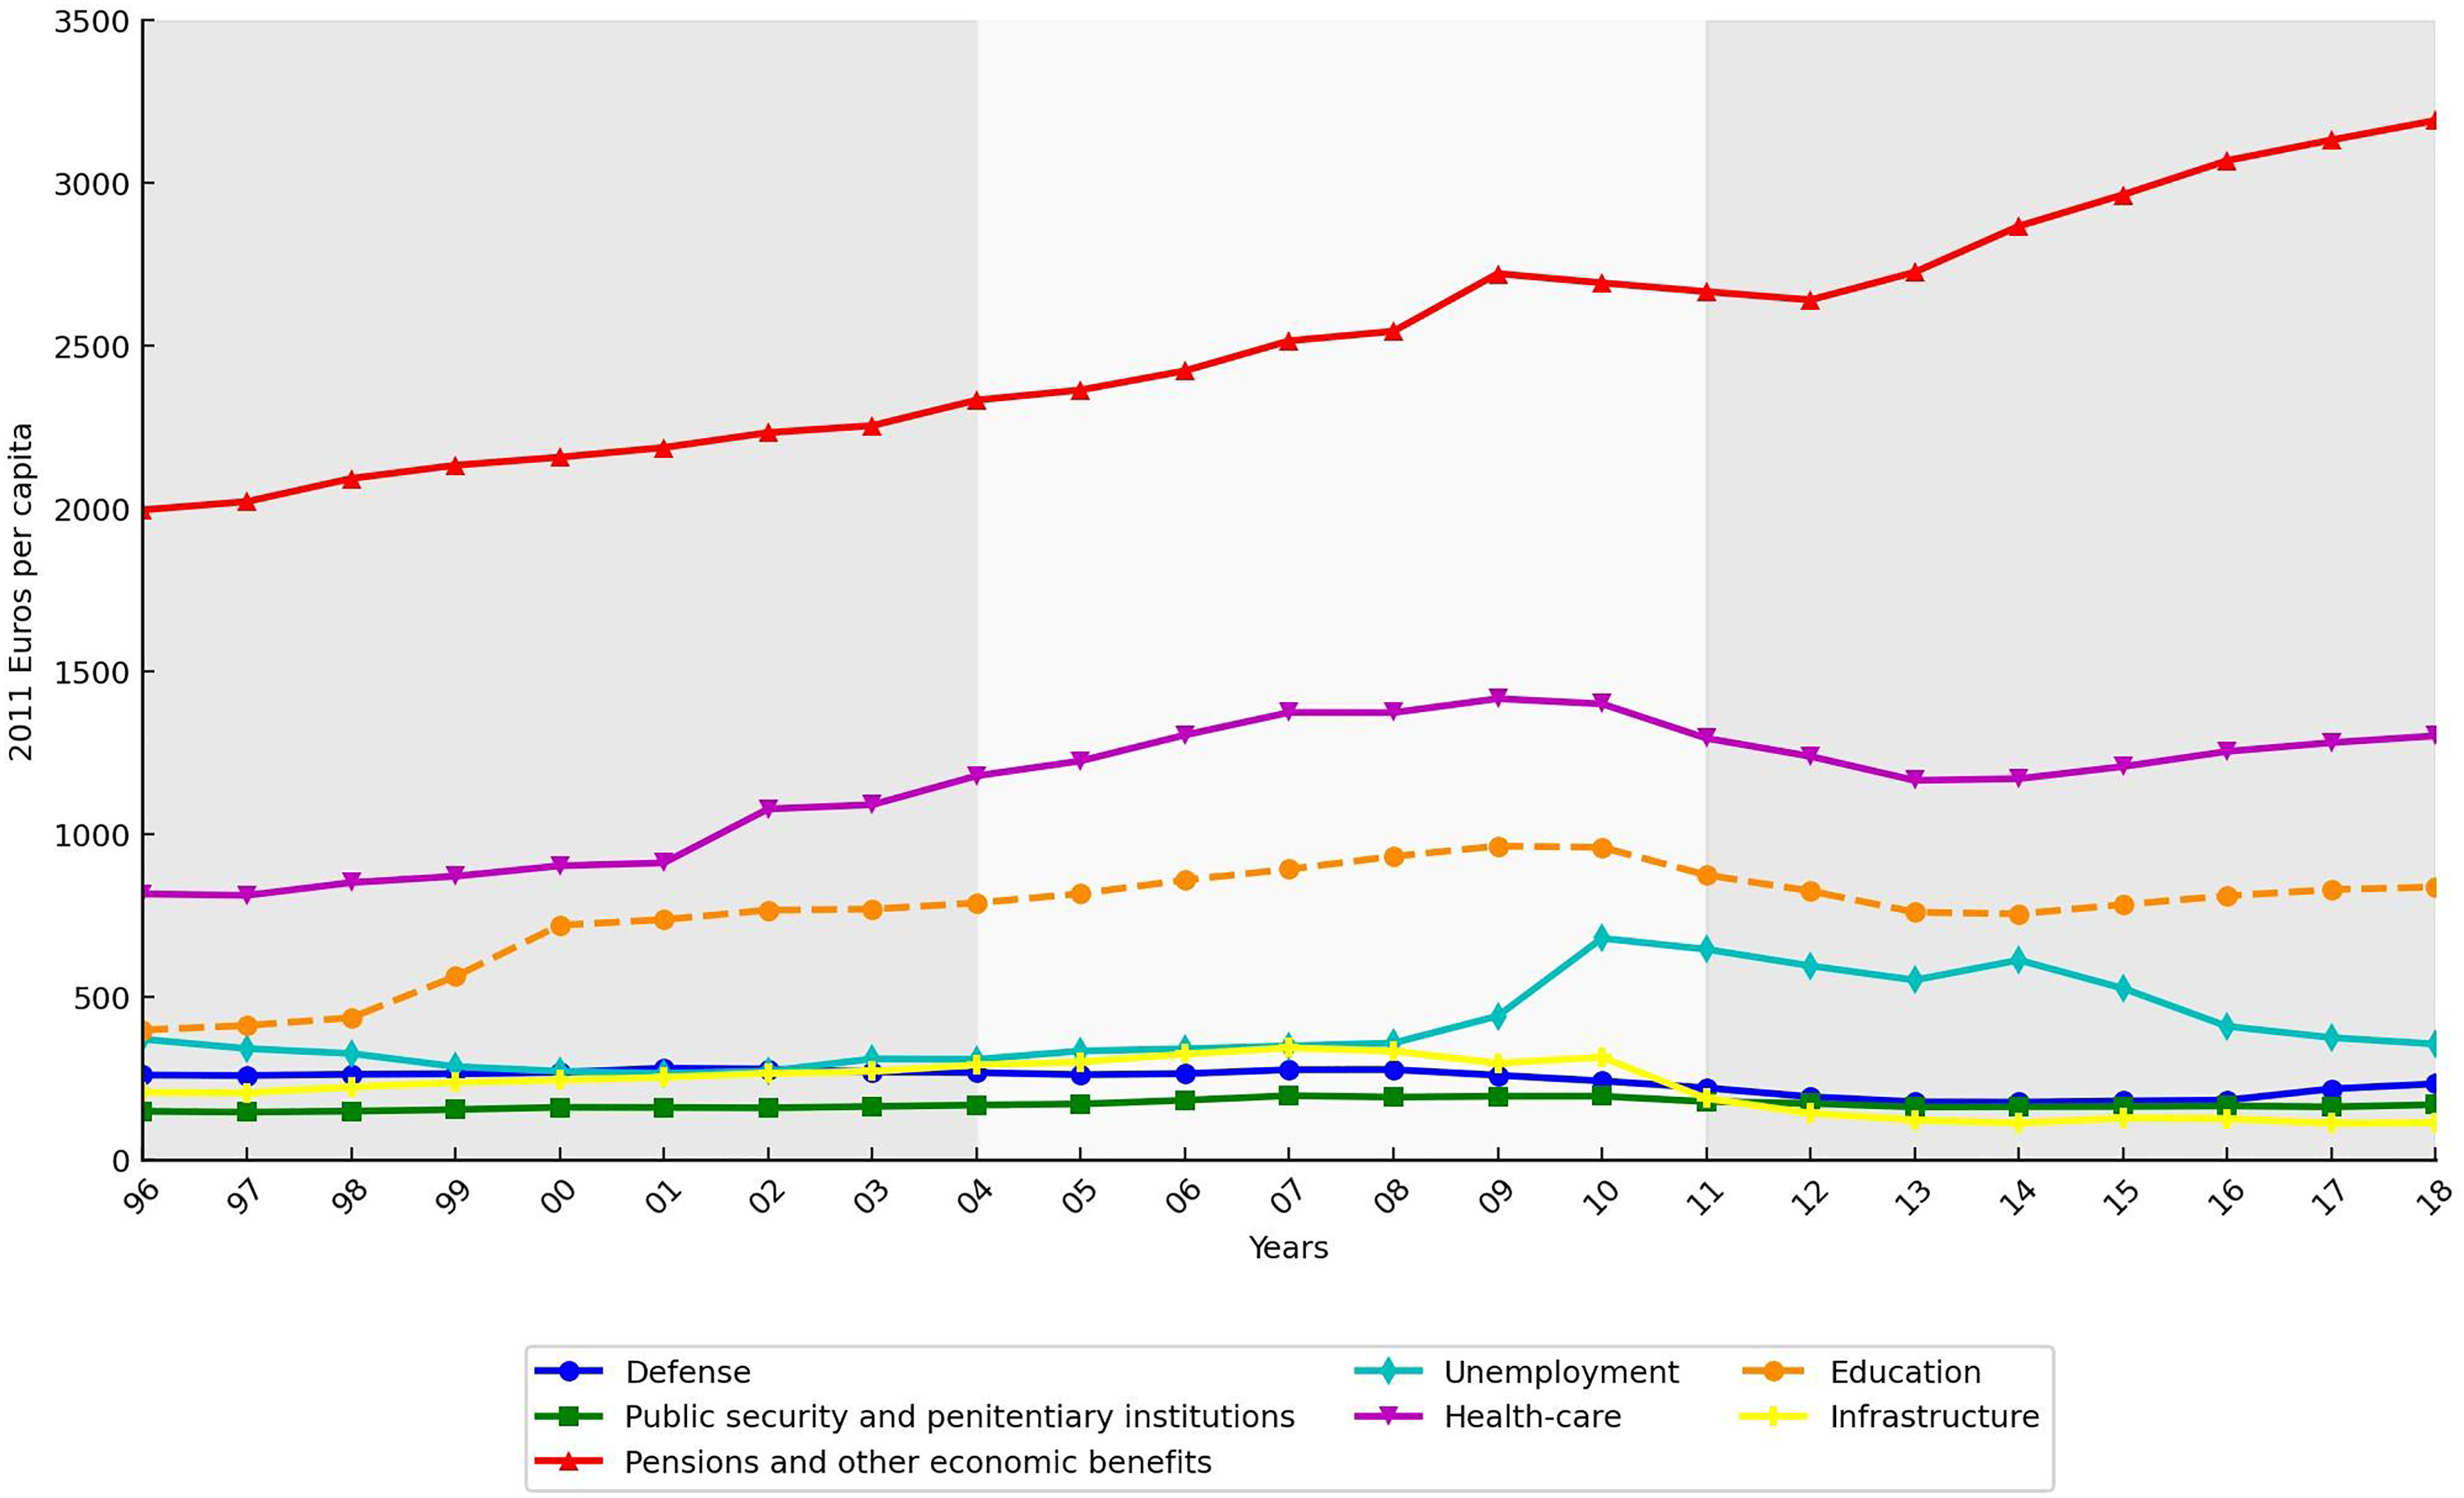
The evolution of public expenditure 1996–2018. Source: defence, security, pensions and other economic benefits, and unemployment protection expenditure: own elaboration on the basis of data issued by the Secretary of State for Budgets and Expenditure (2005-2019) and the National Statistics Institute (INE). Health, education and infrastructure expenditure: own elaboration on the basis of data issued by the Secretary of State for Budgets and Expenditure (2005-2019), the Budgets, Public Accounts and Financing Systems (2019) and the INE. Note: In both Figure 1 and Figure 2, the lighter grey bands correspond to governments of left-wing ideology, and the darker grey bands to governments of right-wing ideology. We have tried to visually match the years and stripes, as well as the line reflecting the area of expenditure.
Explanatory factors for changes in attitudes to public spending over time
This section details the results of the logistic regression models. As previously explained, the models include attitudes towards public spending on each policy as the dependent variable (1 = public spending is ‘too little’; 0 = public spending is ‘a fair amount’ or ‘too much’). The independent variables are government partisanship (1 = left; 0 = right); an indicator of the economic cycle (1 = crisis; 0 = other); the actual amount of money allocated to the policy (lagged by one year); and the personal ideology of the respondent (1 = centre; 2 = left; 3 = right). Table 1 presents the coefficients of the models that aim to explain attitudinal changes concerning spending on welfare policies. Table 3 which will appear latter presents the models concerning sovereignty policies. As can be seen, the predictive power of the models is small (R2), which is not surprising given that we did not include the major predictors of individuals’ attitudes to public spending in them: personal income; family income; educational level; and whether or not the respondent is a recipient of welfare programmes. Note that we are not running the models to fully explain attitudes towards public spending, but rather to evaluate the existence of a new contextual determinant of these attitudes: government partisanship. The robustness of the models (Chi2) is very high, indicating that they are useful for understanding attitudes. As we detail below, the coefficients for the variable ‘government partisanship’ are statistically significant, indicating that this contextual variable influences attitudes.
Binary logistic regression models. Probability of evaluating public expenditure on welfare programmes as ‘too little’ (Y = 1).
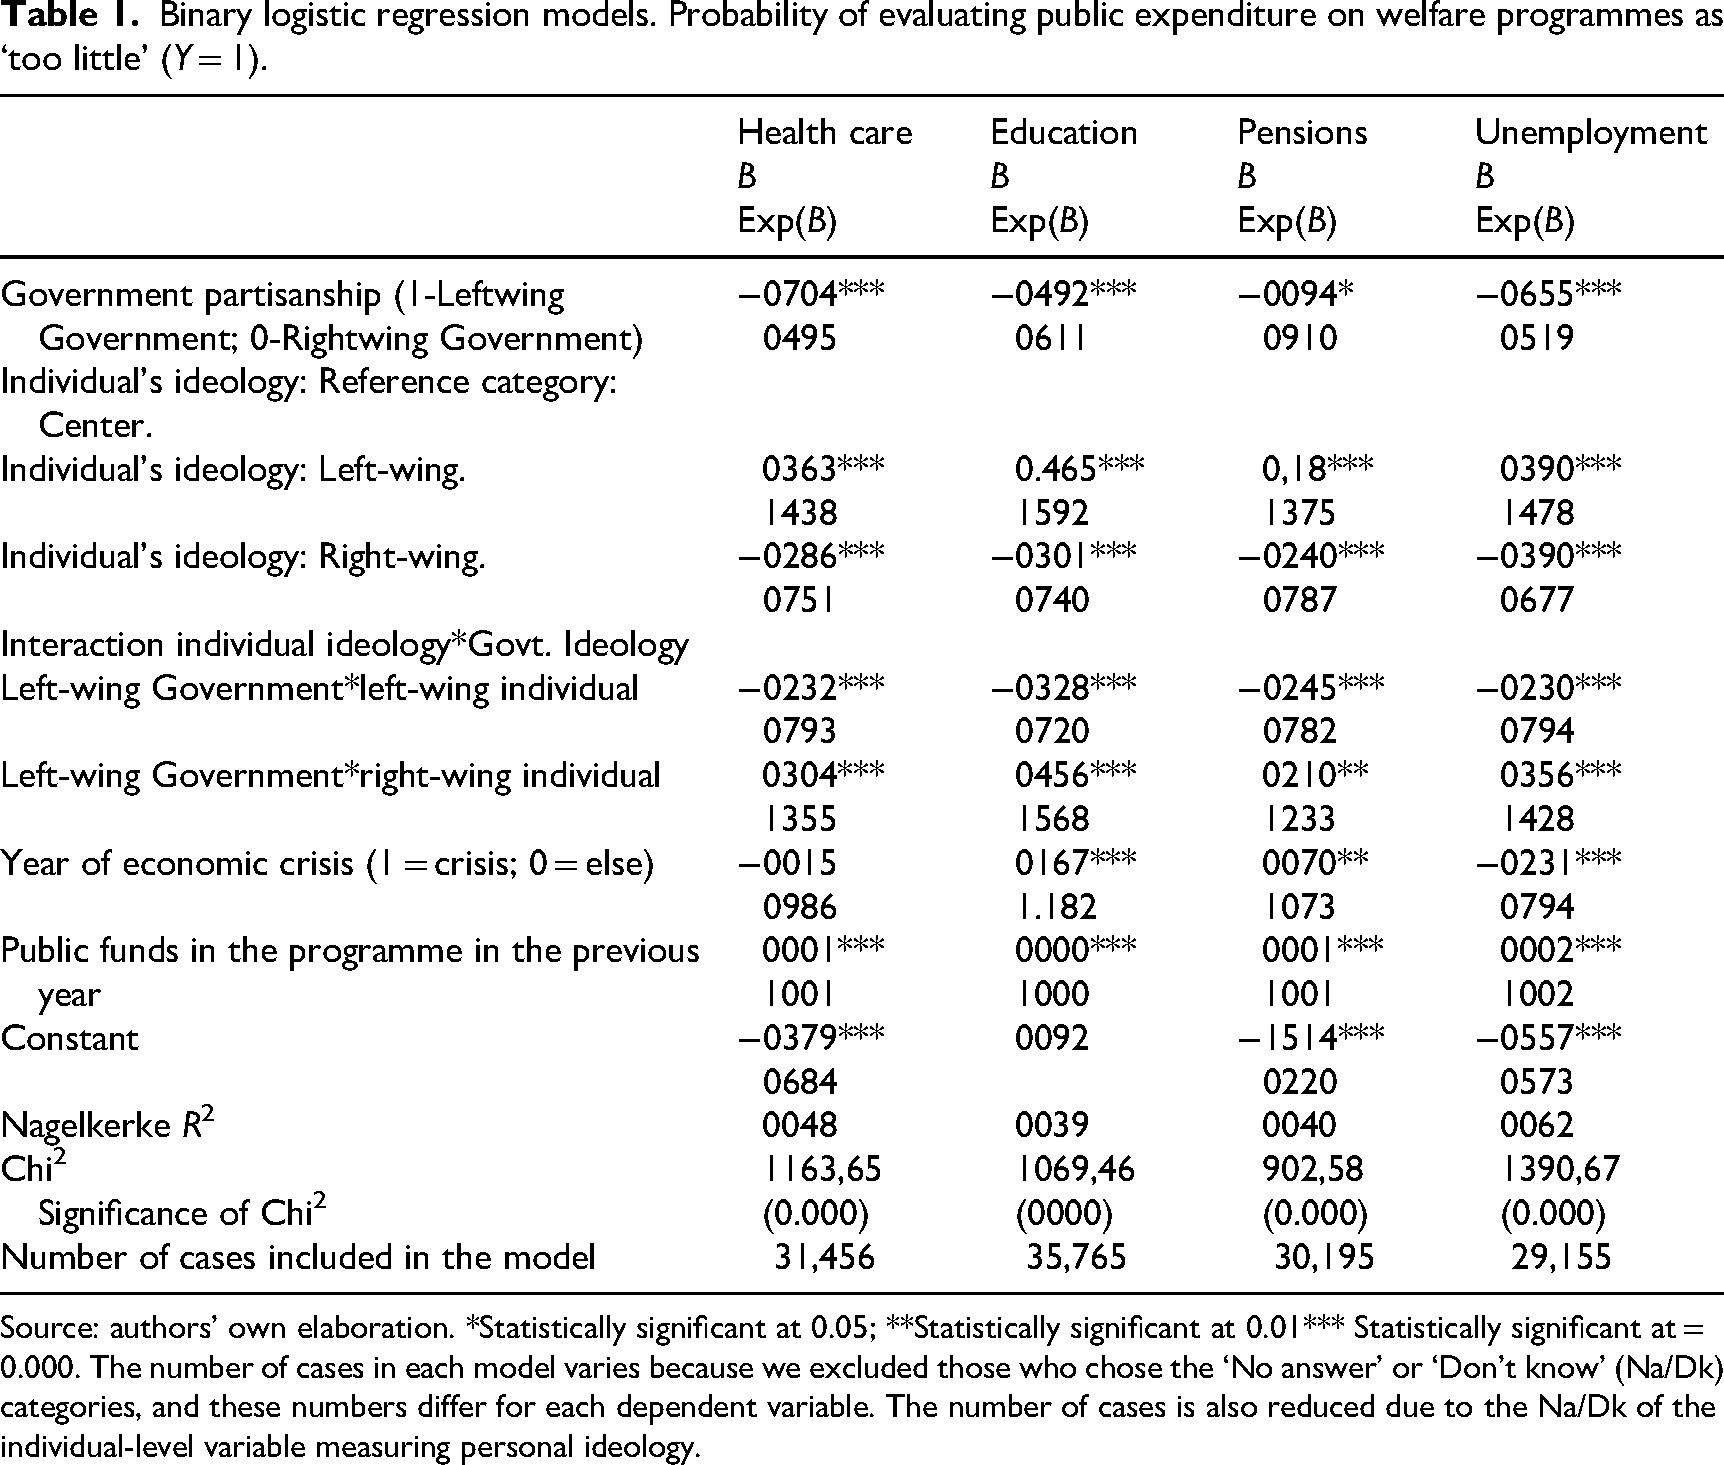
Source: authors’ own elaboration. *Statistically significant at 0.05; **Statistically significant at 0.01*** Statistically significant at = 0.000. The number of cases in each model varies because we excluded those who chose the ‘No answer’ or ‘Don't know’ (Na/Dk) categories, and these numbers differ for each dependent variable. The number of cases is also reduced due to the Na/Dk of the individual-level variable measuring personal ideology.
Table 1 presents the coefficients from the logistic regression models and their statistical significance. In each cell, the first coefficient (B) is the equation coefficient; and the second is the same coefficient expressed as Exp(B). Exp(B) is the ratio-change in the odds of considering welfare spending as ‘too little’ for a one-unit change in the predictor. This may be difficult for readers without statistical background to understand. For the sake of readability, we use these coefficients to check for the existence and direction of effects, but ultimately, we rely on predicted probabilities and graphs for interpretation.
As can be seen in Table 1, public expenditure levels have a statistically significant effect on attitudes towards public spending in the four welfare areas (education, healthcare, pensions, and unemployment protection). The effect is positive in all cases; higher expenditure is accompanied by a higher probability that the allocated funds for the welfare programmes will be deemed insufficient (see Table 1).
Being in a year of economic crisis appears to affect people's evaluations of public expenditure in the areas of education, pensions, and unemployment benefits, but not healthcare. An economic crisis pushes attitudes towards public spending in different directions depending on the policy area. A period of economic crisis increases the probability that people will consider insufficient funding for education and pensions but decreases the probability that they will consider insufficient funding for unemployment benefits. This finding coincides remarkably well with Spanish policies during recessions. The country suffers from chronically high unemployment levels, which increase dramatically during economic downturns, forcing the state to spend large sums on unemployment benefits (OECD, 2024). This increase in total unemployment protection expenditure is usually accompanied by cost-containment measures in other welfare areas (OECD, 1999). However, the effect of the economic crisis on attitudes towards welfare spending is understated in the regression models, being more evident in the graphs. As previously mentioned, the models treat all the surveys as a whole and only look for differences between ‘economic crisis’ years and other years. The graphs provide a clearer picture of the gradual effect that crises have on attitudes towards public spending, compensating for this too crude distinction.
Regardless of the funds allocated to each programme or the economic cycle, government partisanship is statistically significantly related to people's evaluation of welfare expenditure. This confirms our expectation that this variable is important as a shortcut or cue that helps people to make inferences about welfare programme budgets. As hypothesised in Hypothesis 1, when a left-wing government is in power, the proportion of people saying that insufficient funds are allocated to each welfare programme decreases. Left-wing ideology is associated with defending equality and the institutions that promote it, so people seem to assume that a left-wing government will better protect the welfare state than a right-wing one. Interestingly, Hypothesis 3 also receives support. The interaction coefficients for government partisanship and personal ideology are statistically significant for all four welfare programmes, and the effect is consistent: when a left-wing government is in power, the probability of saying that too little is spent on welfare programmes decreases significantly for left-wing individuals, moderately for centrists, and minimally for right-wing individuals.
However, the coefficients for logistic regression models cannot be interpreted in the same way as those for linear regression models. Note that logistic regression is not linear, and that probabilities are computed for different values of all the covariates. To evaluate the size of these contextual effects, we used the models to compute the probability of evaluating welfare funding as insufficient in various situations (e.g., left-wing individuals under a left-wing government in an economic crisis year, right-wing individuals under a left-wing government, etc.) (see Table 2). The probabilities are usually expressed as fractions over 1, but in the table below we have converted these to percentages for ease of interpretation.
Percentage of people saying that welfare programme funding is too little (based on predicted probabilities from the models in Table 1).
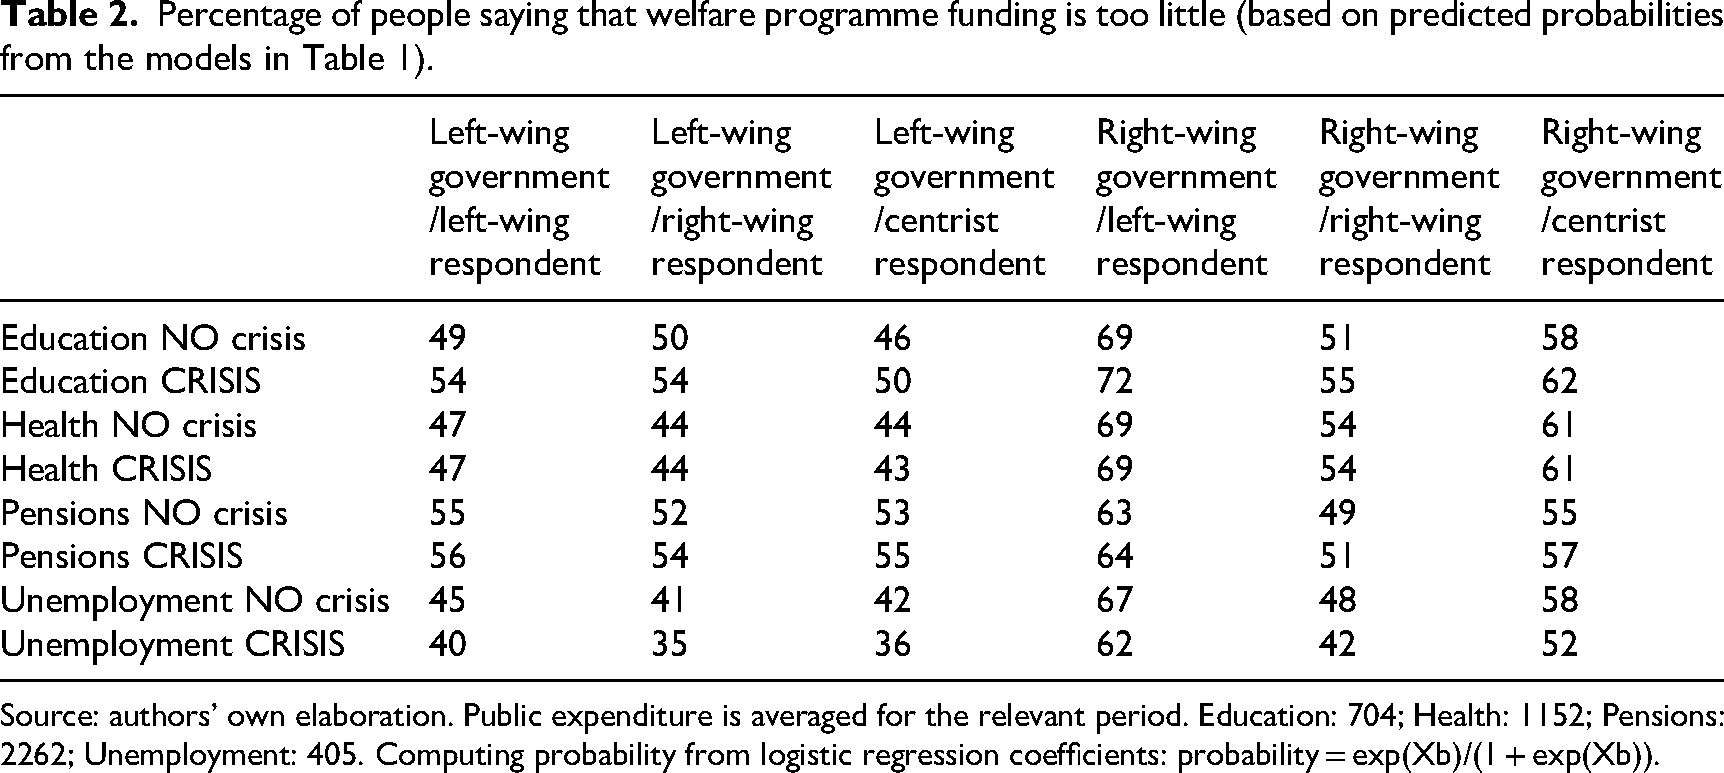
Source: authors’ own elaboration. Public expenditure is averaged for the relevant period. Education: 704; Health: 1152; Pensions: 2262; Unemployment: 405. Computing probability from logistic regression coefficients: probability = exp(Xb)/(1 + exp(Xb)).
Table 1 shows the general effect and statistical significance of our contextual variables on public opinion of welfare spending. Table 2 shows how different groups of people react to changes in the contextual variables under study.
The two shaded columns in Table 2 compare the percentage of left-wing individuals who say that public budgets allocated to welfare are ‘too low’ when a left-wing government is in power (first column) with the percentage who say the same when a right-wing government is in power (fourth column). This is one of the instances in which the impact of government partisanship is more evident. For example, the first row shows the probability of thinking that the government is spending too little on education during a non-crisis year.
If a person says they support a left-wing ideology and there is a left-wing party in government, there is a 49% chance that they will think the amount of money spent on education is ‘too little’. By contrast, under a right-wing government, this same person is 69% likely to think that education expenditure is too low. Note that these probabilities are independent of the actual level of public spending on each policy.
Another way of looking at the results is to plot the increase or decrease in the odds of public expenditure being evaluated as too little in different situations (see Figures 3 and 4 latter). In this context, the odds are defined as the probability of stating that the funds allocated to a specific purpose are too little (p) against the probability that they will be deemed fair or too much (1−p). Odds are equal to p/1−p. We transform odds into logarithms to express this difference as a fraction of 1. Odds are useful because they allow us to compare the impact of the colour of government on the attitudes of people with different ideologies. We plot individuals’ ideology on the x axis and the odds of evaluating expenditure as too little on the y axis.
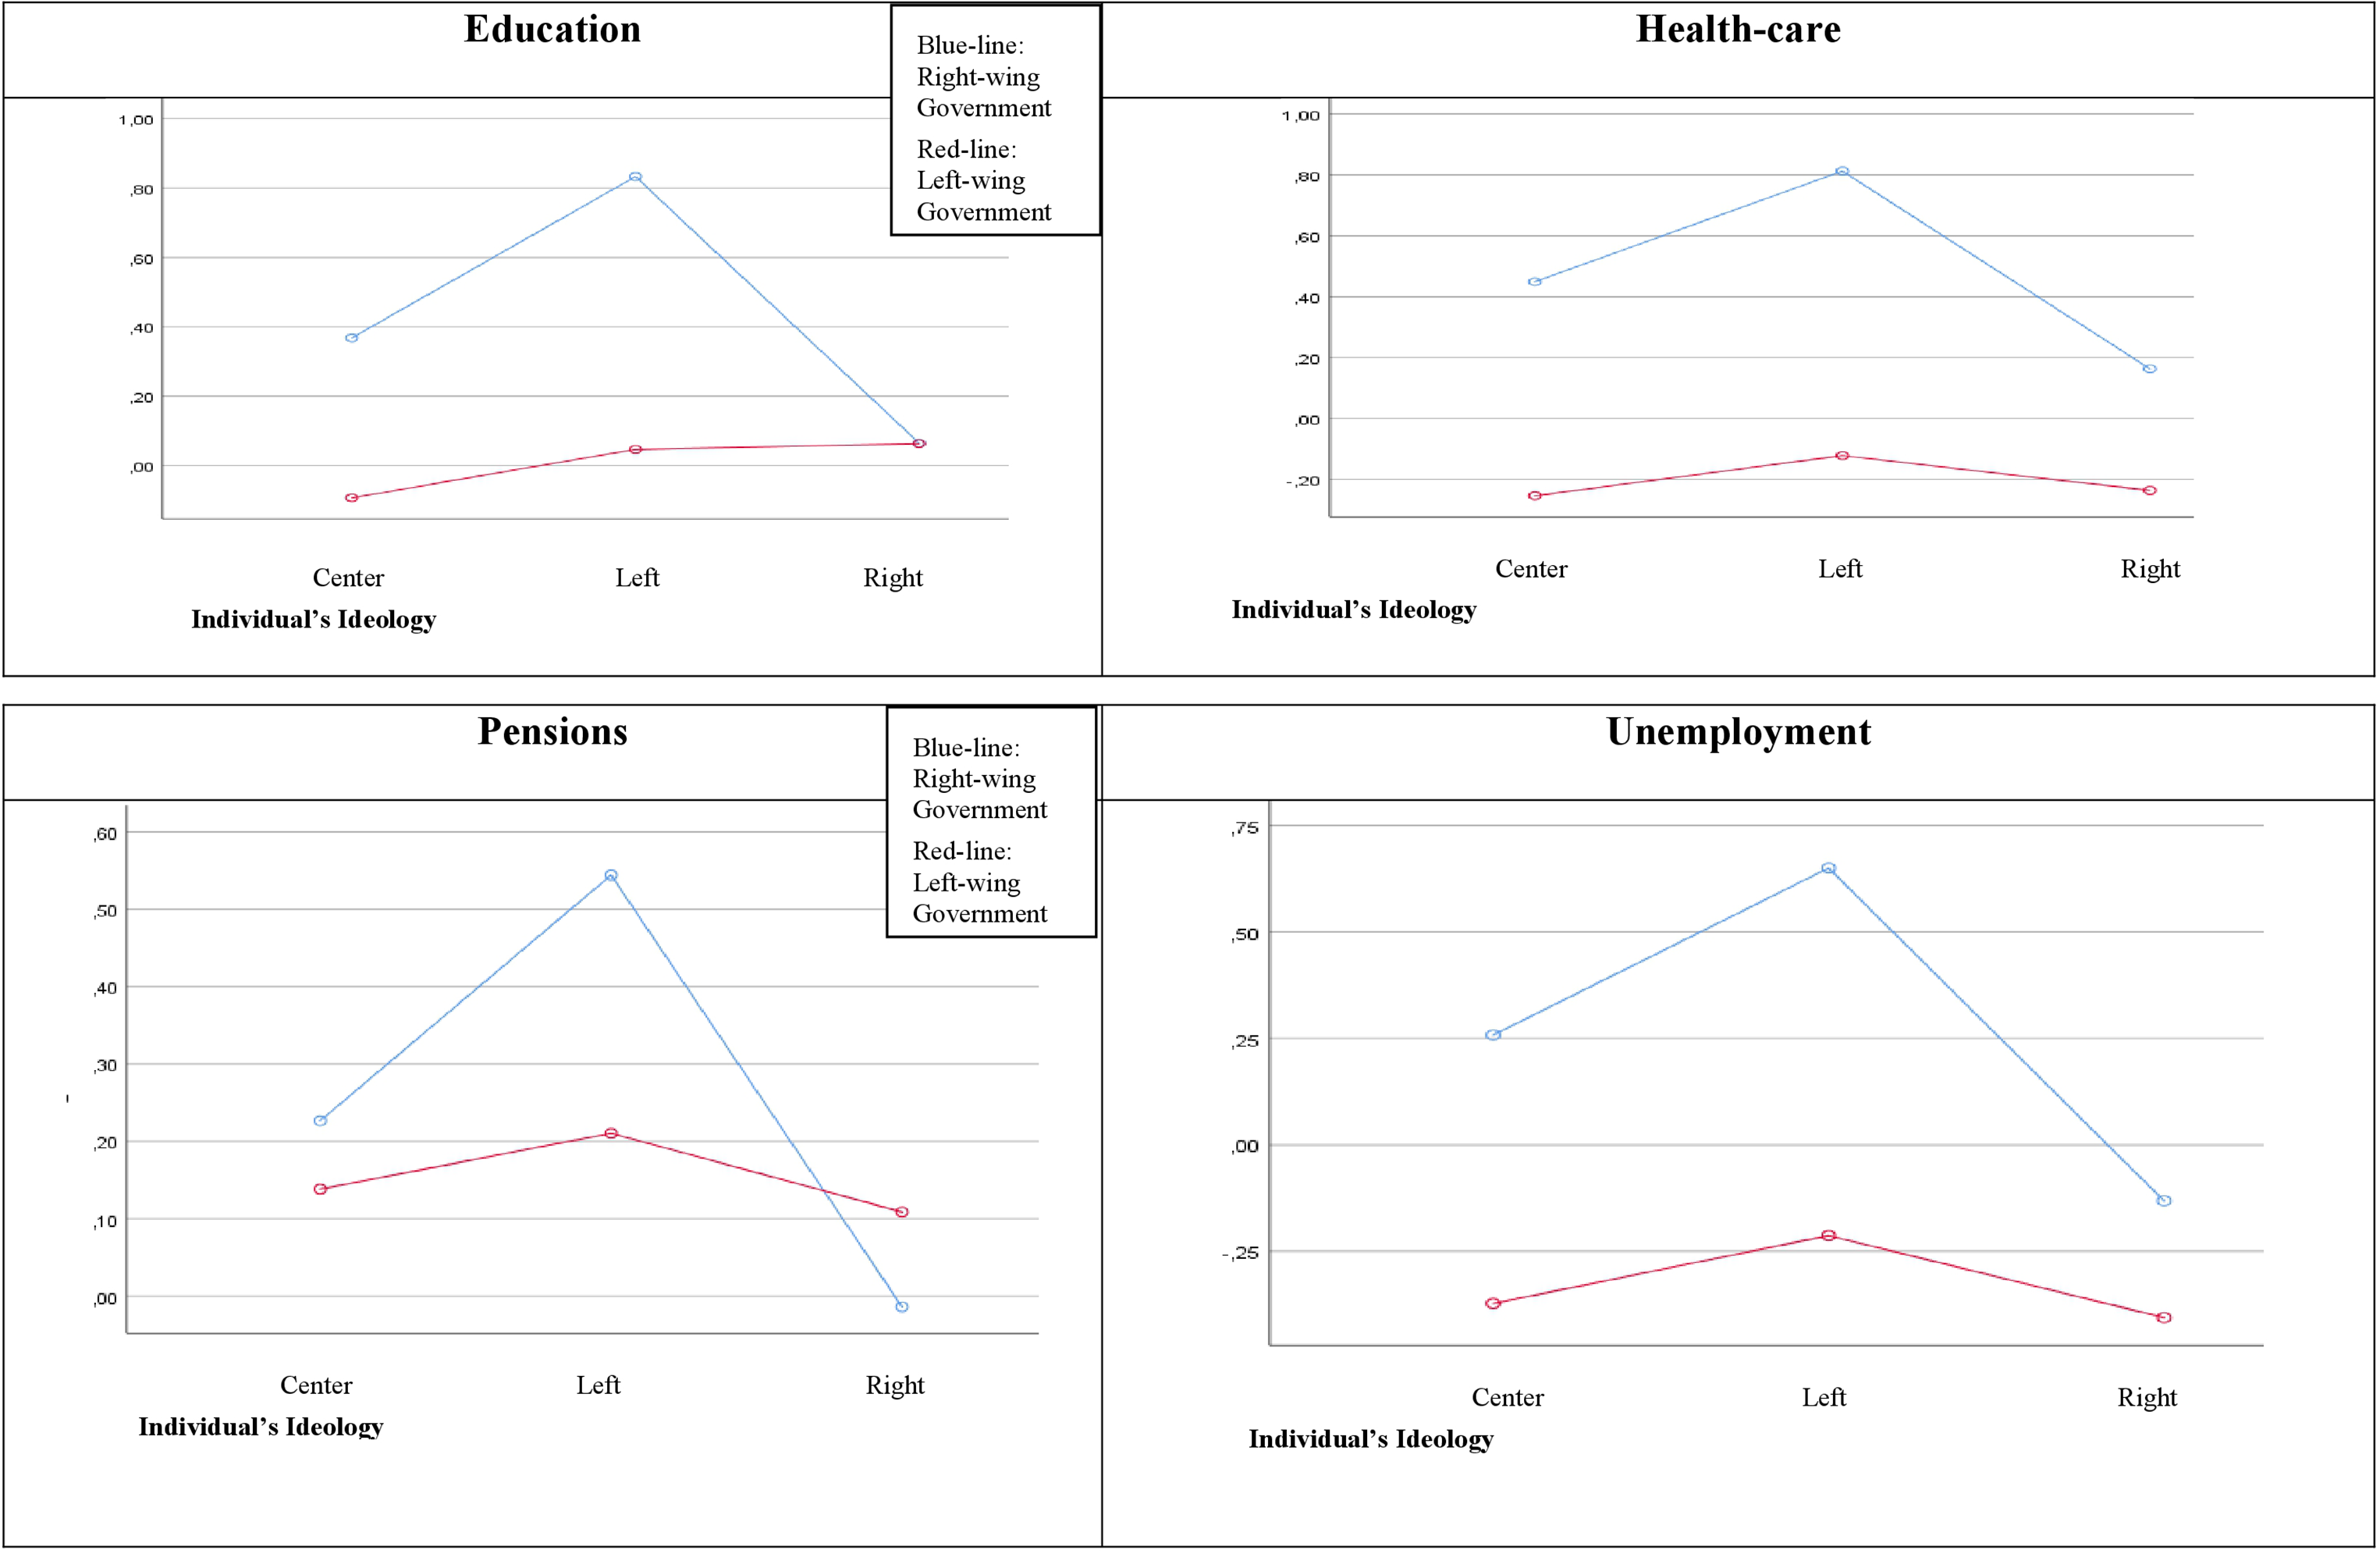
Change in the odds of considering welfare spending as ‘too little’ among people with left-, centre- and right-wing ideologies under left-wing and right-wing governments. Source: authors’ own elaboration. Red line: left-wing government; blue line: right-wing government; x axis: individuals’ ideology; y axis: ln (p/1-p) of ‘too little spending’.
Change in the odds of considering public spending as ‘too little’ among people with left-, centre- and right-wing ideologies under left-wing and right-wing governments. Source: authors’ own elaboration. Red line: left-wing government; blue line: right-wing government; x axis: individuals’ ideology; y axis: ln (p/1-p) of ‘too little spending’.
The blue line indicates a right-wing government, while the red line indicates a left-wing government. The odds are computed for non-crisis years and for the average public expenditure (average public expenditure for the entire studied period). Using attitudes towards spending on unemployment benefits as an example, the graphs can be interpreted as follows: When a left-wing government is in power, the odds of a person with left-wing ideology saying that there is ‘too little expenditure’ on unemployment benefits decreases by 17% (−0.17). When a right-wing government is in power, the odds increase by 63% (0.63).
Figure 3 shows that right-wing individuals are much less likely to change their views about public spending than left-wing individuals. Both left- and right-wing individuals are more satisfied with welfare expenditure under left-wing governments, but left-wing individuals exhibit more pronounced shifts in attitude. In all four graphs, the peak of change (the peak of the lines) corresponds to left-wing individuals under right-wing governments. Note that the effects shown have been calculated after controlling for actual expenditure and the economic cycle. This means that the graphs illustrate the effect of government colour on people's views of public welfare expenditure in an average (non-crisis) year with average public expenditure.
Table 3 presents logistic regression models that are identical to those in Table 1, except that they now include as dependent variables the probabilities of stating that expenditure in the defence and public works domains is insufficient. Notably, attitudes towards the funds allocated to public works align with thermostat theory: the higher the expenditure, the lower the probability of them being considered insufficient. Economic crises slightly decrease the likelihood that any of these policies will be considered underfunded.
Binary logistic regression models. Probability of evaluating public expenditure on non-welfare programmes as too little (Y = 1)
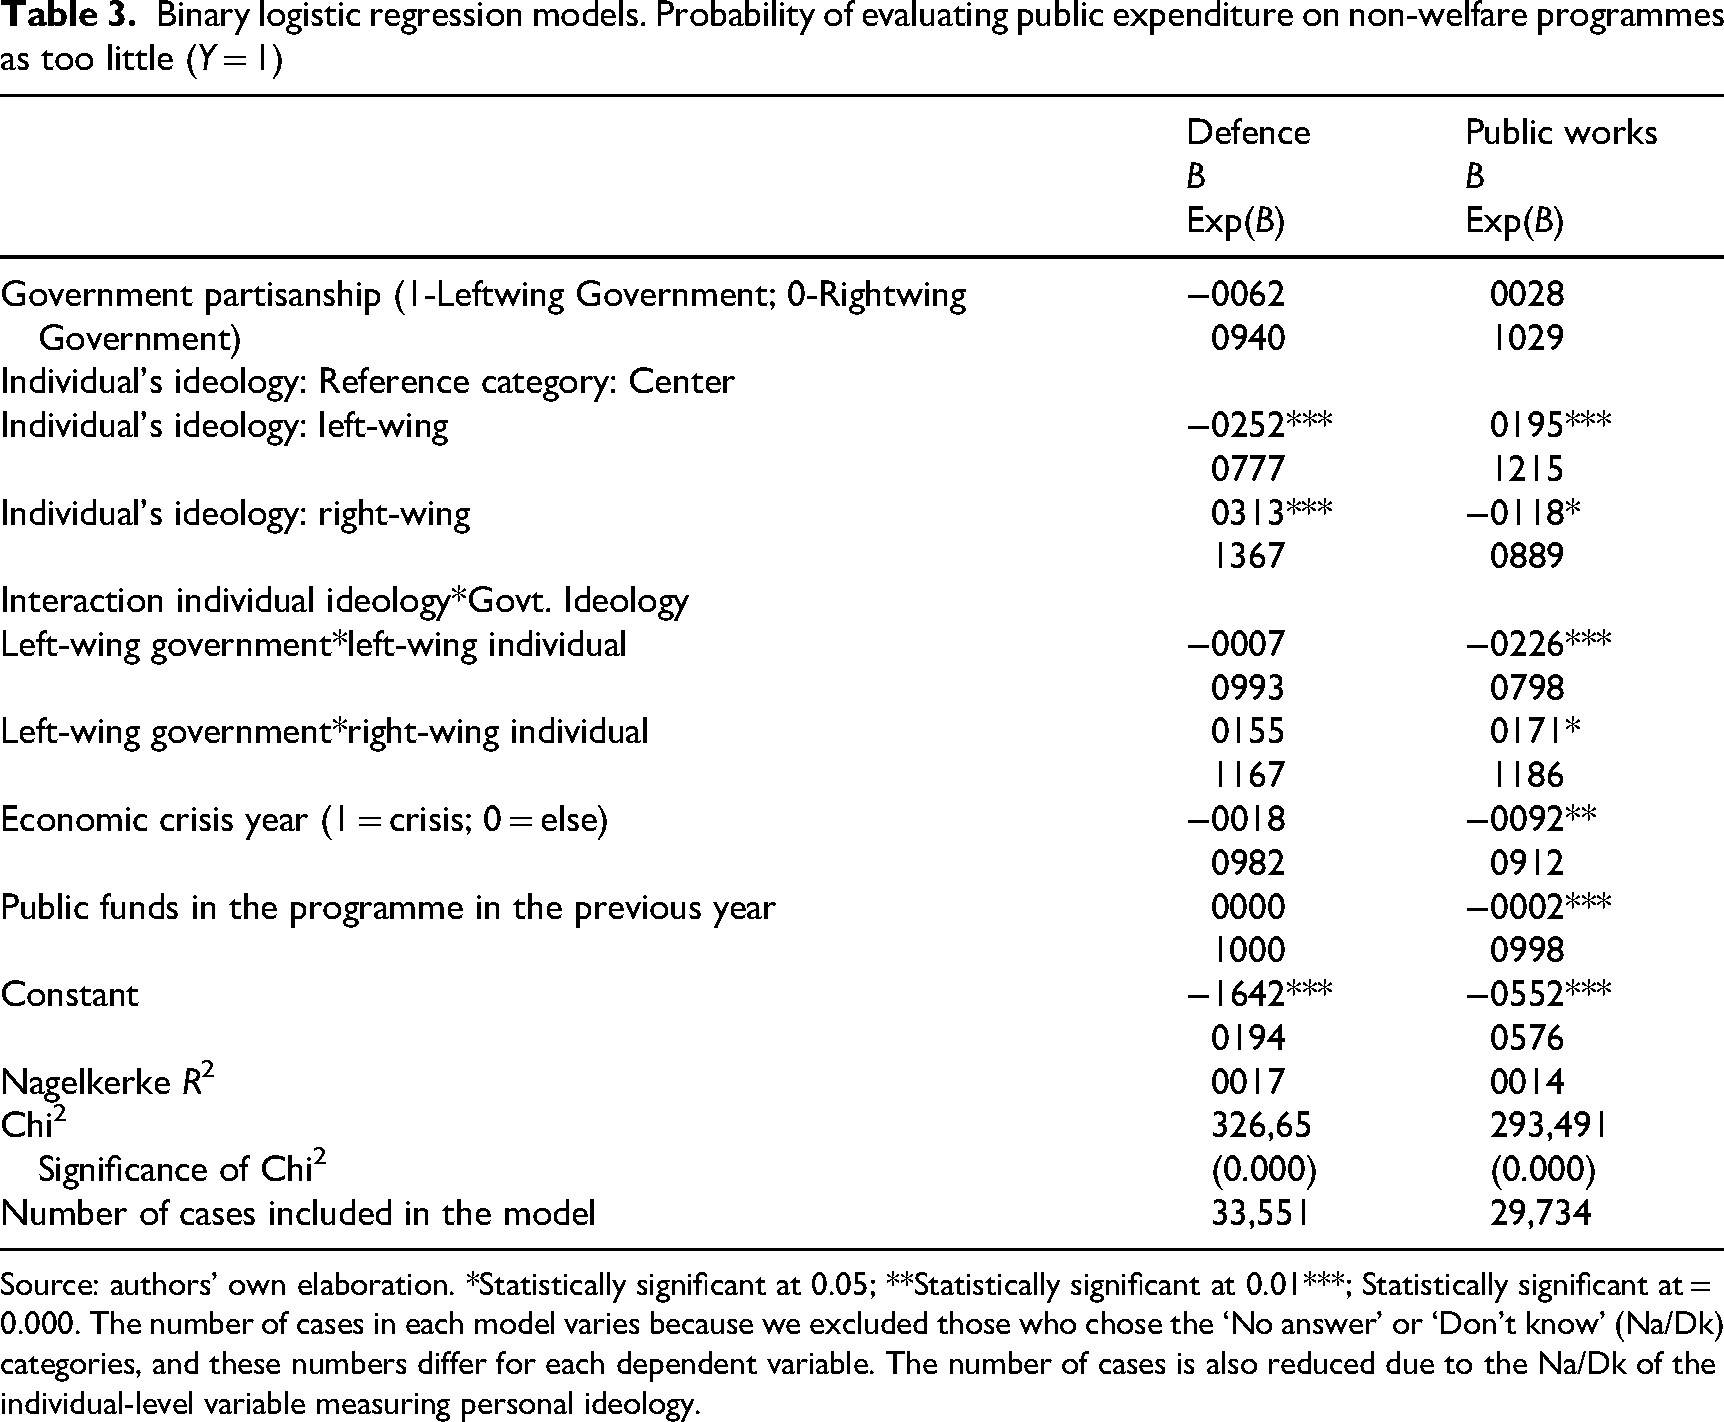
Source: authors’ own elaboration. *Statistically significant at 0.05; **Statistically significant at 0.01***; Statistically significant at = 0.000. The number of cases in each model varies because we excluded those who chose the ‘No answer’ or ‘Don't know’ (Na/Dk) categories, and these numbers differ for each dependent variable. The number of cases is also reduced due to the Na/Dk of the individual-level variable measuring personal ideology.
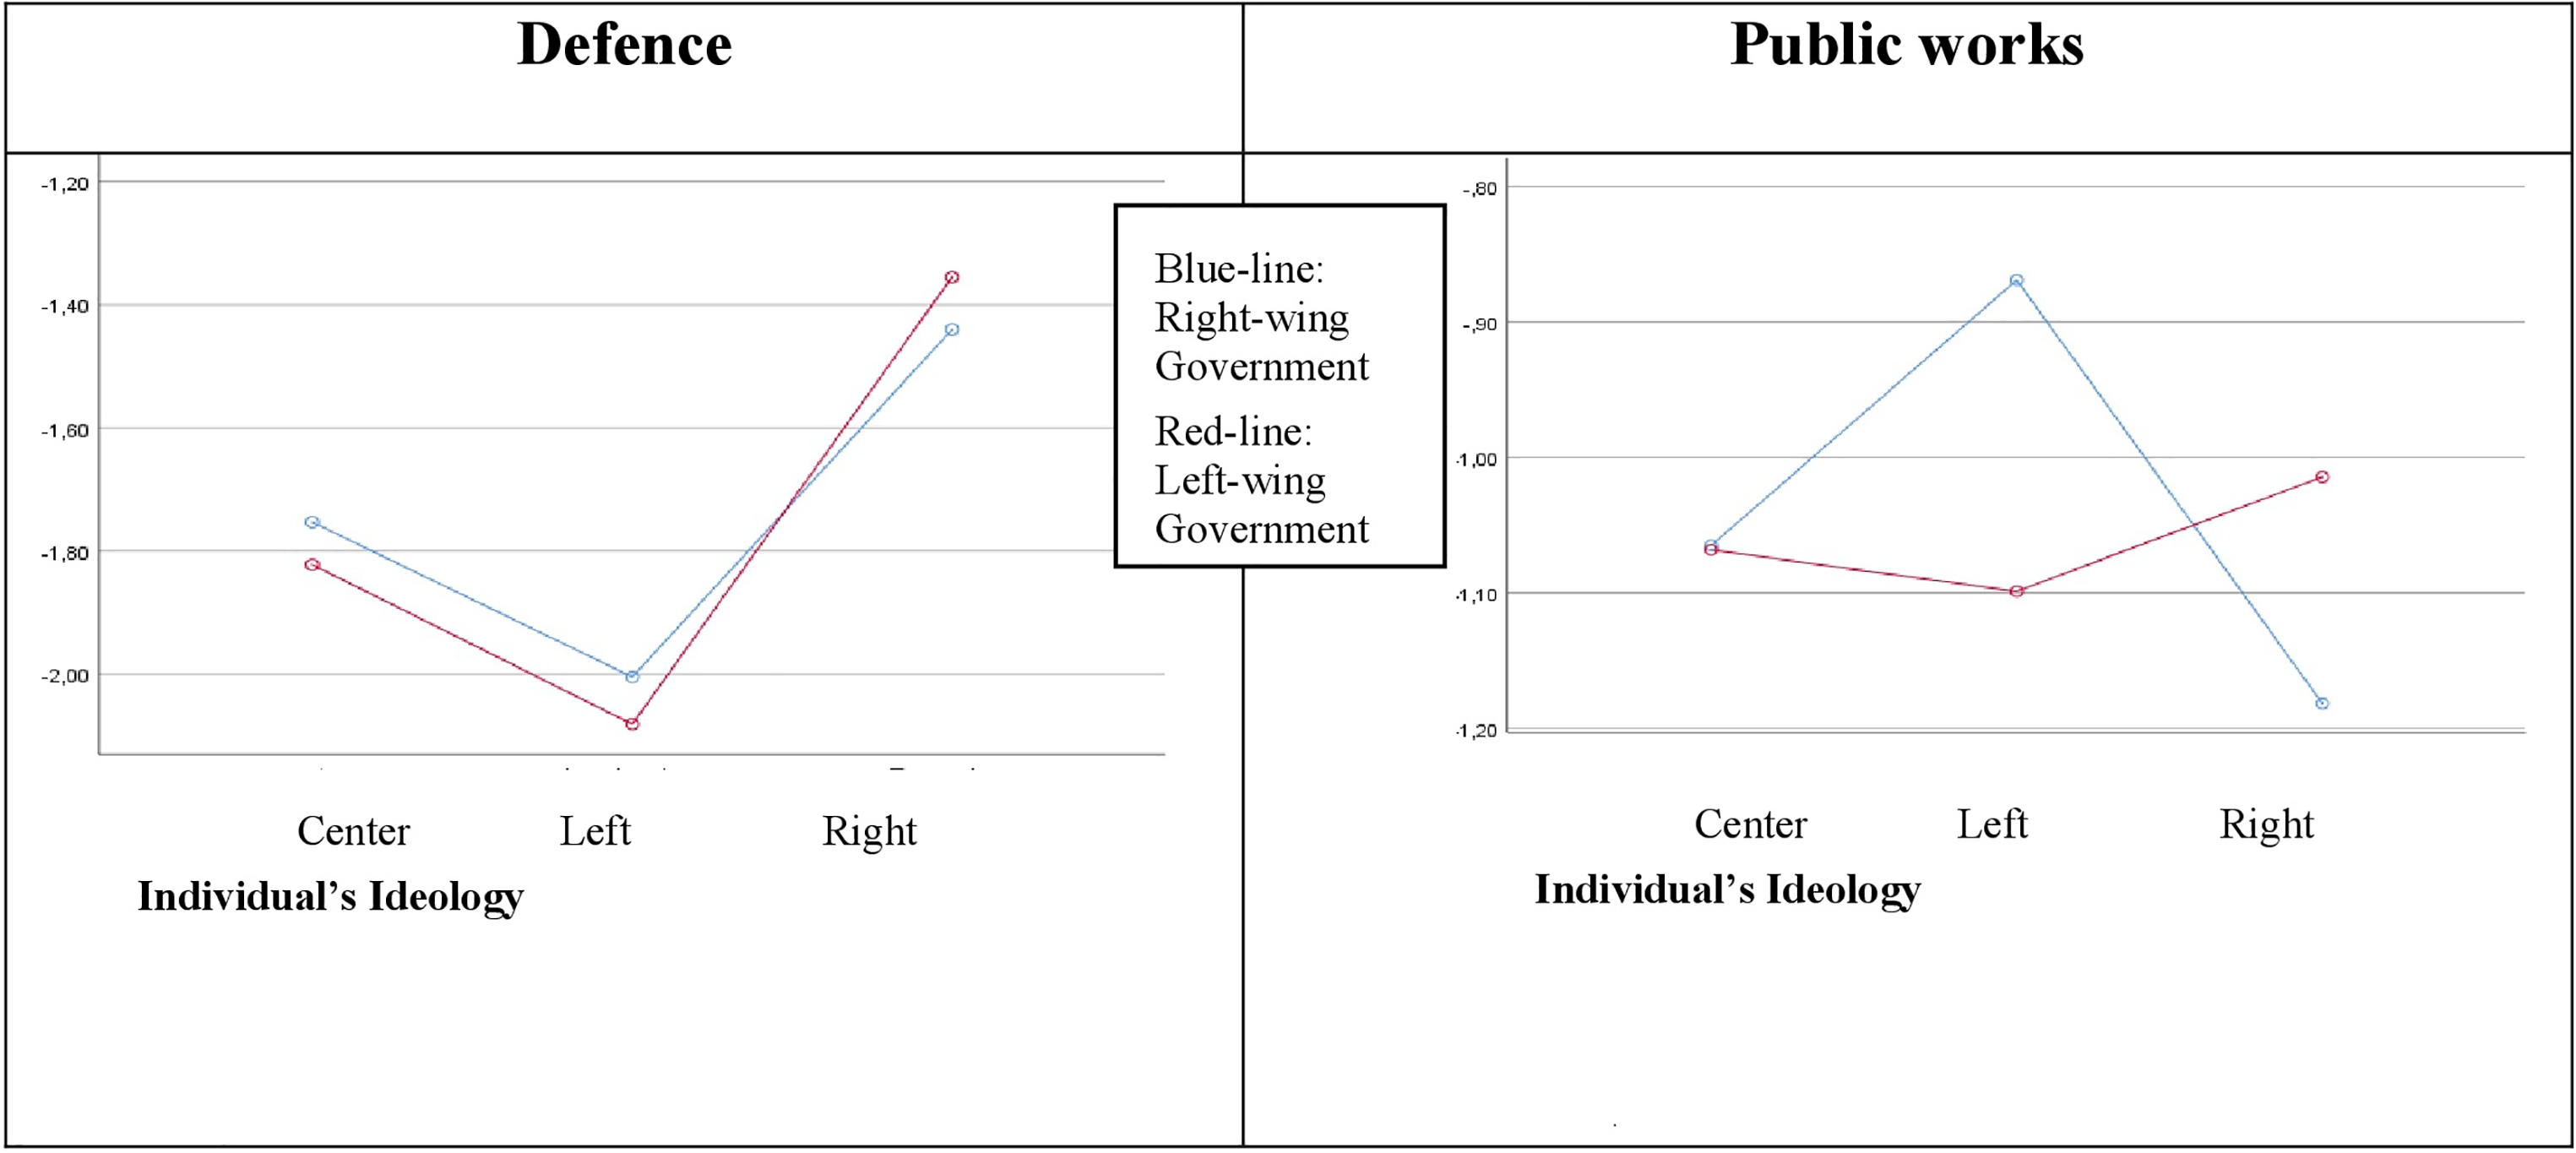
Government partisanship is used by citizens as a shortcut to infer the adequacy of welfare budgets, but as expected in Hypothesis 2, they don’t use it alike when they need to guess the adequacy of public expenditure in non-welfare areas. Government partisanship makes no difference for respondents when they need to evaluate defence expenditure (i.e., it has no statistically significant effect) and it has only a small effect for the evaluation of the funds allocated to public works. A left-wing government decreases the probability that public works funding will be considered too low by both left-wing and right-wing individuals, but as we can see in Table 4 (predicted probabilities) the difference is quite small: left-wing individuals under a left-wing government have a probability of 26% of reporting that public works expenditure is ‘too little’, and this probability increases to 30% when a right-wing party is in government. Right-wing individuals under a left-wing government have a probability of 27% of reporting that public works funding is ‘too little’ and this falls to 24% when a right-wing party is in government. These effects are much smaller than those found for spending on welfare programs. The link between Left-wing political parties and social policies appears to be a clear short-cut to evaluate public spending to social policies. By contrast, the link between Left-wing parties and other policies such as defence or public works is either non-existent (defence) or very small (public works). These same results, interpreted as described above, can be seen in Figure 4.
Percentage of people saying that the funding of non-welfare programmes is too little.
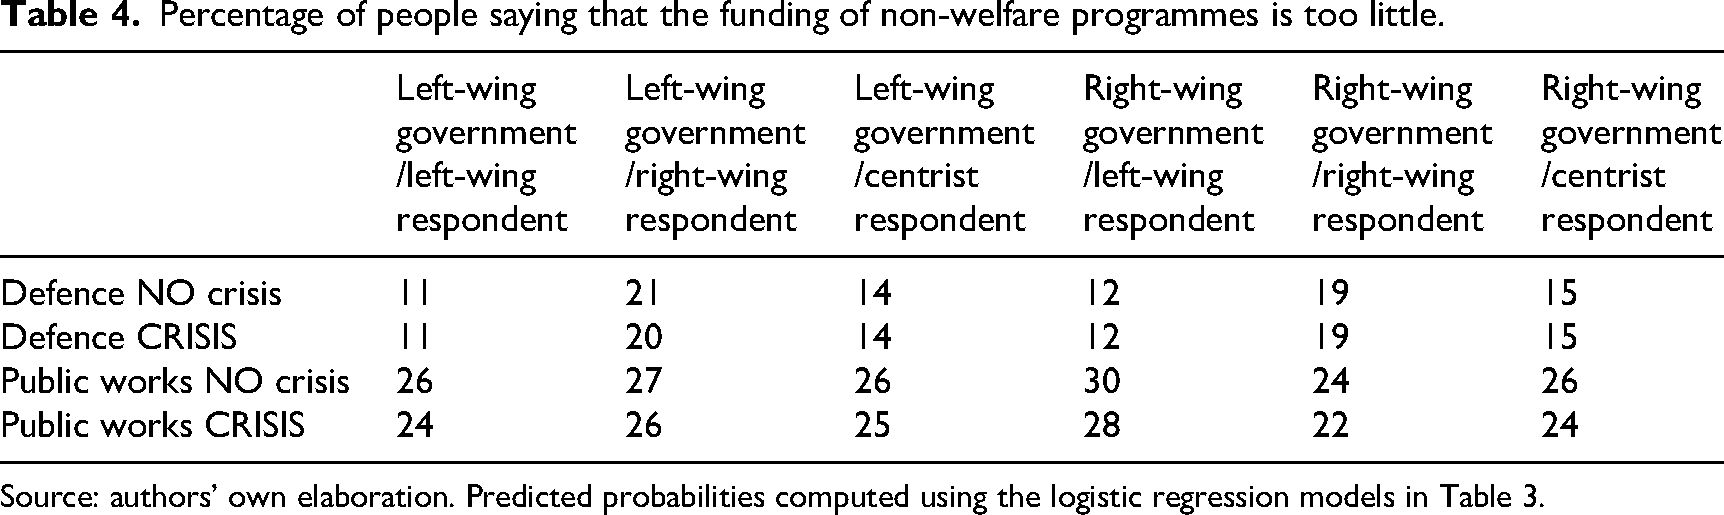
Source: authors’ own elaboration. Predicted probabilities computed using the logistic regression models in Table 3.
Discussion and conclusions
In this article, we assessed whether welfare policies continue to be a policy issue predominantly owned by left-wing parties. Our analysis focused on whether individuals use government partisanship (right/left) as a heuristic to infer the distribution of public funds across different policy areas.
Firstly, we found that the policy sector is critical to understand public attitudes towards public expenditure and how these attitudes evolve over time. Public opinion differs depending on the policy area (see Graph 1), as does the impact of contextual factors on people's opinions (see Tables 1 and 3). We found that, when forming opinions, people use shortcuts and heuristics that are specific to each policy or range of policies. This explains why different policies have different ‘thermostatic sensitivity.’ These findings suggest that attitudes towards spending must be analysed on a policy-by-policy basis, rather than using average indicators of ‘attitudes to public expenditure,’ as much of the previous literature does.
Our analyses also indicate that, regardless of the actual amount of money allocated to each programme and independently of the economic cycle, government partisanship is a powerful heuristic that individuals use to estimate welfare programmes spending. In general, left-wing governments are perceived as being more inclined than right-wing governments to prioritise welfare programmes.
Regardless of the actual level of welfare expenditure, left-wing people are substantially less likely to report that welfare expenditure is too low under a left-wing government than under a right-wing government; this effect is moderate for people who self-report as centrist on the ideology scale, and slightly lower for people who self-report as right-wing (see Tables 2 and 4). However, government partisanship is not a useful shortcut for understanding changes in attitudes to public expenditure in other areas. It has no impact on evaluations of defence expenditure and it is only weakly related to evaluations of public works spending.
Interestingly, we found no evidence of a thermostatic effect for any of the social policies investigated (i.e., public opinion towards spending on social policies does not react thermostatically to changes in budgets allocated to these policies). Conversely, a thermostatic relationship does appear for public works policies.
The absence of a thermostatic relationship in social policies may reflect one or both of the following: Firstly, it could be a consequence of the high level of public support for social policies. Alternatively, public perception may be biased by the use of government partisanship as a shortcut to infer the actual level of public spending.
Popular beliefs about the actions of ‘left parties’ and ‘right parties’ clearly influence individuals’ evaluations of public spending, even when political parties’ actual performance in office does not correspond to people's assumptions.
Since the 1990s, left-wing parties have implemented policies traditionally associated with the right, such as cutting spending and balancing budgets, even though this does not necessarily improve their electoral prospects. These political developments create the potential for other parties to be perceived as better at handling welfare issues. Notably, the far right has expressed an interest in taking ownership of certain aspects of social policy (Horn, 2021; Kraft, 2017; Polacko, 2022).
European far-right parties are increasingly attempting to ‘own’ the issue of migration, and they promote debates on whether the migrant population ‘deserves’ access to public services (Van Oorschot, 2000). This strategy enables them to compete with left-wing parties for ownership of welfare issues. Future studies will need to evaluate the extent to which far-right parties in various countries are succeeding in sharing ownership of welfare policies with left-wing parties.
If ownership of welfare issues is shifting, studying this change could shed light on debates about the origins of ownership. For example, does issue ownership reflect the interests of political elites, or does it align more closely with the preferences of their constituencies? (Fagan, 2021; Petrocik et al., 2003).
Furthermore, this topic provides a valuable case study for evaluating the impact of mass media on political issue ownership. Several scholars have conducted rigorous empirical analyses that suggest a lack of media influence on issue ownership (Fagan, 2021; Petrocik et al., 2003). The original proponents of issue ownership theory observed that ‘it is striking that the issue content of the campaigns is uncorrelated with the issue content of The Times's coverage of the campaigns. If, as the theory of issue ownership proposes, candidates help to shape or prime voters’ issue concerns, they do not seem to do so through the news media’ (Petrocik et al., 2003: 622).
However, the rise of far-right parties has been partly attributed to new ways of receiving political information through online platforms and social media. Therefore, it is worth investigating whether the findings of Petrocik et al. (2003) still apply in the current political communication landscape.
Footnotes
Funding
The authors disclosed receipt of the following financial support for the research, authorship, and/or publication of this article: This research has been funded by the Institute for Fiscal Studies. Ministry of Finance (Spain) through the research project ‘Measuring citizens’ attitudes towards taxes (MACF)’.
Declaration of conflicting interest
The authors of this paper certify that they have NO conflicts of interest to disclose.