
Abstract
Redistribution is one of the key elements of contemporary social order, and research has dealt with it in various ways. Most welfare state research mixes in its analysis the regulations on redistribution and actual outcomes. However, to adequately understand redistribution, one needs to distinguish between regulations and outcomes. Measuring unequal conversion in terms of deviations between redistributions as regulated and redistributive outcomes shows how far a redistribution corresponds to what has been officially agreed upon in societies and who is actually better or worse off in the end. Empirically focusing on family-related redistribution, our analysis was based on European Union Statistics on Income and Living Conditions data and the European microsimulation tool EUROMOD. First, we assumed that differences between regulations and outcomes vary depending on the family type. Thus, we compared the actual and simulated disposable household income for various family types. Second, we assumed that differences between regulations and outcomes vary by country. Consequently, we analysed a variety of European countries. Our findings showed that there are substantial differences between regulations on redistribution and outcomes. These differences increase income inequalities between families. This held true for all of our study countries, although to a different degree.
Introduction
Comprehending differences and developments in redistribution is a major undertaking in various disciplines of welfare state research. The validity of the findings and the corresponding understanding of social inequalities depend on the robustness of the data used to study redistribution. However, what do the data we use to analyse redistribution actually show? This question is not as trivial as it may sound, as it is prominently discussed in the literature in relation to the ‘dependent variable problem’ (see Clasen and Siegel, 2007; Otto, 2018). In general, the literature distinguishes between what is often called outputs (referring to regulations or formal welfare institutions) and outcomes, such as those resulting in effective inequality (Green-Pedersen, 2007).
This distinction is a premise in the study of redistribution, since its output, as laid down in redistributive regulations, is not necessarily the same as its outcome. On the contrary, various reasons allow us to anticipate an unequal conversion of redistributions as regulated into redistributive outcomes. Differences in the corresponding data result from the non-take-up of benefits (Hernanz et al., 2004), the (non-)use of tax regulations and so-called beta errors, which lead to higher benefits than expected (Goedemé and Janssens, 2020). Knowing the extent of these differences allows us to determine the extent to which redistribution functions as regulated and the extent to which the factual redistribution differs from what has been officially agreed upon in societies. This again contributes to understanding the unintended mechanisms of redistribution that may increase or decrease social inequalities between the addressees of redistribution. However, studies on redistribution in general and in relation to families in particular (i.e. the empirical focus of this paper) often do not take this difference into account. Indeed, they often mix redistributive regulations and outcomes in their analytical designs. Against this background, our paper deals with the question of how far redistributive outcomes correspond to redistributive regulations, as illustrated by redistribution in terms of family.
To answer this question, we use an innovative analytical approach. We investigate the deviation between the simulated disposable household income of a certain gross income as a proxy for redistributive regulations and the actual disposable household income of the same gross income as the corresponding redistributive outcome. For this, we use data from the European Union Statistics on Income and Living Conditions (EU-SILC) and simulate disposable household income with the tax-benefit microsimulation model for the European Union (EUROMOD). To account for the complexity of family, we compare the findings to determine the divergence between the actual and simulated disposable household incomes for 20 family types, including single parents and couples with varying numbers of children and income levels. We conduct this analysis for seven European welfare states (Austria, the Netherlands, Spain, Sweden, Finland, Slovenia and Latvia) owing to their particularly suitable data for the evaluation of actual disposable household income. With this, we contribute to the methodological debate in the study of redistribution, the comprehension of redistribution in a European comparison and the identification of overlooked inequalities.
The paper is structured as follows: The next section discusses the literature on redistribution and the differences between regulations and outcomes. The third section introduces the analytical approach, as well as the data and method. The fourth section presents the empirical findings of our analysis. These are discussed in the fifth section and the conclusions of the paper are presented in the sixth section.
State of the art
One of the major characteristics of current social order is redistribution (OECD, 2021). Consequently, it is also at the heart of two of the most fundamental debates in the most relevant research. The first relates to the ‘paradox of redistribution’ (Korpi and Palme, 1998) in analysing the relationship between societal redistribution and the design of welfare state institutions focusing on redistribution to citizens with different income levels, as well as the effects of redistribution on poverty. Korpi and Palme (1998) concluded that countries with a focus on targeted benefits are characterised by higher levels of inequality and poverty than those with strong social insurance systems. Both of these findings have been critically discussed (Gugushvili and Laenen, 2021) and confirmed by recent investigations (Jacques and Noël, 2018). The second fundamental debate surrounding redistribution relates to the even more prominent research on ‘welfare regimes’. By applying the concept of decommodification, Esping-Andersen (1990) inspired a strand of literature (see Emmenegger et al., 2015) that aims to capture typical country – group logics of redistribution in developed societies. These decommodification studies have adopted a similar perspective on redistribution as Korpi and Palme (1998) by focusing on the redistribution between working and non-working citizens, such as pensioners or the unemployed.
Despite the high relevance of these studies, they share a blind spot with regard to redistribution; they fail to consider redistribution in terms of family. This is surprising, given the fact that the relevance of family in understanding redistribution is stated (but not systematically analysed) in all major welfare state research (e.g. see Frericks, 2023; Esping-Andersen, 1990; Marshall, 1950) and, indeed, all European societies have institutionalised family-related benefits and financial obligations (Frericks et al., 2016). Redistribution with regard to the family has mainly been studied by means of the concept of defamilialisation. According to Lister (1994: 37), this concept describes ‘the degree to which individual adults can uphold a socially acceptable standard of living, independently of family relationships’. Therefore, it focuses on the financial independence of women and on the gender-related effects of family and care policies (Leitner, 2003; Zagel and Lohmann, 2021). However, the concept of defamilialisation is problematic in analysing family-related redistribution. First, a one-dimensional perspective is applied to the family because the concept does not differentiate between family types (Saxonberg, 2013). Second, defamilialisation studies, while investigating the societal effects of welfare policies, confuse regulations and outcomes in their analytical setup (e.g. Leitner, 2003; Lohmann and Zagel, 2016). Furthermore, outcomes are affected by non-regulated factors, such as preferences, which are often not sufficiently accounted for.
This methodological issue prevails equally in research on the paradox of redistribution (see Jacques and Noël, 2018; Korpi and Palme, 1998). A clear differentiation between regulations and outcomes though is important in understanding redistribution. Only when they are clearly distinguished can we identify the redistribution upon which societies officially agree and, in addition, the differences between this legislated redistribution and actual outcomes. The identified differences shed light on whether, and to what degree, redistribution corresponds to the intended outcomes. This is relevant for conceptual and societal reasons. First, research on redistribution often focuses on redistribution in terms of income differences before and after taxes and transfers (see Esping-Andersen and Myles, 2009). Distinguishing between regulations and outcomes will contribute to a more correct country grouping in terms of redistribution, since widely acknowledged regime types might depend less than generally assumed on policy design and more on overall societal differences (Frericks, 2021). Second, a gap between redistributive regulations and outcomes is societally relevant when it increases social inequality by being restricted to particular social groups. In addition, when redistribution as decided upon strongly differs from its results, the legitimacy of single regulations or entire societal orders is also in danger (Eurofound, 2015). For these reasons, this paper addresses the question of how far redistributive outcomes correspond to redistributive regulations.
Thus, we aim to fill both the methodological gap identified above and the content-related research gap with regard to redistribution in terms of family. A variety of family types will be studied, since regulations on redistribution differ considerably between family types (Frericks et al., 2016, 2023). Consequently, the deviation between redistribution as regulated and as identified in outcomes is assumed to vary across family types.
There are various reasons for expecting to find differences between regulations and outcomes in terms of redistribution. With regard to welfare benefits as an important component of redistribution, actual benefit receipt might be lower than expected because individuals or families eligible for a welfare benefit do not receive it. This phenomenon has been broadly discussed as non-take-up in the literature. Broadly speaking, the causes of non-take-up are on the level of the client, administration and benefit scheme (van Oorschot, 1998; Vinck et al., 2018). Furthermore, pecuniary determinants, information costs and delays in the administrative process influence non-take-up (Hernanz et al., 2004). Considering the differences in family types, we can expect that families with a lower income, a lower educational level and a migration background show the highest degree of non-take-up. This is because they often have less knowledge about eligibility and more difficulties applying for benefits successfully (Janssens and van Mechelen, 2022). Moreover, families with a higher number of children have a higher potential for non-take-up, since they need to apply more often for (potentially different) child-related benefits.
The opposite phenomenon, when individuals or families receive higher resources than regulations stipulate, has been labelled beta errors. These errors may occur as a result of mistakes in the administrative procedure or fraud, but measurement errors may also cause a beta error (Goedemé and Janssens, 2020). Thus far, we do not know whether beta errors correlate with individuals’ or families’ socioeconomic characteristics.
Moreover, taxes and social insurance contributions (SICs) play an important role in redistribution. First, it is possible that families pay higher taxes and SICs than expected, which might be due to the non-use of deductions. Similar to non-take-up of benefits, information costs and knowledge about the application process are relevant factors; therefore, we assumed that families with low income and a higher number of children in particular pay a higher amount of taxes than expected. Second, it is also possible that individuals or families pay lower taxes and SICs than regulations stipulate due to, for instance, fraud. For our analysis, the underreporting of income was considered a possible reason for differences between outcomes and regulations with regard to taxes and SICs. Although some studies have shown that higher education and income lead to less tax fraud (OECD, 2019), other research has pointed in the opposite direction (Dayıoğlu Erul, 2021). In general, tax morale can hardly be connected to socioeconomic characteristics.
Following these three explanatory factors, we assumed that redistributive outcomes and regulations differ and that they vary across family types, as these are differently eligible for benefits and liable for taxes (see e.g. Nelson and Nieuwenhuis, 2021). According to the presented literature, differences between outcomes and regulations will negatively affect families with lower incomes and a higher number of children. Cross-country variation in the deviation between regulations and outcomes can also be assumed. Research on tax evasion and tax morale has shown clear cross-country differences. However, while international studies using aggregated data showed a relationship between economic development levels and tax compliance, studies using microdata on Europe have presented no clear pattern with regard to regional or economic differences according to country (see Kukk et al., 2020). Research on (non-)take-up of welfare benefits has generally referred to single benefits and studied single or few country cases (e.g. Fuchs et al., 2020; Vinck et al., 2018). Hence, it is difficult to expect specific patterns that reflect country differences in our study. Therefore, with regard to country differences, our study adopted an explorative approach.
Methodology
In this part, we explain in detail our analytical approach, the data we used and the variables and method we applied to answer the research question.
Analytical approach
To answer the research question, we first need to clarify our analytical approach, which will be concretised in the Methods section below. Frequently used in the relevant literature on redistribution is gross income, such as in studies on welfare state redistribution (Esping-Andersen and Myles, 2009), equal pay and the gender pay gap (O’Reilly et al., 2015). Gross income, though, is affected by factors in addition to regulations, among which are preferences, behaviour or labour market structures (Bowles et al., 2001; Eurostat, 2020; Pfau-Effinger, 2005). Therefore, differences in gross income can only provide insights into redistribution if the overall formal and informal social order is regarded as equivalent to its redistributive regulations. This equation is often found (e.g. Daly, 2020) and mostly without reflecting its conceptual, methodological and empirical fault lines (as discussed in the state of the art and by Frericks et al., 2016). In contrast, it is net income that is directly affected by redistributive regulations through benefits, taxes and SICs. Consequently, we used simulated net income – that is, simulated on the basis of the relevant regulations – to study redistribution as regulated. The redistributive outcome was measured as the actual net income. With this approach, we could easily determine the differences between regulated redistribution and redistributive outcomes because we proceeded from the same gross income from which they were derived.
Since we focused on redistribution in terms of family, we studied the families’ simulated and actual net incomes. A family's simulated net income shows us the regulated redistribution in terms of family type, including all relevant redistributive regulations affecting the families under study, while a family's actual net income represents an adequate indicator of redistributive outcomes in terms of family type. Differences between the redistribution as regulated and the redistributive outcomes were identified by measuring the difference (Δ) between the actual and simulated net income for family types with the same gross income (see Figure 1).
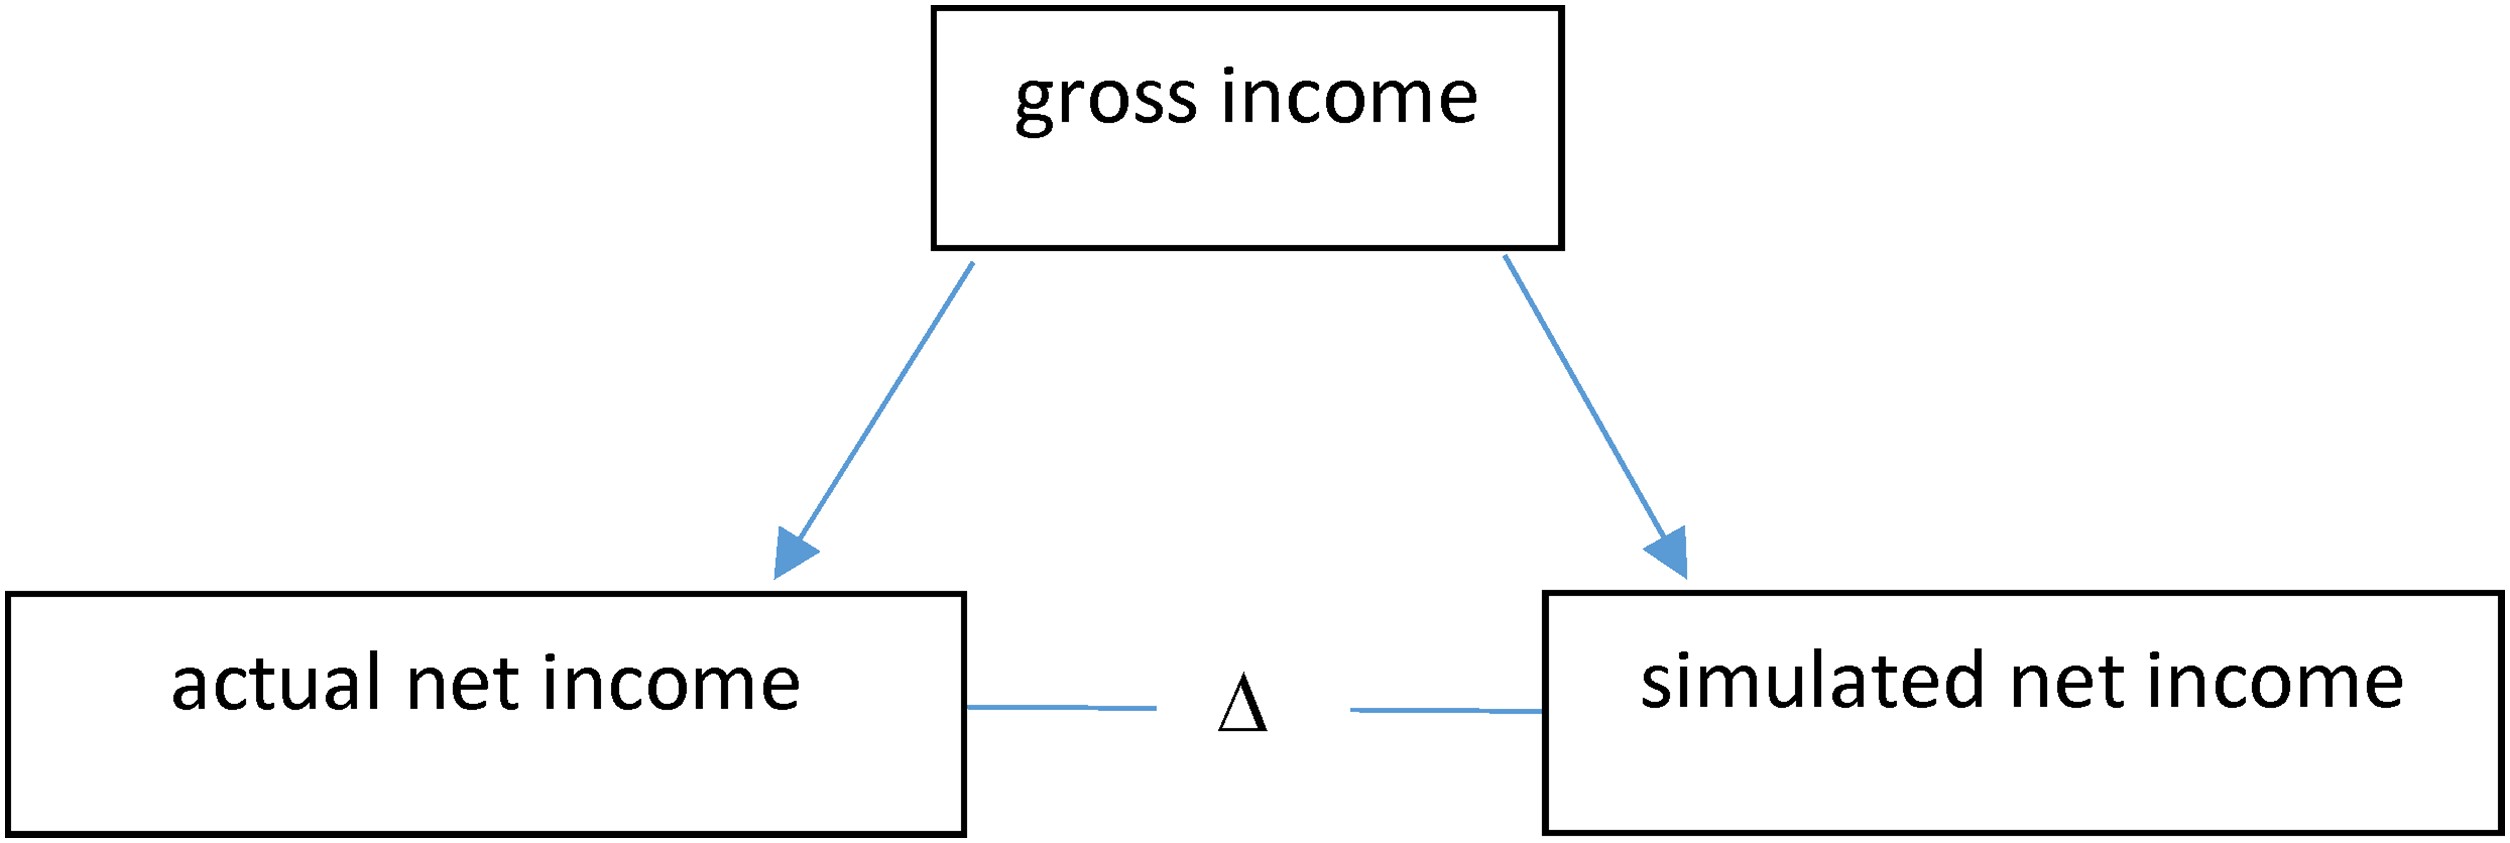
Relationship between gross income and actual and simulated net income. Source: Authors’ compilation.
To study the family as a multidimensional concept, not only sociologically but also in terms of redistributive regulations, we distinguished a variety of family types. First, some families have and do not have dependent children. Some definitions of the family interpret the generational relationship between parents and children as a precondition for calling a social unit a family (Schneider and Kreyenfeld, 2021). However, we applied a broader definition to include couples without children, since they are addressed as a family by redistributive regulations also. For logical reasons, we had to limit our investigation to officially registered family types, since unknown family members cannot be directly addressed by regulations. To cover sufficient variation in the number of children, we considered whether families had 0 to 3 or more children. A second relevant characteristic of different family types is whether it is a single-parent or couple household. Finally, as a third characteristic, we analysed redistributions for different family types with different income levels, since, as discussed above, differences between redistributive regulations and outcomes might depend on income level.
Database
For the analysis of actual and simulated net income, we used the input data in the tax-benefit microsimulation model of the European Union (EUROMOD). This dataset is based on the European Union Statistics on Income and Living Conditions (EU-SILC). With these data, it is possible to identify both the actual net income as reported in the EU-SILC and to simulate the net income with the help of EUROMOD (version I4.109+) (ISER, 2022).
For our cross-sectional analysis, we used the most recent EUROMOD input data available from 2020. Since the income variables in this dataset refer to the preceding year (i.e. 2019) and the 2019 income is affected by 2019 regulations, we drew on regulation data from 2019. Consequently, our analysis was unaffected by the possible impact of the COVID-19 pandemic.
To determine cross-country variations in the deviation between redistributive regulations and outcomes, our analysis included seven European countries. The choice was based on the availability of register data in EU-SILC on actual disposable household income (and, consequently, EUROMOD input data). This guaranteed the most sound calculation of the deviation between redistributive regulations and outcomes. The more commonly used survey-based income data might deviate from ‘real’ income data. Register data are available for Austria, the Netherlands, Spain, Sweden, Finland, Slovenia and Latvia. Sweden, Finland and the Netherlands belong to the ‘old’ register countries, which have used almost exclusively register data in the EU-SILC (Törmälehto et al., 2017). Austria, Spain, Slovenia and Latvia, which shifted to use register data more recently, make use of such data as far as possible, since administrative data do not contain exactly the same variables for each country (Törmälehto et al., 2017; Zardo Trindade and Goedemé, 2020).
The sample in our study consisted of the households of the family types under study. We excluded family types that receive social assistance benefits because non-take-up is exceptionally high for this sort of benefit (Fuchs et al., 2020), while families who receive full social assistance usually pay no taxes and SICs. This could have led to bias in our findings for low-income family types. To correct for issues of the probability of selection bias, we used the household cross-sectional weight provided in the EU-SILC data. Table 1 summarises the total non-weighted and weighted number of households per country.
Number of households (non-weighted and weighted).
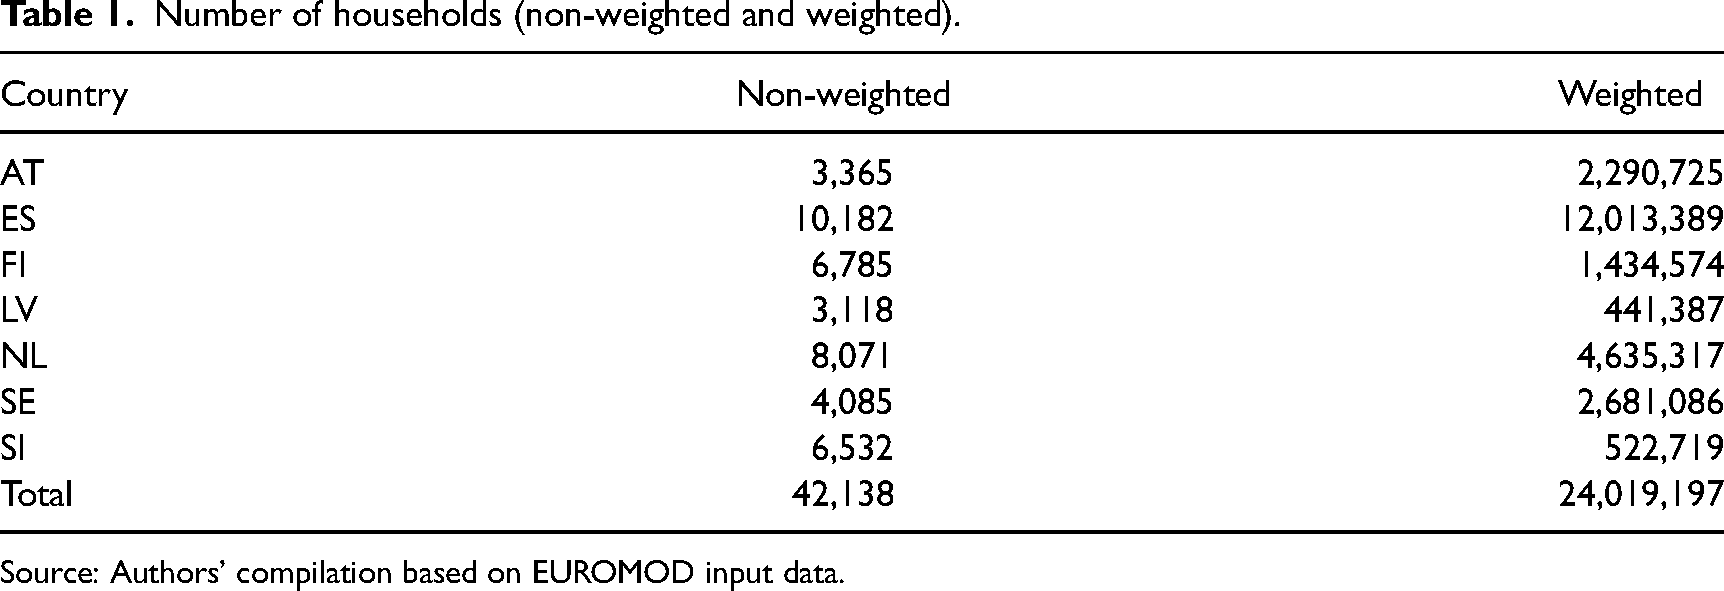
Source: Authors’ compilation based on EUROMOD input data.
Variables and method
We studied actual and simulated net income based on actual and simulated disposable household income. For our analysis, the variable of central interest was calculated as the deviation between actual and simulated disposable household income. It was calculated as the actual disposable household income, as reported in EU-SILC data (yds) minus the simulated disposable household income based on microsimulation with EUROMOD (ils_udb_yds). The components of both the actual and simulated disposable household incomes are reported in Table 2. The resulting variable was summarised for each household and given in purchasing power parities (PPP) to allow for cross-country comparison.
Overview of components of disposable household income.
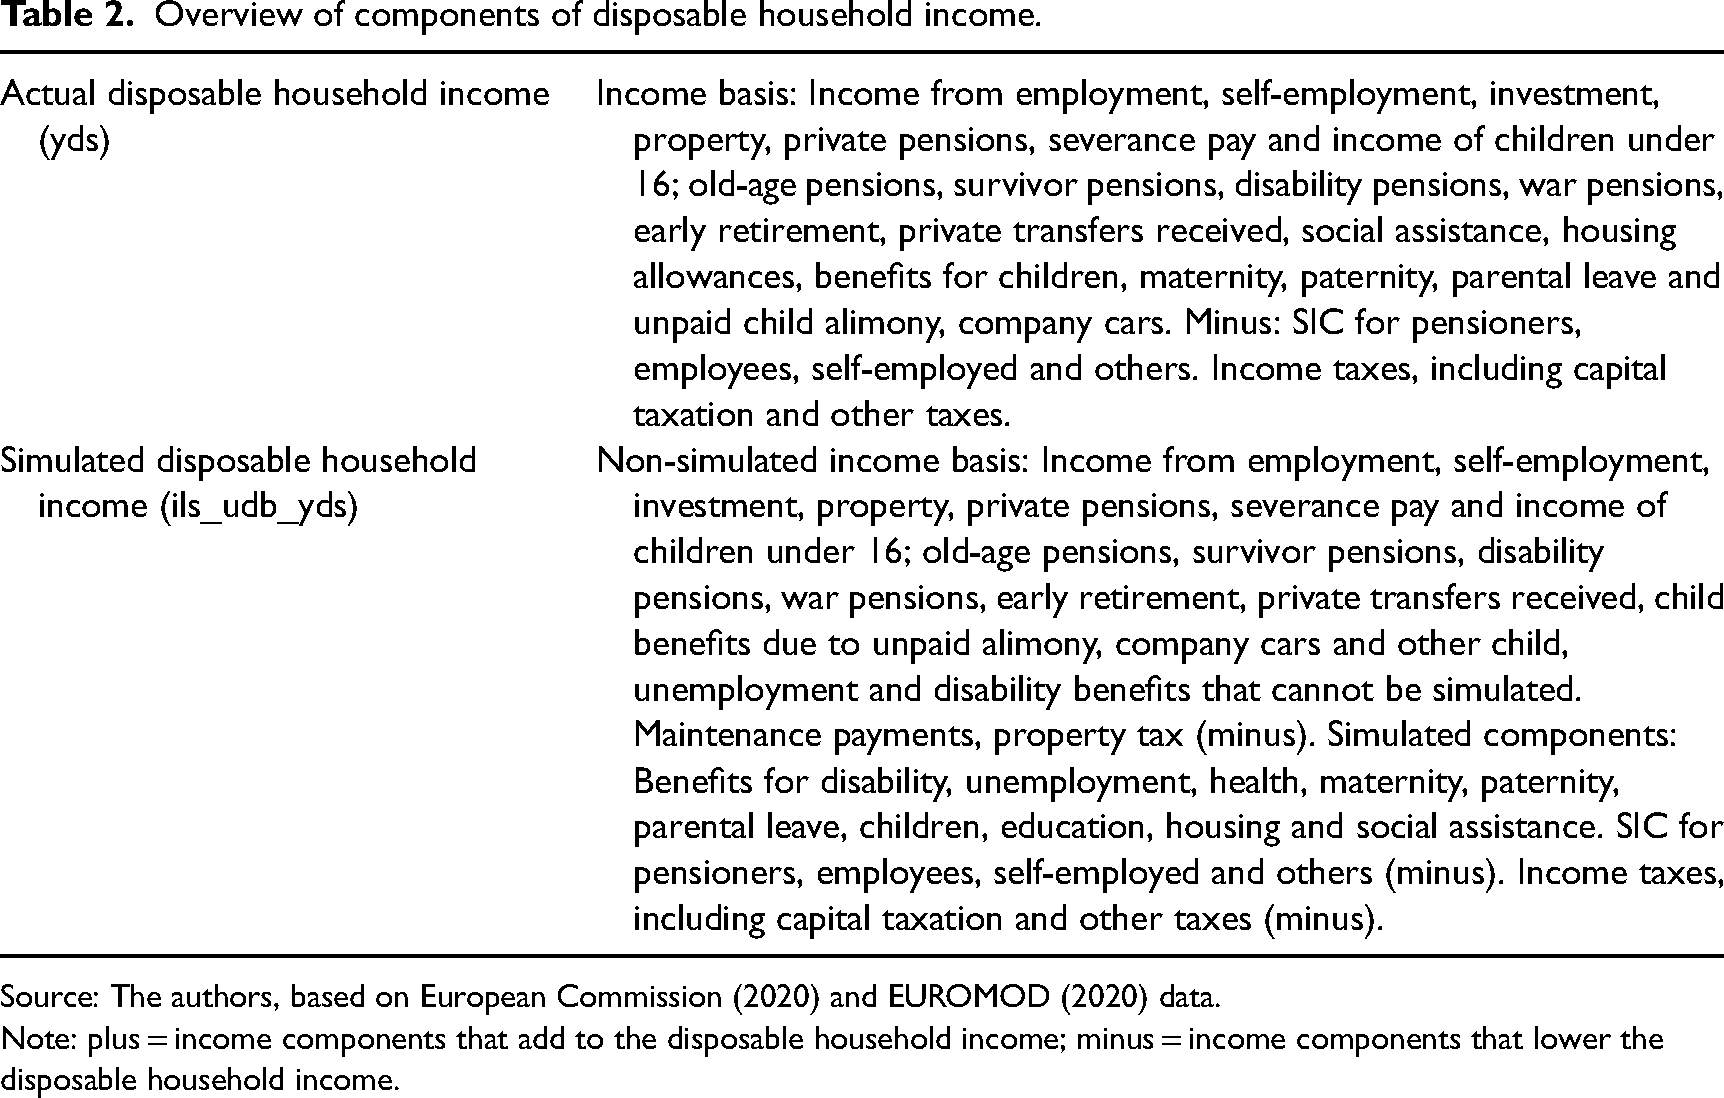
Source: The authors, based on European Commission (2020) and EUROMOD (2020) data.
Note: plus = income components that add to the disposable household income; minus = income components that lower the disposable household income.
For a more detailed investigation into disposable household income, we analysed the deviation between actual and simulated benefits, as well as taxes and SIC. This allowed us to see whether the deviation between the actual and simulated disposable household income was due – for the different countries and family types – to the same or other elements of disposable household income. The deviation between actual and simulated taxes and SIC was calculated as the taxes and SIC reported in the EU-SILC (tis) minus the simulated taxes and SIC based on microsimulation with EUROMOD (ils_udb_tis). To investigate the deviation between actual and simulated welfare benefits, all benefits were summarised, which are provided both as simulated and non-simulated variables in the data. This guaranteed the comparability of the variables for actual and simulated benefits. Here, it is important to mention that the composition of taxes and SIC, on the one hand, and benefits, on the other hand, was country specific. Therefore, the variables for actual and simulated benefits, as well as taxes and SIC, were constructed in an identical manner within countries but not so between countries (see Tables A1 and A2 in the online appendix).
To study differences between family types, we differentiated between households in high-, medium- and low-income groups based on the net equivalised disposable income provided in the EU-SILC data. Here, we used the equivalised disposable income because it is often the basis for distinguishing between different income groups (e.g. in studying poverty). Households with an income below 60% of the median are – according to the common definition – at risk of poverty and can be defined as low-income households (Eurostat, 2022). Households with medium income have a net equivalised disposable income between 60% and 150% of the median. Finally, households with at least 150% of the median income are characterised as high-income households (for thresholds of income groups, see OECD, 2020).
To analyse different family types, it is crucial to investigate a family's household type. For methodological reasons, we needed to assume that a family lived in one household. There were seven household types in our analysis: a single parent with one, two and three or more children; a couple without children; and a couple with one, two and three or more children. Among the family types with children, we considered only households with dependent children below age 18, again for methodological reasons. Furthermore, we excluded the family type of single parents with three or more children and high income from our analysis, since they are clear outliers in the data.
Considering the variables of household income and household type, we distinguished in total 20 family types. For these, we analysed the data by means of descriptive statistics. Since we were interested in the degree of deviations for the different family types and not in explaining the deviations according to their characteristics, a multivariate approach was considered inadequate.
Several limitations of our database and method must be addressed. Although EUROMOD provides a very accurate simulation of benefits, taxes and SICs, it is likely that some cases were missing information on asset tests for means-tested benefits and tax deductions that lead to an overestimation of benefit amounts and taxes (Maier and Ricci, 2022). Hence, to some degree, differences between actual and simulated values might be due to simulation errors in EUROMOD. Unfortunately, it was not possible to quantify such an error based on existing data.
Findings
In this section, we first present the findings on the mean deviation between the actual and simulated disposable household income. We unpack our findings in the next step to identify the mean deviation between the actual and simulated taxes and SIC, as well as the actual and simulated benefits. This helped us identify where the differences between the actual and simulated disposable household income come from.
First, we present the standard deviation (SD) and the mean value of the deviation between actual and simulated disposable household income according to all family types (Table 3). Austria, Spain and Sweden showed comparatively low mean values (with Sweden being the only country with a negative value, that is, the mean actual income was lower than the simulated income). In these countries, the simulated disposable household income hardly deviates from the actual income. The deviation is more pronounced in Finland, Slovenia and Latvia, and particularly so in the Netherlands, where the average deviation between the actual and simulated disposable household income was found to be more than 500 PPP. The Netherlands also had the highest SD (1363.34), indicating high differences between the 20 family types with regard to the deviation between the actual and simulated disposable household income. For Austria, the SD was also rather high (846.28), and it was much lower for the other five countries where differences between the family types were clearly smaller, especially in Finland and Slovenia.
Mean and standard deviation for the deviation between the actual and simulated disposable household income for all family types (weighted) in PPP
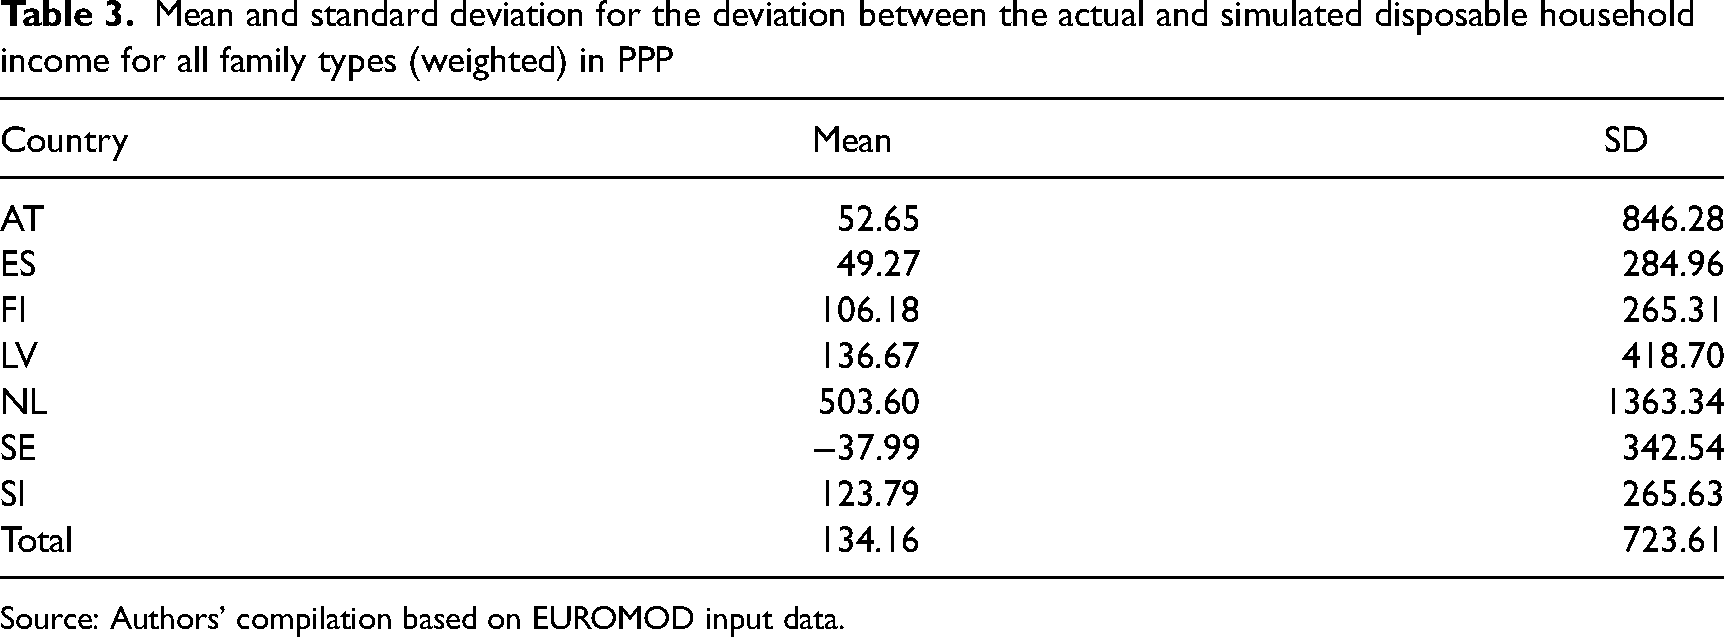
Source: Authors’ compilation based on EUROMOD input data.
Figure 2 shows that, indeed, the actual disposable household income differs – and in part markedly so – from the simulated disposable household income. Comparing the findings for the three income groups reflecting different family types, we found considerable differences in the degree and direction of deviation. However, we also clearly observed that with only two exceptions (single parents with one child in Spain and couples with no children in Latvia), the actual disposable household income was lower than the simulated income for low-income family types. This is most pronounced in Austria, but Slovenia, Sweden and Finland also showed a rather high negative deviation for low-income family types, while it is least pronounced in Latvia. In contrast, most medium-income family types, especially high-income earners, were found to have a higher actual than simulated disposable household income. This is most clearly the case in the Netherlands but also in Finland, Latvia and – for medium-income family types – Slovenia. For high- and medium-income family types, the deviation is lowest in Sweden and Spain. Austria, Sweden and Spain represent special cases because there are some family types with medium and high incomes that showed a negative deviation.
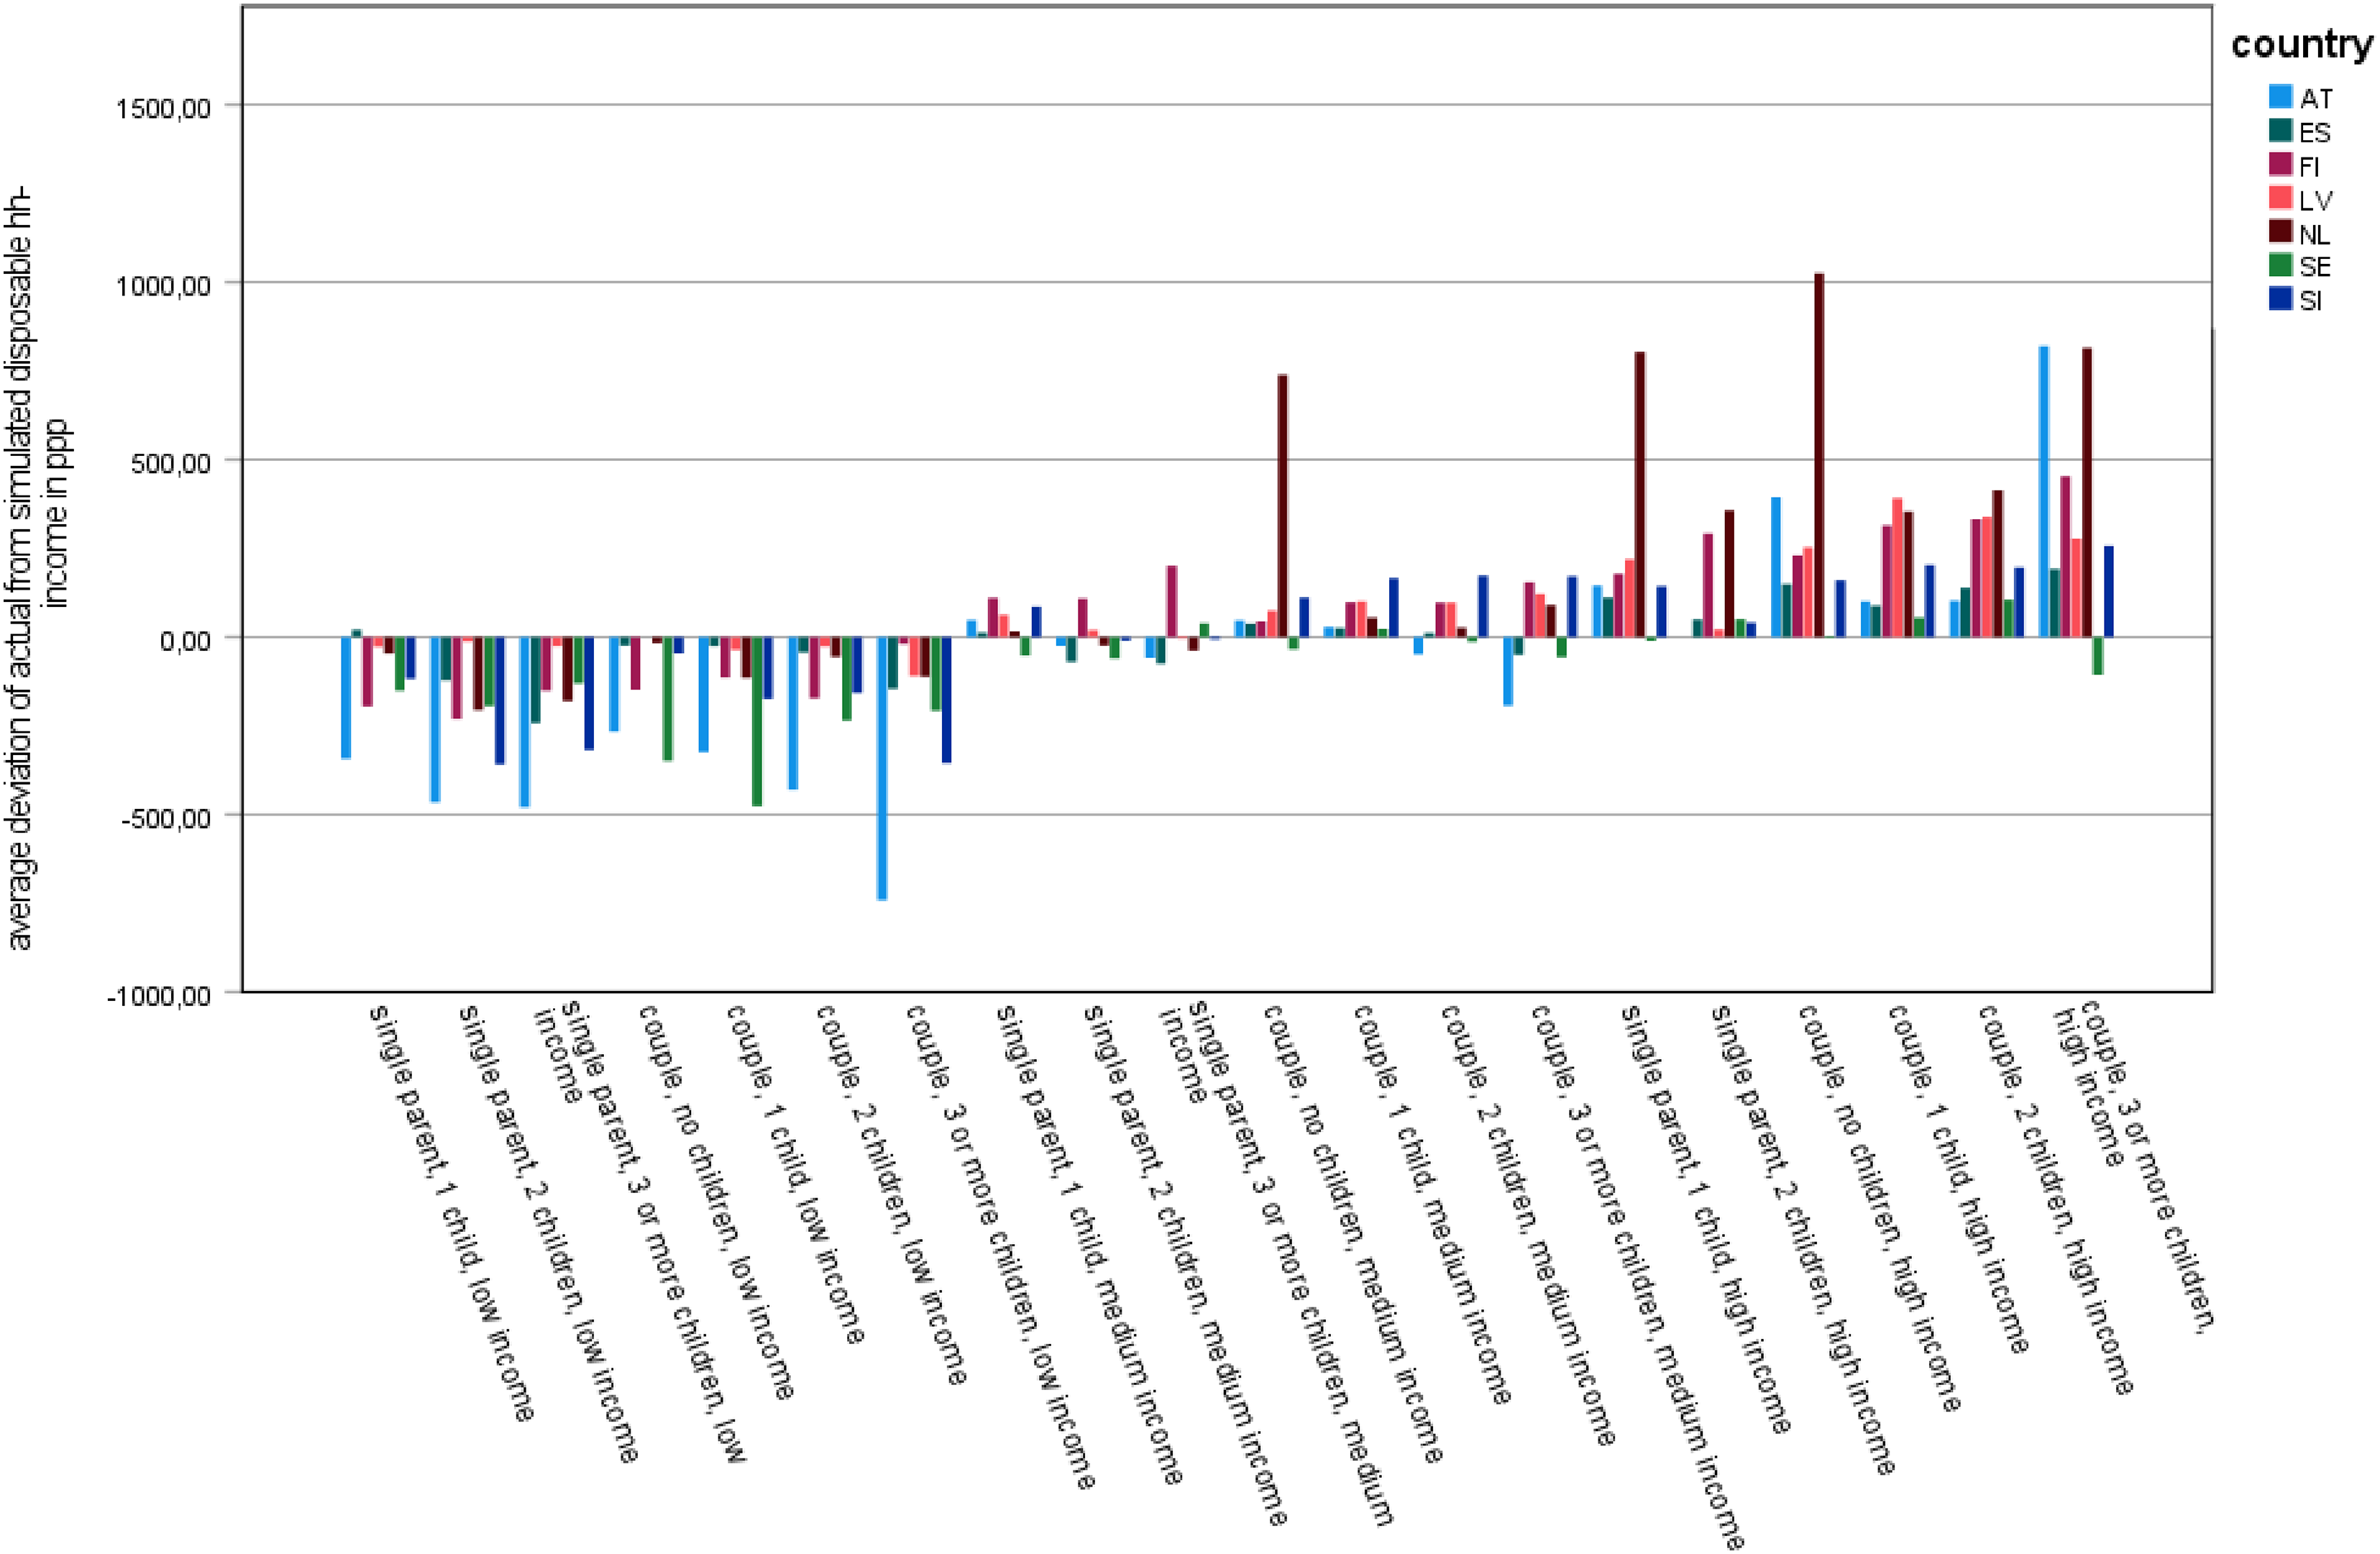
Deviation between actual and simulated disposable household income for family types with and without children (weighted). Source: Authors’ compilation based on EUROMOD input data.
The findings for taxes and SIC (Figure 3) show a clear picture of negative deviation. Please note that this negative deviation leads to a higher actual than simulated disposable household income. Overall, the negative deviation was found to be highest for family types with high incomes, while it was lowest for low-income family types. We found the highest negative deviations for high-income family types in the Netherlands, Finland, Austria and Latvia. Austria is, again, a special case because all family types with low income and most medium-income family types pay higher actual taxes and SIC than simulated. The degree of this deviation increases with the number of children. Additionally, in Sweden, four of the seven low-income family types (and one with medium income) pay higher actual taxes and SIC than simulated, although to a lower degree than in Austria.
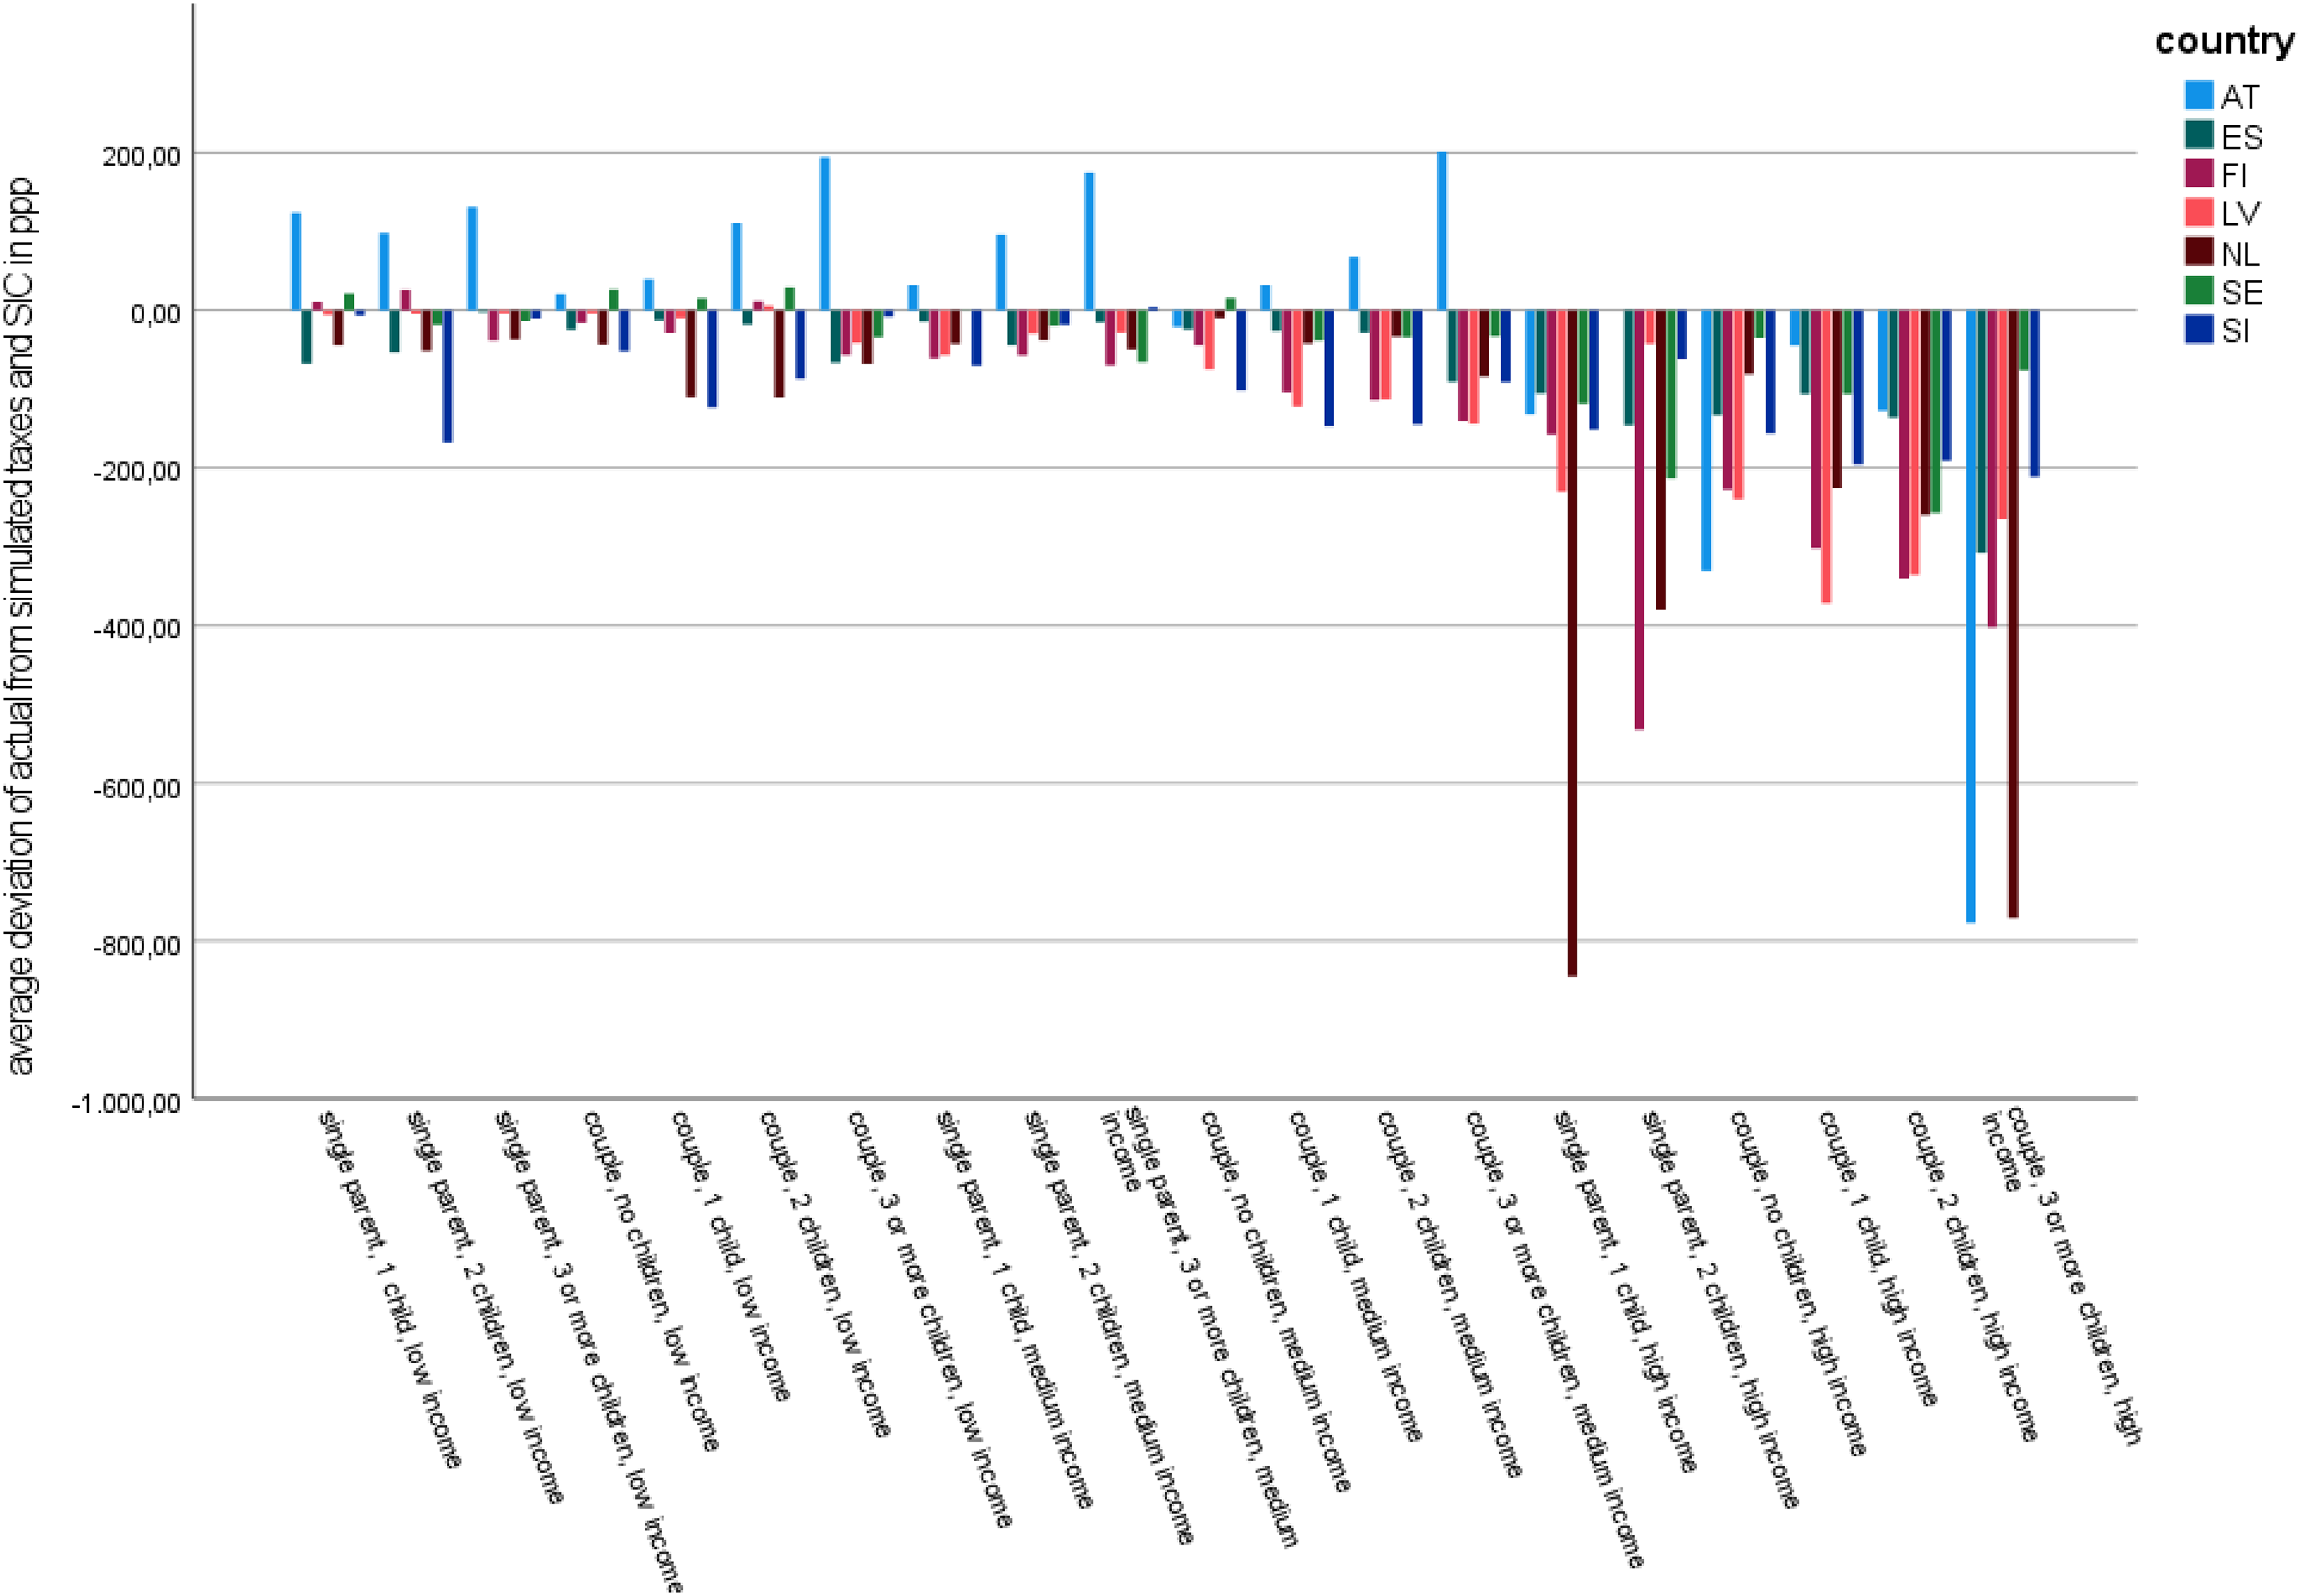
Deviation between actual and simulated taxes and SIC for family types with and without children (weighted). Source: Authors’ compilation based on EUROMOD input data.
The findings on benefits further showed that in most countries, most family types receive fewer benefit payments than simulated (Figure 4). This is, again, most pronounced in the low-income family types. We found the highest values for Austria, where the negative deviation increased with the number of children (similar to taxes and SIC). There was also a rather high negative deviation in Slovenia. Contrary to these results are those for Finland and Sweden. Here, several family types, especially those with medium and high incomes, received higher actual benefits than simulated. This is, to a lower extent, also the case in Latvia. The countries with the lowest overall deviations with regard to benefits are Spain and Latvia. Similarly, medium- and high-income family types in the Netherlands showed low deviations.
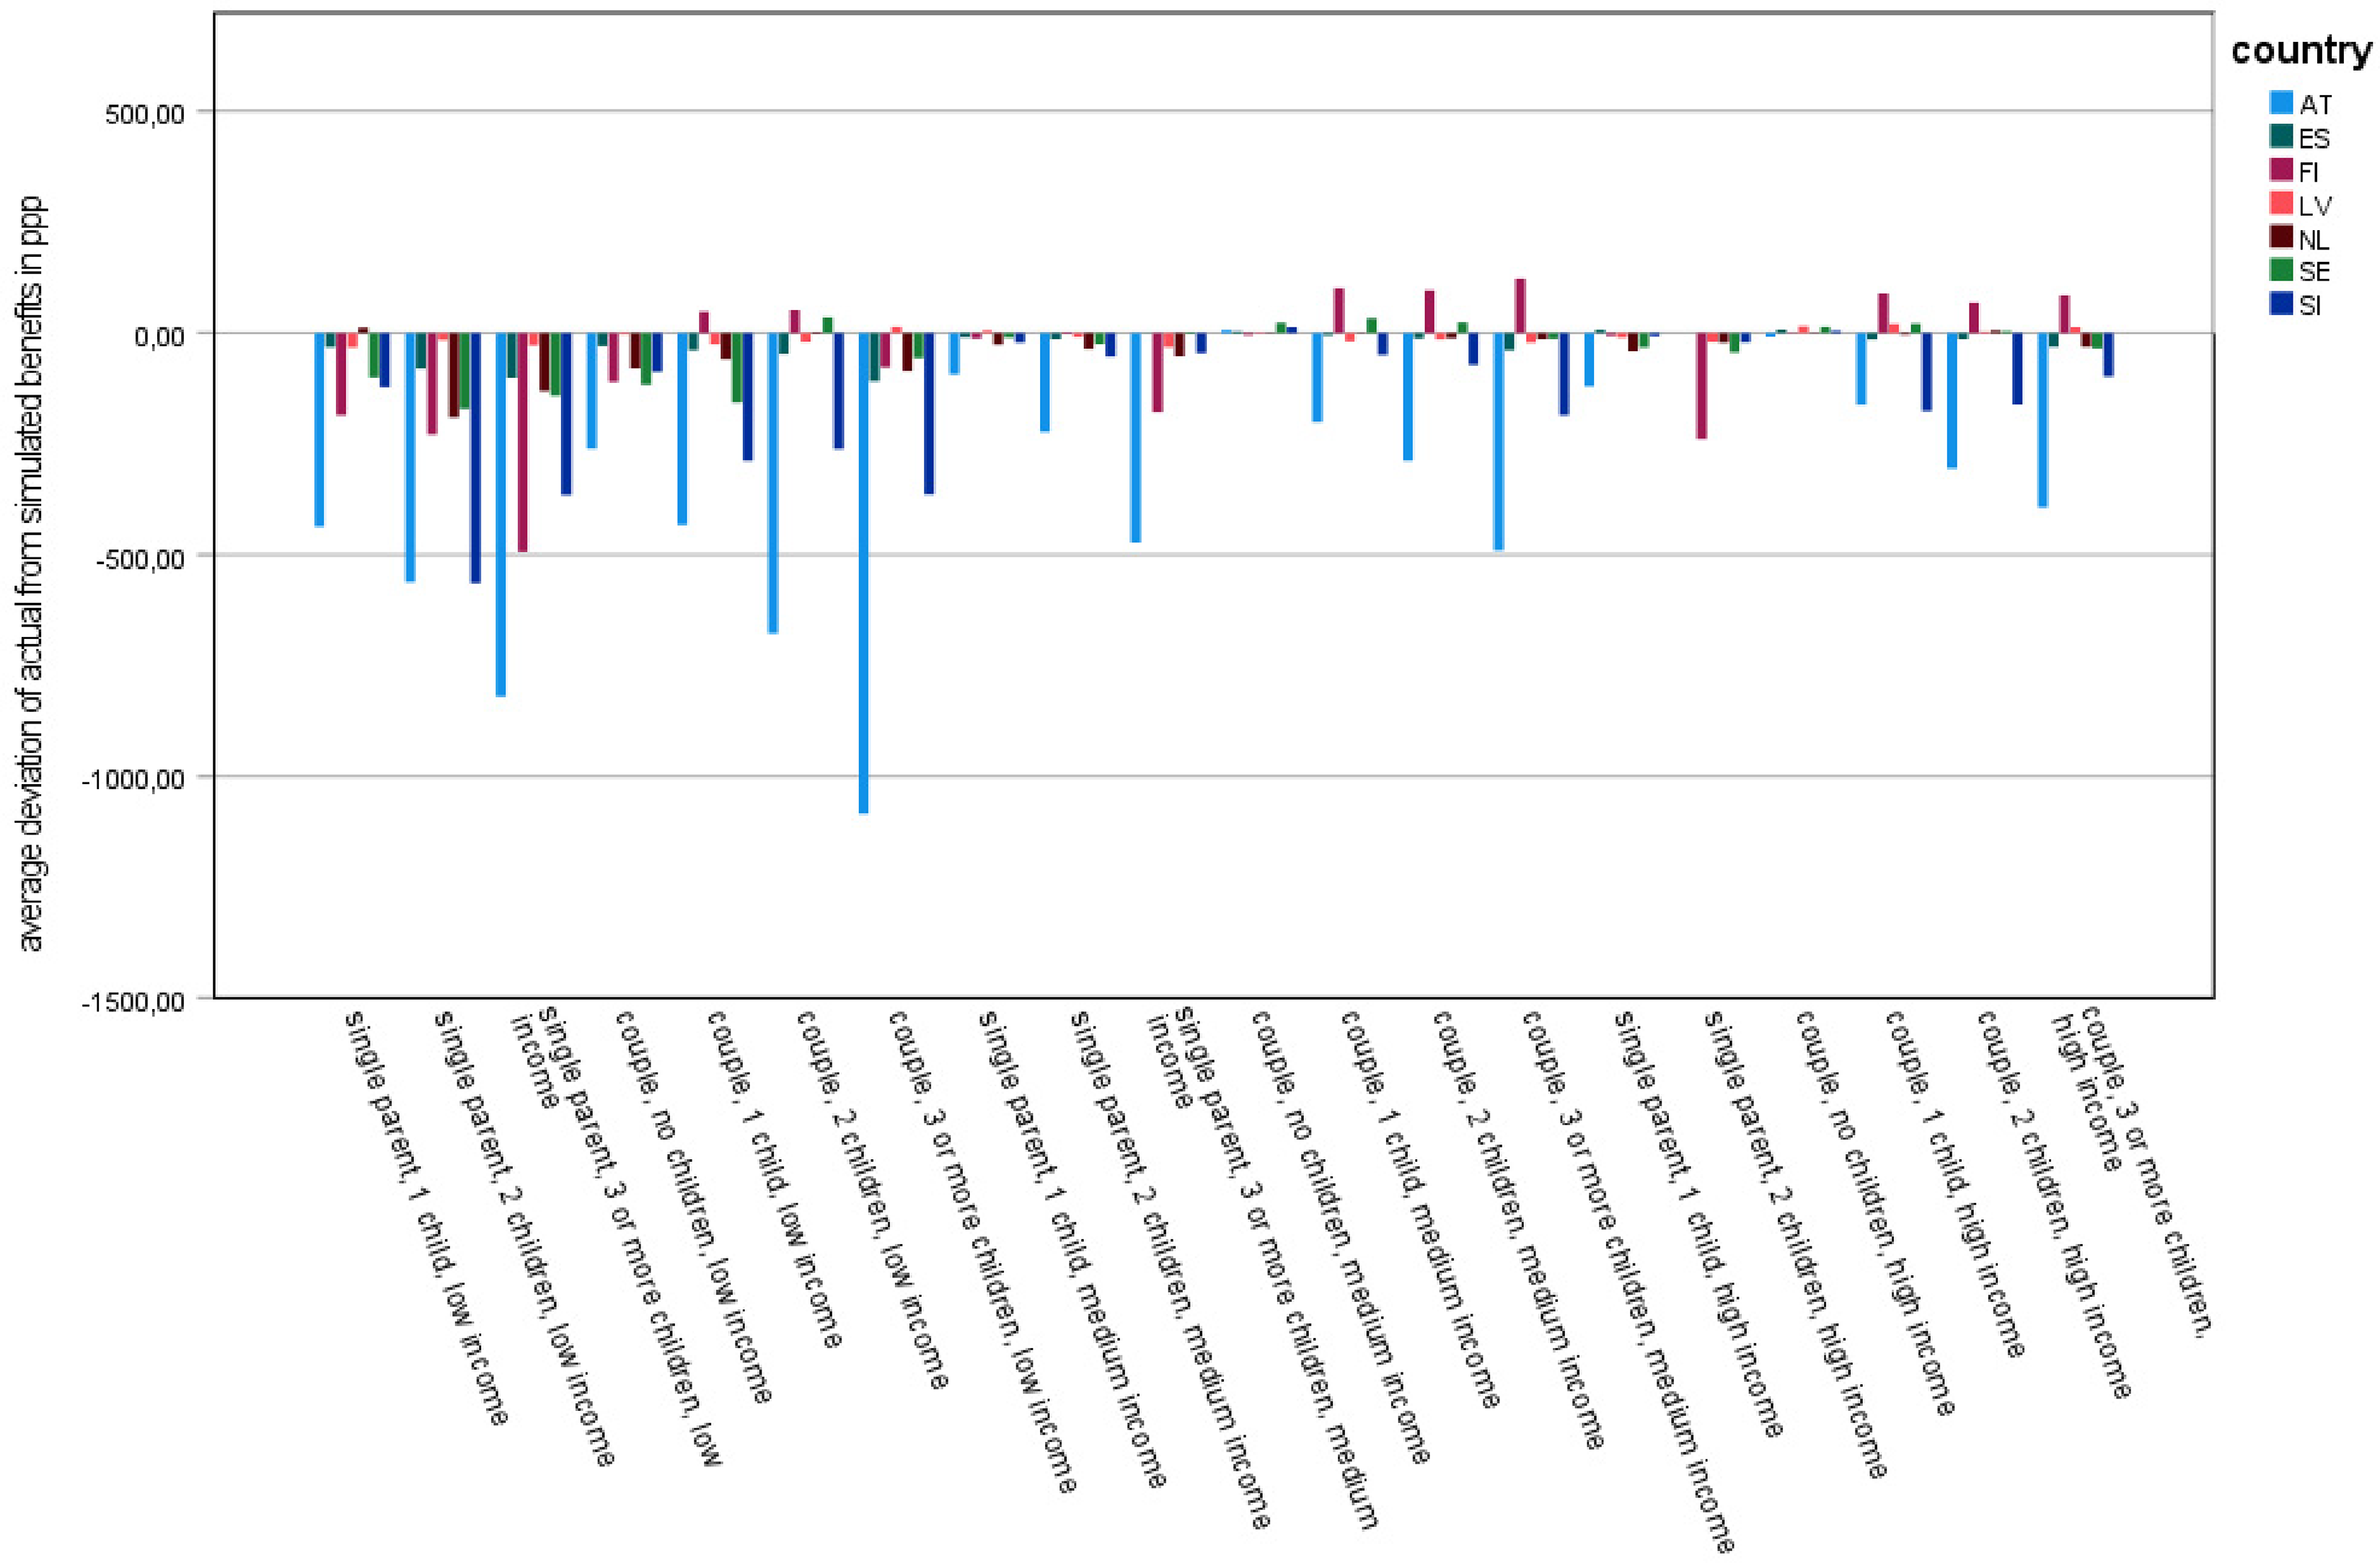
Deviation between actual and simulated benefits for family types with and without children (weighted). Source: Authors’ compilation based on EUROMOD input data.
Discussion
Measuring the deviation between redistribution as regulated and redistributive outcomes shows us how far redistribution corresponds to what has been officially agreed upon in societies and who is actually better or worse off in the end. Our results revealed that the degree to which the actual disposable household income corresponds to the simulated disposable household income of households with the same gross income differs according to family type and country.
With regard to family types, there is clear inequality between family types with different incomes. Family types with low income generally show a lower actual than simulated disposable household income (i.e. they get less than one expects from the respective redistributive regulations). The literature suggests that these families more often lack knowledge about whether and how to apply for benefits (van Oorschot, 1998) or how to take advantage of tax deductions. This is different for family types with high incomes and – in most countries to a lesser degree – also for medium-income family types: the actual disposable household income is higher than the simulated one. This seems to be a variation of the Matthew effect – the poor get fewer resources than the middle class (Gal, 1998). The Matthew effect has often been linked to redistributive regulations, but our findings showed that it also depends on their translation into actual redistribution.
Another general insight resulting from our findings is that the relevance of benefits, on the one hand, and taxes and SIC, on the other hand, to the overall disposable household income is different, depending on a family's income and number of children. For low-income family types, especially those with a higher number of children, the non-take-up of benefits has a more significant impact on the deviation between disposable and actual household income than taxes and SIC. The opposite holds true for high-income family types. In other words, low-income family types showed a lower actual than simulated disposable household income mainly because they received fewer benefits than simulated, while high-income family types showed a higher actual than simulated household income since they paid less taxes and SIC than simulated.
How can we explain this finding? With regard to benefits, low-income families, especially those with a higher number of children, are more likely to show benefit non-take-up (see above). This is reinforced by the fact that numerous European countries offer benefits targeted at low-income households (Frericks et al., 2020; Saraceno, 2006). Thus, if low-income families are eligible for a larger number of benefits than medium- and high-income families but families with a higher number of children need to apply more often, there is also a higher risk of non-take-up. For these two reasons, it is not surprising that low-income families, especially those with a higher number of children, showed a higher negative deviation between the actual and simulated benefits than other families. With regard to taxes and SIC, we need to consider the fact that tax rates are proportional or often even progressive (i.e. families with high income pay higher taxes in absolute amounts than those with lower incomes). If we assume that tax evasion and measurement errors are proportionally equal for families with different income levels, this leads to higher absolute deviations between actual and simulated taxes and SIC for high-income families. To test this assumption, we analysed the deviation between actual and simulated taxes and SIC relative to the families’ gross income (see Figure A1 in the online appendix). The results showed that there were no systematic differences between family types with different income levels among the seven countries. Finally, our results for taxes and SIC showed no systematic differences between single or couple family types. This means for the overall picture – this is the differences between the disposable household income and the families’ gross income – that there were no systematic differences between family types with medium and high income. Nevertheless, low-income families still showed lower actual than simulated disposable income, most likely due to benefit non-take-up (see Figure A2 in the online appendix).
As argued earlier, our study applied an explorative approach to analyse country-based differences because it is not possible to hypothesise specific country clusters. The findings regarding family types with different income levels and a varying number of children hold true for most of the seven countries under study. However, there are some interesting variations. First, Austria is a special case because all low-income and almost all medium-income family types pay higher taxes and SIC than simulated, while the country is associated with the clearest negative deviations for benefits. Consequently, for low-income families in Austria, the actual disposable household income was clearly below the simulated income among the seven countries. This might partially be explained by the fact that in Austria, numerous groups of citizens are obliged to fill in a tax declaration (BMF, 2022), and it is likely that family types with low and medium incomes often do not make use of advantageous regulations. With regard to benefit non-take-up, it is difficult to make a sound assessment in the case of Austria because research on benefit non-take-up in Austria has focused on social assistance benefits (see Fuchs et al., 2020) that were intentionally excluded from this analysis. Moreover, the Netherlands stands out with its much higher actual disposable household income for high-income family types than simulated. Combined with a medium negative deviation between the actual and simulated disposable household income, this reflects the highest differences between the family types among the seven countries (see Table 3). One important reason for this is that some high-income family types pay fewer taxes and SIC than simulated. We observed the lowest differences between the actual and simulated disposable household income among the 20 family types in Finland and Slovenia. This might be related to the low income inequality in these countries, the lowest in our sample (Gini coefficient of 0.246 in Slovenia and 0.273 in Finland in 2019; OECD, 2022), which might positively affect the willingness of the population to follow the redistributive logic as legislated.
Our methodological decision to analyse the deviation between the actual and simulated disposable household income stressed a highly relevant factor of redistribution: there are indeed families (primarily family types with high income) who have a higher actual income than simulated. This phenomenon has been discussed in existing research using the term ‘beta errors’, and these errors present a residual category, since they might be due to administrative decisions and fraud on the one hand and simulation errors on the other (see section 2). Our analysis revealed a considerable extent of beta errors in welfare state redistribution. This phenomenon is still a rather hidden or ignored aspect of redistribution research and should receive more attention. In addition, although the inclusion of taxes in redistribution analysis has long been demanded by colleagues (Bradshaw and Nieuwenhuis, 2021; Dingeldey, 2001), they have never been systematically included. Consequently, our analysis of taxes and SIC in combination with benefits provides additional insights into redistribution. The predominantly negative deviation in terms of taxes and SIC might be related to a bias in the microsimulations performed with EUROMOD. Tax regulations, which are generally complex in nature, are extremely challenging to implement in EUROMOD, since specific information on the various circumstances that result in tax deductions might be missing. However, even if we assume that there is such a bias, its consequences are in favour of family types with high incomes.
Conclusion
Redistribution is one of the key elements of contemporary social order, and research has dealt with it in various ways. However, it has mainly been studied in the context of poverty reduction and redistribution between the currently working and non-working population. Societal redistribution in terms of family is often not considered, and when it is, a one-dimensional perspective on the family has mostly been applied. In addition, most studies have mixed regulations on redistribution and actual outcomes in their analyses. For an adequate understanding of redistribution, one needs to distinguish between redistribution as regulated and officially agreed upon by societies and the actual outcomes that also result from additional societal conditions. The outcomes that are directly linked to redistributive regulations might not even be adequate for drawing our conclusions regarding redistributive regulations, since also these specific outcomes might deviate from the regulations they base on. In fact, in this study, we investigated how far redistributions as regulated and redistributive outcomes correspond to one another.
Measuring the unequal conversion of the first into the latter showed us how far redistribution corresponds to what has been officially agreed upon. In addition, we could see who is actually better or worse off in the end. Empirically focusing on family-related redistribution, the original methodological set-up of this paper allowed us to undergo this research. We investigated this difference by determining the families’ disposable household income and comparing their actual and simulated net income. Since our point of departure was the same gross income of these families, the study clearly sheds light on differences in redistribution as regulated and that which actually results, independently of the various factors that influence gross income. We compared the deviation for 20 family types, which we distinguished according to income level, the number of children and whether they were headed by a single parent or a couple. Furthermore, we compared seven European countries for which the data were best: Austria, the Netherlands, Spain, Sweden, Finland, Slovenia and Latvia. For a more nuanced analysis, we studied the deviation between the actual and simulated taxes and SIC, as well as the deviation between actual and simulated benefits as two components of disposable household income.
The findings showed that family types with high income receive, on average, a clearly higher actual than simulated disposable household income, while the opposite is true for family types with low income. The deviation between actual and simulated income was found to be the lowest for medium-income family types. This pattern was relevant for all seven countries; it was most pronounced for the Netherlands and Austria and least pronounced for Finland and Slovenia. Hence, there is a high degree of inequality in the deviation between regulated and factual redistribution. Moreover, the findings showed that most family types pay less in taxes and SIC than simulated but also receive less in benefits. Family types with high income pay on average clearly less in taxes and SIC than simulated and receive somewhat higher benefits than expected (especially in Finland, Sweden and Latvia) or show only a comparatively low negative deviation from the simulated benefits. For low-income family types, we found in contrast a ‘cumulated disadvantage’ because the taxes and SIC they pay are only a little lower than simulated or even higher (Austria and Spain in a few cases), and the benefit payments they receive are clearly lower than simulated. One of the major results of our study, therefore, is that the so-called Matthew effect, which has often been linked to redistributive regulations, is often increased by the regulations’ translation into actual redistribution.
Summarising the discussion of our findings, we argue that welfare state research needs to pay more attention to the differences between redistributive regulations and actual outcomes to adequately capture international differences in redistribution and better understand the inequality of redistribution between different social groups.
Finally, what could be done to make the unequal conversion more equal? With regard to taxes, making a tax declaration often depends on profound knowledge about tax deductions that is particularly challenging families with low income, as shown above. If, instead, administrative authorities applied tax deductions automatically, a larger number of citizens could profit from these regulations. Similarly, with regard to benefit take-up, complex rules and application processes that require a high degree of activity by the claimant, often in combination with a discriminatory or stigmatising character of the benefit, lead to relatively high non-take-up (see e.g. Van Oorschot, 1998). Automatic enrolment of eligible individuals or families by the administrative authorities would increase benefit take-up especially in the case of means-tested benefits. This could improve the financial situation of many families with low income.
Supplemental Material
sj-docx-1-asj-10.1177_00016993231224223 - Supplemental material for The unequal conversion of intended redistribution into factual redistribution in Europe and its impact on social inequalities between families
Supplemental material, sj-docx-1-asj-10.1177_00016993231224223 for The unequal conversion of intended redistribution into factual redistribution in Europe and its impact on social inequalities between families by Patricia Frericks and Julia Höppner in Acta Sociologica
Footnotes
Acknowledgements
The results presented here are based on EUROMOD version I4.109+. Originally maintained, developed and managed by the Institute for Social and Economic Research (ISER), since 2021 EUROMOD has been maintained, developed and managed by the Joint Research Centre (JRC) of the European Commission in collaboration with EUROSTAT and national teams from the EU countries. We are indebted to the many people who have contributed to the development of EUROMOD. The results and their interpretation are the authors’ responsibility. The results and conclusions in this paper based on the EU-SILC 2020 data are not those of Eurostat, the European Commission or any of the national authorities whose data have been used. The responsibility for all conclusions drawn from the data lies entirely with the authors.
Funding
The authors disclosed receipt of the following financial support for the research, authorship, and/or publication of this article: This paper is a result of the research project FaSo (‘The relevance of family for social rights in international comparison: between family allowances and legally obliged family solidarity’, 2020–2024) which is led by Patricia Frericks and financed by the German Research Foundation (DFG), Grant Number: FR 2687/14-1.
Author biographies
References
Supplementary Material
Please find the following supplemental material available below.
For Open Access articles published under a Creative Commons License, all supplemental material carries the same license as the article it is associated with.
For non-Open Access articles published, all supplemental material carries a non-exclusive license, and permission requests for re-use of supplemental material or any part of supplemental material shall be sent directly to the copyright owner as specified in the copyright notice associated with the article.