
Abstract
Political involvement differs according to youngsters’ social background, but the role of students’ own educational pathways in that social gradient is less clear. We investigate whether track position and the school composition mediate and/or moderate the social gradient in the development of students’ political involvement. Examining schools in Ghent (Flanders, Belgium), Barcelona (Catalonia, Spain) and Bergen (Norway) – we investigate whether these determinants for change in political engagement during upper secondary education differ between educational systems. Results from multilevel conditional change models show that the role of social background in changes in political involvement matters across the studied educational systems, but the role of track and school composition varies. In Barcelona, all the impact from social background on the increase in political involvement can be accounted for by track position, whereas in the Flemish system, the increase in political involvement is higher among those in academic tracks if they have low social background rather than high. There is more variance between schools in Ghent, and ethnic school concentration is associated with a smaller increase in political involvement there. The Norwegian system has little between-school variance and small differences between tracks.
Introduction
Concern with young peoples’ political involvement has long been evident in research and policies. A variety of studies have shown that over recent decades young people have exhibited a decreasing propensity to vote, a decline in political party membership and diminishing trust in political organisations (e.g. DeBardeleben and Pammett, 2009; Sloam, 2014). Importantly, current research notes a social gradient in political involvement, in the sense that people from the higher social strata–characterised by higher income, higher levels of education and generally more resources are more likely to be politically involved (e.g. Castillo et al., 2015; Lenzi et al., 2012). Such findings present problems for the current state of democracy, which should rely on an active involvement and participation of citizens of all social strata.
The social gradient in political involvement is also visible for students while still at school (Deimel et al., 2020). Research shows, for instance, that students from lower-strata families are less likely to participate politically, in terms of voting and protesting, than their higher-strata counterparts (Hoskins and Janmaat, 2016). While education, through its socialisation function, is seen as an important institution in fostering political involvement in youngsters, it has also been shown to be an agent of social reproduction (Breen and Johnson, 2005).
We know from cross-national educational research that there are variations between educational systems in the extent to which they reproduce social inequality (Breen and Jonsson, 2005). It is likely that the role of education in channeling, reducing or magnifying social inequality in the development of political involvement differs across educational systems as well (e.g. Janmaat, 2011; Janmaat and Mons, 2011). Janmaat and Mons (2011) argue that there is tension between two functions of an educational system in relation to political involvement among students. First, educational systems should create social cohesion, which they do by fostering civic values and political participation. On the other hand, however, educational systems have a selection function. Specifically, educational systems face an academically heterogeneous student population, and the way they homogenise this population differs across systems. Mons (2007) distinguishes between four heterogeneity management models. First, some systems are separation models – that is, they utilise stringent tracking and extensive grade retention. On the other hand, there are individualised integration models, which are comprehensive and utilise automatic promotion. Uniform integration models complement grade retention with a comprehensive system, and a la carte integration model complement ability grouping with automatic promotion. Janmaat and Mons (2011) expect that these differences in what they call pedagogical differentiation affect differences in political involvement – the higher this differentiation, the more difficult it is for educational systems to stir political involvement in all students. Pedagogical differentiation can be captured by two features. First, the extent to which an educational system is tracked – that students are segregated because they attend different curricular programs – and to what degree the system is socially segregated – the extent to which students from different social backgrounds attend different schools (see e.g. Agirdag et al., 2013).
One would thus expect that the social gradient in political involvement is most pronounced in educational systems with higher levels of pedagogical differentiation, in the form of stringent tracking and larger between-school segregation. Existing comparative research on this subject is however scarce, and usually limited to cross-sectional data structures (Janmaat and Mons, 2011). As such, there are still important knowledge gaps concerning the relative contribution of tracking and between-school segregation in the social differences in the development of political involvement. To investigate the impact of pedagogical differentiation across systems, we studied the change in the political involvement of students going through upper secondary education in three different educational systems – in Ghent (Flanders, Belgium), Barcelona (Catalonia, Spain) and Bergen (Norway). It is instructive to compare these three systems. First, they differ in the way they deal with academic heterogeneity (Mons, 2007). Flanders, Belgium is a prototypical ‘separation model’ system. Since Flanders mostly uses between-school tracking, and the selection in the various tracks is not free of social bias (Boone and Van Houtte, 2013), there is a high level of social and ethnic segregation between schools (Agirdag et al., 2013). At the other extreme, we found the ‘individualised integration model’, of which Norway is an example. There is a relatively low level of social and ethnic segregation in this system (Strømme, 2021; OECD, 2004), and the upper secondary level is where the tracking first occurs, and hence where some segregation is visible. In between lies the Spanish system, which employs a ‘uniform integration model’, where grade retention is frequently applied but the choices that students have to make are less restricted and occur later in the educational career than in separation models (Bernardi, 2012).
In this work, we first studied the differences in the impact of social background on the changes in political involvement during the last years of upper secondary school in the three cities in question. Political involvement is here conceptualised as how much students think they are likely to be involved in different extra-parliamentary forms of participation in the future. The focus on upper secondary school is important, since it is at that level of education students are allocated to different programs in comprehensive systems such as Norway and Spain, making it possible to study the role of pedagogical differentiation (Janmaat and Mons, 2011). Moreover, previous scholars have noted the central importance of this educational level in fostering political involvement over the longer term (Hooghe and Wilkenfeld, 2008). Second, we investigated whether students’ track position and the socioeconomic status (SES) and ethnic school composition affect change in political involvement directly. Third, we studied the role of track and school composition in the social gradient of changes in political involvement.
Political involvement and education
Adolescence is considered a crucial period in terms of the development of political views and involvement (Eckstein et al., 2012), and researchers and politicians alike have been worried for decades about declining political involvement among the young (see e.g. Flanagan and Levine, 2010). Political involvement has traditionally been defined as actual voting, joining political organizations and having trust in politicians. It has on several occasions been pointed out, however, that young people's political involvement is not necessarily decreasing. Rather they are increasingly turning to alternative ways of being politically involved, or a more latent involvement (Tzankova et al., 2021). Adolescents tend to feel alienated from formal politics and institutions, but they are inclined to participate in a range of more direct forms of lifestyle politics and community-based work (Kahne, Crow and Lee, 2013). Indeed, research finds that there have been significant increases in participation in non-electoral forms of politics since the 1970s (Sloam, 2014) 1 . Such extra-parliamentary forms of political participation (Ekman and Amnå, 2012) is what we will focus on in this article, and what we for simplicity call political involvement. We are hence attempting to reflect both the broader ‘civic’ and the narrower ‘political’ activities, and hence capture both participation and perceptions of importance.
The turn from adolescents’ involvement in formal political activity to other forms of involvement has been said to enhance the significance of the role of education in political involvement, as these forms of civic and political involvement are more heavily structured in favour of those choosing a path towards higher education than is the case with involvement in formal politics (Henn and Foard, 2014; Sloam, 2014). Educational pathways have always figured highly on the research agenda of social scientists researching the development of political involvement among youngsters because people's political socialisation, as well as being highly influenced by the social environment in the family, mainly develop during adolescence when they spend a great deal of time in school (Alwin et al., 1991). Moreover, students’ pathways in the education system is important for their level of political involvement throughout most of their lives (Dee, 2004; Mayer, 2011), a finding that is often explained by reference to the socialisation function of schools (Hoskins and Janmaat, 2016) 2 .
Staying together or going separate ways?
The link between students’ own education, their social background and political involvement is not straightforward, and scholars do not agree on whether the educational system intensifies, diminishes or just channels the effect of social background on political involvement. For instance, Persson (2015) argues that the association between schooling and political involvement can be completely explained by the education level of the parents, early socialisation and social network centrality. Hence, self-selection based on pre-adult factors would explain why some people both choose more education and tend to be more engaged in politics. Nevertheless, there are reasons to expect that the way an educational system is organised does affect the social gradient in the development of political involvement. Janmaat and Mons (2011) highlight the role of the degree of pedagogical differentiation in that respect. The more an educational system is internally segregated, the more difficult it is to foster civic attitudes in all students alike. In other words, the internal differentiation of an educational system stands in contrast to the function of education as an instigator of social cohesion and universal citizenship.
The first form of pedagogical differentiation refers to ‘grouping of students by ability and tracking’ (Janmaat and Mons, 2011:57). There are various ways in which educational systems group students by ability (see e.g. Dupriez et al., 2008). Educational systems vary from comprehensive schooling on one side of the spectrum – which means that all students undergo a common curriculum, mostly up to upper secondary education – over setting/streaming – in which students are separated for some subjects – to tracking – which entails that students are separated into distinct educational programs for all subjects. Sociologists have shown that the extent of tracking in an educational system affects social inequality in various outcomes, including achievement (Bol et al., 2014; Dupriez et al., 2008). Several studies have investigated political involvement in relation to the level of tracking. Some scholars have found the differences between tracks to reflect social selection effects (e.g. Hoskins et al., 2016; Persson, 2015), as there are social background differences in political involvement at the same time as students from lower SES groups are more likely to end up in vocational tracks, regardless of ability (Boone and Van Houtte, 2013). If so, tracking differences in political involvement merely reflect social background differences, they do not enlarge them. Other research, however, does find that tracking affects political involvement directly. For instance, education systems with an early tracked curriculum have been found to not only reduce average political involvement, but also to increase inequality in engagement between tracks (Witschge and Van de Werfhorst, 2020). Academic tracks which prepare students for higher education have been shown to increase interest in politics and generalised trust to a greater extent than vocational tracks which prepare for the labour market (Witschge et al., 2019). An explanation of the tracking effect deals with the prestige vocational tracks have in a wider society. Hoskins et al. (2016), for instance, found that the association between track placement and voting intentions was related to the prestige of the vocational tracks. In countries where the prestige of the vocational tracks was lower, social background factors were more closely related to voting intentions. Such findings are congruent with the differentiation–polarisation theory (Van Houtte, 2006), which holds that differentiation of students across differently valued tracks leads to polarisation of attitudes. In short, the theory holds that students in the less valued tracks react against the status deprivation by discrediting the academic school culture, and it is used to explain the anti-school attitudes and behaviour of students in those tracks (Hargreaves, 1967; Lacey, 1970; Van Houtte, 2006). As civic education is part of an academic school culture, lower political involvement might also be a reaction to the status deprivation of students in the vocational tracks (see e.g. Forsberg, 2011). Since students from the lower social strata are more likely to attend these tracks (Boone and Van Houtte, 2013), such processes might enlarge the social inequality in political involvement.
The second form of pedagogical differentiation is constituted of between-school segregation, captured in differences in the social and ethnic composition of schools (Janmaat and Mons, 2011). The composition of a school refers to the general background features of the students that attend the school (Thrupp et al., 2002). These compositions may have effects on various educational outcomes, including achievement (see e.g. Agirdag, 2018; Willms, 2010), school choice (Thys and Van Houtte, 2016) and deviant behaviour (Demanet and Van Houtte, 2011). Previous research holds that the school composition affects political competences and engagement as well (Janmaat, 2022; Van de Werfhorst, 2007). Specifically, political engagement has been found to be lower in schools that serve a disadvantaged population, for instance, in the form of a concentration of children from working-class families or from ethnic minority descent (McFarland and Starmanns, 2009; Sincer et al., 2022; Van de Werfhorst, 2007). Janmaat (2022) explains how these findings might be explained by a ‘social inequality argument’. In short, the argument is that the individual status deprivation disadvantaged youth face is exacerbated by peer group dynamics, in which peers foster an anti-school culture which sets itself against the wider democratic society. As such, the argument is consistent with the differentiation–polarization theory (Hargreaves, 1967; Lacey, 1970; Van Houtte, 2006) developed above, but here it emphasises the status frustration associated with the disadvantage that comes with a lower social background rather than a lower track position. Moreover, we know from previous research that school composition affects students’ opportunity structure, above and beyond their own social status (Agirdag, 2018; Willms, 2010), and that students are aware of this impact (Brookover et al., 1979; Author B). As such, attending a school with a low SES composition or a high concentration of ethnic minorities might in itself engender status deprivation and consequentially a lower political involvement. Given that previous research found school effects to be larger in separation models than in other educational systems, at least on achievement and behavioural outcomes (Demanet and Van Houtte, 2019; Dronkers et al., 2012), we hypothesise these composition effects to be more outspoken on political involvement in such systems as well.
Based on the preceding literature review, we formulate the following hypotheses:
H1: There is an association between social background and the development of political involvement in all studied educational systems.
H2: Tracking exacerbates the association between social background and the development of political involvement, and this association is stronger in separation models.
H3: Between-school segregation exacerbates the association between social background and the development of political involvement, and this association is stronger in separation models.
Context
Following the typology of Mons (2007), three countries have been selected for the comparative study: Norway for the ‘individualised integration’ model, Belgium (Flanders) for the ‘separation model’ and Spain (Catalonia) for the ‘uniform integration model’.
Regarding the structure, schools in Norway are compulsory until the age of 16, and education is a statutory right until the age of 19. After the comprehensive lower secondary education from 13 to 16, pupils have to choose between academic or vocational pathways. In Belgium, schooling is compulsory until the age of 18, but at the age of 14, pupils are subdivided in four different tracks: academic, technical, vocational and arts. These four tracks have differentiated curricula (Houtte et al., 2012), and prepare either for access to higher education or for access to the labour market. In Spain, compulsory schooling is until the age of 16, which corresponds to the end of lower secondary education, with a formally comprehensive curriculum, but with regular use of ability grouping according to performance. This has a direct impact on post-compulsory choices between an academic pathway and a vocational pathway.
In short, the curriculum in all countries is divided when students are sorted into tracks: the curriculum in the academic tracks are more oriented towards higher education, while the curriculum in vocational tracks are more oriented towards the labour market. The curriculum in Norway is however more unified across tracks and regions, based on general subjects and competence, and it is easier to change tracks in all directions than in the other two countries. In both Spain and Belgium, the movement between tracks is almost exclusively from the academic to the vocational tracks.
Regarding school segregation, there are two key variables that explain the different levels: urban segregation and school choice (Boterman et al., 2019). In Bergen, urban segregation is low, and most pupils go to the school close to home, up to upper secondary education. In upper secondary education, the allocation to schools is based on grades and/or geography. In Ghent, school segregation occurs because there is free school choice in a quasi-market educational system (see e.g. Agirdag et al., 2013). In Barcelona, there is a high degree of school segregation, the result of a combination of strong urban segregation and a greater ability for higher income families to choose schools beyond the school district close to home.
Data
The data were collected as part of the ‘International Study of City Youth (ISCY)’, a large-scale international project carried out in 14 cities around the world. For the current study, we used the data from Ghent (Belgium), Barcelona (Spain) and Bergen (Norway) of the baseline survey, carried out in the 2013–2014 school year, and a second time point capturing the end of upper secondary education in those cities. Due to differences in system-level features, the second round was measured in the 12th grade in Barcelona and Ghent (2015–2016 school year – when the students were 17/18 years old), and the 13th grade in Bergen (data of 2016–2017 school year – when the students were 18/19 years old). This is, however, the last year of upper secondary in all three countries and is considered suitable for comparison.
In Ghent, we took a census approach. For the baseline survey (T1), we contacted all 39 secondary schools that offered a 4th secondary school grade in Ghent (the equivalent of the 10th grade in the US, the UK and Australia). Of these, 30 agreed to take part in the study (response rate: 76.92%). Students completed the questionnaire in class, supervised by a member of the research team and a teacher. A total of 2354 students provided valid surveys, which amounts to a response rate of 90.25%. For the follow-up survey (T2), we reached 903 (38.36%) of these students again. As such, for Ghent, attrition between these two waves was quite high, mostly because we did not go to schools again, but contacted students solely by email.
In Barcelona, 2048 students took part in the study in the last year of compulsory school (T1; 10th grade) plus repeaters, which represents a response rate of 91.6%. The sample was obtained from 27 secondary schools, stratified according to ownership (public–private but state funded) and complexity (social composition). In the second wave (T2), the sample was reduced to 1484 students, due to greater attrition among students who leave the educational system.
In Bergen, Norway, for the baseline survey (T1), all the relevant schools were asked to participate, and all the 25 public schools participated. Previous research showed little social segregation between public and private schools in Norway at this level of schooling (Berge and Hyggen, 2011) and leaving the three private schools out is not expected to affect the results to any noteworthy extent. In the schools that were asked to participate, approximately 80.2% of the students in Bergen were present in school and replied to the survey in the presence of a teacher. In the second round (T2), all the students who were in school in the last year of upper secondary school participated in the survey. This leaves out many of the students in vocational tracks in Bergen, as many of those students were in apprenticeships at this point. As we do have a significant share of students from vocational tracks in the last round also in Norway, we have included track placement also in the analyses from Bergen.
After excluding individuals with missing values on the relevant variables, we were left with 709 in Ghent, 713 in Barcelona and 713 in Bergen.
Measures
Outcome
The dependent variable is political involvement, based on the following question: ‘To what extent is it likely that you will do any of the following activities in the future?’. The index consists of five items: ‘Post your views about a political issue on a website’, ‘Do unpaid or voluntary work’, ‘Sign a petition’, ‘Attend a rally or demonstration’ and ‘Join an action group of any kind (e.g. Greenpeace, Amnesty International)’. Respondents could answer on a four-point scale, ranging from ‘Never’ (coded 1) to ‘Definitely’ (coded 4). We did not ask how much the respondents were in fact politically involved, but how much they were likely to be so in the future. As the respondents were relatively young, such a formulation could capture future involvement but could also be less precise than questions involving present action. The index is constructed as the mean of answer scores (but see Table A2 in appendix for mean of all atems). The measures are standardised within countries to allow for meaningful comparison. Cronbach’s alpha is acceptable in all countries, and Wald tests for the measurement of invariance between countries show that the scales can be meaningfully compared.
Independent individual-level variables
The main independent variable was parental education that we used as a proxy of social background 3 . We distinguished between those who have parents with education at the ISCED1 level (lower secondary education), ISCED2 level (upper secondary education) and those who come from families where at least one of the parents has education above the ISCED3 level.
Track was measured as being in a vocational or academic track in the first year of upper secondary coded 1 if the students entered an academic track and 0 otherwise. It should be noted that to make this measure meaningful across all systems, this operationalisation necessarily neglects some of the complexities of the specific systems. For instance, in Ghent (Flanders), students belong to four different tracks (academic, artistic, technical and vocational; see Demanet et al., 2019), which were collapsed into two tracks in the analyses in order to match the structure in the other two countries. Specifically, given the orientation towards higher education, students from the artistic and academic tracks in Ghent were placed under one category and students from the technical and vocational tracks under the other category.
For students’ immigrant background, we considered the country students were born in. All students born in another country than the one in which the survey was administered were regarded as first-generation migrants. We acknowledge that this is a simplification of the concept. However, as immigrant background is not the main topic of the article, and because the immigrant populations across the three cities are quite varied, we have chosen not to differentiate further.
Grade was a variable based on a question about what grades students were expecting to achieve in the same school year 4 . It ranged from 1 (very poor) to 4 (excellent) and has been standardised across all cities to enable better comparison across systems. As students with high grades are expected to be more inclined to enter academic tracks, and to be more involved in schoolwork (including that relevant for political involvement), we considered it a relevant control variable. We also included a variable for gender.
Independent school-level variables
To capture the social background composition of the school, we aggregated the individual-level variable of ‘parental education’ to the school level, by calculating the percentage of students with at least one parent with a ISCED3 degree per school. The mean across all schools in Ghent was 0.689 (SD = 0.229), in Barcelona – it was 0.535 (SD = 0.232) and in Bergen – 0.564 (SD = 0.130).
We captured schools’ immigrant composition in roughly the same way, by calculating the percentage of first-generation immigrant students per school, based on the individual-level data. The mean across schools in Ghent was 0.087 (SD = 0.105), in Barcelona – 0.173 (SD = 0.183), and in Bergen – 0.09 (SD = 0.044) (Table 1).
Univariate characteristics of all variables, separately for the three cities.
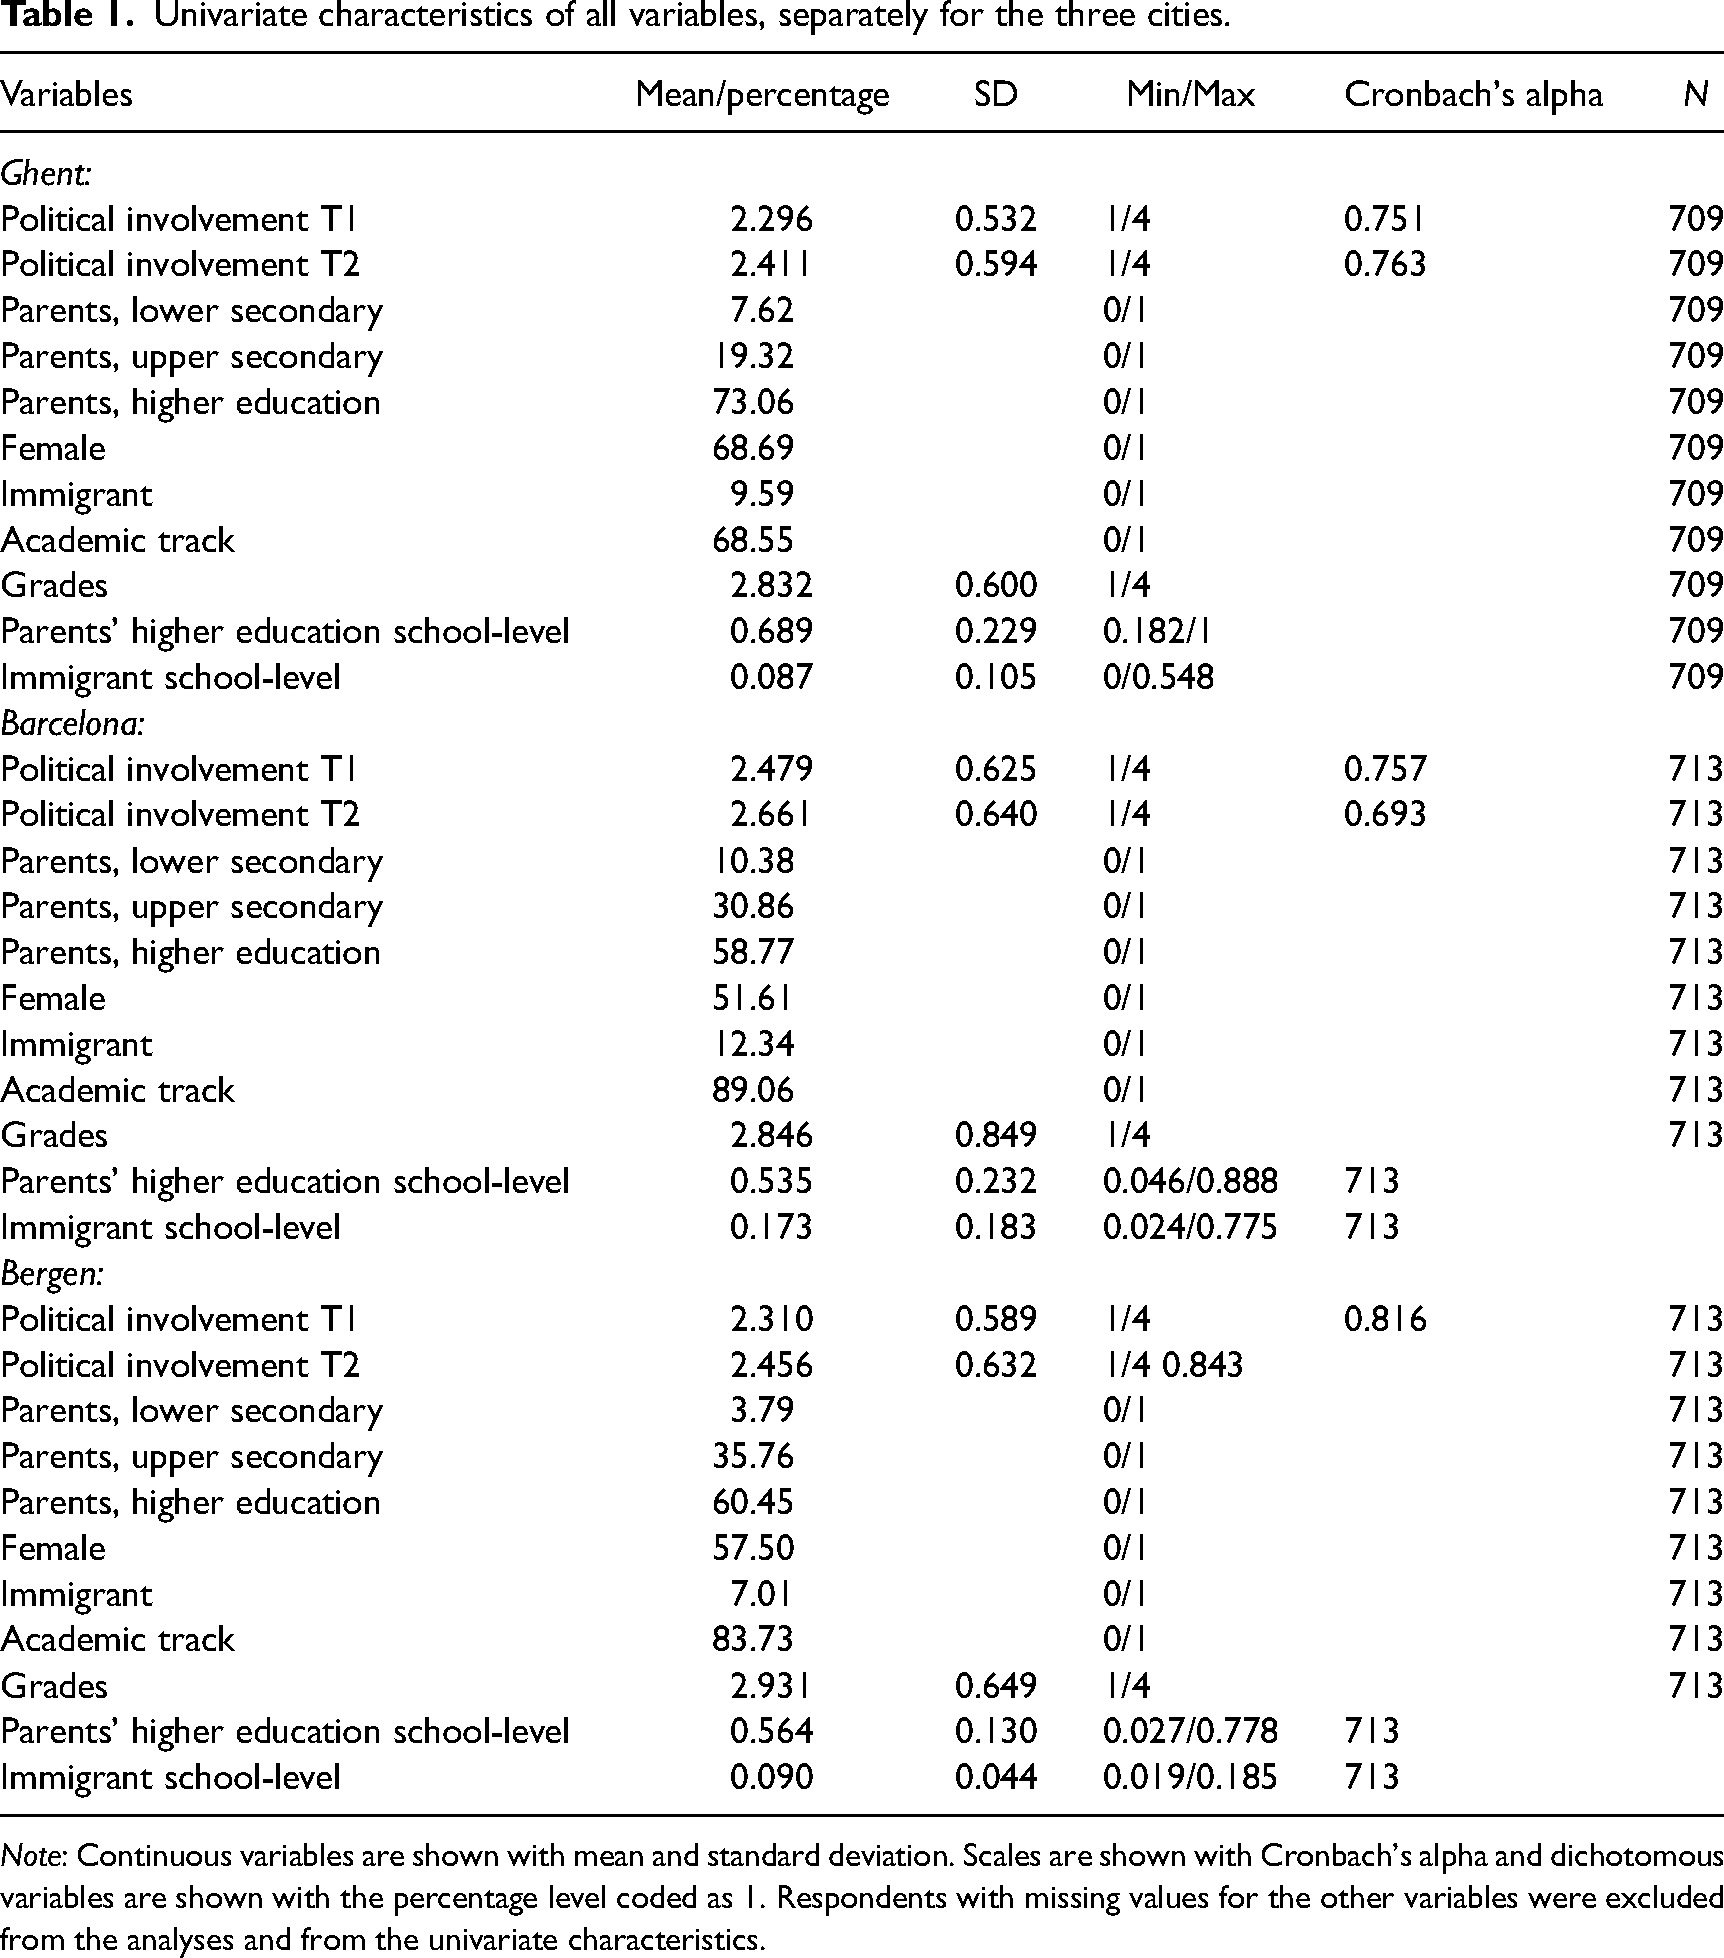
Note: Continuous variables are shown with mean and standard deviation. Scales are shown with Cronbach's alpha and dichotomous variables are shown with the percentage level coded as 1. Respondents with missing values for the other variables were excluded from the analyses and from the univariate characteristics.
Research design
The analysis was conducted in two main steps. First, a multilevel linear regression model was performed within each city at the first time point (T1) to determine how the independent variables were correlated with political involvement, and to compare this with the change between T1 and T2. Since students are sorted into tracks in Ghent at T1, but not in the other two cities, this makes it possible to come closer to an understanding of the impact of tracking in the three cities when comparing the different models. Students (level 1) are sorted into schools (level 2), and a hierarchical model is thus appropriate (Gelman and Hill, 2006).
Second, a multilevel conditional change model was used to ascertain the associations between independent variables and the change between the first and second measurement of political involvement. Political involvement at T2 was here regressed by including political involvement at T1 along with other independent variables in the model (Berrington et al., 2006), what is also referred to as a lagged dependent variable (Wilkins, 2018). Since T1 was assumed to have a causal effect on T2 (those with high levels of political involvement at T1 were also expected to have high levels of political involvement at T2), this approach was preferred over the ‘change score model’ where the difference between T2 and T1 is used as the dependent variable (Allison, 1990). This procedure allowed us to rule out reverse causality and auto-correlation (Wilkins, 2018), but did not allow us to make any causal claims, as we cannot separate between within- and between person change (Hamaker et al., 2015). Variables at individual- and school-level were introduced to investigate their impact on the change between T1 and T2. Due to the limited number of cities, we could not include these as a separate level, and instead did separate analyses for each city while testing the differences between the coefficients of interest 5 . In order to investigate whether the school systems contributed to changes in the link between social background and political involvement, the differences between cities, the impact of parents’ education and the differences between students in different tracks were of particular interest. The aggregated variables at level two were especially interesting to account for segregation. To reduce the risk of spuriousness, we controlled for various measures as well – specifically immigrant status, grades and gender at the individual level. In the analysis, all continuous variables were mean-centred within each city, as recommended in multilevel analysis when a level-1 variable is of primary interest (Enders and Tofighi, 2007), and the dependent variable was standardised to make comparison between cities easier. Attrition weights were used as the attrition between T1 and T2 and were not assumed to be random (see also the Data section above) – many predictors were indeed correlated with attrition when tested (Baulch and Quisumbing 2011). We used a stepwise approach in the analyses to be able to investigate how the different variables were related to each other, for example, how social background works indirectly through other variables (track, grades, etc.).
Two aspects should be kept in mind while interpreting our results. First, the findings from Bergen suffer from selective dropout from the sample, as the students who have apprenticeships at T2 were left out of the study. Even if attrition weights are included, problems of a selective sample make it important to interpret the findings with caution. Second, because we show three separate models, the Bonferroni calculations suggest a more conservative interpretation of significance, where only coefficients significant at a 0.0167 level meets the necessary standards.
Results
Table 2 shows the separate results for Ghent, first in a multilevel OLS model at T1, and second in a multilevel conditional change model 6 , investigating the change between T1 and T2. In model 1, we find that having parents with a higher level of education is clearly associated with a higher level of political involvement. However, when controlling for other variables in model 2, parental education is no longer significant, while track attended and grades are. Hence, those with parents with higher education that have a higher level of political involvement are also those who achieve higher grades and attend academic tracks. In the multilevel conditional change model, in model 3, parental education is not significantly related to the increase in political involvement, while track attended is. Hence, the track students attend is important for the level of increase of political involvement, while the students are in school, as suggested in Table 2, the increase is significantly larger for students in the academic tracks. In model 5, an interaction term between the parental education level and the track attended is introduced, showing a negative and significant effect. The fact that the interaction term is negative implies that the track attended is especially important for those with a low social background. Separate analyses show that significant coefficients for being in the academic tracks are only present for those with a low social background (not shown). The share of students with immigrant background at a school is negatively related to the increase in political involvement, suggesting that the increase in political involvement is smaller among students in schools with a larger share of immigrant students (Table 3).
Multilevel OLS model (1 and 2) and multilevel conditional change score model (3–5), Ghent.
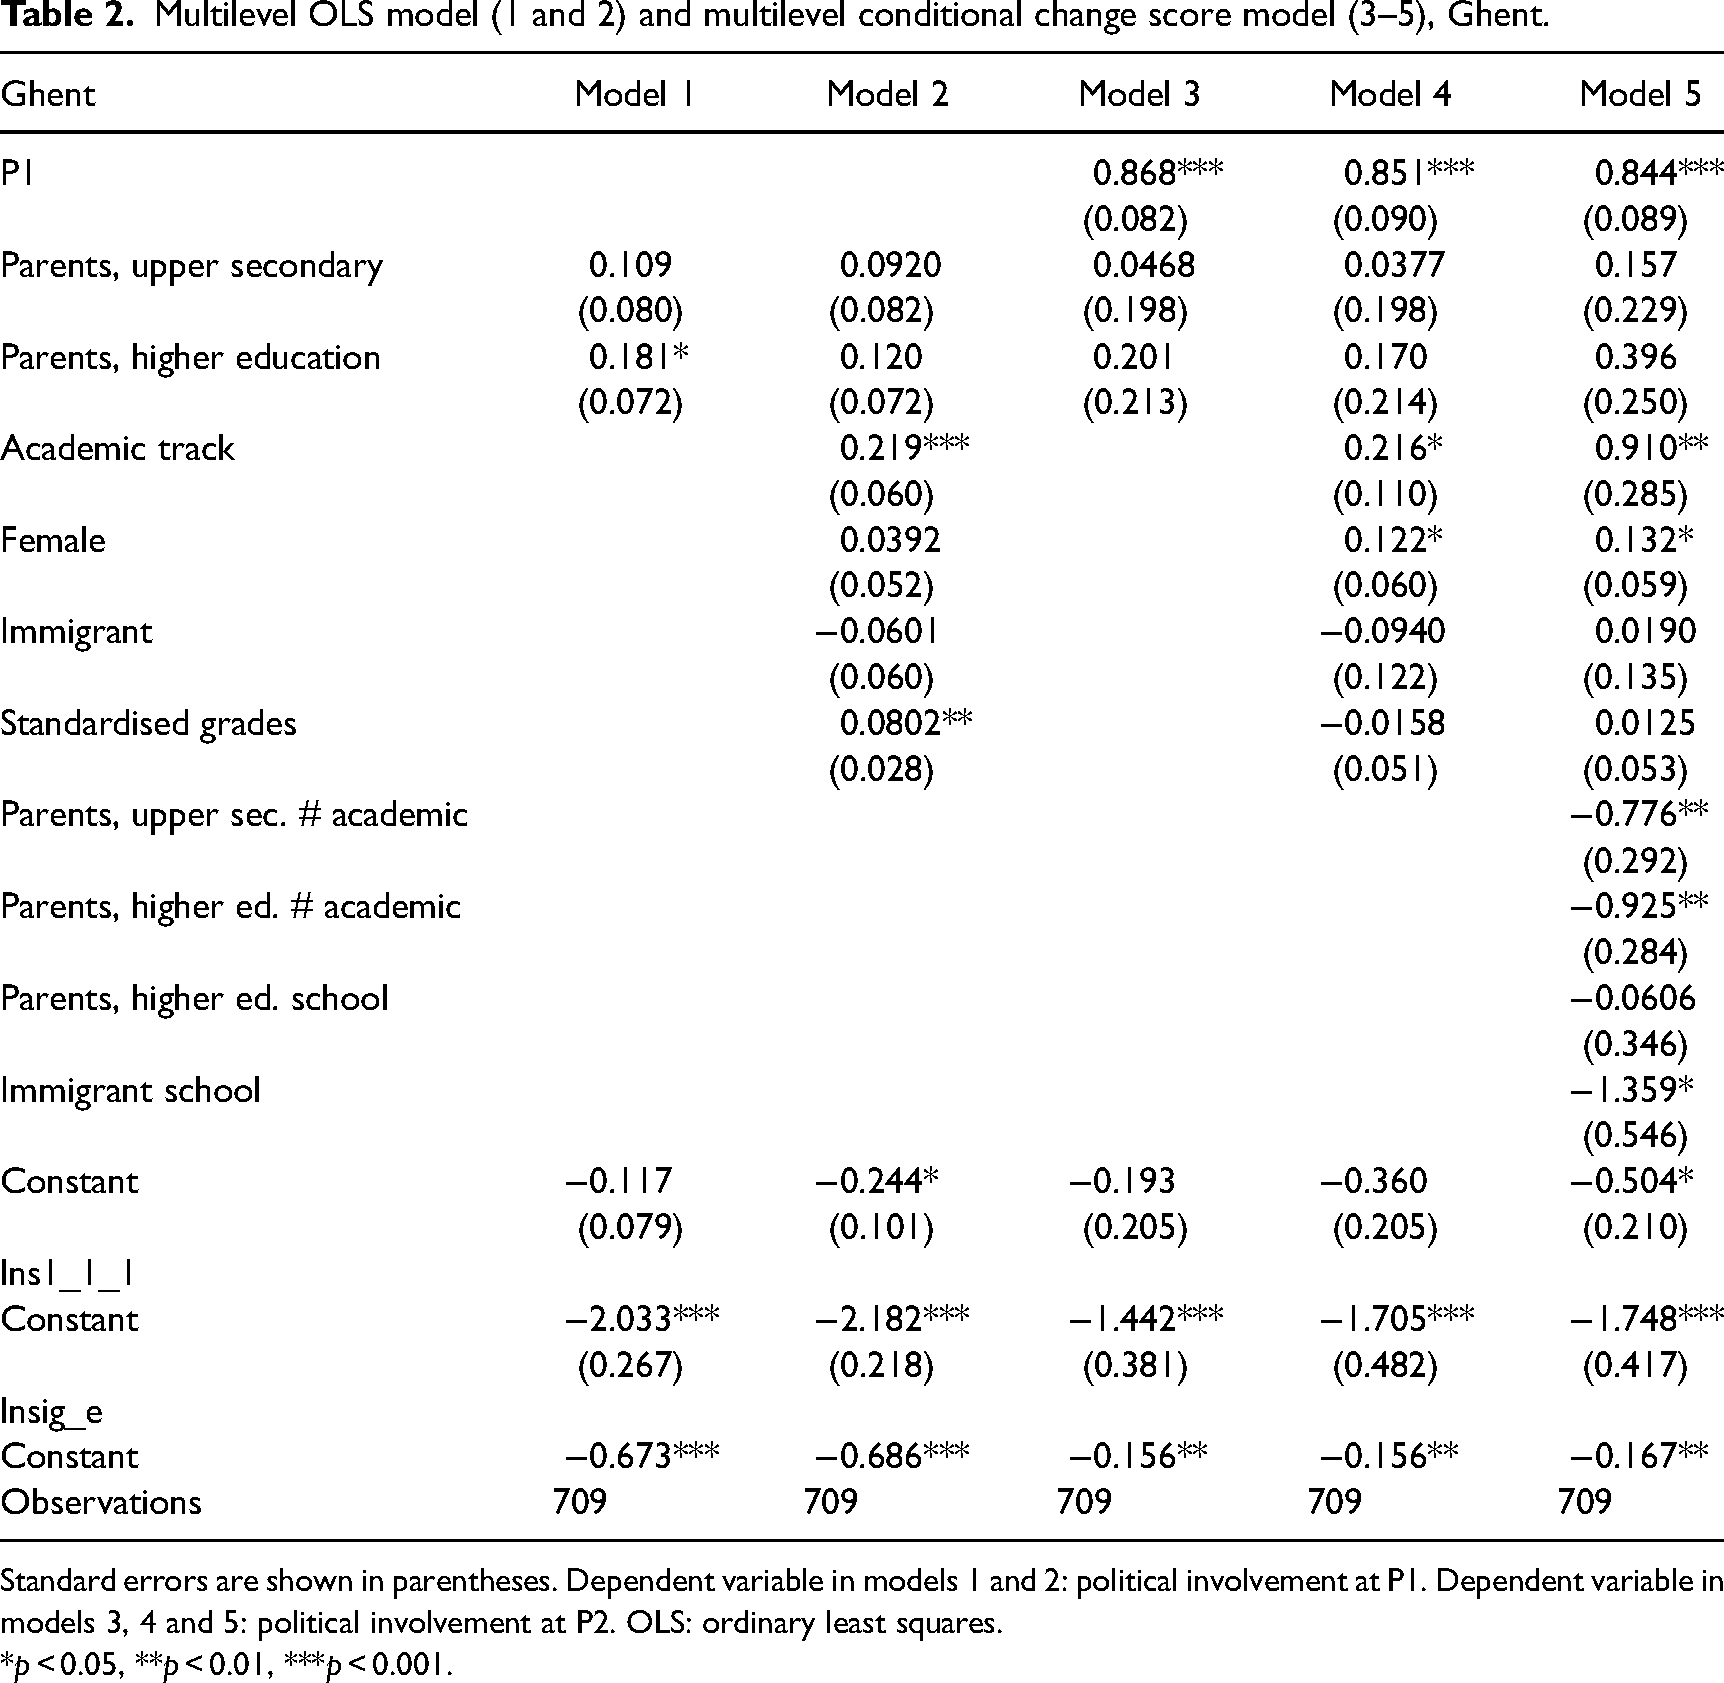
Standard errors are shown in parentheses. Dependent variable in models 1 and 2: political involvement at P1. Dependent variable in models 3, 4 and 5: political involvement at P2. OLS: ordinary least squares.
*p < 0.05, **p < 0.01, ***p < 0.001.
Multilevel OLS model (1 and 2) and multilevel conditional change score model (3–5), Barcelona.
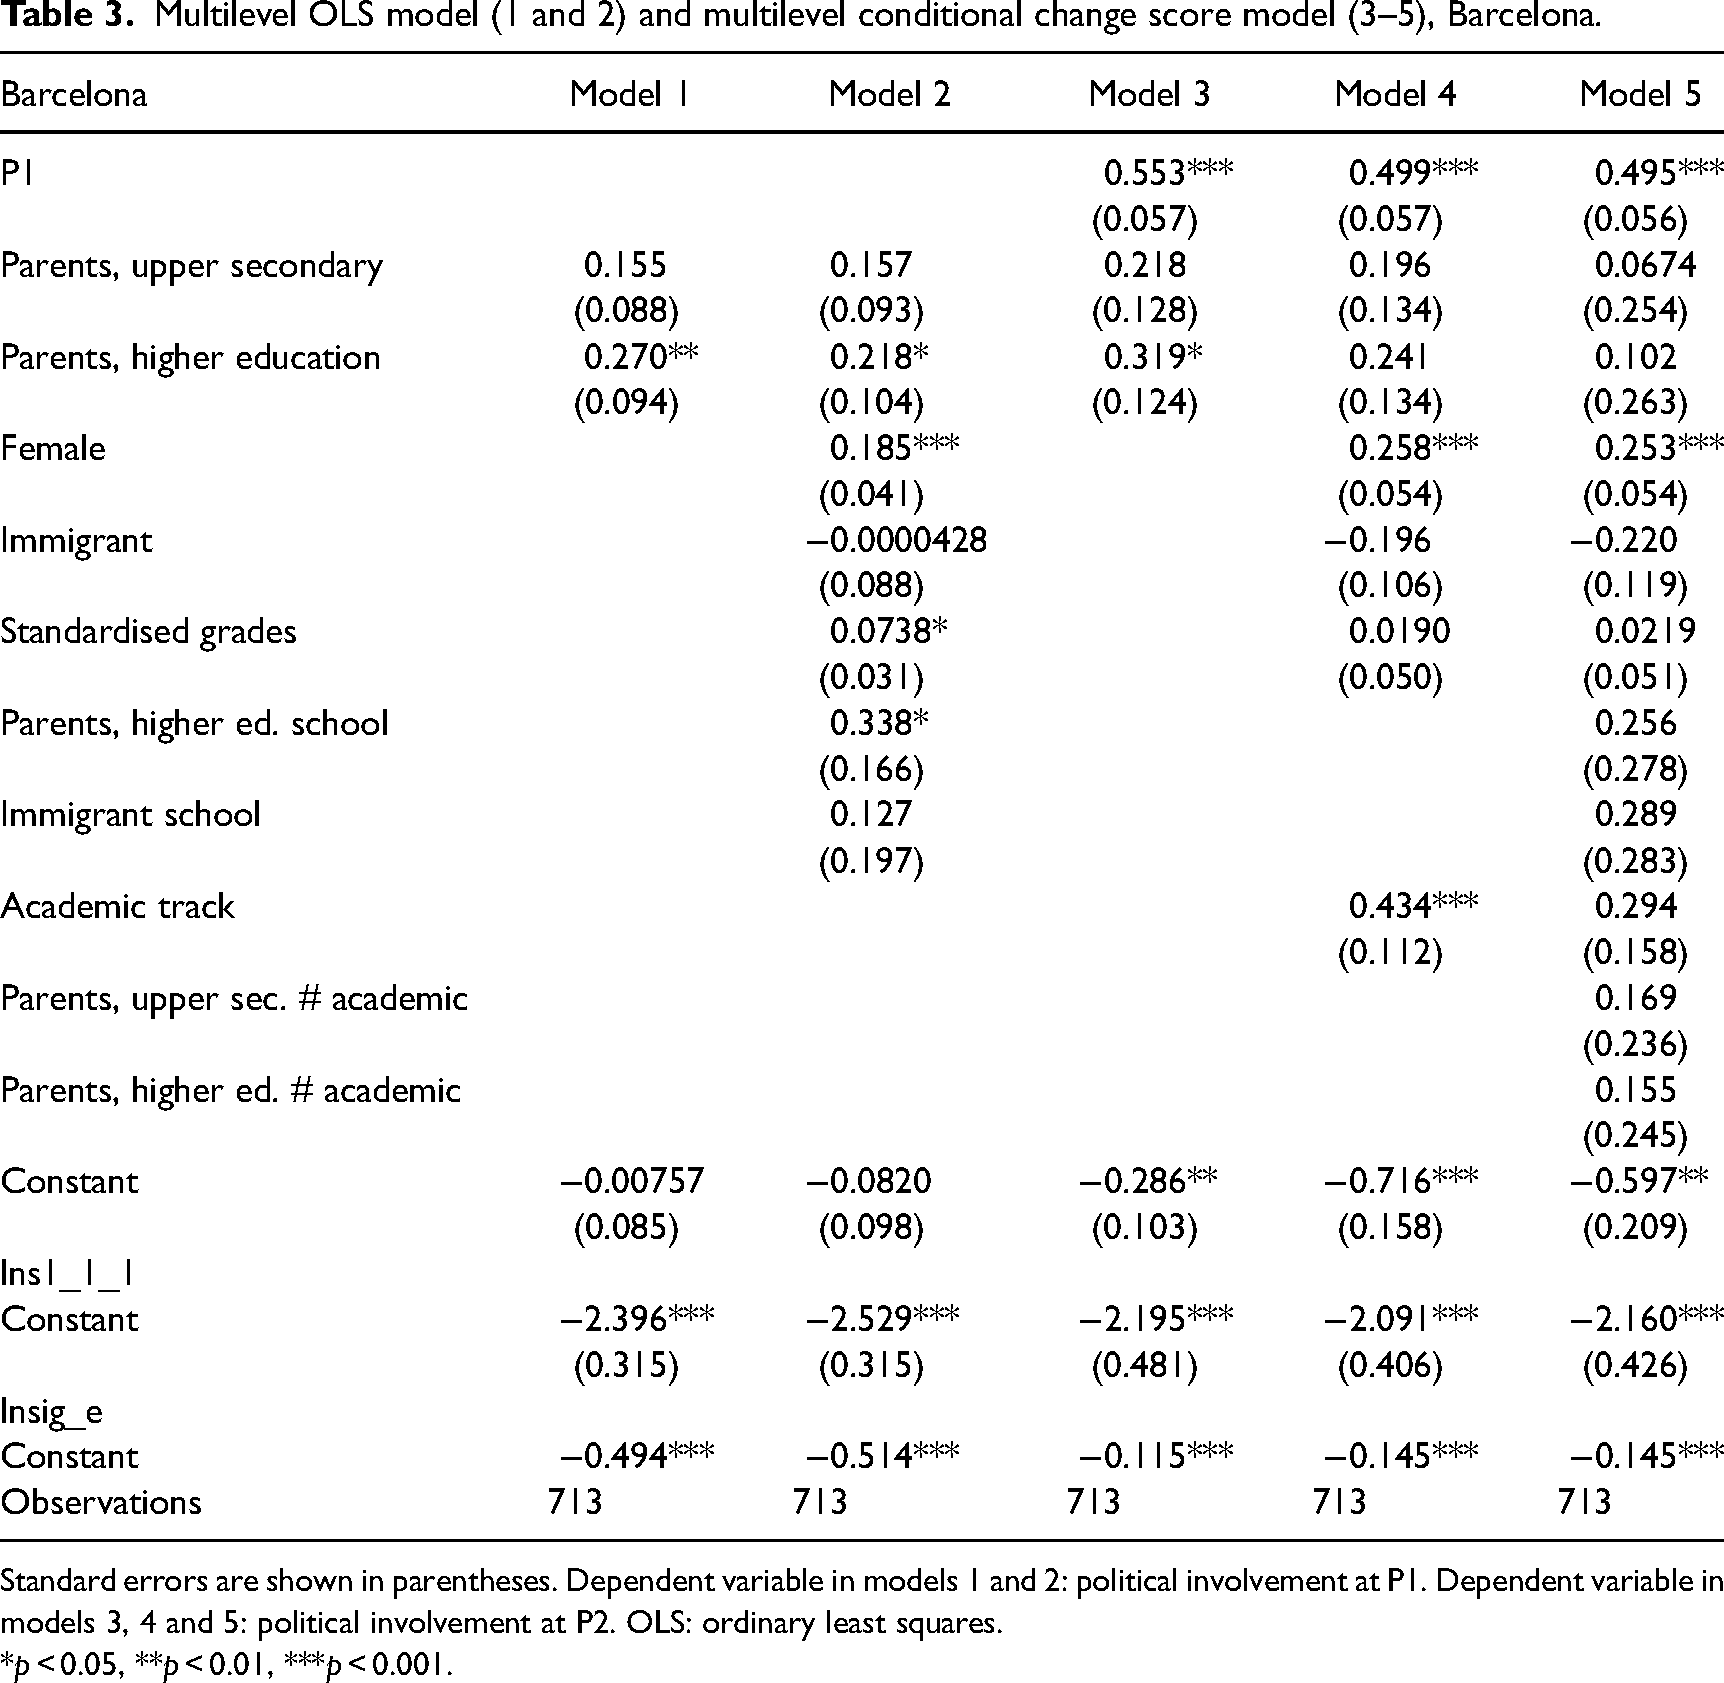
Standard errors are shown in parentheses. Dependent variable in models 1 and 2: political involvement at P1. Dependent variable in models 3, 4 and 5: political involvement at P2. OLS: ordinary least squares.
*p < 0.05, **p < 0.01, ***p < 0.001.
Turning to Barcelona, the multilevel OLS models 1 and 2 show that parents’ education level is important and significant for the level of political involvement at T1, also when grades and other background variables are controlled for. Since the students are not sorted into tracks in Barcelona at this point, track attended is not controlled for. In models 3 and 4, however, when we investigated the change in political involvement between T1 and T2, we saw that the change in political involvement positively associated with parents’ educational level (model 3) could be explained by the fact that these students entered different tracks (model 4). The coefficient for political involvement measured at T1 is also substantially lower than that in Ghent, showing a larger overall increase in Barcelona than in the other cities (see also Appendix 2). The interaction-term between parents’ education and track attended is not significant in the multilevel conditional change models, suggesting that when the students are sorted into tracks, the increase within the track is not dependent on social background. The school-level variables included in model 3 are not significant, suggesting that, in Barcelona, the social composition of schools is not important for the development of political involvement when the other variables are accounted for, as shown in Table 4.
Multilevel OLS model (1 and 2) and multilevel conditional change score model (3–5), Bergen.
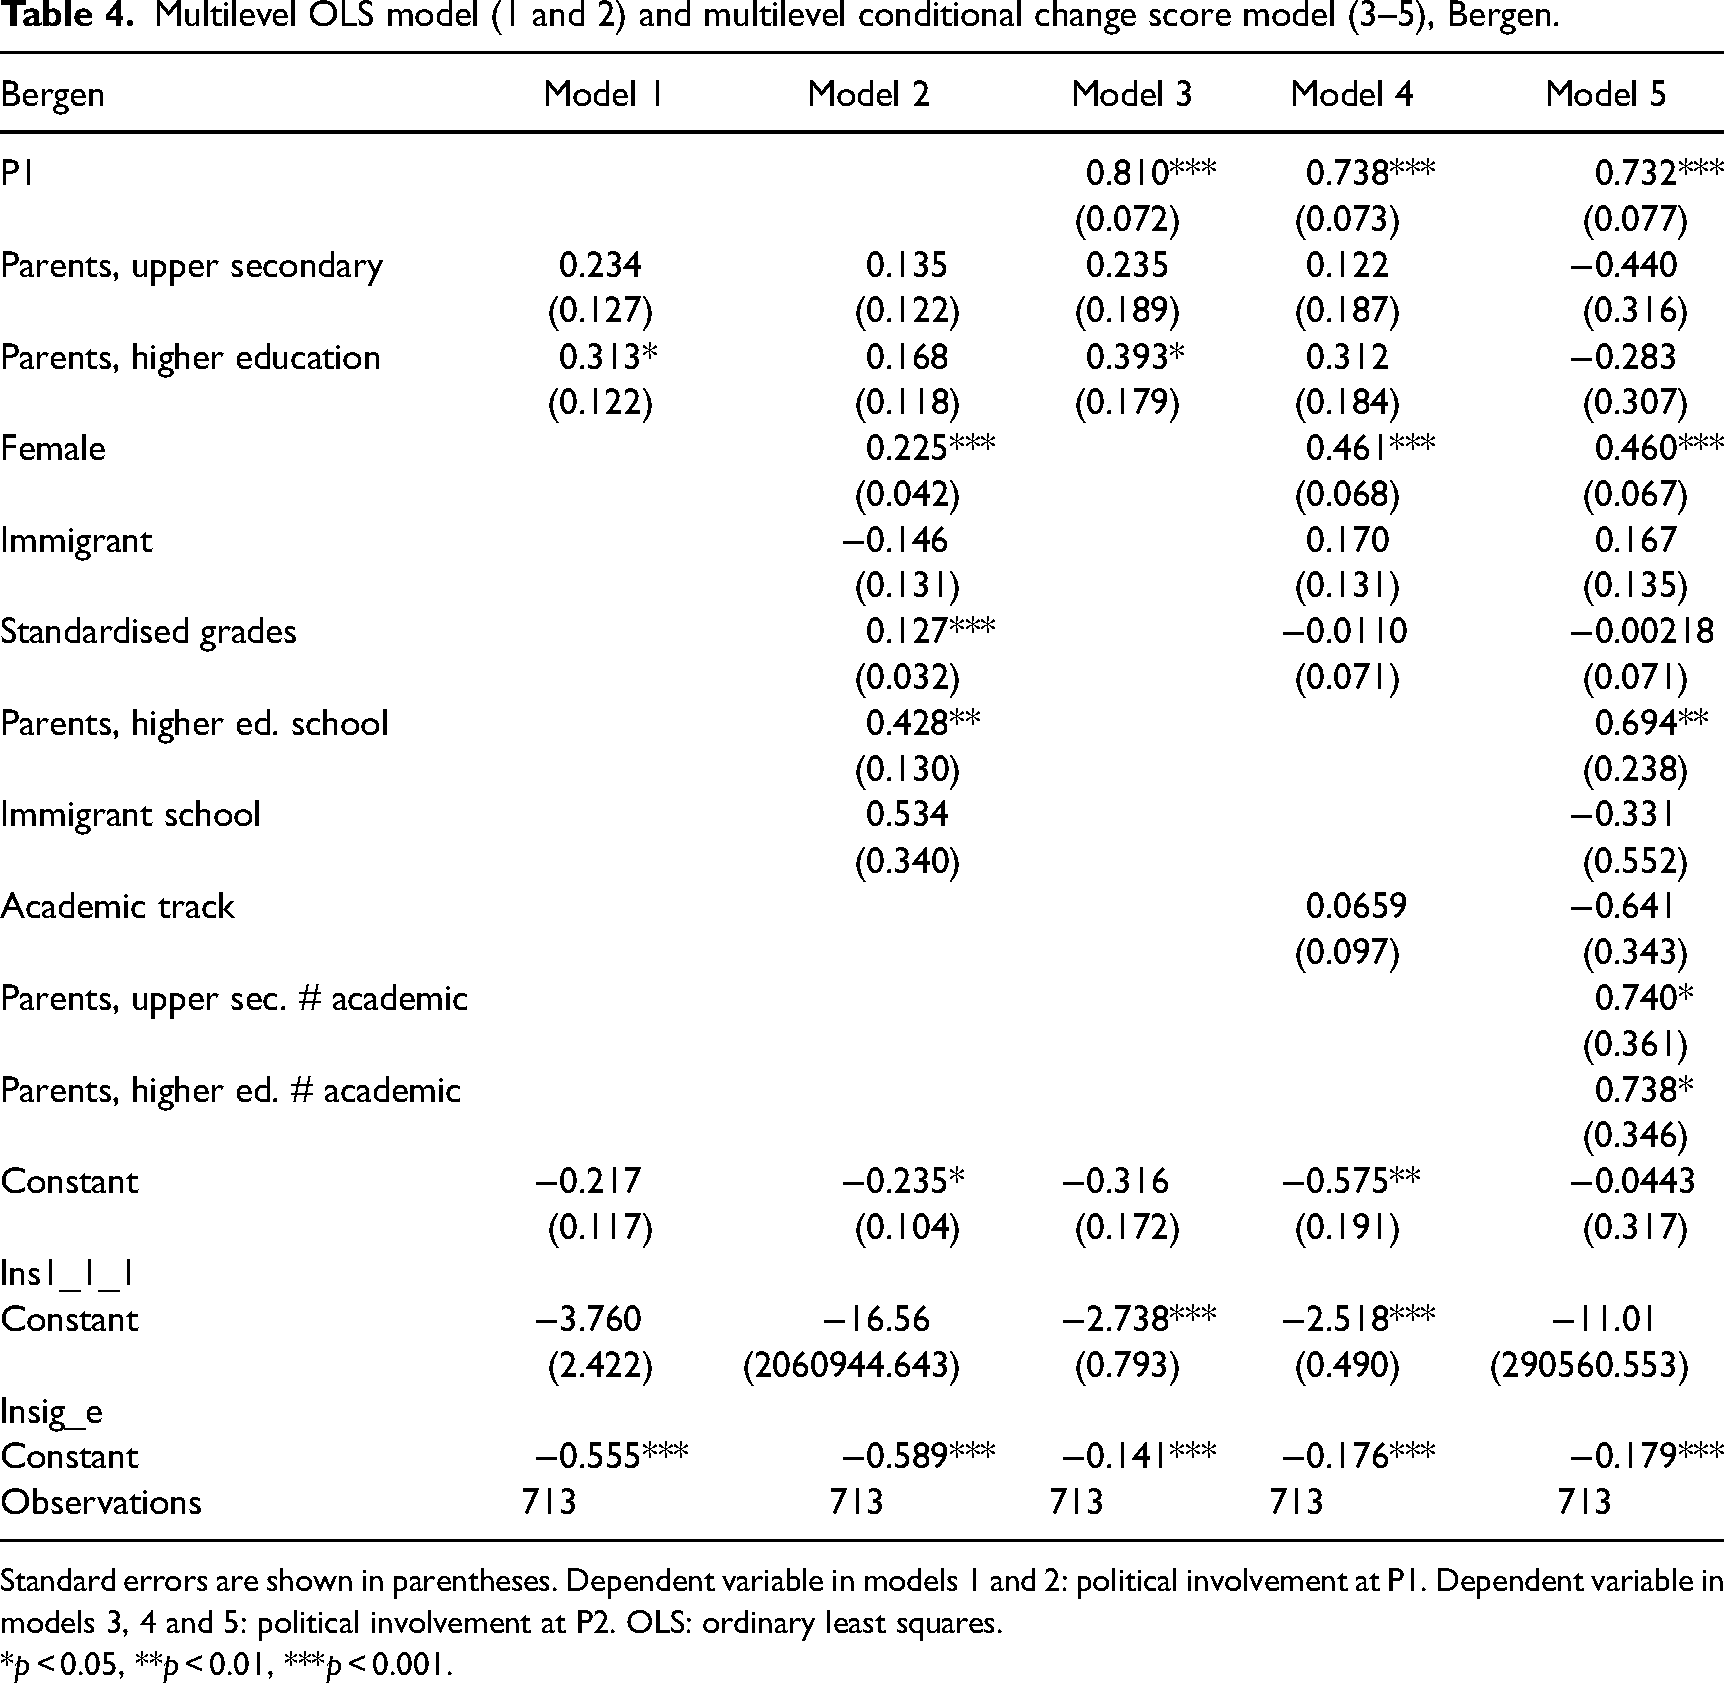
Standard errors are shown in parentheses. Dependent variable in models 1 and 2: political involvement at P1. Dependent variable in models 3, 4 and 5: political involvement at P2. OLS: ordinary least squares.
*p < 0.05, **p < 0.01, ***p < 0.001.
In Bergen, the level of political involvement at T1 is positively correlated with having parents with higher education in model 1. However, when the other variables are introduced in model 2, this is no longer significant, while grades, being female and the share of students with higher educated parents in a school are. Upon investigating the change in political involvement between T1 and T2 in models 3, 4, and 5, it was seen that the results were different from the other two cities in the track attended; this was not important for the level of increase. Parental education is significant and positive in model 3, but loses its significance in model 4. The share of parents with higher education is positively associated with the increase in political involvement in model 5, but with intra-class correlation (ICC) as low as 2%, this should be interpreted with caution. A positive and significant interaction term between parents’ education level and attending the academic track suggests the opposite tendency as in Ghent – attending the academic track is to a larger degree related to an increase in political involvement among those with a higher social background than among those with a lower social background. Separate analyses show that parents’ education is only significantly positive for those in the academic tracks. As attrition from the vocational tracks is substantial because of the students in apprenticeships not being part of the sample in T2, all results concerning tracks should be considered with caution in the Bergen sample, however.
Discussion
In this article, we investigate the change in political involvement in the later years of secondary education. With unique longitudinal and comparative data and a multilevel change score model, we were able to examine the increase in political involvement that happened while the students were in school, and to pinpoint some important differences between the three systems.
Our results were only partly in alignment with the hypotheses. First, we expected social background to be associated with the change in political involvement in all three cities, but did not find this to be significant in Ghent. As social background was correlated with the level of political involvement at T1 also in Ghent; however, it is possible that measuring before and after tracking in Ghent as in the other two cities would have captured similar (and perhaps even stronger) tendencies. Moreover, even if the social gradient in the increase in political involvement seemed to be lower and insignificant in Ghent than in the other two cities, a full model including all countries showed no significant differences between the three cities in this respect (see Appendix 1).
Tracking was in all systems related to the impacts of social background, but in somewhat different ways. The social selection into tracks in Ghent can contribute to exacerbate social differences in the development in political involvement because attending the academic tracks seem to work in equalising ways. Specifically, academic track students with a low social background have a larger increase in political involvement than their counterparts with a higher social background. In Barcelona, track placement seemed to be a mediating factor between parents’ education and political involvement – when track placement was controlled for, parents’ education level was no longer significant, and the interaction term was insignificant. Hence, when comparing pupils in similar tracks, parental education was not important for the increase in political involvement. This aligns with the suggestion that differences are merely a reflection of the sociocultural status and its relationship to placement in tracks (Persson, 2015). In Bergen, tracking had little influence. However, the increase was larger among those with a higher social background in academic tracks, something that can be said to exacerbate social differences. Findings in both Ghent and Barcelona substantiate research showing that academic tracks increase interest in politics and generalised trust more than vocational tracks (Witschge, Rözer and Van de Werfhorst, 2019), which is congruent with the hypotheses based on the differentiation–polarisation theory (Van Houtte, 2006) and corroborates previous research arguing that differences between tracks contribute to widening gaps in participation, because students from lower social backgrounds more often attend the vocational tracks than the academic tracks, and therefore also spend fewer years in education (Hoskins and Janmaat, 2016).
As for the role of between-school segregation, the second indicator of pedagogical differentiation (Janmaat and Mons, 2011), the between-school difference was the largest in Ghent, as hypothesised. In Ghent, moreover, the share of immigrant students at schools was negatively associated with the increase in political involvement. In Bergen, the share of parents with higher education was positively associated with the increase in political involvement, but with intra-class correlation (ICC) as low as 2%, it is not necessarily a trustworthy result. That the schools’ immigrant composition was important for the development of political involvement only in Ghent, point to the effect of segregation between schools. This indicates another reinforcement of social disparities, this time for immigrant youth, who show a lower increase in political involvement if they attend a school with a larger share of other immigrant young students. As such, our findings endorse the social inequality argument (Janmaat, 2022), which holds that disadvantaged contexts give rise to a lower development of political engagement.
Limitations, political circumstances and further research
Even if our design allows us to limit the chance of reverse causality and spurious findings, we cannot be sure that more general national time-variant differences, such as economic and political conditions, do not drive parts of the cross-national differences we found. Since the financial crisis in 2008, differences in political trust between regions in Europe have widened. While in Western and Northern Europe the level of political trust recovered fast after a quick drop and remained stable after that, Southern Europe has shown a durable decline (Haugsgjerd, 2018). Research from Norway shows an increase in political involvement and voting among youth in the most recent years, suggestively explained by the political terror attack against young people in 2011 (Ødegård and Fladmoe, 2017). In Spain, the Indignados movement of 2011 marked a significant increase in the mobilisation of young people, particularly in new forms of participation, although there was also an increase in traditional politicisation, with an increase in voting as a result of this movement (Martínez and Juan, 2020; Perugorrìa and Montaña, 2014). This is difficult to control for with our data, but should be kept in mind when interpreting the findings. Hence, we are careful with policy implications, as we cannot distinguish between treatment effects and other differential changes over time (Allison, 1990). Moreover, we cannot separate the within and between person change with this design, as highlighted in Hamaker's critique of similar models (Hamaker et al., 2015). As we only have the dependent variable varying in all countries, however, a person-fixed design is not possible. Lastly, various problems with our samples can be problematic for our analyses – the fact that we lose many students in apprenticeships in Norway in the last round is, for example, a shortcoming that should make us vigilant while drawing conclusions. We still believe our findings add to the existing research in highlighting the importance of comparing different school-systems over time to understand how social inequality is connected to the development of political involvement among the youth.
Footnotes
Funding
The authors disclosed receipt of the following financial support for the research, authorship, and/or publication of this article: This work was supported by the Norges Forskningsråd (grant number: 315389).
Notes
Author biographies
Appendix
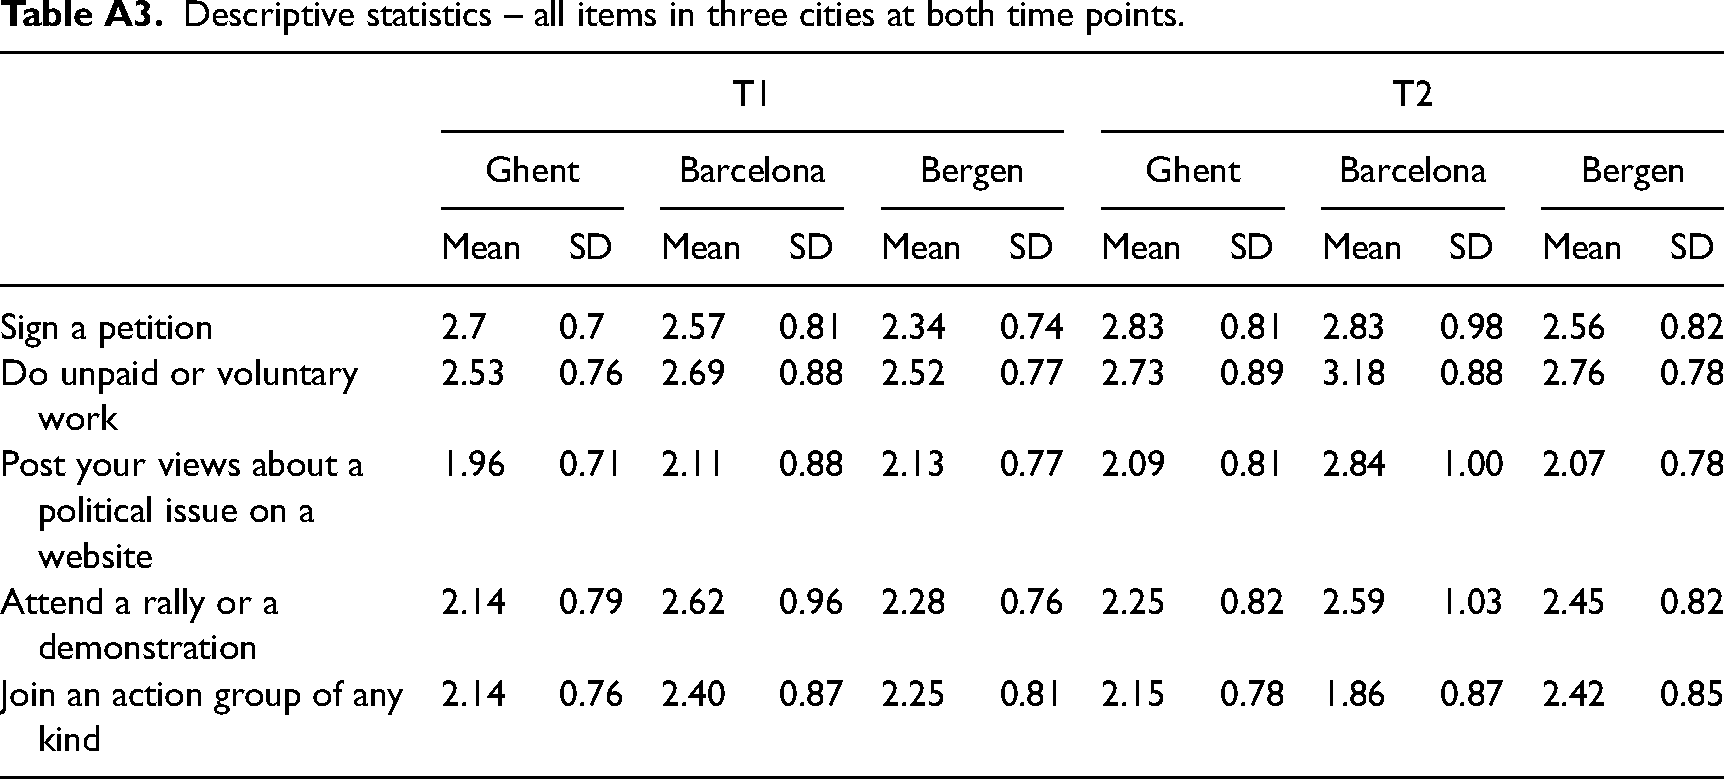
Descriptive statistics – all items in three cities at both time points.
| T1 | T2 | |||||||||||
|---|---|---|---|---|---|---|---|---|---|---|---|---|
| Ghent | Barcelona | Bergen | Ghent | Barcelona | Bergen | |||||||
| Mean | SD | Mean | SD | Mean | SD | Mean | SD | Mean | SD | Mean | SD | |
| Sign a petition | 2.7 | 0.7 | 2.57 | 0.81 | 2.34 | 0.74 | 2.83 | 0.81 | 2.83 | 0.98 | 2.56 | 0.82 |
| Do unpaid or voluntary work | 2.53 | 0.76 | 2.69 | 0.88 | 2.52 | 0.77 | 2.73 | 0.89 | 3.18 | 0.88 | 2.76 | 0.78 |
| Post your views about a political issue on a website | 1.96 | 0.71 | 2.11 | 0.88 | 2.13 | 0.77 | 2.09 | 0.81 | 2.84 | 1.00 | 2.07 | 0.78 |
| Attend a rally or a demonstration | 2.14 | 0.79 | 2.62 | 0.96 | 2.28 | 0.76 | 2.25 | 0.82 | 2.59 | 1.03 | 2.45 | 0.82 |
| Join an action group of any kind | 2.14 | 0.76 | 2.40 | 0.87 | 2.25 | 0.81 | 2.15 | 0.78 | 1.86 | 0.87 | 2.42 | 0.85 |