
Abstract
In many European countries, a growing share of population with immigrant background coincides with the surge in support for radical right parties. In this paper we show how such increases affect radical right candidacy. We use Swedish register data which identifies political candidates. With geocoded data, we match individuals running for the Sweden Democrats to their local neighbourhood contexts, and measure changes in the share of visible minority residents at scales ranging from 100 meters to 2 kilometres. For those who stayed in the same neighbourhood between 2006 and 2010, the change in the share of visible minorities generally does not affect the decision to join the pool of party candidates. This result is robust when we introduce additional tests and select on the scale of the neighbourhood, unemployment terciles, change in share of visible minority groups terciles, and entry threshold into the pool of candidates. For those who stayed in the same neighbourhood, the only significant finding is a small mobilisation effect for a subsample of individuals who live in densely populated metropolitan neighbourhoods – here we also observe a halo effect, with negative association for small-scale changes and positive association for changes in the larger halo zone.
Keywords
Opposition to diversity and multiculturalism are at the heart of radical right wing populism. Parties belonging to this political family tend to oppose immigration and they discuss diversity in terms of threats to ethno-national identity, competition in the labour market or increased criminality (Rydgren, 2007; Rydgren, 2018). Opposition to immigration is a key factor predicting support for radical right wing parties. However, it remains an open question how the neighbourhood context affects political behaviour and, more broadly, whether negative attitudes towards immigration are rooted in the actual experience of diversity. This paper seeks to add to the debate by looking at how local increases in the share of visible minorities affect mobilisation for joining the pool of candidates for the Sweden Democrats.
Sociological theory on reactions to increasing share of minority group residents points in two different directions. On one hand, responsiveness to demographic changes is the hallmark of a group threat response (Blalock, 1967; Hopkins, 2010) and therefore we would expect an elevated propensity of political mobilisation, in this case the decision to run for a right wing populist party. Swedish majority residents living in areas with growing share of visible minorities constitute an important target for radical right wing parties. On the other hand, contact theory predicts that living in areas with increasing share of minority group residents provides more opportunities to form inter-group social ties that help alleviate anti-immigrant sentiments (Allport, 1958; Thomsen, 2012). Because geographic proximity fosters social interaction, the expectation is that Swedish majority residents in neighbourhoods with growing share of minority group residents show less support for radical right wing parties.
We contribute to research in this field in three regards. First, using micro-data from Sweden, we present the first study of the relationship between local experience of demographic change associated with immigration and mobilisation to run for a political office as a radical right party candidate. Second, we go beyond aggregated or cross-sectional analyses as the longitudinal register data allow us to estimate fixed effect models that address common issues in this type of analysis. Third, the data we use circumvent problems with social desirability bias encountered in studies of radical right wing populist support by analysing actual political behaviour rather than stated preferences.
What do we find?
We focus on a narrowly defined question: how do changes in the share of visible minority residents, defined as the 1st and 2nd generation migrants with non-Western background, affect the individual propensity to run as a candidate for the Sweden Democrats. We estimate the effects of changes in the local share of minority group residents on political candidacy by exploiting the longitudinal nature of the register data and using fixed effect models to examine the differences in both measures between 2006 and 2010. The models show little support for the notion that (changes in) the share of visible minority residents affects (changes in) the likelihood of entering the pool of candidates for the Sweden Democrats between 2006 and 2010. This null result persists at all neighbourhood scales, ranging from 100 by 100 meters to 2 by 2 kilometres.
For those who stayed in the same neighbourhood between 2006 and 2010, the only statistically significant result that we observe is for a subsample of individuals who live in densely populated metropolitan neighbourhoods and for the halo effects in the subsample of metropolitan neighbourhoods, but the effect sizes are consistently unsubstantial. For example, consider that the effect of a change in visible minority residents from 0% to a 100% would only increase the likelihood of running for the Sweden Democrats by 0.01 percentage points. 1 In line with previous findings, we also observe a halo effect where the change in visible minority residents is associated with a lower likelihood of running for the Sweden Democrats, yet changes in the halo zone is associated with increased likelihood of entry. While this finding underscores the importance of accounting for spatial distribution when researching contextual effects, our effect sizes remains miniscule, regardless of their significance.
Literature review
Group threat
Group treat is a collective process arising from challenges to the dominant position of the majority group. In its classical formation, members of the majority group develop hostility towards the minority group because of actual or perceived competition over limited resources such as employment, housing or political influence (Blalock, 1967). Recently, Green et al. (2016) have shown that in Switzerland threat perception is associated with local share of stigmatised minorities. The authors report that respondents with more local exposure to Yugoslav and Albanian migrants expressed higher levels of anti-immigrant sentiments, which in turn predicted support for Swiss People's Party. Such threat reaction may depend on the choice of groups and is most salient regarding the presence of stigmatised groups and groups associated with symbolic threat. Ford and Goodwin (2010) report that white Britons were more likely to vote for the radical right wing British National Party in constituencies with higher share of Muslims but less likely where there was a large share of Black Caribbean residents. Similar observations have been reported in the US where presence of large Hispanic population is associated with demographic threat to a greater extent than other minority groups (Ha, 2010). Studies have used different measures of group threat, looking at increases in share as well as growth in size of the minority group. The so-called “salience of change” or “fear of small numbers” hypotheses emphasise that sudden changes in local immigrant populations are more likely to capture the attention than the size of these populations. Support for this notion is found in cross-sectional studies of radical right wing support (Charitopoulou and García-Manglano, 2018; Kaufmann, 2017; Patana, 2020).
Inter-group contact
Contrasting group threat theory, contact theory asserts that interpersonal contact limits prejudice by providing opportunities for meaningful interactions with members of different groups. This theory originated in studies focusing on large decline in prejudice observed among white American soldiers who severed together with African Americans. The reduction of prejudice towards minorities resulting from contact has since been reported in several experimental studies (for a recent example, see Finseraas et al., 2019) but it is not clear whether the same mechanisms apply for co-residents in a neighbourhood. In the original formulation of contact theory, contact should take place between equal partners and be set in a non-competitive environment and be centred on common goals and supported by authorities or the state (Allport, 1958). Yet, in a widely cited meta-analysis on empirical evidence for the contact hypothesis, Pettigrew and Tropp (2006) found that while contact is especially effective in reducing prejudice when it fulfils Allport's criteria, even unstructured contact limits prejudice. Hence, we expect that in areas where the share of visible minority residents increases, the propensity of residents to stand as Sweden Democrats candidates would be lower. Alternatively, lower propensity to enter the pool of radical right wing party candidates could reflect conflict avoidance. Unlike voting, candidacy is a public act and for radical right parties therecould be an additional barrier to enter the pool of party candidates (Art, 2011).
Previous studies
Earlier research on the effects of demographic change on radical right support and mobilisation tended to report a positive relationship between immigration and support for the radical right, either in terms of electoral outcomes or party membership (Biggs and Knauss, 2012; Coffé et al., 2007; Goodwin et al., 2013; Kestilä and Söderlund, 2007; Knigge, 1998; Lubbers et al., 2002; Rydgren and Ruth, 2011, 2013; Swank and Betz, 2003). What do we know about the ways in which contextual factors influence people to engage with radical right politics? Party activists tend to perceive immigration at the national level as a pivotal issue. For example, candidates for the Sweden Democrats differ from other candidates in that they have a much stronger opinion on immigration and perceive immigration as the single most important issue facing the country (Erlingsson et al., 2014). It is unclear, however, if this concern is rooted in a direct experience or proximity to minority group residents in the local neighbourhoods. Studies of a leaked membership list of British National Party show that membership in such parties is lower when there is a substantial proportion of visible minorities at small geographic scales, but that it increases for cities with larger shares of visible minorities, especially when minority residents live apart from the majority group (Biggs and Knauss, 2012). Similarly, activism increases with proximity to groups that enhance perception of threat, notably Muslims (Goodwin et al., 2013). In the Swedish context, Art (2011) noted that the Sweden Democrats have been particularly active in Skåne, a region in Southern Sweden that did not experience a large influx of immigrants but was in proximity to a diverse Malmö.
Given this larger literature on radical right wing electoral support, we now turn to studies linking contextual factors with electoral outcomes. Following this body of research, a number of micro-level studies emerged that combined individual level information with contextual information at the national, regional or neighbourhood level (Arzheimer, 2009; de Blok and van der Meer, 2018; Ford and Goodwin, 2010; Van Gent et al., 2014; Green et al., 2016; Kessler and Freeman, 2005; Lubbers et al., 2002; Lubbers and Scheepers, 2000, 2001, 2002; Lucassen and Lubbers, 2012; Norris, 2005; Rink et al., 2009; Rydgren, 2008; Savelkoul et al., 2017). The findings from these studies are nuanced, with contextual effects largely depending on the scale and the types of groups investigated. In general, the tentative pattern emerges that studies based on larger geographical scales capture threat and those based on smaller geographical scales often find some support for contact theory (Van Gent et al., 2014; Rink et al., 2009). Studies relying on large geographic scales (such as regions or countries) may be problematic because the size of the immigrant population at this level offers limited insight into the daily experiences of living in changing neighbourhoods and its impact on political behaviour. In addition to issues of geographic scale, another, perhaps greater, concern is that studies based on cross-sectional data are subject to bias from self-selection into neighbourhoods. Using cross-sectional data makes it near impossible to establish if the positive association between, for example, share of residents with migrant background and positive attitudes towards immigrants is a causal effect of inter-group contact or due to those with negative attitudes moving out and/or staying away from the neighbourhood and those with positive attitudes moving in and/or staying. Furthermore, cross-sectional models are unable to comprehensively adjust for neighbourhood characteristics, and so it remains unknown whether any association between neighbourhood composition and political behaviour is due to a causal link or simply due to minority group residents and populist right wing candidates choosing neighbourhood with similar traits, which produces spurious correlations.
The question of scale
Studies that apply a smaller geographical scale come with their own problems. Even when researchers have access to exact geographical locations of individuals, one has to choose which scale to use to examine the impact of context on political behaviour. In a meta-analysis of 171 research papers investigating the link between presence of minority group residents and responses of majority group residents, Kaufmann and Goodwin (2018) conclude that geographical scale “moderates the relationship between diversity and threat, producing a cubic polynomial curve of diversity-threat”. In other words, as geographical scale increases, threat first declines but beyond a certain threshold (which they estimate to be units of about 50,000 residents) it begins to increase. Additionally, when researchers use pre-defined units such as Census tracts, it can conceal processes that arise at different scales - from those in the immediate surroundings to effects that only come into play at larger scales (Costa and de Valk, 2018).
Social scientists have been aware of the importance of analysing the effects of demographic change at multiple scales, yet studies are often limited due to lack of fine-grained geographical data. Studies based on Swedish register data have shown that contextual effects are scale dependent. In a study of neighbourhood effects on income Andersson and Musterd (2010) find that these effects are weakest at the municipality level and stronger at the lowest geographical level (100 by 100 meter squares, in this case). Fine-grained geographical data allows to use the so-called bespoke neighbourhoods, where individuals are assigned to zones of the same radius or consisting of a fixed number of neighbours (Andersson et al., 2014; Andersson and Malmberg, 2015; Brattbakk, 2014; Costa and de Valk, 2018). Because group threat operate more at larger geographical scales and intergroup contact dominates at smaller scales, the effect of increase in the share of minority group residents on political mobilisation depends on scale and thus on the definition of a local context. We address this issue by analysing a wide range of definitions of local context, including multiple scales and halo zones.
The radical right in Sweden
The rise of the Sweden Democrats (Sverigedemokraterna) has shaken the political scene in Sweden. The party originated from extreme right groups and was founded in 1988 as a successor to the Sweden Party and earlier incarnations of extreme right politics in Sweden. In recent years, the party has called for restriction on non-European migration, expulsion of foreign criminals and subsidised repatriation (Elgenius and Rydgren, 2018). This focus on immigration has led many to believe that there may be a link between rising share of minority group residents on one hand and support for the Sweden Democrats on the other. The evidence in the Swedish case is ambiguous, however. In an aggregated voting analysis, Rydgren and Ruth (2013) show that while the Sweden Democrats received more support in areas with a higher fraction of EU immigrants, the opposite was true for fraction of non-EU immigrants. In another study of electoral support for the Sweden Democrats Strömblad and Malmberg (2015) found that exposure to visible minorities was associated with support for the Sweden Democrats, particularly in districts with high levels of unemployment. This result was later corroborated by Dehdari (2021) who reported that the party gained the most support between 2010 and 2014 in districts where labour insecurities coincided with presence of low skilled immigrants.
Research on radical right political candidates in Sweden focuses on candidates’ characteristics and electoral success. Art (2011) interviewed activists from the Sweden Democrats and described how they faced sanctions associated with their political engagement such as threat of losing employment, facing physical violence or problems with booking venues for political meetings. The author concluded that those who become activists tend to have the least to lose. In another study, Dal Bó et al. (2018) argued that Sweden Democrats candidates represent a new class of citizenship candidates, because their profiles are more diverse in terms of socio-economic backgrounds. Dal Bó et al., also say that Sweden Democrats candidates come from the group of economic losers of modernization and locally they tend to be more closely aligned to the voters in their local constituency than candidates from other political parties.
Elections in Sweden
Sweden has a proportional representation electoral system with elections at three administrative levels held on the same day every four years. In this study, we focus on local elections (kommunalval). Compared to other elections, municipal elections have a higher number of candidates and candidates are more evenly spread out across the country. Constituencies are the basic unit for which candidates are elected and most Swedish municipalities consist of a single constituency, but in larger cities municipalities may be divided into smaller constituencies. Municipal elections have lower barriers of entry and are less competitive than parliamentary elections. In 2010 there were 52,000 people running for 13,000 seats in municipal elections. This translated to roughly 1:4 chance of success, compared to 1:17 for parliamentary elections. Municipal elections also have low formal minimum threshold required to have candidates elected (2% or 3% of votes depending on whether given municipality consists of a single constituency) that encourages small and new parties to run.
Data and Methods
Data
Swedish register data provide longitudinal individual-level information about the Swedish population and map each person onto a geographic grid consisting of 100 by 100 meter squares. The registers also contain socio-economic variables and some information on political behaviour, such as decision to run in elections. In this study, we look at individual and contextual changes that occur between 2006 and 2010, a time when support for the Sweden Democrats surged, leading to their first seats in the parliamentary elections of 2010. The dependent variable is (change in) candidacy for a political party in the municipal elections. Our initial sample includes all Swedish residents who were 18 or older in 2006, which amounts to 7,177,735 individuals. Since we focus on the effect of increasing share of minority group residents in the neighbourhood on political mobilisation, we exclude individuals who moved between 2006 and 2010. This reduces our sample size to 4,603,608 individuals. Lastly, we drop individuals with missing information on any of the relevant variables in 2006 or 2010, netting a final sample size of 3,083,801 individuals.
Our dependent variable is binary, taking on a value of 1 if the individual ran for the Sweden Democrats and 0 if they did not. 2 Our independent variable is the (change in) the share of non-Western immigrants in 2006 and 2010 within the neighbourhood measured at different neighbourhood scales. We build bespoke neighbourhoods around each point at a 100-meter grid, to include all residents at the grid who live within the radius of 100, 500, 1000 and 2000 meters. We also include a range of time varying control variables. At the individual level, we include changes in individual level disposable income, marital status and employment. At the neighbourhood level, we control for changes in mean income, unemployment rate, and average educational attainment and population density. Table 1 shows that the Sweden Democrats experienced a large growth between 2006 and 2010, nearly quadrupling the number of candidates in this period. 3
Dependent variable.
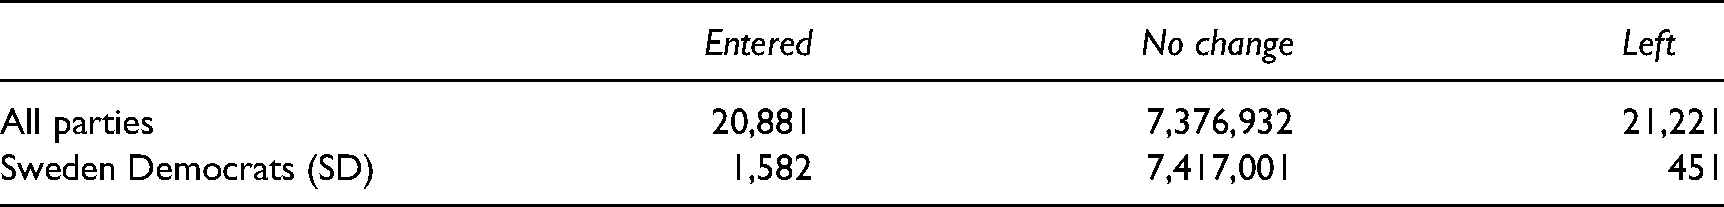
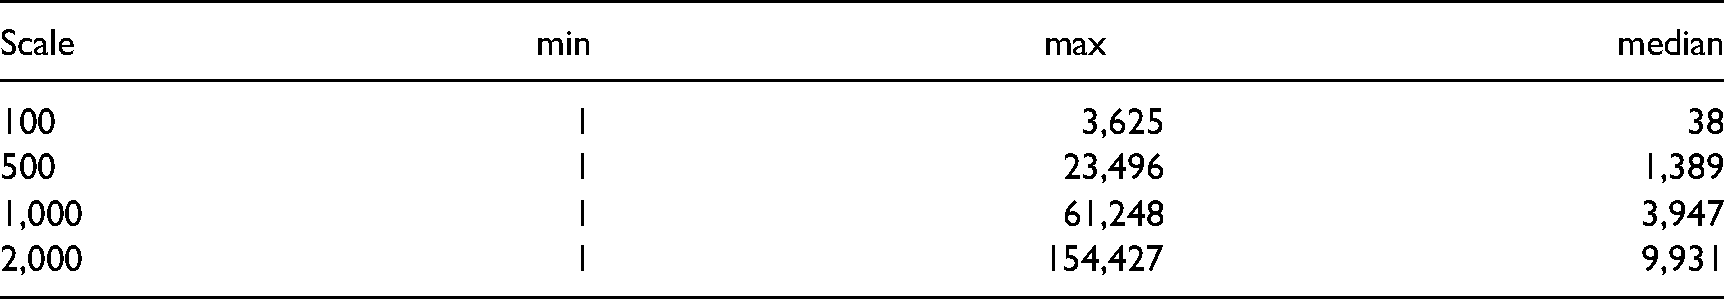
Table 2 provides descriptive statistics—range and median—on the number of people in each grid cell by scale while Table 3 shows descriptive statistics at the neighbourhood level, defined as a 1,000 by 1,000 meter square (our preferred specification).
Descriptive statistics for residents at different neighbourhood scale definitions.
Descriptive statistics for 1,000 by 1,000 meter squares.
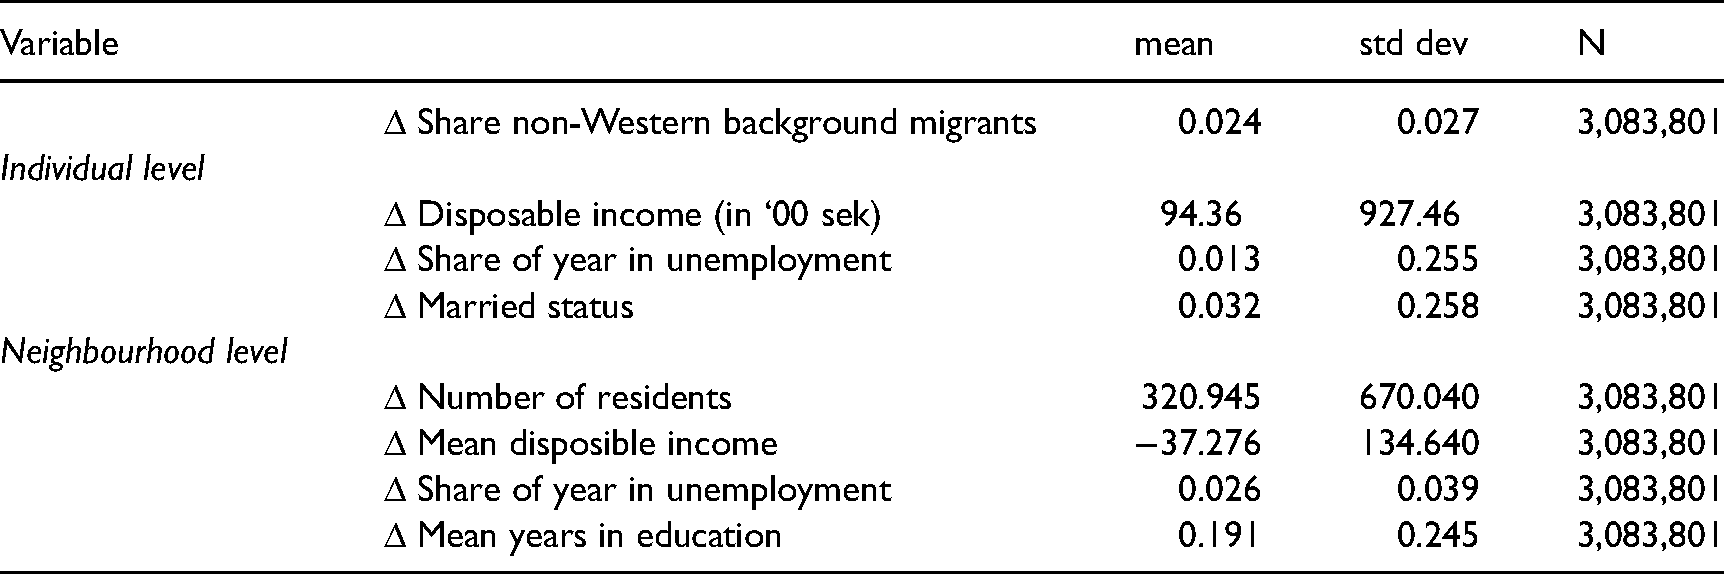
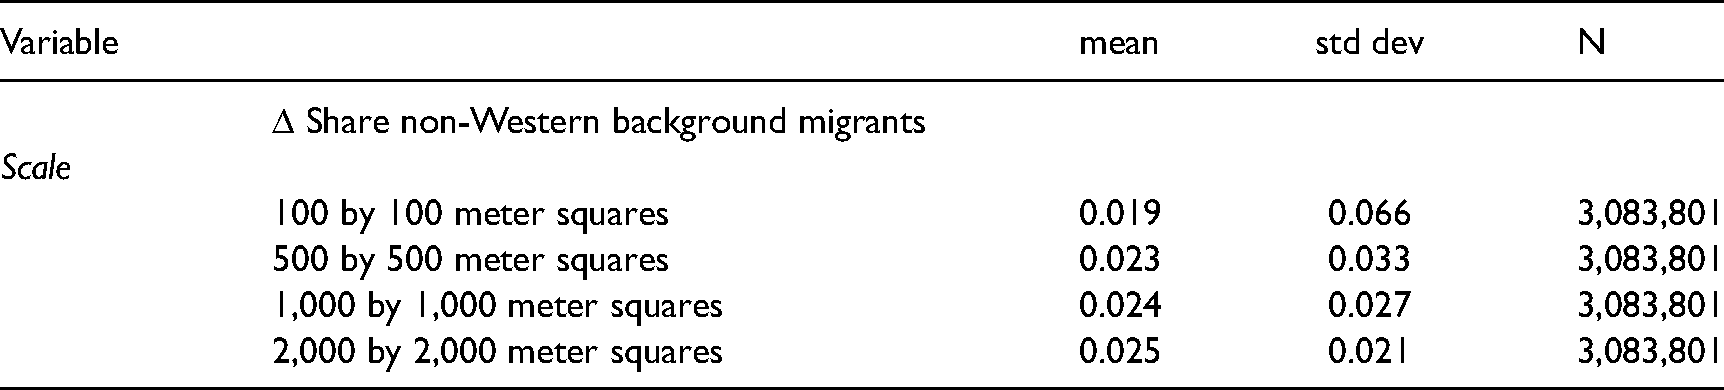
For changes in the share of visible minority residents, we measure the neighbourhood share of migrants with non-Western background (see the Appendix for a definition) in 2006 and 2010 and calculate the difference. On average, a Swedish neighbourhood experienced an increase in the share of visible minorities of 0.024, or 2.4%, with substantial variation across neighbourhoods. Table 4 shows the change in share of visible minorities for alternative specifications of neighbourhood size. These changes increase slightly with scale, but they are all quite similar.
Dependent variable at different neighbourhood scales.
Methods
The two main challenges when estimating the effect of neighbourhood share of visible minorities on political candidacy are unobserved heterogeneity and self-selection. Estimating the cross-sectional relationship between the share of visible minorities on political candidacy by regressing the latter on the former, makes very strong assumptions that are unlikely to hold. Most severely, the model would assume that the explanatory variable, share of visible minorities, is unrelated to any factors not included in the model that also affect political candidacy. Realistically, however, both the decision to run for office and the share of minority group residents in a neighbourhood would be affected by characteristics of both the individual and the neighbourhood. For example, migrants with non-Western background may be more likely to move into low-income neighbourhoods where right wing sentiment might also be systematically more prevalent; or the type of individual that might consider right wing political candidacy might intentionally avoid immigrant-dense neighbourhoods. In this way, self-selection and unobserved heterogeneity violate the identifying assumptions of the empirical model. We could write up the underlying model as:
First, to control comprehensively for 
Similar to Bhatti et al. (2017), we estimate our model using OLS regression, which can be considered a Linear Probability Model because the outcome is binary. Note that when when apply our first differences design, the dependent variable strictly speaking takes on three values, −1, 0, and 1. However, this is a mathematical artefact of the subtraction and the estimated coefficients are interpretable as with any LPM. For intuition, recall that the model we estimate is mathematically equivalent to including a dummy for each individual (minus one), so estimating an OLS on the first differences yields LPM coefficients. Although our dependent variable is binary (prior to calculating first differences), we avoid using logistic regression due to the well-known issues with comparing coefficients between models and interpreting interaction terms (Allison, 1999; Breen et al., 2018; Mood, 2010). 5 Furthermore, estimates from logistic regression and LPM's most often produces indistinguishable results (Gomila, 2021; Hellevik, 2007). To support the feasibility of our LPM, we calculate predicted probabilities based on our main models and conclude that none of the predicted probabilities fall outside of the meaningful range.
Regarding causality, we do not consider our estimates to be strictly causal, since they still rely on the crucial assumption that its time-variant components,
Results
In this section we first present our results using 1,000 by 1,000 meter squares as our neighbourhood definition, and using no controls or municipal fixed effects. We then expand on this baseline result by first including controls and then adding municipal fixed effects. We consider this final model to be our preferred specification and present our full model in the Appendix. We then elaborate on these results in four ways: First, to analyse how our effects vary by the definition of neighbourhood size. Second, we estimate our main model separately for urban and for metropolitan neighbourhoods. Third, because the effects of changes in the share of non-Western residents may be non-linear we re-run our model separately for the neighbourhoods depending on whether they experienced a change in the share minority group in the lower, middle or upper tercile of the distribution of changes. Lastly, we look at characteristics of movers, who were excluded from our preferred model and check whether including movers (those who changed their place of residence between 2006 and 2010) makes a difference.
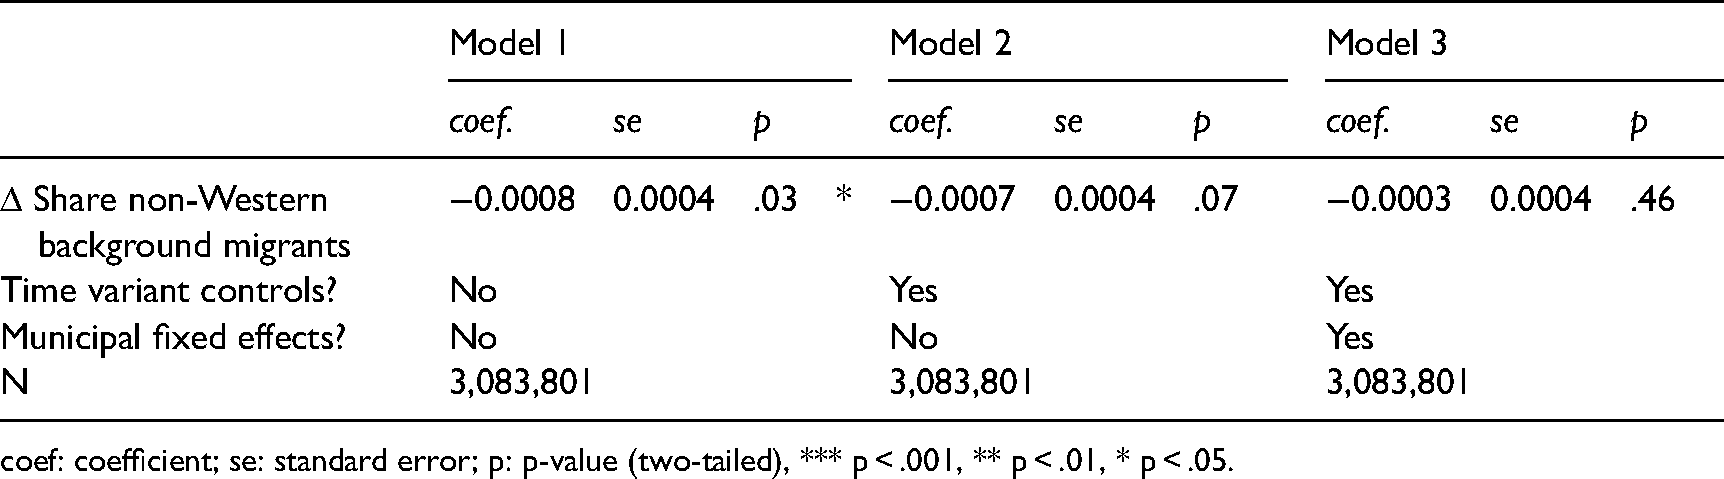
Table 5 shows our main results. For ease of interpretation, the effect shown represents a change in visible minority residents from 0% to a 100%. Though no such neighbourhoods exist in our data, the effect sizes are too miniscule to meaningfully show the effects of, for example, a one-percentage point increase. Thus, the interpretation of Model 1 is that even a complete change of the share of visible minorities in the neighbourhood would only lead to a modest decrease of 0.08 percentage points in the likelihood of running for office for the Sweden Democrats. This effect is statistically significant at 0.05 level. For Model 2 we include time-variant controls and estimate a 0.07 percentage point decrease in the likelihood of running, which falls short of significance at 0.05 level. However, when adding municipal fixed effects to this model, this effect diminishes further to 0.03 percentage points and becomes indistinguishable from zero. Note that the absence of significance is not produced by overly large standard errors, but rather by a very small parameter estimate: For Model 3 the upper 95% confidence interval is estimated at 0.0005177, which, even if it was significant at traditional p-values, is an unsubstantial effect size. 6 These insignificant effects combined with the unsubstantial effect sizes and the high precision leads us to conclude that increasing share of visible minority residents has no effect on political candidacy for the Sweden Democrats. We ran Models 1–3 on a sample without migrants with non-Western background (since they are unlikely to join the Sweden Democrats), and found that this exclusion does not change the results substantively.
The effect of the neighbourhood shares of visible minorities on political candidacy for the Sweden democrats.
coef: coefficient; se: standard error; p: p-value (two-tailed), *** p < .001, ** p < .01, * p < .05.
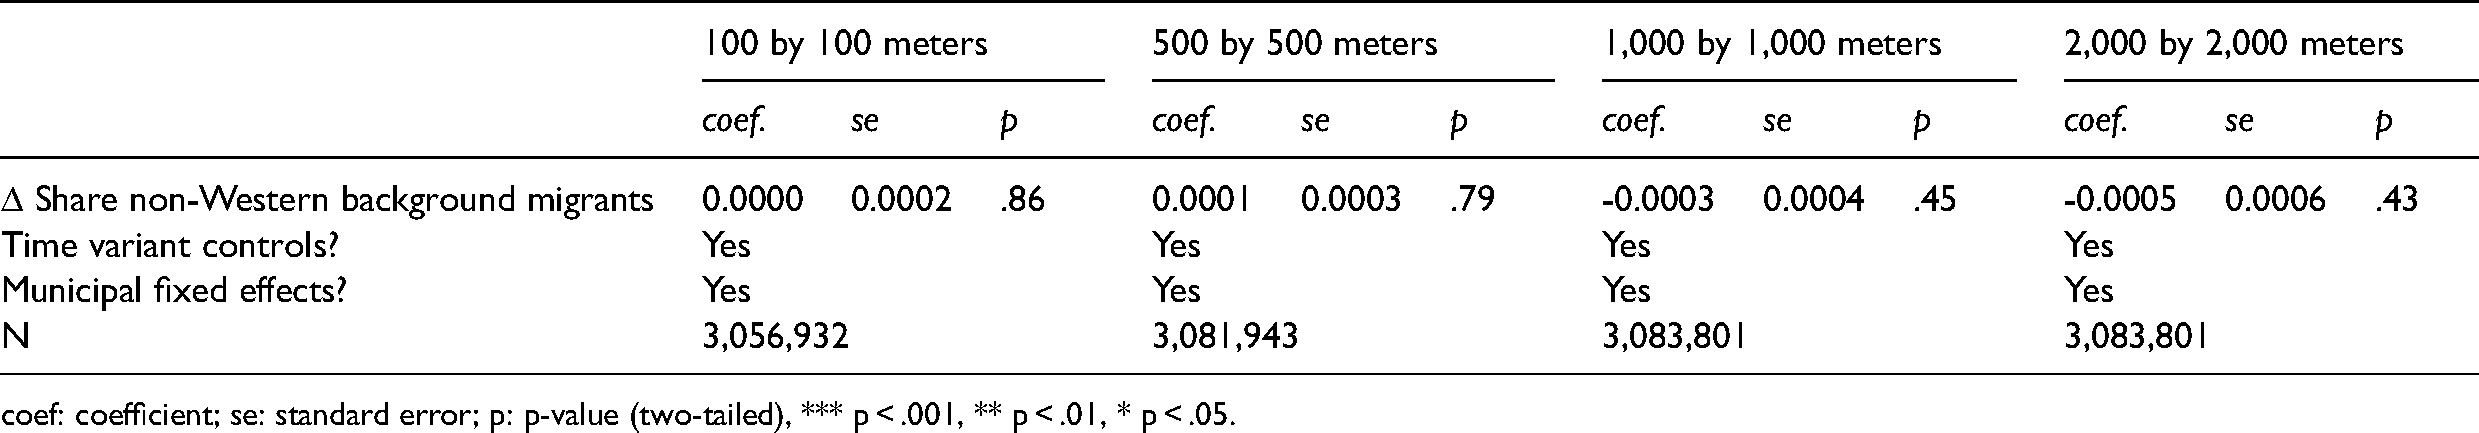
Next, we continue with our preferred specification from Model 3 and check whether the effect depends on the neighbourhood scale. Table 6 shows the results and while the smaller scales seem to show a minuscule positive association between change in share of visible minorities in a neighbourhood and propensity to run for the Sweden Democrats, this association is not statistically significant. At larger scales, we see a negative estimate for the coefficient, but cannot reject the null hypothesis that it is not different from zero. We tentatively conclude that our choice of geographical scale seems to impact our results, but in all specifications, they remain insignificant and unsubstantial.
The effect of the neighbourhood shares of visible minorities on political candidacy for the Sweden democrats by varying neighbourhood scale definitions.
coef: coefficient; se: standard error; p: p-value (two-tailed), *** p < .001, ** p < .01, * p < .05.
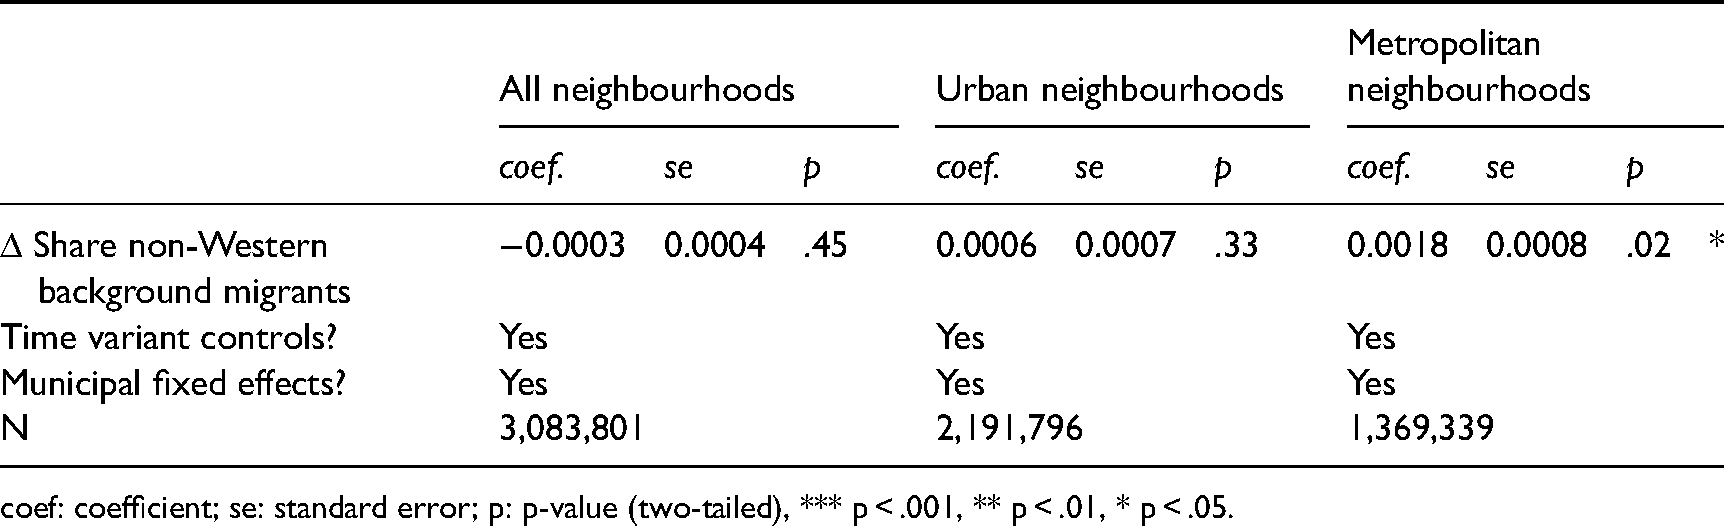
Sweden is characterised by high variation in population density across the country so our results could be skewed by inclusion of sparsely populated neighbourhoods, where even small changes in population composition are associated with large changes in shares of visible minorities. We introduce criteria for excluding sparely populated areas, first by looking at urban and then at metropolitan neighbourhoods, defined as neighbourhoods whose population density in 2006 is above the 25th and 50th percentile, respectively. Results are shown in Table 7.
The effect of the neighbourhood shares of visible minorities on political candidacy for the Sweden democrats bydifferent neighbourhood population densities.
coef: coefficient; se: standard error; p: p-value (two-tailed), *** p < .001, ** p < .01, * p < .05.
Focusing on densely populated areas, we find no significant effects when restricting our sample to urban neighbourhoods. However, for inhabitants of metropolitan neighbourhoods the effect of a change in visible minority residents from 0% to a 100% is associated with 0.2 percentage point increase in the likelihood of running for the Sweden Democrats, with a coefficient that is statistically different from zero. The effect size remains unsubstantial, however, so while it might seem that an increase of 0.2 percentage point is large, compared to the baseline probability, in the absolute sense this change is unlikely to change the number of candidates emerging from these neighbourhoods.
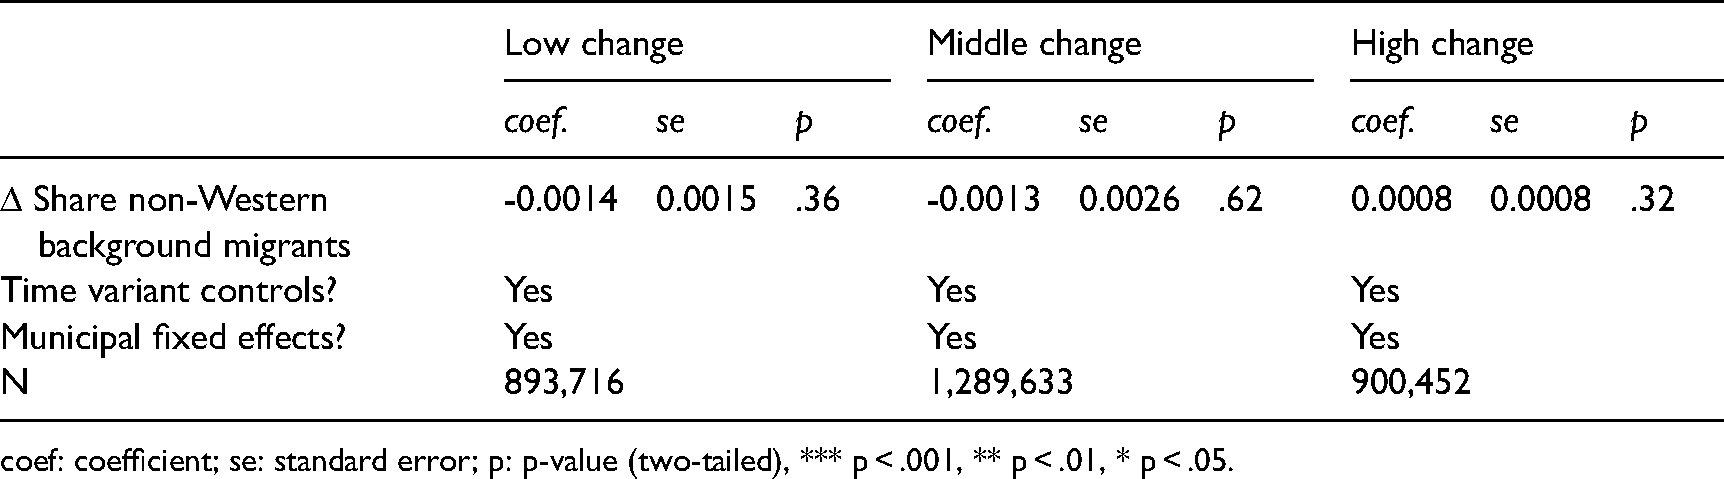
Another possibility, which found empirical support in previous research, is that the effect of changes in the share of minority residents could be non-linear (van Wijk et al., 2020). Large increases in particular, may have a positive effect in line with ethnic threat theory, while decreases could exert no influence over political engagement. Therefore, we re-run out model separately for the neighbourhoods depending on whether they experienced a change in share of minority group residents in the lower middle or upper tercile of the distribution of changes. Table 8 shows the results.
The effect of the neighbourhood shares of visible minorities on political candidacy for the Sweden democrats bydifferent levels of changes in share of visible minorities.
coef: coefficient; se: standard error; p: p-value (two-tailed), *** p < .001, ** p < .01, * p < .05.
Even though the coefficients follow a hypothesised gradient, where we see a mobilising effect in neighbourhoods with most change, none of the estimates are statistically different from zero or substantial in effect size. While this result may be considered tentative evidence of non-linearity, we consider these findings too weak for firm conclusions.
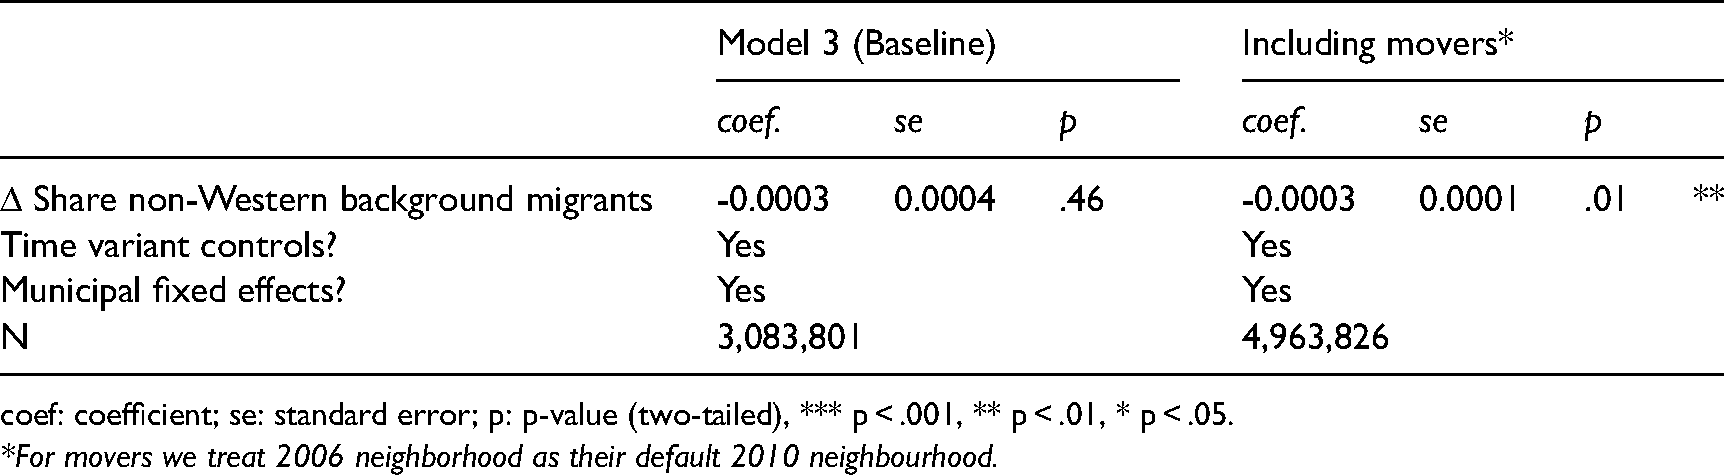
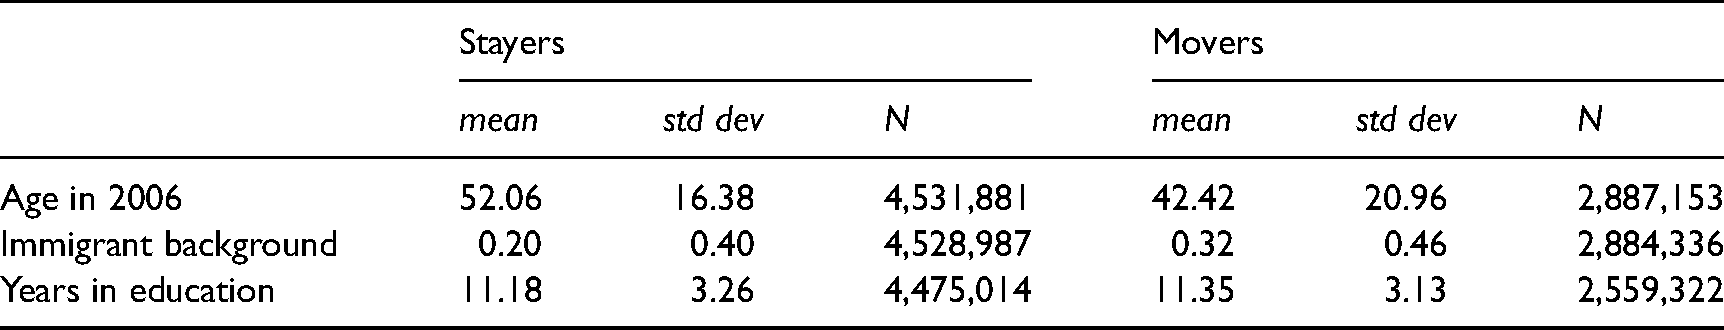
Our sample so far excluded movers. This is an empirical necessity: to observe the impact of changes in local environments on changes in behaviour we require that individuals remain in the neighbourhoods and observe the on-going changes. But the possible selectivity in discarding movers deserves attention. In the Appendix we present a table showing how movers differ from stayers on some key demographic variables and results for running our model of choice (Model 3) on a sample which included movers, where their 2010 neighbourhood is imposed to be the same as 2006 neighbourhood. In line with research, we find that movers tend to be younger, be overrepresented among persons with immigrant background and have slightly higher value for the mean number of years spent in education (although this is most likely driven by age differences). Regression results in Table 9 show that including movers does not change the value of the coefficient for Model 3, although makes the estimate significant at the 0.01 level (possibly due to the increase in statistical power). The effect size remain inconsiderable. Thus, we consider our analysis robust to including or excluding movers.
The effect of the neighbourhood shares of visible minorities on political candidacy for the Sweden democrats by residential mobility.
coef: coefficient; se: standard error; p: p-value (two-tailed), *** p < .001, ** p < .01, * p < .05.
*For movers we treat 2006 neighborhood as their default 2010 neighbourhood.
Robustness checks
Above, we showed how the share of minority residents relates to political candidacy for the Sweden Democrats under a series of varying general model specifications. In this section, we run three additional robustness checks that address the potential role unemployment, the lower entry threshold in municipalities where the Sweden Democrats emerged as institutionalised political party between 2006 and 2010, and the subjects of geographical scale and halo effects.
The effect of unemployment
It has been suggested that the threat response mechanism may be conditional on the economic circumstances and that people who have “more to lose” - such as the unemployed competing for a job in the labour market – feel economically threatened by increases in the share of minority group residents (Quillian, 1995). In a study of municipal level voting for radical right in Finland, Patana (2020) uses difference in difference design to show that immigration and economic insecurity are associated with increased support for the radical right in, particularily in areas which experience large increases in immigration or economic decline. Hence, the effect of changes for the share of minority group residents could differ depending on the initial levels of unemployment in the neighbourhood. To see if this is the case for mobilisation for radical right candidacy, we run three separate regressions (with municipal fixed effects with time-variant controls) for each tercile of unemployment levels in the neighbourhood in 2006. If unemployment level conditions the propensity to enter the pool of candidates, we expect that the propensity to run for the Sweden Democrats would be higher in neighbourhoods in the highest unemployment tercile. Table 10 shows the results. While we do find a gradient consistent with this prediction, the effects of change in share of visible minorities are not significant, and we conclude that unemployment is not a key factor when determining the effects of changes in the share of minority residents for political candidacy for the radical right.
The effect of the neighbourhood shares of visible minorities on political candidacy for the Sweden democrats bydifferent base levels of unemployment.
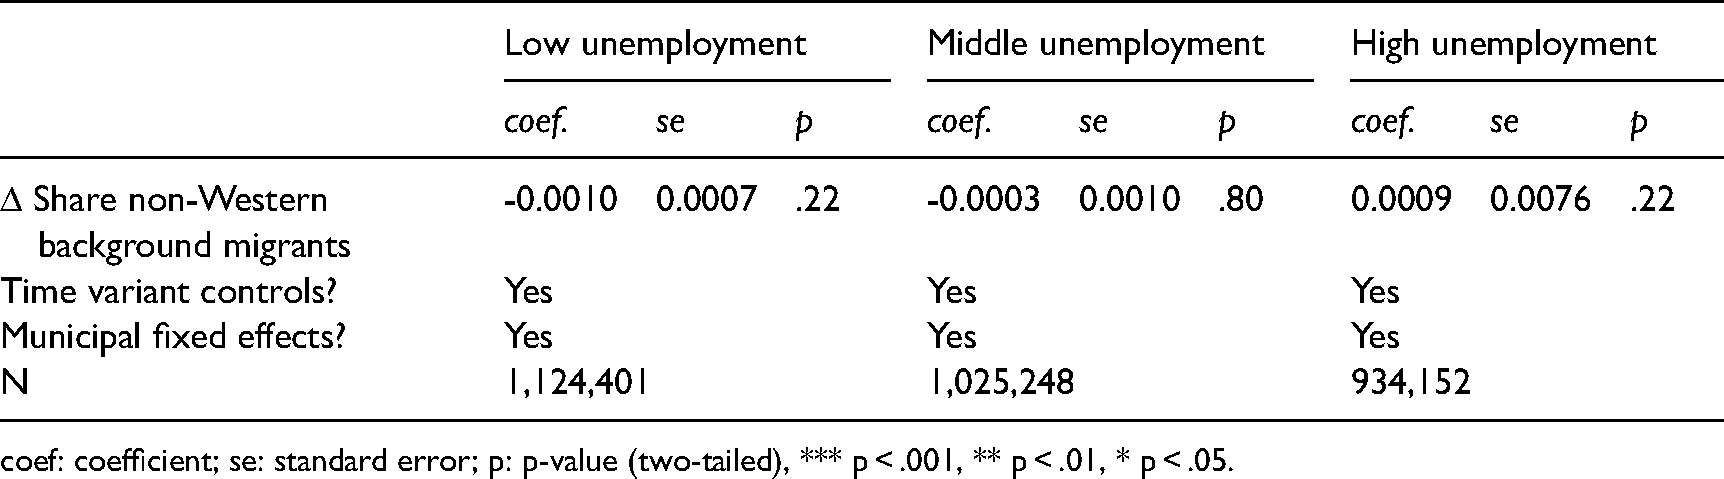
coef: coefficient; se: standard error; p: p-value (two-tailed), *** p < .001, ** p < .01, * p < .05.
Entry threshold
Another reason why we may not observe the mobilising effect, even if experience of increasing share of minority group residents genuinely made people more prone to run is the screening procedures applied by the parties. Not all aspiring candidates are given a chance to run; in case of large established parties, candidates are often chosen from a pool of aspiring politicians (Norris, 1997). The threshold to becoming a political candidate is lowest in municipalities with weak party structures and where there is a shortage of aspiring candidates. The Sweden Democrats have been rapidly expanding their party structures in the period in question: In 2006, the party did not contest municipal elections in 123 out of 290 municipalities; by 2010, that number had dropped to just 26 municipalities. We therefore run a separate regression restricted to the municipalities where the party emerged in that period, selecting the subset of municipalities with lowest entry threshold. We expect that in those areas a decision to join the ranks of the Sweden Democrats candidates corresponds most closely with individual support for the radical right, because the barrier of entry is low. Naturally, these municipalities could be selected on a series of observable and unobservable characteristics, so we cannot generalise results to all of Sweden. In Table 11 we find no significant effects when adjusting for time-variant controls and municipal fixed effects. Thus we find no significant effects of increasing share of minority residents on political candidacy even in the municipalities where the barrier of entry was low.
The effect of the neighbourhood shares of visible minorities on political candidacy for the Sweden democrats for municipalities where Sweden democrats candidates emerged between 2006 and 2010.
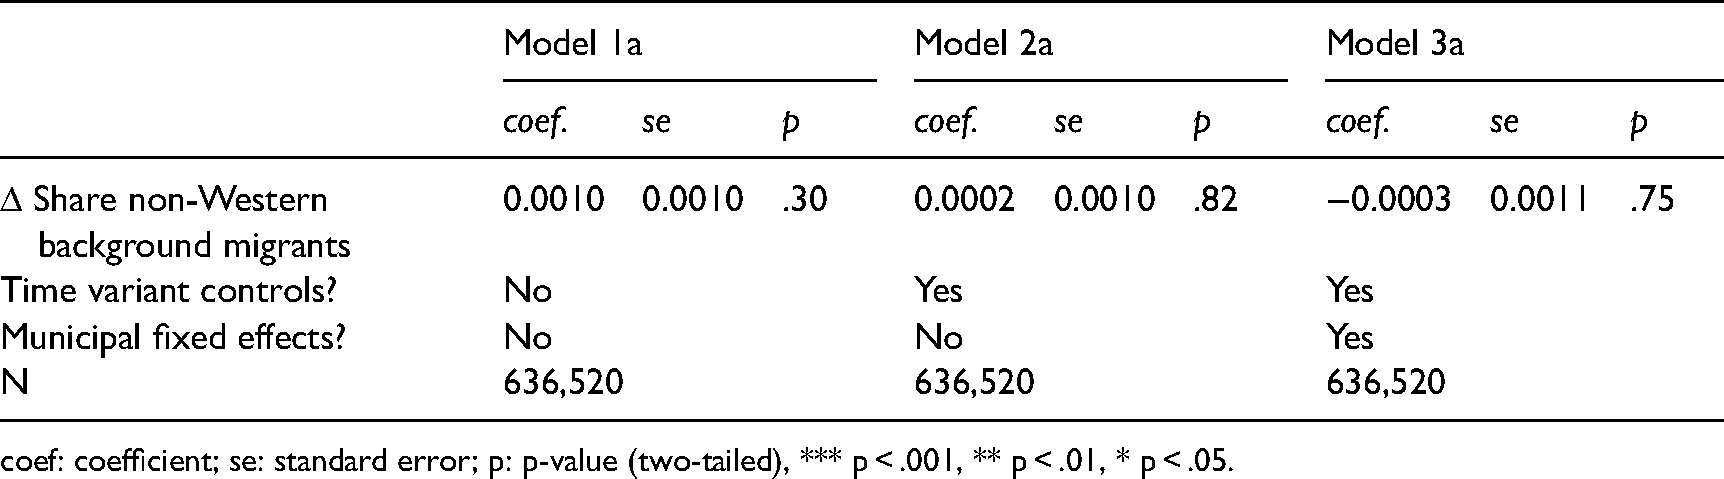
coef: coefficient; se: standard error; p: p-value (two-tailed), *** p < .001, ** p < .01, * p < .05.
The effect of the neighbourhood shares of visible minorities on political candidacy for the Sweden democrats for multiple scales.
coef: coefficient; se: standard error; p: p-value (two-tailed), *** p < .001, ** p < .01, * p < .05.
Halo effect
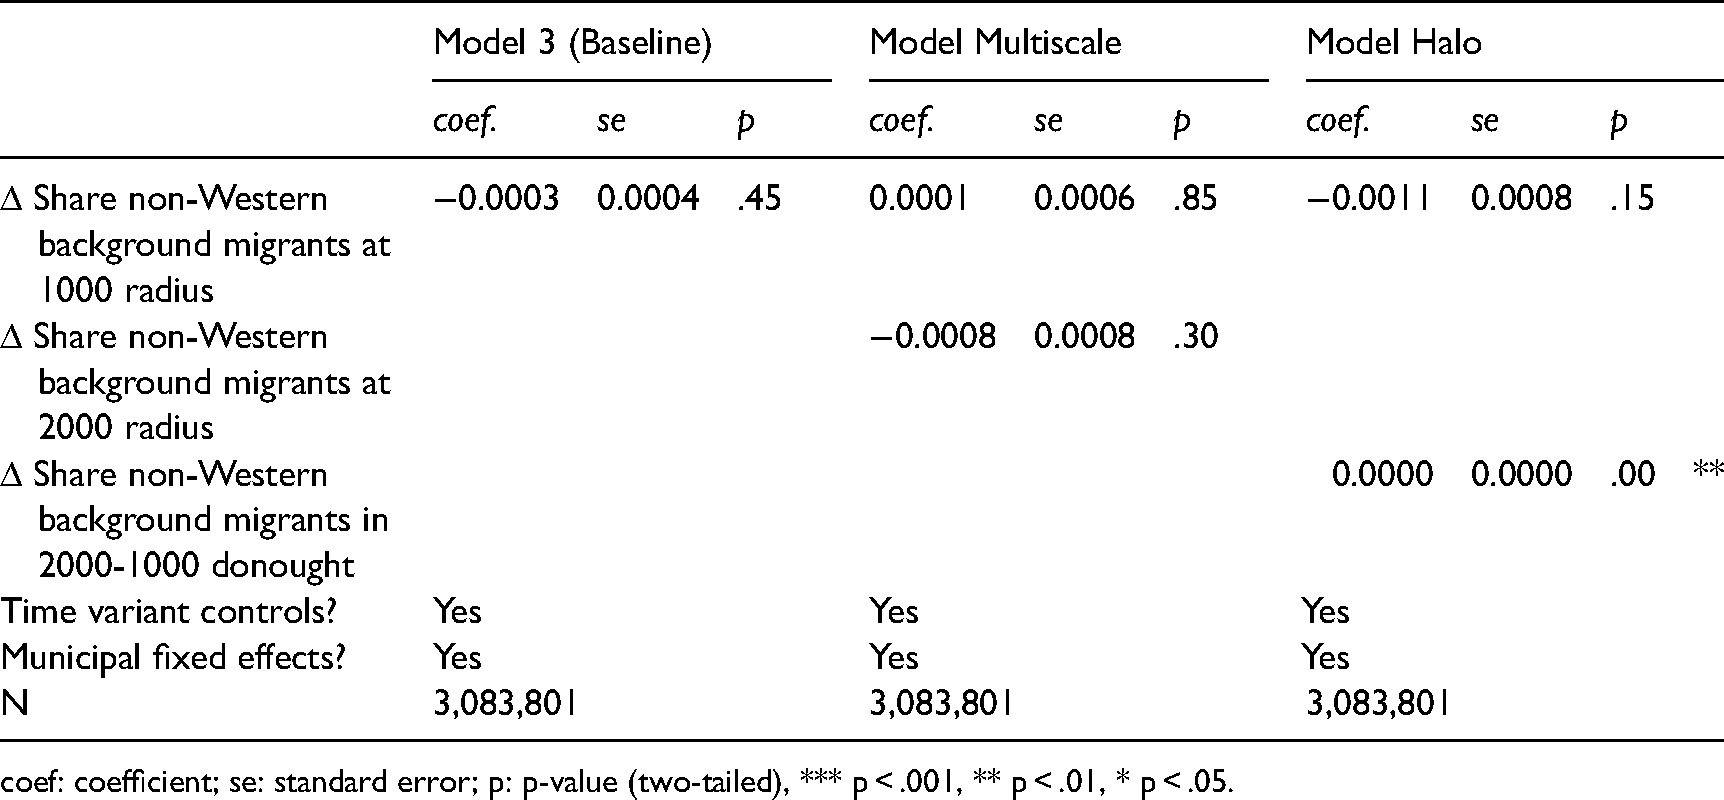
Lastly, the association between support for radical right wing and local minority group concentration can depend on the spatial distribution of the minority group. Specifically, far right support may not be higher within areas with a high share of visible minority residents, but rather in the homogenous majority enclaves which are adjacent to them. Here, geography is the culprit for the diverging predictions from ethnic threat and contact theories. This is because members of the majority group may beaware of proximity to minority group and worry about potential competition from them but these concerns are not mitigated by a chance to come into meaningful, daily contact with those they feel threatened by. In their 2013 study, Rydgren and Ruth find that the Sweden Democrats performed well in district with low proportion of immigrants that were adjacent to more diverse contiguous districts. Further support comes from a recent study of PVV vote in the Netherlands by Van Wijk et al. (2020) or Evans and Ivaldi (2020). In the first study, the authors looked at scales ranging from 100 meters to 10,000 meters and found that for urban areas support for PVV was higher among residents who resided in areas with low shares of ethnic minorities that had a clustering of ethnic minorities in the halo area around them. In the second, the authors look at French radical right voting and find a curvilinear halo effect of an increased probability of radical right voting in areas surrounding communities with higher shares of immigrants. None of these papers employ a fixed effect design, however, and we expand these previous findings using our design. We hypothesise that the effect of changes in the share of non-Western residents on candidacy for radical right wing party would most likely be observed in an urban context in a setting where change in the immediate bespoke neighbourhood would be associated with lower propensity of running while changes in the larger halo zone would be associated with increasing propensity to enter the pool candidates for the Sweden Democrats.
To test for halo effects, we calculate changes in the share of individuals with non-Western immigrant background in the halos, hollow areas which include grid cells that fall within the radius of 2,000 meters and exclude cells that fall within the 1,000 meters from each individual grid cell. 7 Additionally, we restricted the sample to metropolitan areas, according to the population density criteria introduced above. Results are shown in Table 13 and Table 14. For metropolitan areas, we find support for the halo effect hypothesis for the effect of local changes in the share of minority residents on radical right candidacy, however when we look at the sample of all 100 meter squares, we do not observe a similar effect.
The effect of the neighbourhood shares of visible minorities on political candidacy for the Sweden democrats for multiple scales, metropolitan areas only.

coef: coefficient; se: standard error; p: p-value (two-tailed), *** p < .001, ** p < .01, * p < .05
Discussion and conclusion
In their meta-analysis of the effects of native-born responses to ethnic diversity, Kaufmann and Goodwin (2018) maintain that there are three routes though which threat response can work. First, there isthe ‘exit’ route, where individuals leave rapidly changing neighbourhoods, and ‘accommodation’, where they simplyget used to the new reality. Then there is ‘voice’, where individuals express their opposition to change. This article is about the effect demographic changes have one important case of ‘voice’, that is running as a candidate for a radical right party. This study adds to our knowledge of mobilising drivers: even though opposition to demographic change associated with immigration lies at the heart of the Sweden Democrats’ political message, there is limited evidence to suggest that local candidates are mobilised because of their first-hand experiences of increasing share of minority group residents in their neighbourhoods. This result is consistent across various neighbourhood specifications with respect to scale, population density, non-linearities for the change in the share of minority residents and persists when we introduce additional robustness conditions. The significant effects were found for sample that included movers (a minuscule de-mobilising effect), for metropolitan areas (a minuscule mobilising effect), additionally for mteropolitican areas we found confirmation for a halo effect (a miniscule mobilising effect), similar to that reported by van Wijk et al. (2020). For metropolitan areas, entry into the pool of the Sweden Democrat candidates was higher in areas that experienced low influx of minority residents, while experiencing a higher increase in surrounding halo zone. Importantly, all these effects they are substantively quite small and limited in absolute magnitude to changing likelihoods of running by less than 1 percentage point. One question is why do we observe these effects for metropolitan neighbourhoods but not for all? There may be two reasons: first it has to do with the mathematical properties of our independent variable – shares are more volatile measures when we deal with sparsely populated areas. The other reason may have to do with the substantive difference between political mobilisation in rural and urban areas. One reason why we think that there is some genuinely different dynamics in large cities is that we do not observe significant effects for urban areas, that is areasabove 25th percentile in population density for 1,000 meter radius. This condition should deal with much of the distortion of shares for the independent variable.
One could ask whether the period of investigation meant that different people joined in 2006 and 2010. The rising popularity of the Sweden Democrats between 2006–2010 coincide with ideological shifts that painted the party as a more acceptable political choice, a common occurrence of many radical right parties’ trajectories to electoral success. But modernisation of the Sweden Democrats had already been happening in 2006. One of the necessarily conditions for radical right wing parties to become electorally viable isto brake away from the stained image of extreme right from the previous era (Hainsworth, 2000). Already in 2001, the Sweden Democrats split, and more extreme activists founded the National Democrats. This accelerated modernization of the Sweden Democrats, especially after 2005 when Jimmie Åkesson took control of the party, bringing the message of the Sweden Democrats’ closer to that of the more successful Danish People's Party (Widfeldt, 2008, 2014). By 2006, the cordon sanitaire that was erected around the Sweden Democrats was beginning to crumble and both the media and the mainstream parties began to engage with the their politicians (Oja and Mral, 2013). 8
Our study provides some support for the notion that experience of living in immigrant-dense areas is not straightforwardly linked to support for radical right parties as well as to the importance of a wider spatial distribution of minority residents. One should be cautious when extending this finding to other forms of political behaviour. While candidates for emerging radical right wing parties tend to resemble their voters in terms of political attitudes and views (Lynch et al., 2012), the process of mobilisation for political office does not mirror electoral support. Even though we selected a period of rapid expansion for the Sweden Democrats and looked at municipal level elections with the lowest possible entry threshold, politicians and party candidates tend to have more resources at their disposal in comparison to their voters (Norris, 1997). 9
Our findings could be extended in several ways. Future research should explore if group threat works in a longer time perspective, or whether its effects are more pronounced among those who exited immigrant-dense neighbourhoods. Stayers may be more influenced by demographic changes happening over the course of the last decade (or two) than the very recent changes in the share of visible minorities which we looked at in this study. Additionaly, in “Exit, Voice and Loyalty”, Hirschman (1970) argued that in the face of a growing discontent with existing group provisions individuals have two possibilities for response: they can either leave or attempt to influence the direction of future changes by voicing their discontent. Similar mechanisms may apply in case of threat reactions to demographic changes associated with immigration. When changes take place against the wishes of indivdiual residents, they can either voice their opposition, for instance by becoming candidates for a radical right party or exit and relocate to neighbourhoods with higher shares of native Swedes. This study looked at ‘voice’, but future research could examine the link between demographic change associated with immigration and ‘exit’ from the neighbourhoods in conjunction with right wing candidacy.
Footnotes
Acknowledgements
Earlier versions of this paper were presented at the European Consortium for Political Research conference, RC28, the IAS Annual Symposium, the Stockholm University Sociology seminar. We are thankful to our colleagues for their helpful feedback received on these occasions. We would like to thank Anders Holm, Naeim Samandari, Jeppe Elholm Madsen, Said Hassan, Ryszard Szulkin and Magnus Bygren for comments and advice. Acknowledgements are also due to Peter Hedström and Maria Brandén for facilitating access to register data and three anonymous reviewers for their suggestions on how to improve our work.
Declaration of conflicting interests
The author(s) declared no potential conflicts of interest with respect to the research, authorship, and/or publication of this article.
Funding
The author(s) disclosed receipt of the following financial support for the research, authorship, and/or publication of this article: This work was supported by Forte - Forskningsrådet för hälsa, arbetsliv och välfärd (grant number 2015-01200).
Notes
Author biographies
Appendix
Descriptive statistics for stayers and movers.
| Stayers | Movers | |||||
|---|---|---|---|---|---|---|
| mean | std dev | N | mean | std dev | N | |
| Age in 2006 | 52.06 | 16.38 | 4,531,881 | 42.42 | 20.96 | 2,887,153 |
| Immigrant background | 0.20 | 0.40 | 4,528,987 | 0.32 | 0.46 | 2,884,336 |
| Years in education | 11.18 | 3.26 | 4,475,014 | 11.35 | 3.13 | 2,559,322 |
Definition of non-Western background
We classify non-Western immigrant as first or second-generation immigrants with non-Western origin. We use the country of birth registers, merged with multigenerational information about the country of birth of parents and grandparents. This way, we capture a broader category consisting of both 1st and 2nd generation migrants. 1st generation migrants with non-Western background are born in a non-Western country, 2nd generation migrants have at least one 1st generation migrant parent born in a non-Western country. Swedish majority residents have two Swedish born parents. Non-Western countries are countries outside of the EU15, US and Canada. The following country of birth groups (provided by Statistics Sweden) were used for non-Western background: Poland, Yugoslavia, Bosnia and Herzegovina, Romania, Russia and the Soviet Union, Hungary, Estonia, Lithuania, Latvia, Kosovo, Croatia, Albania, Serbia and Montenegro, Bulgaria and Ukraine, Chili, Argentina, Uruguay, Colombia, Central American and Caribbean, Other South America, Somalia, Ethiopia, Eritrea, South African, Central African, Morocco and Algeria, Tunisia, Libya, Egypt, West Africa, Iraq, Iran, Turkey, Syria, Lebanon, Other Middle East, Thailand, China, Mongolia, North Korea, Afghanistan, South Asia, Vietnam, Philippines and Pacific Islands, Pakistan, Korea, Japan, Taiwan, Hong Kong, Singapore, South East Asia, Central Asia.