
Abstract
Previous research has shown that an advantaged social class position protects individuals from unemployment, but less is known about how this relationship has developed after the turn of the millennium, how it varies by gender and to what extent education contributes to the association between these factors. We assess these questions using register-based data on the Finnish labour force over a 28-year period between 1988 and 2015. The overall risk of unemployment was 2.7–3.7-fold among manual classes compared to upper non-manual classes, and 1.4–1.7-fold among lower compared to upper non-manual classes. Controlling for education attenuated the differences between social classes by about two-thirds. Social class disparities were somewhat more distinct among men than among women, but gender differences narrowed over time. Overall, temporal changes were small, especially among men, except for a curvilinear pattern observed for the relative unemployment risk of the lower non-manual class. To conclude, despite a comparatively egalitarian context and drastic changes in economic conditions and labour market structures over time, social stratification in unemployment has been substantial and considerably persistent. This is in line with the conceptualization of social class underpinning differing employment relations and, therefore, inherently creating variation in labour market risks.
Introduction
A high level of unemployment is a key social problem in many countries. For individuals, unemployment is usually an undesirable state that increases economic insecurity and, when prolonged, has negative effects on a wide variety of life opportunities and living conditions. Yet, the risk of unemployment is not equal; it is more pronounced among those in lower socioeconomic groups. Social class, based on an individual’s occupation and, therefore, intimately connected to economic activity and the labour market position of an individual, can act as a natural stratifying element in the risk of becoming unemployed. However, our understanding of the link between social class and unemployment remains incomplete in several ways. Although social class differences in unemployment are recognized, most previous studies have only briefly discussed the topic as part of a broader focus on the social distribution of economic opportunities (Bihagen and Halleröd, 2000; Chan and Goldthorpe, 2007; Elias and McKnight, 2003; Gallie et al., 1998; Goldthorpe and McKnight, 2006; Layte et al., 2000). There are, however, some exceptions (Lucchini and Schizzerotto, 2010; McGinnity and Hillmert, 2004).
One of the aspects that has attracted both public and academic interest, but a limited amount of empirical investigation, is the evolution of the class–unemployment association over time. The effect of social class on unemployment has been predicted to both decline (Beck, 2000: 153) and increase (Breen, 1997: 485) because of the shifting risks in working life in the early 21st century. The question of the validity of these predictions, however, remains unanswered, as empirical analyses addressing time trends have so far been uncommon (see, however, Bihagen and Halleröd, 2000; Gallie et al., 1998; McGinnity and Hillmert, 2004) and the results are limited to the turn of the millennium. Moreover, these analyses have utilized survey data, which have limitations such as non-response, misreporting and small sample sizes. Other gaps in the literature include limited knowledge on gender differences. Overall, despite the proportion of the labour force in contemporary economies being large, very little is known about the relationship between social class and unemployment among women. In addition, although social class and education are closely linked, and educational differences in unemployment have been relatively well investigated, the contribution of education to the class–unemployment association, and the changing relationship between the two factors, have still not been directly evaluated.
This study aims to contribute to the literature by addressing three research questions concerning the effect that social class differences have on the risk of becoming unemployed. We assess: (a) the extent of social class stratification in unemployment using individual-level, register-based data; (b) the disparities between men and women in the class–unemployment association; and (c) the extent to which social class differences in unemployment are explained by education. Furthermore, for all these three questions, we assess the time trends between 1987 and 2015 in the context of Finland, a country that encountered drastic changes in unemployment rates during the period under scrutiny, due mainly to a severe economic recession in the early 1990s, and another from 2009 onwards. Thus, Finland is a research setting in which marked contextual changes over time plausibly may have had an impact on social class differences in unemployment.
Study background
Social class is, arguably, closely related to the risk of unemployment. For example, in the much-used Goldthorpe class schema, the occupations of more advantaged classes are characterized by difficulties in the supervision of employees and the high degree of human asset specificity in job tasks (e.g. Goldthorpe, 2007: Chapter 5). This can directly affect labour market risks via employers’ strategies for optimizing the commitment of employees. Manual work concentrates on producing a discrete number of concrete outcomes. Hence, if the specific work tasks change or become less necessary because of, for example, the evolution of machinery or industrial downsizing, manual workers will be at a high risk of becoming redundant from the employers’ point of view. In addition, manual workers often tend to be employed under short periods of notice and have more restricted sick pay schemes and fewer opportunities for career advancement, and the employer invests less in their job training than in that of non-manual employees. Overall, there is little motivation for employers to put extensive effort into securing the employment relationship with these workers (White, 1991; see also Goldthorpe, 2007). In turn, because the work tasks in the (upper non-manual) service classes are more diffuse, employees here are better protected if the required work assignments change. The more demanding tasks typical of service relationships also give employers a reason to invest in longer and more intense training and education. The means of motivating workers to commit to their work also differ. Under a (manual) labour contract, rewards for commitment are typically more concrete and short term, such as piecework extras or overtime wages. Under (upper non-manual) service contracts, for which direct monitoring is difficult, employees can be motivated by means that are more long term in nature; for example, they may be offered opportunities for career development (Goldthorpe, 2007). In addition, Tåhlin (2007), despite being generally critical about the definition of social classes being based on employment relations, found a strong relationship between social class and the replaceability of employees. Several analyses, covering Austria, Denmark, Germany, Italy, Netherlands, Spain, Sweden and the UK (Chan and Goldthorpe, 2007; Dieckhoff, 2011; Elias and McKnight, 2003; Gallie et al., 1998; Kurz and Steinhage, 2001; Layte et al., 2000; Lucchini and Schizzerotto, 2010; McGinnity and Hillmert, 2004), have further empirically confirmed the relationship between social class and unemployment.
Almost any kind of time trend in the class–unemployment association can be expected on the basis of previous literature. First, the structural change in labour markets towards knowledge-intensive industries could favour the upper non-manual class. White (1991: 127–128) and Breen (1997: 481) have predicted that the development of information technology in the future may, increasingly, expose routine (lower) non-manual classes to similar types of unemployment risks traditionally faced by the manual classes, especially as their jobs will become easier to monitor and are more likely to be automatized. It is possible that further technological advancement will generally disfavour routine and less skilled occupations, which in turn may lead to further polarization of employment and unemployment patterns between classes. Such polarization has been observed with regard to income, that is, the decline of middle-income occupations relative to low- and high-paid ones (Asplund et al., 2011; Goos et al., 2009). However, the straightforward polarization thesis has also received criticism, especially when a more detailed approach is taken that analyses the content of occupations in addition to mere wages (Fernández-Macías and Hurley, 2016; Oesch, 2013). On the other hand, especially in the public domain, concerns have been voiced about the increasing uncertainty or precariousness of working life. Julkunen (2008: 112–117) sees this discourse as arising mostly from the experience of the ‘creative class’ among upper non-manuals. Moreover, the Finnish working life barometer (Lyly-Yrjänäinen, 2014; see also Mustosmäki et al., 2017) shows that since 2009, subjective insecurity has been higher among the upper non-manual class than the lower non-manual class.
However, earlier analyses of the class–unemployment association show persistency over time (Gallie et al., 1998; Goldthorpe and McKnight, 2006; McGinnity and Hillmert, 2004). Bihagen and Halleröd (2000), in turn, observed a cyclical effect, in which economic fluctuations affected the manual class more strongly than other classes. Goldthorpe and McKnight (2006) observed that social class differences were particularly pronounced among the long-term unemployed.
Gender differences and the role of education
Previous studies on the link between social class and unemployment have mostly considered men only (however, see Layte et al., 2000). Traditionally, social class has often been considered a more suitable indicator of the social position of men or households, and regarded as less relevant when based on the occupations of women (e.g. Erikson and Goldthorpe, 1992: Chapter 7). Although contemporary research has questioned this idea (e.g. Beller, 2009), it is still sometimes argued that social class is essentially a male-centred indicator of social stratification and, thus, it captures inequality among men better than among women (for a review, Bihagen, 2008).
Although the overall difference in unemployment is small between genders, at least in contexts such as Finland (see Figure 1, Eurostat 2018), the unemployment rate is more sensitive to economic cycles among men than among women. This is partly explained by differences in the industry composition of male and female occupations (Albanesi and Sahin, 2013). For example, men are more typically employed in the private sector and women in the public sector. Male overrepresentation in highly unemployment-sensitive occupations can also lead to more polarized social class differences in the risk of unemployment among men, at least during economic downturns.
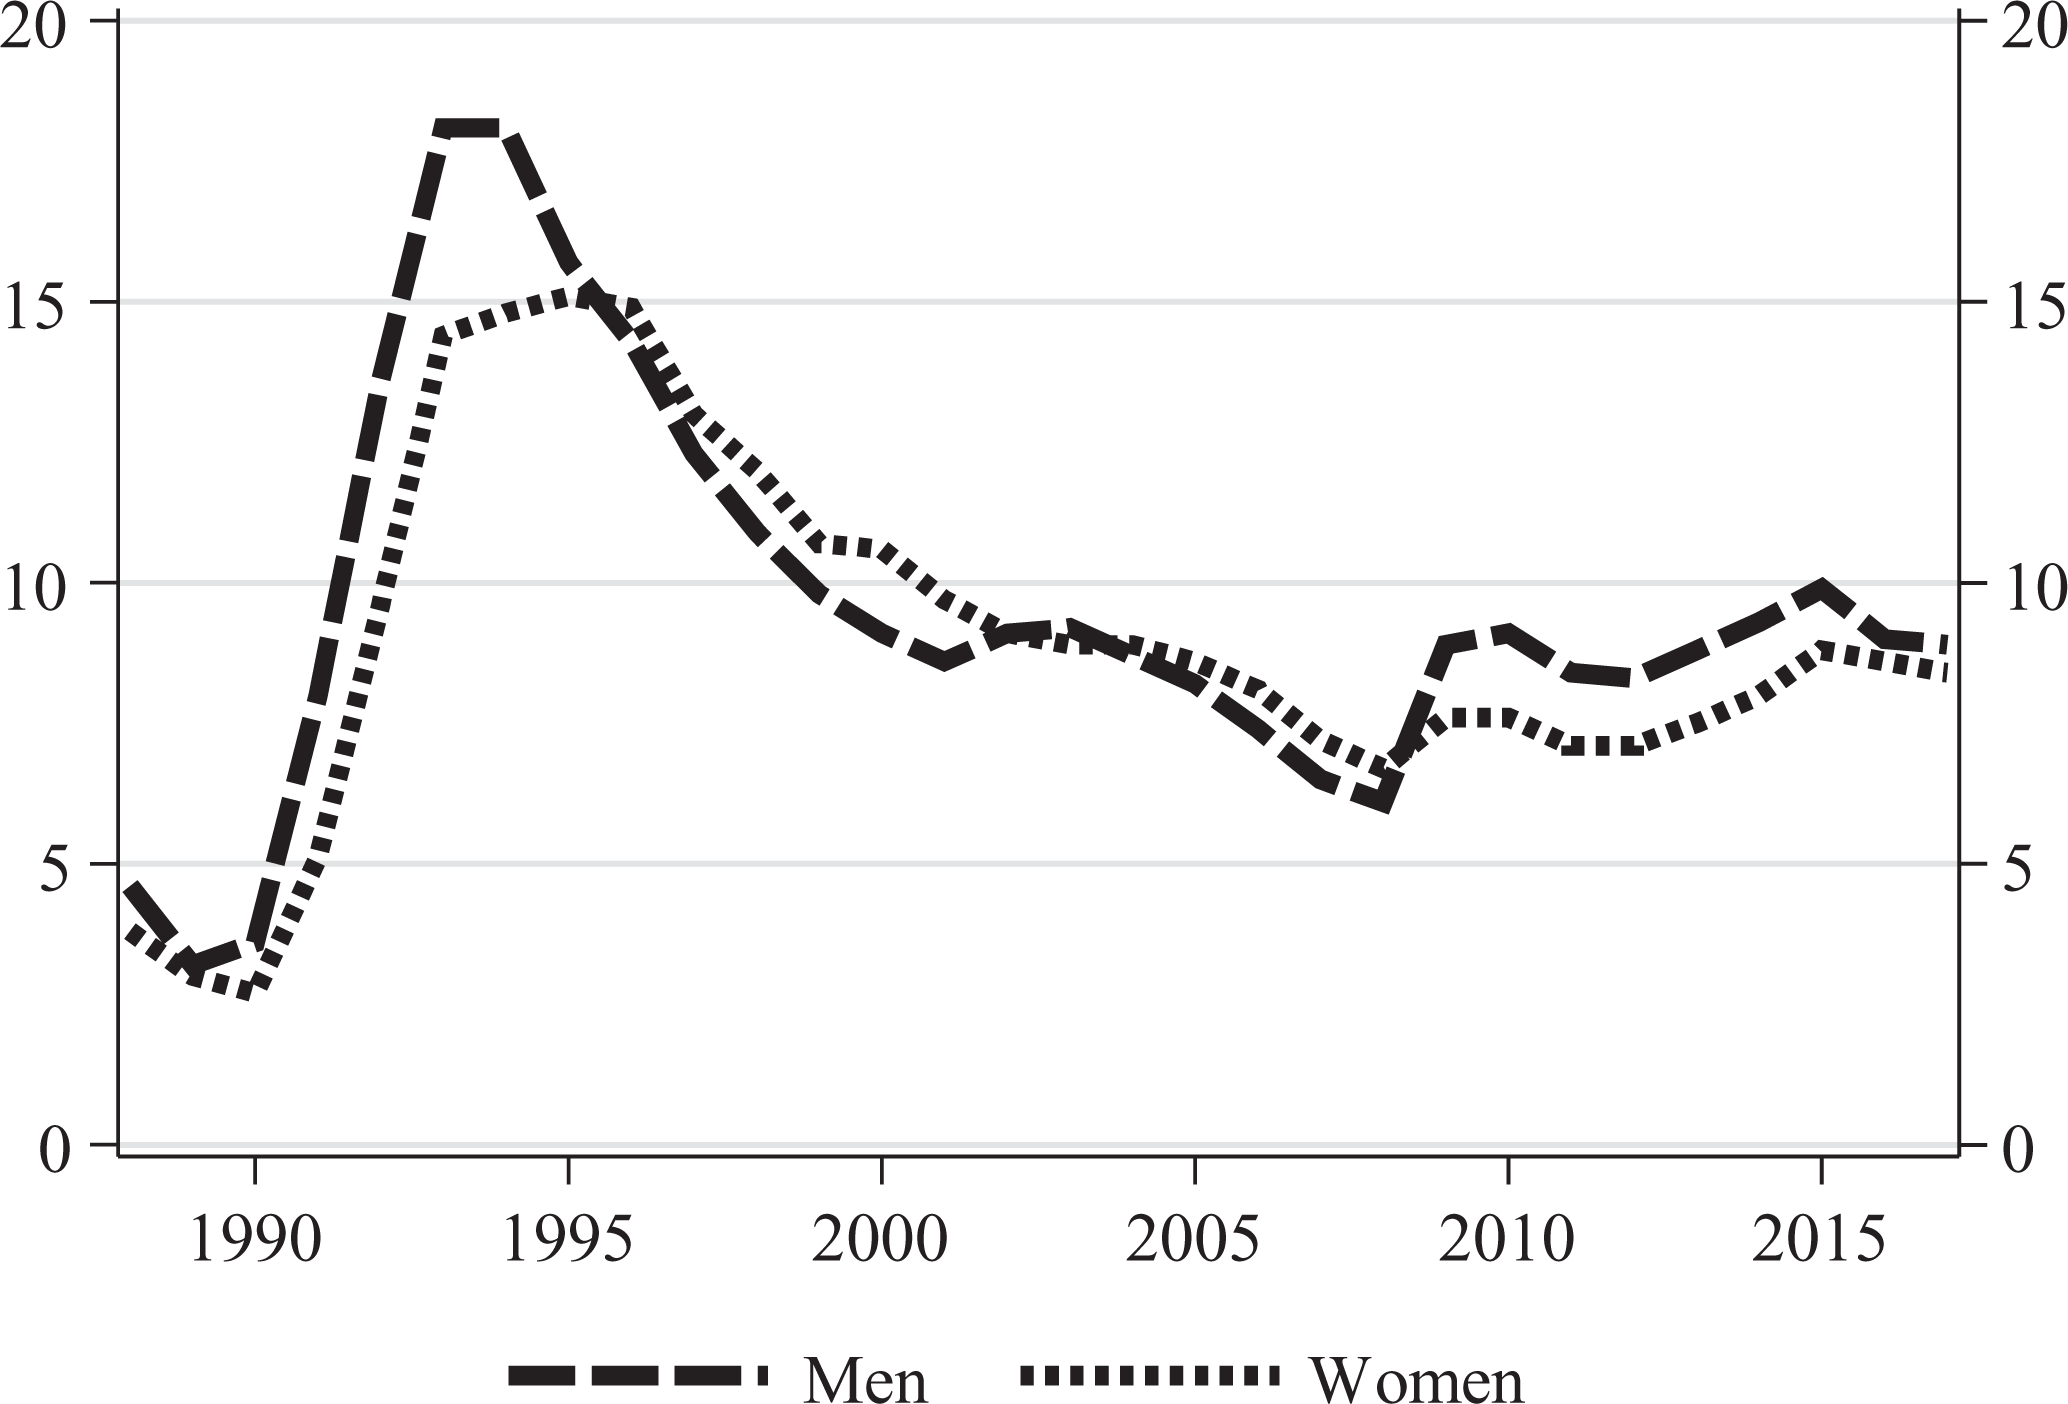
Seasonally adjusted unemployment rate 1988–2017 in Finland by gender (%).
The value of education as protection against unemployment is well known (Klein, 2015) and measured regularly in official statistics. Gesthuizen et al. (2011) identify four mechanisms that expose poorly educated individuals to higher risks of unemployment: (a) displacement, that is, the rise in the population’s average level of education leads to a situation in which those with lower qualifications are pushed out of the labour market; (b) cognitive selection, that is, the more highly educated are perceived as having cognitive competences and may, thus, be retrained more easily; (c) social selection, that is, other forms of competence that employers favour; and (d) discredit, that is, those with the lowest qualifications are harmed by the stigma of being considered deviant.
The strong educational differences among unemployed people and the notion of education being the most important precondition of social class (Hout and DiPrete, 2006) imply that education explains at least part of the social class stratification in unemployment. Moreover, the mechanisms that explain how education and social class contribute to unemployment may be partly similar and partly different in nature. As mechanisms of a similar nature, both education and social class position are connected to skill and human capital development (social and cognitive selection). Relative sorting mechanisms (displacement and discredit) are perhaps more relevant in terms of education, whereas the value of social class in protecting against unemployment can be expected to be more direct as it is based more concretely on the nature of the work contract and employment relations. Three previous studies show somewhat clearer differences in unemployment among social classes than among educational groups (Dieckhoff, 2011; Kurz and Steinhage, 2001; Lucchini and Schizzerotto, 2010). However, these studies did not directly assess the explanatory power of education.
The Finnish labour market context
One of the most substantial structural trends in European economies has been the upgrading of the labour market towards higher-skilled and better-salaried occupations (Oesch, 2013), and in Finland this trend has been, perhaps, even more pronounced than in many other countries (e.g. Fernándes-Macías and Hurley, 2016). This is also seen in social class and educational distributions. The Finnish social class structure has undergone changes since the 1960s, its patterns being similar to those in most other Western countries: the proportion of manual employees has declined and the proportion of non-manual employees has increased, especially among women. Among men, the increase in the non-manual labour force has occurred mostly at the expense of farmers, and the proportion of non-agricultural manual workers has declined to a lesser extent (Erola, 2009; for the sample of this study, see Figure A.1 in the appendix). The average level of education among the working-age population has also increased rapidly in recent decades, especially among women, whose average level of education exceeded that of men during the research period of this study. One possible hypothesis arising from educational expansion is that formal educational qualifications may become less relevant for employment prospects; the importance of other qualities may increase.
Figure 1 shows the large cyclical changes in the Finnish economy that have forcibly affected the level of unemployment. At the end of the 1980s, Finland enjoyed a long-lasting economic boom and the unemployment rate was historically low. At the turn of the 1990s, however, the country faced an exceptionally severe economic crisis, which peaked in the middle of the decade (see Heikkinen and Kuusterä, 2001). Although recovery in the 1990s was rapid, it brought about major structural change in the labour market, and heavy industries gave way to knowledge-intensive sectors. This also introduced structural unemployment, which had previously been very rare. The proportion of long-term unemployed among the entire unemployed population rose from 5% to 30%, and the ratio did not decline even after the recession (Verho, 2005). The decline in overall unemployment rates lasted until 2009, after which the Finnish economy suffered from the global downturn that began with the US subprime crisis. There was a brief period of recovery between 2010 and 2011, after which the economy stagnated again until the end of our study period, 2015.
Occupational gender segregation in Finland is high in comparison to that in Western Europe overall (Bettio and Verashchagina, 2009: 33–34). Moreover, labour force participation (Jaumotte, 2003: 52; OECD, 2012: 259) and unemployment only had a small gender gap (Figure 1., cf. Azmat et al., 2006) throughout the period of the study in Finland. This provides a good research setting for gender comparisons, as Finland can be considered a forerunner in the international trend of increasing women’s labour market participation.
Aims of the study
Although previous studies have taken significant strides towards understanding the effects of social class on unemployment, we have identified several areas in which knowledge of this relationship could be strengthened. Figure 2 presents our research questions (RQs) and the expected interrelationships between the factors studied. First, the size of social class differences in unemployment have been estimated relatively imprecisely so far, which is likely due to the limitations of the data employed in previous analyses and a less specific focus. In this study, we measure social class differences in relation to unemployment risk (RQ 1) more rigorously than before by using administrative data with a large sample size and without possible bias arising from self-reported measures and self-selection of the respondents. In addition, we add to the current knowledge by analysing whether or not social class stratifies the unemployment risks of men and women differently (RQ 2), and by assessing the extent to which education explains the social class differences in unemployment (RQ 3). Moreover, we assess the changes in each of the three RQs during the time period 1988 to 2015.
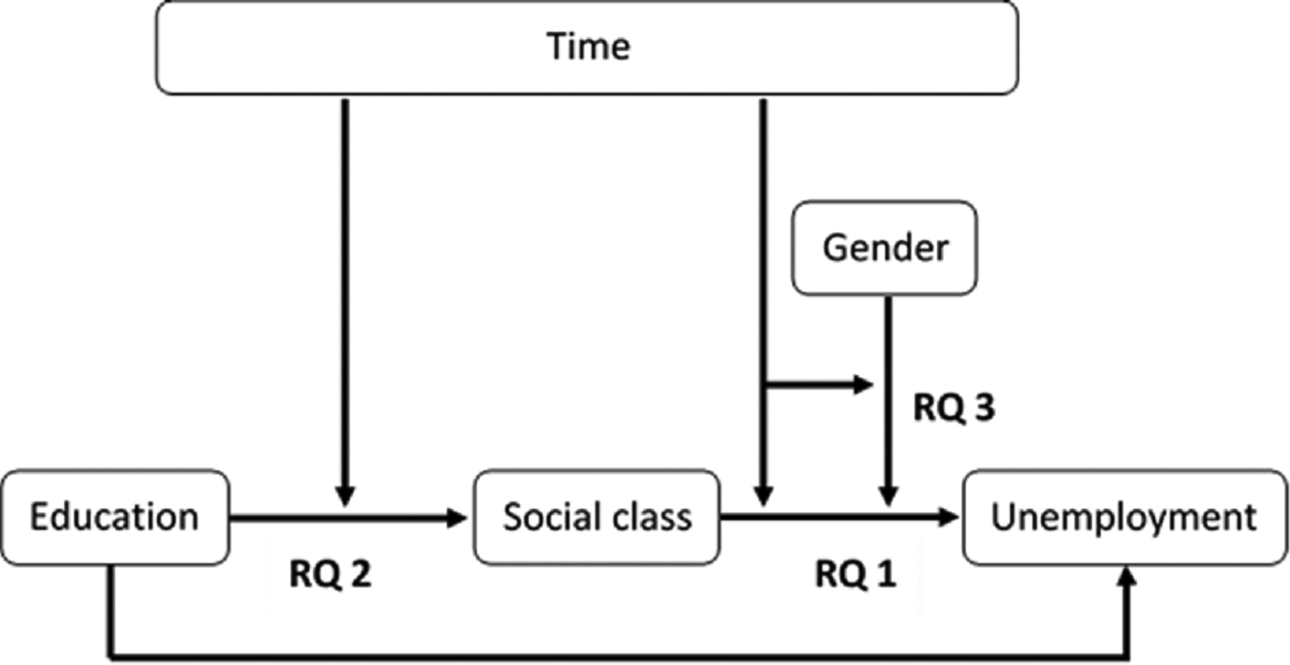
Illustration of our RQs 1–3.
Data and methods
Data and study population
The dataset used in this study is an annually updated, representative 11%, register-based sample of the entire population residing in Finland from 1988 to 2007. Follow-up data for labour market characteristics extends to 2015 using the same population. Personal identification codes allow individual-level information from different sources, including censuses and employment and tax registers, to be combined.
The individuals selected for this analysis were aged between 30 and 59, and belonged to the labour force (that is, they were employed or unemployed for at least one day) during the year of the analysis. Furthermore, our study setting was limited to employees, which excludes groups such as the self-employed and full-time students. This purpose of this limitation was to be able to compare results: unemployment is considered to have a similar nature among employees, and is different from that of the self-employed or students.
The total number of annual observations varied between 81,690 and 92,494 for men, and between 79,763 and 95,626 for women. We set the lower limit of the research population’s age at 30, as previous research indicates that the social class position typically starts to stabilize around this age (Härkönen and Bihagen, 2011). The upper age limit was defined as 59 to avoid possible bias caused by the high rate of disability and old-age retirement among the older age groups. In the case of job loss, older individuals often move into retirement instead of unemployment. Excluding older individuals also reduces the number of discouraged workers, who are most common among older age groups (OECD, 2018). It also makes our data more comparable over time because the average age of retirement substantially increased during the study period (Kannisto, 2014: 49).
Measurement of variables
Unemployment was measured annually as the number of months registered as unemployed. Individuals who were registered as unemployed for 1 to 14 days in a given year were assigned 0.5 months of unemployment. The number of months in the labour force was used as an exposure variable and, again, 0.5 months were assigned to individuals who were employed or unemployed for 1 to 14 days.
Social class was operationalized on the basis of the socioeconomic classification of Statistics Finland (Statistics Finland, 1989), which, in turn, is based on occupation and has four groups: (a) upper non-manual (occupations in this class with a large number of people include, for e.g. school teachers, engineers, professional service managers and software developers); (b) lower non-manual (e.g. sales assistants, nurses, child care workers and secretaries); (c) skilled manual (e.g. lorry drivers, cooks, house builders and mechanics); and (d) unskilled manual (e.g. cleaners, janitors, personal caregivers, storeroom clerks and agricultural workers). 1
Education was based on the highest-attained educational qualification or certificate and was also classified into four groups: (a) basic-level education (typically nine years of education among older cohorts, often less) or unknown; (b) secondary-level education (vocational school or academic upper secondary school); (c) lower tertiary-level education (two to four years of education after upper secondary level, usually in vocationally oriented polytechnic schools); and (d) higher tertiary-level education (master’s or doctoral level degree).
We measured age in linear and squared terms to capture nonlinearity, as middle-aged people had the lowest level of unemployment among the study population. Other controls were native language (Finnish/Swedish/other) and region of residence, which had 22 categories.
For unemployment and time spent in the labour force, we used data that was updated each year. The information on education, age and region of residence was measured from the status on the last day of the previous year of measurement of unemployment. Before 2008, the information on social class was updated at five-year intervals (1985, 1990, 1995, 2000 and 2005), and from 2007 onwards it has been done annually. Hence, social class was measured at the closest possible timepoint before the measurement of unemployment. Gender and native language were included as time invariants.
Methods and modelling strategy
Our analysis followed three phases. First, we measured the proportion of those who were unemployed for at least three months each year by social class. We chose a three-month threshold to filter out less serious frictional unemployment from more stable forms of unemployment, especially structural unemployment. According to a review of studies in Finland (Räisänen, 2002: 16–18), after a three-month spell of unemployment, re-employment starts to become considerably more difficult.
Second, we present Poisson regression models, starting with general analyses that consist of the whole study period and which then proceed to yearly investigations. The dependent variable was the number of months registered as unemployed and exposure was the time in the labour force during the whole period. We present the results as incidence rate ratios (IRR) between different social classes and educational groups throughout the pooled study period in a repeated cross-sectional design. In Model 1a, social class was controlled by including age, age squared, dummies for native language, region of residence and year fixed effects. 2 In Model 1b, social class was replaced by education but it is otherwise identical to Model 1a. In Model 2, we analysed the effect of social class and education, each adjusted for the other, as well as using other controls to assess the explanatory contribution of education. In Model 3, we added interactions terms between continuous year and social class, as well as between year and education, to test for linear time trends.
Third, to assess possible nonlinear time trends, we present figures based on models with interactions between year dummies and social classes. We again present two models that include the same control variables as Model 1a and Model 2 in the previous analyses.
As the dependent variable was a count by nature, it fits the Poisson distribution. 3 The standard errors were clustered within individuals to adjust for the dependency between observations. All analyses were conducted separately for men and women.
Results
In Figure 3, we show absolute proportions of those who were unemployed for at least three months each year. The strong cyclical changes that affected each social class can be seen clearly. However, despite these changes, social classes were in a clear hierarchical order in terms of unemployment risk during the entire period: the higher the social class, the lower the risk. The only exception was the inconsistent difference between skilled and unskilled manual classes before 2011 among women. This difference also existed among men but was smaller when overall unemployment was growing between 1991 and 1994, and between 2013 and 2015. Between 2009 and 2010 the situation was reversed. Earlier in the period, especially, male manual workers had a higher risk of unemployment than manual women, whereas upper non-manual men had a slightly lower risk than corresponding women. These differences began to level out after the turn of the millennium.
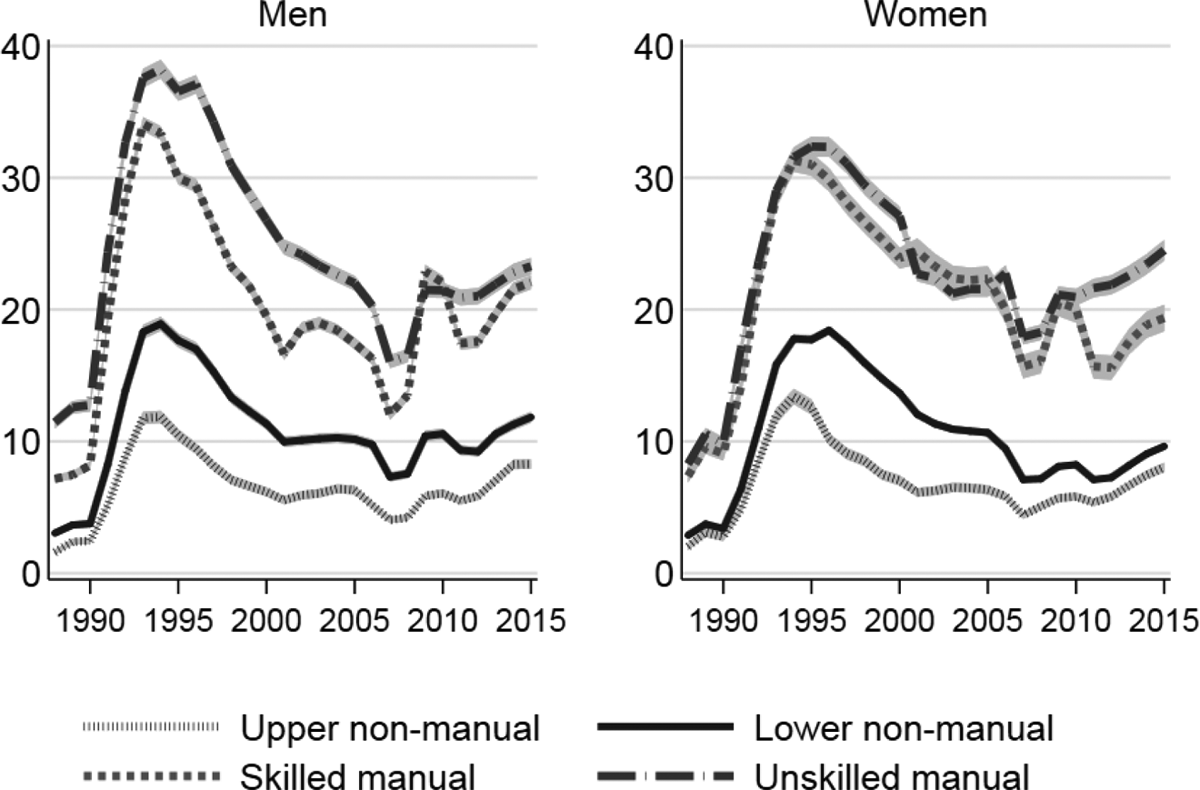
Annual proportions of the 30–59-year-old labour force that had at least three months of unemployment by social class and gender 1988–2015 (%).
Table 1 shows the pooled unemployment risks among social classes throughout the study period. In Model 1a, adjusted for age, age squared, year, language and region of residence but not education, the differences between the social classes were again in a clear order and substantial. The upper non-manual class were at the lowest risk of unemployment, followed by the lower non-manual class (IRR 1.7 among men; 1.4 among women). Among men, this was followed by the skilled manual (IRR = 2.9) and, finally, the unskilled manual class (IRR = 3.7). In contrast, among women, we observed only a small difference between the skilled and unskilled manual classes (IRRs were 2.7 for the skilled and 2.9 for the unskilled manual class).
IRRs (Poisson regression) of unemployment by social class, education and gender.
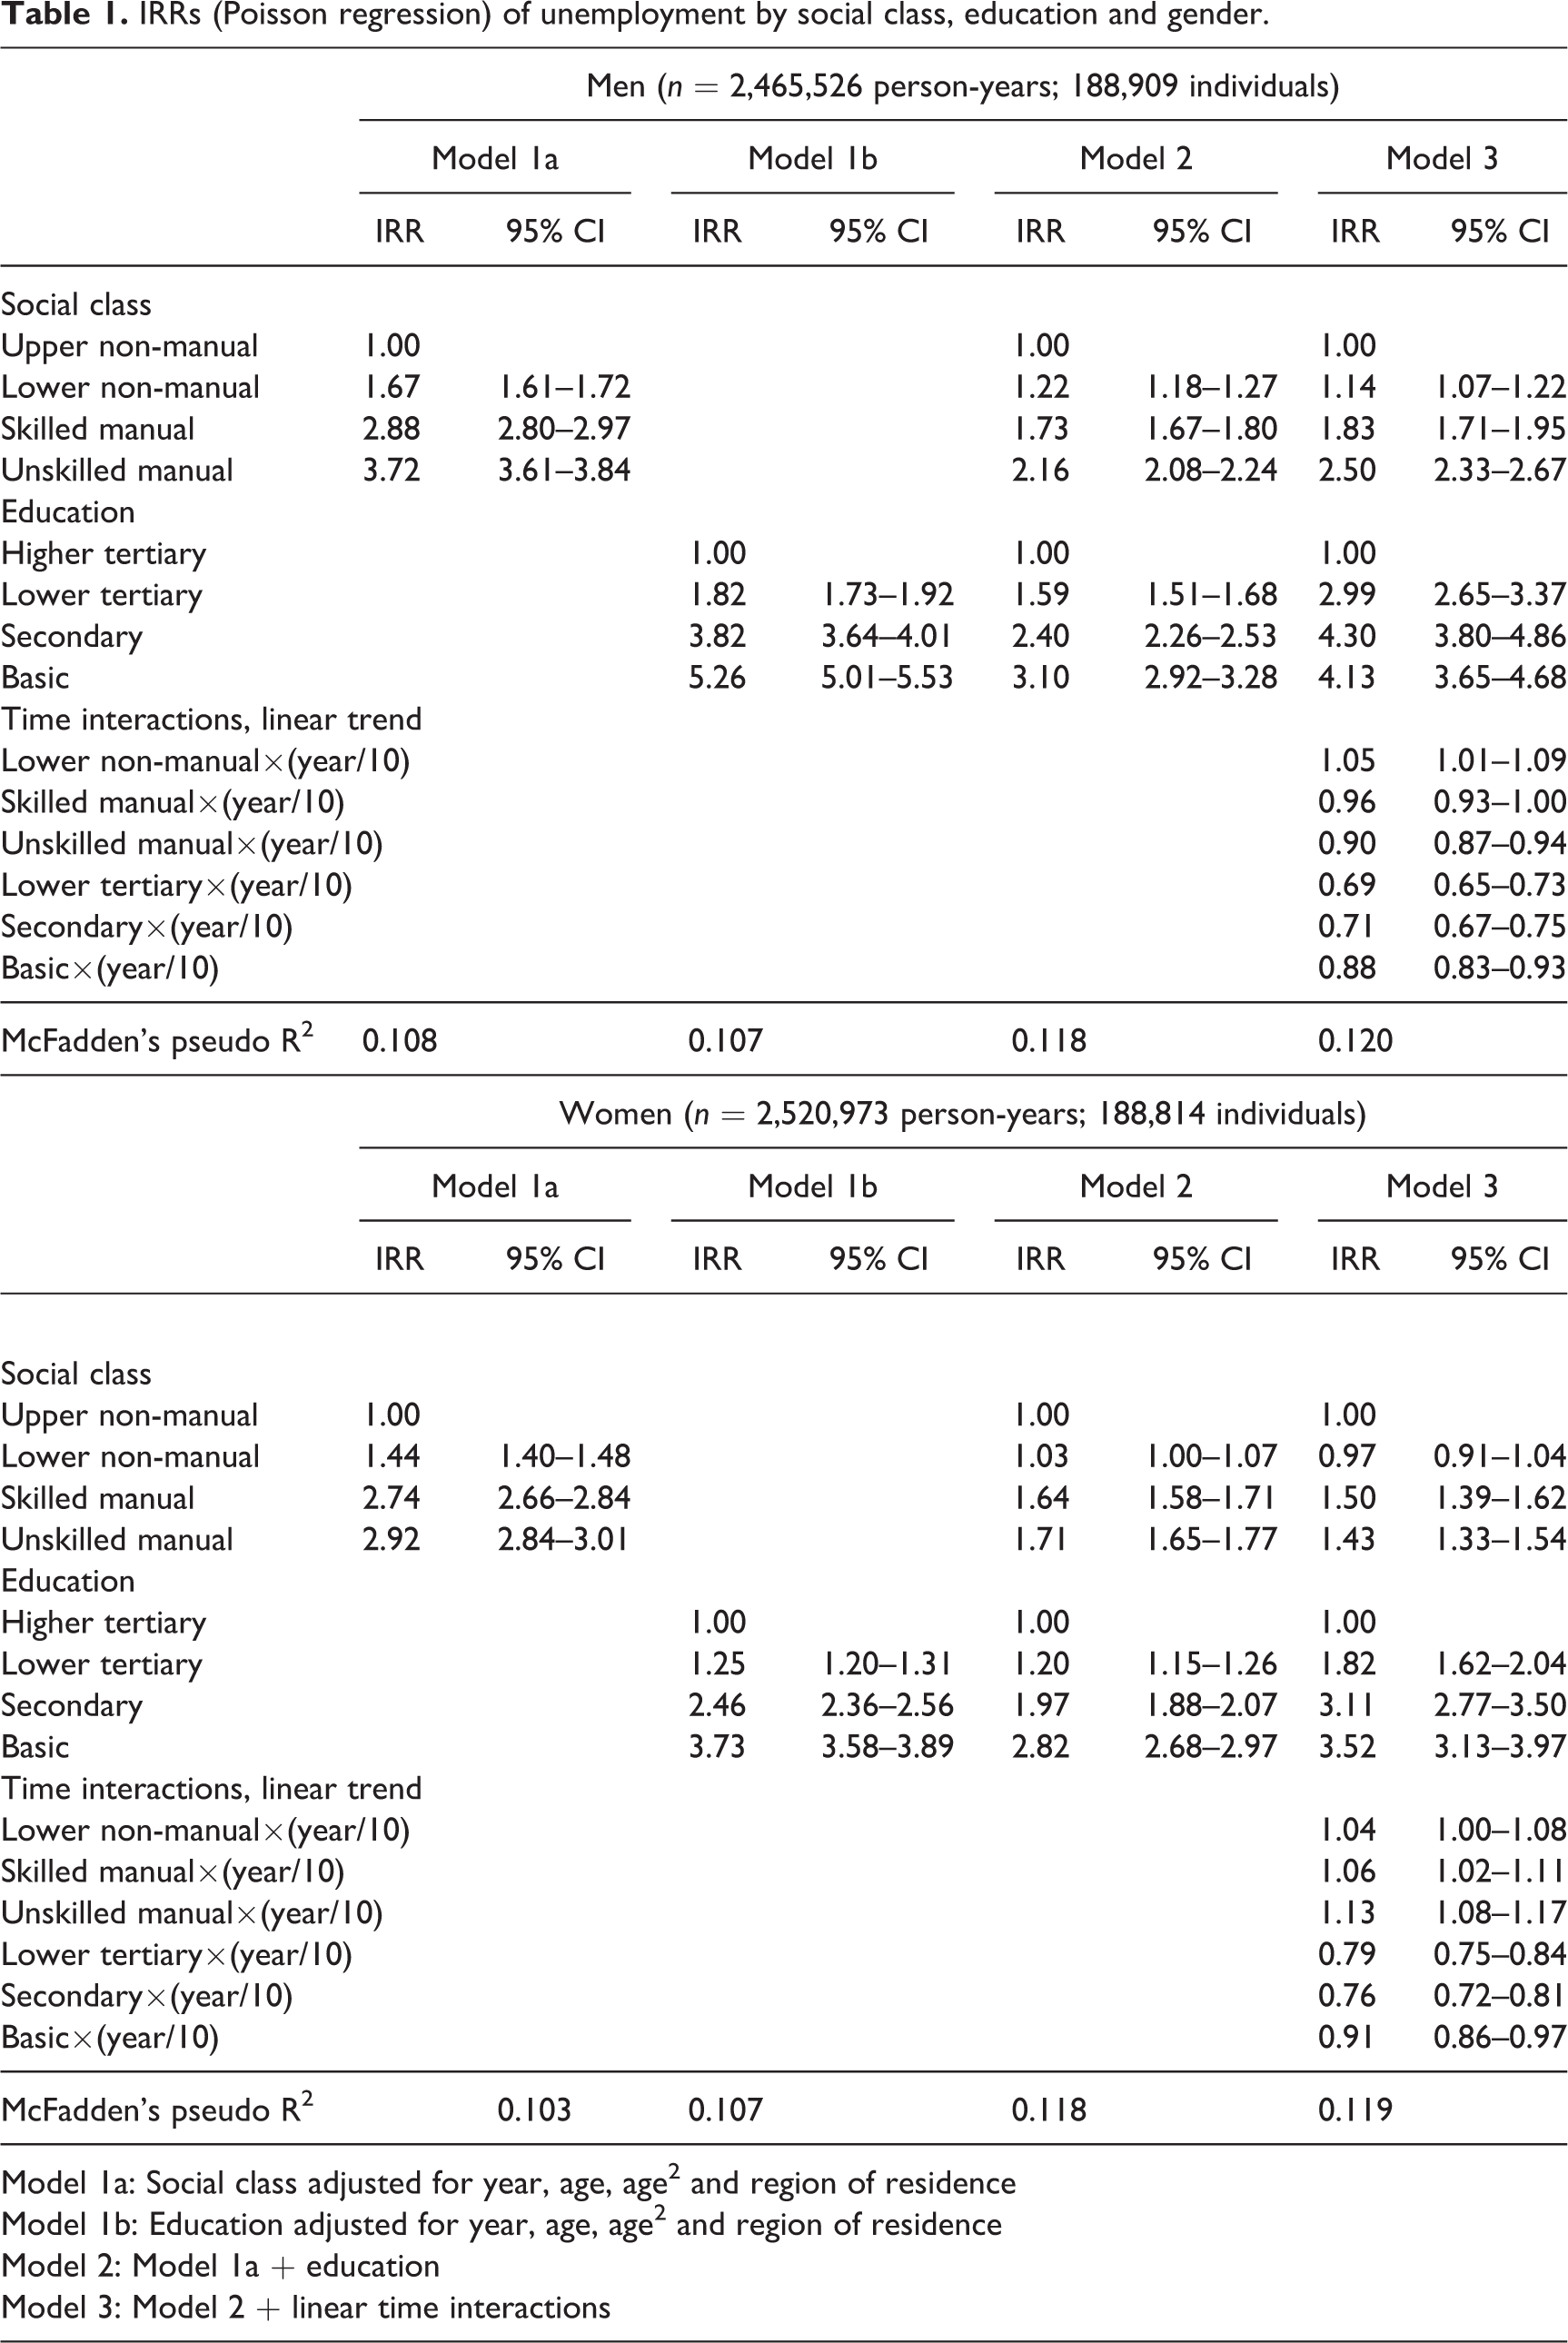
In Model 2, adjustment for education explained 57–66% of the higher risks among the other social classes relative to the upper non-manual class. 4 The only exception was that the excess risk of lower non-manual women was almost fully explained by education. In addition, after controlling for education, we found a clear social class gradient among men. Among women, the manual/non-manual divide was apparent in stratifying unemployment risks, but the differences between upper and lower non-manual, or skilled and unskilled manual classes were minimal. Gender differences in the social class coefficients of Model 1a and Model 2 were all statistically significant at p < 0.0001 in all comparisons, except in the skilled manual class in Model 1a (p = 0.01) and Model 2 (p = 0.03, as calculated by the method recommended by Paternoster et al. 1998).
Comparison of the coefficients of education and social class in Model 1a, Model 1b and Model 2 reveals that education is a somewhat stronger predictor of unemployment in terms of IRRs. However, before drawing wider conclusions with regard to the overall importance of these factors, it should be noted that social class had a more uniform distribution than education. In particular, the number of individuals with higher tertiary education was much smaller than number of those in the upper non-manual class (see Figure A.1 in the appendix). For instance, the McFadden’s pseudo R2 figures indicate roughly equal explanatory power for social class and education.
Next, we turn our attention to the time-related differences in Model 3, in which we tested the possible linear time trends using interaction analysis. Among men, a trend of increasing relative risk was observed among the lower non-manual class, whereas the excess risk among the upper non-manual and unskilled manual classes decreased slightly over time. Among women, the unemployment risk increased over time among each class in comparison with the upper non-manual class. However, the effect sizes of these trends were relatively modest. In turn, the advantage of having higher education in terms of unemployment risk weakened over time and the trends were generally stronger than those of the social class.
Figure 4 shows a more elaborate analysis of changes over time, in which social class and year were both interacted as categorical variables (Figure A.2 in the appendix shows the corresponding predicted incidences of unemployment months). In Model 4, the relative unemployment risks across social classes were relatively stable over time, considering the large cyclical and structural changes in the labour market during this period. Three things, however, should be noted. First, before the recession of the 1990s, men in the manual classes were at a markedly high relative risk of unemployment with considerable annual variation, both of which diminished during the recession. However, as the absolute unemployment rate was very low during this period, even small changes in absolute unemployment are seen strongly in the relative risks. This is apparent when the results of Figure 4 are compared with those of Figure 3 (and Figure A.2 in the appendix). Although the IRRs between the social classes diminished, the absolute gap presented in Figure 3 increased from 10 to almost 30 percentage points. This result is in line with the observations of Bihagen and Halleröd (2000) in Sweden, which also suffered a recession during this period. A similar pattern was seen among women too, although to a much more limited extent. Second, skilled manual workers are more sensitive to economic downturns than other classes. Third, the relative risk of the lower non-manual class was curvilinear over time, also suggesting a cyclical association. The 1990s saw a trend of growing differences in unemployment between the upper and lower non-manual classes, especially among women. However, the differences narrowed again during the last years of our study period. In addition to the narrowing gender differences with regard to the risk of unemployment between the upper and lower non-manual classes, at the very end of our study period the relative risks between the skilled and unskilled manual classes diverged among women, which produced an essentially similar social class hierarchy to that of men.
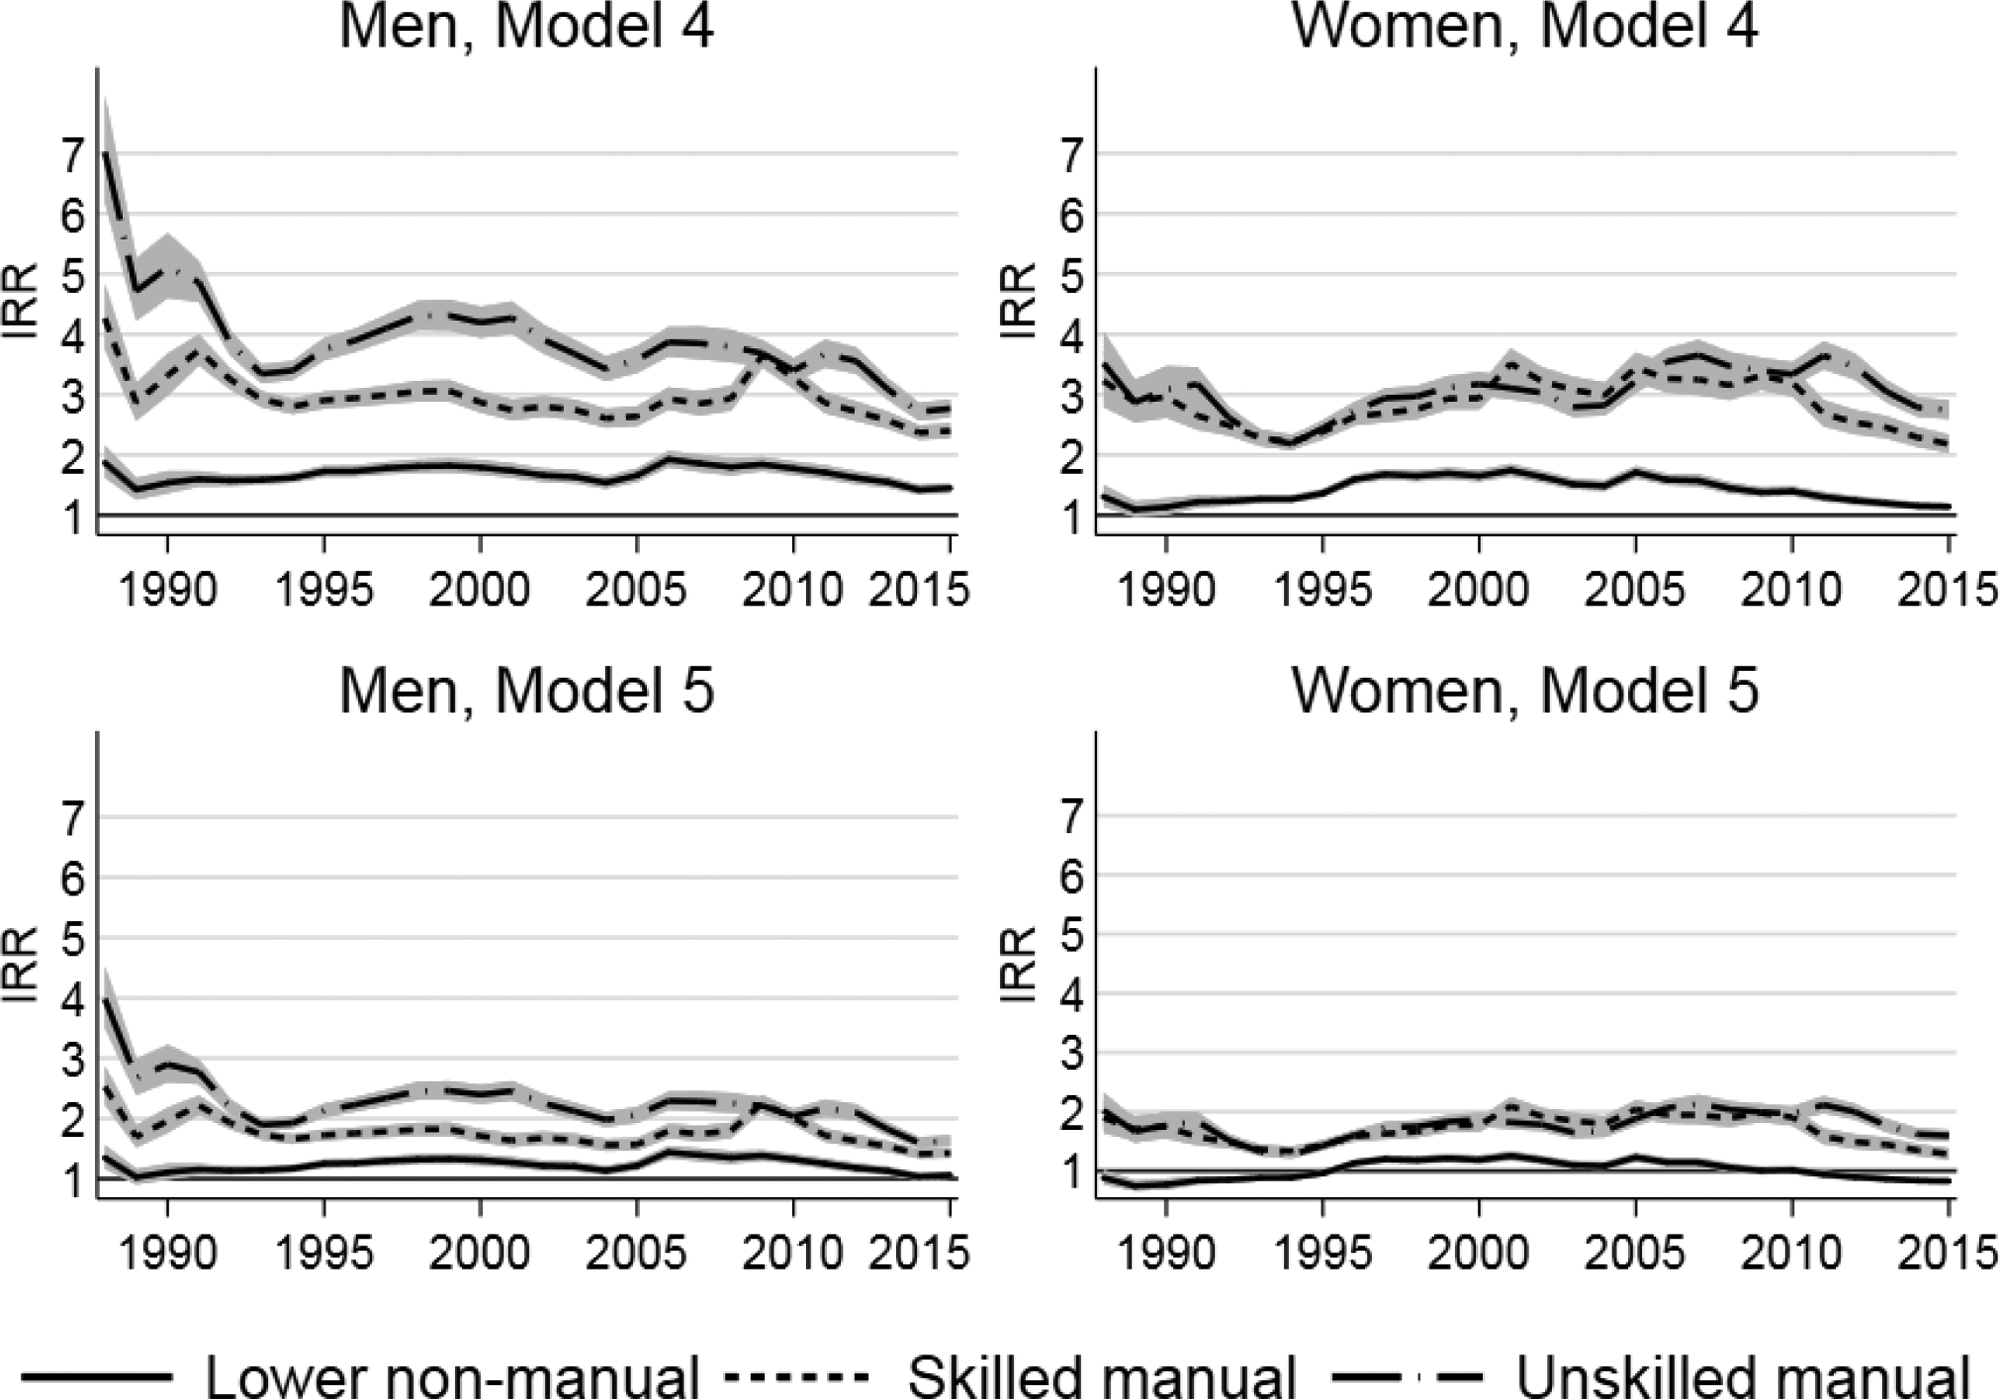
Yearly IRR (Poisson regression) of unemployment 1988–2015.
After adjustment for education in Model 5, women in a lower non-manual class position actually had the lowest unemployment risk until 1995 (however, the difference was not statistically significant in 1988). In addition, among men, no significant differences remained between the non-manual classes between 1989 and 1990 after adjusting for education. As in Model 4, the difference between the lower and upper non-manual classes narrowed again at the end of the period. Among women, the difference was not statistically significant in 2004 or between 2008 and 2011, and from 2012 onwards the lower non-manual class were again at a significantly lower risk at the conventional 95% level. Among men, the difference between lower and upper non-manual classes was not significant in 2014 and 2015.
Among women, we observed that in addition to diminishing social class differences during economic downturns, the explanatory power of education increased when unemployment was growing (see Figure A.3 in the appendix). The aggregate-level correlation between the change in unemployment rate of the previous year, and the yearly attenuation percentage between Model 4 and Model 5 was 0.55 for the lower non-manual, 0.49 for the skilled manual and 0.53 for the unskilled manual class (p < 0.01 in all three cases) among women. Among men, in turn, we observed no consistent or statistically significant pattern in the explanatory power of education over time.
Discussion
Overall findings
In this study, we estimated the extent to which the risk of unemployment differed between social classes in Finland between 1988 and 2015 among male and female employees. The results showed a clear hierarchy between social classes. After adjustment for age, native language and region of residence, the upper non-manual class were at the lowest risk of unemployment, followed by the lower non-manual (1.7-fold among men and 1.5-fold among women compared to the upper non-manual class), the skilled manual (2.9-fold among men and 2.7-fold among women) and the unskilled manual classes (3.7-fold among men and 2.9-fold among women). Social class inequality in unemployment in Finland seems to have been roughly equal to that of, for example, the UK in the 1990s (Gallie et al., 1998: 143; Goldthorpe and McKnight, 2006: 113).
In our examination of temporal changes, we observed stability in the relative risks, despite strong cyclical and structural changes in the labour market. This observation corresponds to earlier studies, which have analysed temporal changes in Germany, Sweden and the UK (Bihagen and Halleröd, 2000; Gallie et al., 1998; McGinnity and Hillmert, 2004) in the 1990s, and our study extended this observation to the 2000s. Thus, our results do not support the claim that the importance of social class in employment security is declining (Beck, 2000). In addition, the predictions of White (1991) and Breen (1997), who expected that the routine non-manual classes would increasingly face risks similar to those traditionally faced by the manual classes, did not receive strong support, either. Instead, our results are in line with those of McGinnity and Hillmert (2004: 401), who emphasized that skills or task routineness are, theoretically, important in explaining overall and relatively persistent unemployment differences. However, they also support previous observations (e.g. Fernández-Macías and Hurley, 2016; see also Mustosmäki et al., 2017) indicating that these factors cannot explain the trends of labour market polarization over time (Asplund et al., 2011; Goos et al., 2009).
However, despite the absence of strong secular trends, we did observe some cyclical changes. Here, skills or routineness may well play a role. Greater specialization in skills can possibly lead to greater unemployment risk when times are hard. The occupations of skilled manual workers are more often in industries, construction, for example, that are more sensitive to economic cycles than occupations of other classes. Interestingly, we also saw an analogous relation between required skill level and the risk of unemployment among non-manual classes, as we observed greater cyclical sensitivity among the upper than the lower non-manual class.
Gender
During the overall study period, the social-class differences in unemployment were somewhat more distinct among men than women, but the differences between genders converged over time. Non-manual classes had a lower risk of unemployment than manual classes for both genders. Among women, the difference between the skilled and unskilled manual classes only emerged from 2011 onwards.
The idea that social class is declining in importance as a determinant of life chances has been argued from a specific direction, namely, that social class is essentially a male-centred indicator of social stratification. According to this argument, the progression of women in the labour market would lead to the diminishing of the importance of social class (for a review, Bihagen, 2008). Some changes in the labour market positions of women could, indeed, be seen in the Finnish labour market, for example, a slight but steady decline in gender segregation (Brynin and Perales, 2016; Ministry of Social Affairs and Health, 2007) and an increasing level of education among women. However, our results point towards an alternative interpretation. Social class does not lose its significance as the attachment of women to and their progression in the labour market grows, as this is accompanied by another concurrent trend, namely, the increasing social class differentiation of women’s unemployment patterns. This observation is also in line with class difference trends in income (Bihagen 2008; Erola 2010; McCall 2008) as well as in many other job quality-related indicators among women, such as control over work and on-the-job training opportunities (Mustosmäki et al., 2017). It is possible that other countries in which female labour market participation is still increasing rapidly will follow the labour market patterns observed in Finland, a country with a long history of high rates of full-time labour market participation among women.
Education
Education attenuated roughly two-thirds of the social class differences in unemployment. The explanatory role of education was, perhaps, somewhat greater than that which could be (indirectly) expected based on previous analyses (Dieckhoff, 2011; Kurz and Steinhage, 2001; Lucchini and Schizzerotto, 2010). This could be because of the particularly strong role of education in Finnish socioeconomic achievement in general (Erola et al., 2016). Education in Finland is free of charge and, thus, relatively widely available for adolescents from all backgrounds. Moreover, many jobs require formal education. The contribution of education in explaining the difference between upper and lower non-manual classes in unemployment was greater among women than among men; no gender difference was observed in its contribution to the excess risk of manual classes.
The explanatory power of education had no consistent trend. However, the correlation between social class and education was consistently strong among men (Spearman’s ρ around 0.60), whereas among women it grew over time (Spearman’s ρ from 0.45 to 0.60, see Figure A.4 in the appendix). Interestingly, this increasing correlation among women did not contribute to the increase in the explanatory power of education with regard to the class–unemployment association. In addition, the education–unemployment association independent of social class declined over time. This may imply that a growing unique dimension of social class contributes to unemployment.
Methodological considerations
Using register-based data enabled us to overcome many of the limitations faced by previous survey-based studies. These include problems related to self-selection of the respondents, limited statistical power, and social desirability or memory failure biases in self-assessments of unemployment. In addition, we were able to measure the exact number of months of yearly unemployment and employment instead of, for example, the dichotomous outcome variables used in many previous studies. Furthermore, we were able to analyse change over time for almost 30 years.
We must also address the limitations. First, before 2007, information on social class was only available every five years, which may have produced measurement error, especially among the younger age groups. However, this bias is likely to be minor because we used broad class categories and identified social class for the closest previous year available. Second, transition to parental leave could work as an alternative to unemployment. This may lead to an underestimation of the effect of economic cycles on the unemployment of fertile-age women especially and, as such, bias our gender comparisons. However, Vikat (2004) observed that employment uncertainty only had a small individual-level effect on the decision to enter motherhood during the recession of the 1990s. Moreover, in our data, we observed only a small increase and modest social class differences in the overall proportion of the labour force exiting the labour market during economic downturns (see Figure A.5 in the appendix). Thus, this bias is unlikely to be substantial.
Third, unemployment can also affect an individual’s social class position in that it can cause the risk of downward career mobility (Gallie et al., 1998; Layte et al., 2000). Downgrading also offers protection from unemployment to those with more advantaged positions because they can sometimes find a new job by trading down their class status. This might have hampered the interpretation of our results. However, the broad social classes we used for our analyses would have required relatively significant job changes to result in changes in class position. We are not aware of evidence that such downward job trading is of significance in Finland. Moreover, this would lead to less unemployment in class of origin and more employment in class of destination, which would partly offset each other. Overall, it must be underlined that our analysis did not aim to provide causal estimates of the effect of social class on unemployment at the individual level. Future studies could investigate the questions of causality in more detail by, for example, investigating within-individual patterns more closely using panel data.
Future studies could also assess potential explanatory factors other than education. For example, social class differences within different industry sectors should be analysed, because industries differ in both their class composition and employment security. Investigating the factors that are, theoretically, relevant in potentially differentiating social class with regard to unemployment risk in a gender-specific way, such as the skill level requirements of different occupations, could further increase our knowledge.
Conclusion
To conclude, our results are in line with the view that social class reflects a fundamental and persistent dimension of social stratification in determining the risk of unemployment – something that is ‘inherent to the condition’ (White, 1991: 110) of differing labour market positions. We observed only modest trend-like changes, indicating converging gender differences. The social class gradient persisted throughout the study period, despite major technological, political and other structural changes in labour markets, such as strong economic downturns in the early 1990s and 2009, or strong occupational upgrading of the labour force, in our context of Finland (Fernández-Macías and Hurley, 2016; Heikkinen and Kuusterä, 2001; Oesch, 2013). Nevertheless, the contextual uniqueness should not be exaggerated, as these major fluctuations and structural trends in the Finnish labour market are essentially similar to those of other advanced economies. Instead, the results correspond to those obtained in previous studies analysing unemployment (Bihagen and Halleröd, 2000, Gallie et al., 1998: 143; Goldthorpe and McKnight, 2006: 113; Lucchini and Schizzerotto, 2010; McGinnity and Hillmert, 2004), as well as to some other labour market outcomes substantiating a more general claim that the patterns of social stratification which affect life chances and result in different risks are stubborn in nature (e.g. Goldthorpe, 2007: 22–23). Our results expand the evidence in relation to unemployment in the 21st century, using powerful data. Research on the effects of social class, which is closely connected to both employment relations (Goldthorpe, 2007) and the content of job tasks (McGinnity and Hillmert, 2004; Tåhlin, 2007), is important in complementing our understanding of the processes of and changes – or persistence – in unemployment.
Footnotes
Author Note
Pekka Martikainen is also affiliated with Stockholm University Karolinska Institutet, Sweden and The Max Planck Institute for Demographic Research, Germany.
Acknowledgements
Special thanks to Joonas Pitkänen for his excellent assistance in the data analysis.
Funding
The authors disclosed receipt of the following financial support for the research, authorship and/or publication of this article: The research was funded by the Academy of Finland (grant numbers 308247 and 294861). Open access publishing was supported by the library and the Faculty of Social Sciences of the University of Helsinki.