
Abstract
Spatial and temporal control of transgene expression is one of the major prerequisites of efficient gene therapy. Recently, a noninvasive, physical approach has been presented based on local heat in combination with a heat-sensitive promoter. This strategy requires tight temperature control in vivo. Here, we use MRI-guided focused ultrasound (MRI-FUS) with real-time feedback control on a whole-body clinical MRI system for a completely automatic execution of a predefined temperature-time trajectory in the focal point. Feasibility studies on expression control were carried out on subcutaneously implanted rat tumors. A stable modified C6 glioma cell line was used carrying a fused gene coding for thymidine kinase (TK) and green fluorescent protein (GFP) under control of the human heat-shock protein 70 (HSP70) promoter. In vitro studies showed strong induction of the TK-GFP gene expression upon heat shock under various conditions and localization of the protein product in the nucleus. In vivo tumors were subjected to a 3-min temperature elevation using MRI-FUS with a constant temperature, and were analysed 24 hr after the heat shock with respect to GFP fluorescence. Preliminary results showed strong local induction in regions heated above 40°C, and a good correspondence between temperature maps at the end of the heating period and elevated expression of TK-GFP.
Keywords
Introduction
Much effort has been put into developing new systems for targeted transgene expression. Several strategies have focused on tissue-specific promoters, for example, the prostate-specific antigen promoter [1]. Other inducible systems require disease-specific gene activation, for example, the carcino-embryonic antigene, which is selectively expressed in a variety of cancer tissues [2]. Hypoxia and angiogenesis genes are overexpressed in areas with limited vasculature. Hypoxia also leads to induction of the suicide gene thymidine kinase (TK) linked to a human alpha-fetoprotein promoter in hepatocellular carcinoma [3]. Hypoxic and necrotic areas may be targeted in tumors with Clostridium promoters normally expressed in anaerobic conditions [4]. Since tumors may not be hypoxic at all locations, induction may not be efficient in all targeted tissues. The tetracycline inducible or suppressible system from the bacterial tetracycline operon has been among the first strategies towards controlled transcriptional activation [5] but does not provide spatial control of induction.
Another approach to control the expression of trans-genes is to use external physical agents. Ionizing radiation may activate TNF-à gene expression under the control of promoter pEGR1 with some spatial and temporal control [6,7]. Many radiosensitive promoters are described, including the C-IAP2 promoter, the WAF1 promoter, and the liver-specific mouse albumin promoter-enhancer [8,9]. However, this induction implies exposing the cells to ionizing radiation and may therefore not be suitable for human use.
It has been demonstrated that the promoter for the heat-shock proteins (HSP) can activate gene expression several thousand fold in response to hyperthermia [10]. It has been suggested to use the HSP70 promoter and local hyperthermia to control transgene expression [11]. The feasibility of the approach has been demonstrated both in vitro [12–14] and in vivo [15], for the expression of suicide genes in implanted mammary cancer cell line [16], and the expression of a reporter gene in implanted C6 cells [17,18]. However, the approach requires accurate temperature control in vivo.
The ability of focused ultrasound (FUS) to heat deep-laying soft tissues has been known long ago, but the strong dependence of ultrasound properties (velocity, attenuation, refraction) on tissue composition and temperature and the unknown heat conduction properties of tissue (related in particular to the role of perfusion), prevented the widespread use of such a technique for local thermal energy deposit. Magnetic resonance imaging (MRI) has been suggested for ultrasound guidance, since it offers both anatomical target visualisation and thermometric capabilities [19,20]. Temperature mapping by MRI [21] has been demonstrated on the basis of different magnetic resonance parameters, in particular, the water proton resonance frequency [22]. With the latter method, it was shown that accurate control of FUS heating by MRI is possible, using rapid magnetic resonance thermometry, rapid data processing, and an interface between the MR computer and the FUS wave generator [23–25].
In a recent study [17], we used the minimal human HSP70 promoter to demonstrate the potential of local hyperthermia to induce in vivo a spatially restricted expression of a transgene, under the control of FUS heating guided by MRI temperature maps using a high-field animal instrument and a home-built FUS system. A transfected C6 rat glioma cell line was used with a plasmid containing the green fluorescent protein (GFP) gene under control of the HSP70 promoter. Local induced expression has been demonstrated with this approach. However, a thorough analysis was hampered by the fact that the used cell line was unstable and the HSP70-GFP containing plasmid gradually disappeared upon tumor growth. In the current article, we report several improvements: (1) the use of a new, genetically stable, C6 construct generated with the help of lentivirus; (2) the use of a fused gene coding for TK-GFP [26] with combined marker (GFP) and therapeutic characteristics (TK) due to the suicide action of TK in the presence of the substrate ganciclovir; (3) the use of state-of-the-art clinical MRI system equipped with an FUS transducer incorporated in the MRI bed with image-guided displacement of the focal point, and improved stability of automatic temperature trajectories.
Materials and Methods
Gene Construct
The fusion gene TK-GFP was extracted from the plasmid ETLGB [26], kindly provided by the Dr. S. Loimas, with restriction enzyme XbaI. It was subcloned in the plasmid Pic20 edifying the plasmid scTG. Then, the fusion gene was digested by restriction enzyme EcoRI, and inserted in the pcDNA3-HS [13], kindly provided by Dr. C. Y. Li. This construct contained the fusion gene under the control of the HSP70B promoter and is called plasmid HT. The construct HSP70-TK-GFP is obtained from the plasmid HT with two digestions with restriction enzymes BglII and SalI. Then, it was inserted in the lentivirus PCS ferroch [27,28], digested by restriction enzymes BamHI and XhoI, leading to the lentivirus construct PHT (PCS-HSP70B-TK-GFP). All restriction enzymes were obtained from Roche (Basel, Switzerland).
Production and Titration of Lentiviral Vectors
Human kidney 293T cells were cotransfected with the packaging construct pCMVDP8.91 (10 μg), VSV-G pMG.G (5 μg), and the PHT vector construct described above (15 μg) [27]. The cells were induced by sodium butyrate (Sigma, St. Louis, MO) and viral supernatant was collected, filtered, and stocked at −80°C. Viral titer was determined using C6 cells with serial dilution of viral supernatant, followed by GFP fluorescence measured with the FACS cytometry (Becton-Dickinson, Franklin Lakes, NJ) using excitation at 488 nm after 5 days of culture to avoid overestimations by pseudotransduction.
Cell Culture and Transduction
Glioma C6 cells were plated on Falcon dishes and grown in DMEM-fetal calf serum (FCS, Sigma-Aldrich, St. Louis, MO) 5% in a water-saturated incubator at 5% CO2. 5 × 10⁵ cells in suspension were resuspended in 2 ml of viral supernatant harvested at 24 hr added of 4 μg/ml polybrenne (Gibco BRL, Carlsbad, CA), corresponding with a multiplicity of infection of 15. The medium is replaced after 8 hr. Heat-sensitive cell line was produced in this way, with lentivirus containing the inducible construction.
In Vitro Heat Shock
Cells were collected at a cell density of 10 cells/ml in a Falcon tube of 50 ml, in fresh medium and put 15 min in a water bath at 37°C. The temperature raise is started in a water bath at 65°C and kept until the temperature reached the desired heat shock target temperature according to a thermocouple placed in a sister tube. When cells reached the target temperature, they were put in a second water bath adjusted at this temperature. The reported duration of heat shock refers to the incubation time in the second water bath. At the end of the heat shock, cells are replaced in the water bath at 37°C for 15 min. They are then plated in 24-well plates. The fluorescence of the GFP and the cell viability are measured for every condition of shock at 0, 4, 8, 12, 24, 28, 32, 48, 72, and 96 hr after the heat shock.
Tumor Implantation and Growth
Transduced cells at around 80% of confluence were collected at a cell density of 105 cells/μl. They were implanted in Wistar rats. The cells were injected subcutaneously in the thigh (approximately 40 × 106 cells). After 2 weeks, the subcutaneous tumor reached a volume of 2–3 ml. Animals were sacrificed 24 hr after the heat shock. The tumors were excised and analyses were performed.
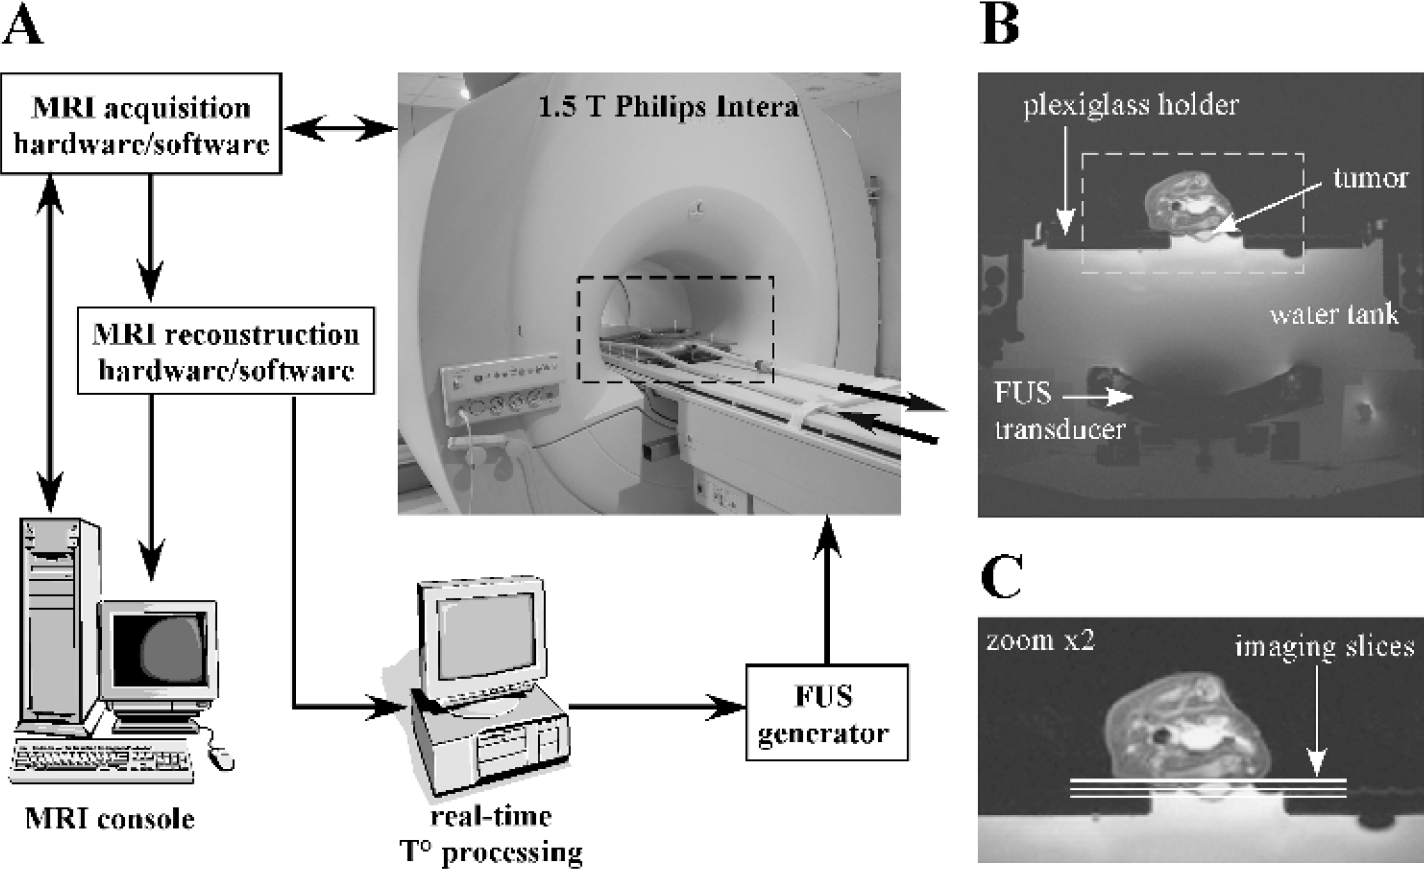
Outline of the MRI-FUS experimental setup and animal positioning. (A) Picture of the clinical MRI system (Philips Intera 1.5 T) with a FUS transducer incorporated in the bed of the MRI (insight broken line). The arrows indicate inflow and outflow of warm water to the animal positioning table for temperature homeostasis. The remainder of the diagram contains the elements of the feedback loop for automatic control of the local hyperthermia. The heart of the system is the workstation for real-time temperature processing. It receives MR data from the MR reconstruction unit, calculates the temperature maps, and derives the FUS generator output for the next cycle. Details of the MR feedback control of FUS heating can be found in Ref. [25]. (B) Axial view of the FUS transducer, the water tank, the Plexiglass animal holder, and the animal with the tumor on its thigh. (C) Close-up of the axial image of the animal with the positioning of the three slices of which continuous temperature data were obtained during FUS treatment. The FUS focal point is located in the middle slice.
MRI-Compatible FUS Equipment and Animal Holder
Ultrasound equipment consisted of a 14-element, concentric-ring, spherical transducer operating at 1.5 MHz with an aperture diameter of 96 mm, a radius of curvature 80 mm, and a maximum acoustic power of 44 W averaged over the electrical duty cycle (Laboratoire Electronique Philips, Paris, France). The FUS transducer can be hydraulically moved along the two axes of the horizontal plane, covering an 80 by 80 mm area with 0.25 mm displacement accuracy along both Ox and Oz axes. Maximum velocity of the probe is approximately 2 mm/sec. The focal length can be electronically adjusted (vertical direction) in the range of 60–110 mm. The focal area has an ellipsoid shape elongated along the beam axis, with theoretical diameters of 1 × 1 × 8 mm. However, experimentally measured value along the beam axis was approximately 12 mm (for further details, see Ref. [29]). Cavitation is not produced in tissue under normal operating conditions. The MR-compatible transducer is integrated in the bed of the clinical scanner. In-house written software in IDL (RSI, Boulder, CO), running on a PC workstation, was used to provide the user interface and on-line data treatment (see Salomir et al. [25] for details on the interface and Figure 1 for details of the experimental setup).
An animal holder was constructed (see Figure 1) equipped with:
An ultrasound coupling system between transducer and animal skin employing water-filled volume pathway (60 mm depth). Water was deoxygenated as described previously [25] to avoid formation of gas bubbles.
A thermostatic water circulator (Poly Science, Niles, IL 60714) in order to maintain a constant temperature of the water bath (38°C) and thus animal homeothermia under general anesthesia.
A detachable Plexiglas support with a circular hole (diameter 40 mm), centered around the (0,0) position of the US probe. A receive-only surface coil of 96 mm inner diameter was centered on the hole with the US beam propagating through its aperture. The animal was placed in a lateral position.
A hermetic cover avoiding anesthesia gas leak in the magnet room. After passage through the animal holder, organic anesthetic vapors were absorbed into an ALDABSORBER filter (Shirley Aldred and Co, Sheffield, UK). The rat body temperature was monitored using an MR-compatible intrarectal thermocouple probe.
MR Temperature Mapping and FUS Feedback Control
Images were acquired using an RF spoiled, multi-shot EPI gradient-echo sequence with nine k-space lines per TR, TR = 300 msec, flip angle 30°, TE = 20 msec (range 18–25 msec), three coronal slices, 64 by 64 matrix size, 80 by 80 mm FOV, 2.3 sec total acquisition time for three slices, slice thickness 3 mm, interslice gap 2 mm, two dummy dynamic scans. The central slice contained the focal point and the outer slices served to monitor the thermal build-up outside the focal point for safety reasons. Magnitude and phase MR data were transferred on-line from scanner to a dedicated workstation using software supplied by Philips Medical Systems. Relative temperature maps were calculated on-line (< 100 μsec) by subtracting the most recently acquired phase map from the previous one. The phase difference was converted into temperature change using a PRF temperature dependence of 0.010 ppm/°C [24,30]. FUS power was adjusted automatically according to Salomir et al. [25].
A targeted time evolution of the temperature in the focal point was defined prior to the start of each experiment. It consisted of an initial ascending part (a shifted half period of a cosine) with a duration of 3 min, followed by a constant temperature period also with a duration of 3 min. The total duration of the MRI-guided FUS procedure (including positioning of the animal) was approximately 30 min. Animals (n = 7) were exposed to a different level of constant temperature (varying from 44°C to 50°C), while keeping all other parameters constant.
Histological Analyses with Flow Cytometry Following Tumor Dissociation
Excised subcutaneous tumors were kept at 4°C in RPMI 10% FCS. One millimeter thick slices were cut and divided again in small pieces, which were subsequently incubated for 40 min at 37°C in a collagenase solution (collagenase A type IV 1 mg/ml, DNase 0.1% in RPMI). After the addition of FCS (20%), the tumor pieces were triturated in a DNase solution (0.05%). The unhomogeneized fragments were discarded by filtration through a 70-μm cell strainer. After 10 min centrifugation at 180 g, the pellet was resuspended in aliquots of 1–2 × 10⁶ cells and stored at 4°C before cytometry analyses. Dissociated cells from either cell cultures or tumors were analyzed using a Fluorescent Assay Cell Sorter (FACS) cytometry (Becton-Dickinson, Franklin Lakes, NJ) with excitation at 488 nm. All tumor pieces were marked according to their location on the tumor for visualisation of the GFP signal measured.
Results
In Vitro Cell Response to Heat Shock
Figure 2 shows examples of the relative expression of the TK-GFP fusion gene following a heat shock. For 42°C (Figure 2A), a strong induction of expression is found for heat-shock durations of 10 and 30 min. The maximum percentage of fluorescent C6 cells is found 12 hr after the heat shock and decreases slowly afterwards. The fluorescence is still detectable until 72 hr. At higher temperatures, the maximum response is found for progressively shorter durations. At 44°C, 46°C, and 48°C, the maximum percentage of fluorescent C6 cells was found following a heat shock of 10 min, 1–3 min, and 10 sec, respectively. The maximum percentage of fluorescent C6 cells is generally found 12 hr after the heat shock, and fluorescence is detectable until 72 hr.
The modified C6 cell line shows a small leak of expression of the transgene at 37°C. The average of fluorescence intensity of the transduced cells is three times higher than nontransduced (wild-type) C6 cells at 37°C. Following heat shock, this increases to 13 times higher. Therefore, the heat-shocked cells show about four times more expression of TK-GFP than the non-heat-shocked. The fluorescence image of a single modified C6 cell is shown in Figure 3. It can be seen that strong fluorescence intensity is found in the nucleus corresponding with transport according to the Nuclear Localisation Sequence of TK. The GFP coproduct is therefore cotransported into the nucleus with TK. Ongoing in vitro studies using various levels of ganciclovir demonstrated a strongly increased sensitivity following heat shock. The details will be presented elsewhere. Here, we will concentrate on the GFP-dependent fluorescence data. The non-heat-shocked inducible population showed a low level of basal expression in correspondence with previous experiments with the HSP70 promoter.

Percentage of fluorescent C6 cells upon time following in vitro expression of the fusion gene by heat shock under various conditions. Maximum temperature of the heat shock was 42°C, and various durations of induction were used.

The fluorescence image of a single modified C6 cell is shown following a heat shock. Cells were photographed under an inverted microscope (IX 50) using a CCD camera (RTE/CDD-768 K). Strong fluorescence intensity is found in the nucleus corresponding with the nuclear localisation sequence of the TK. As fusion gene, the GFP is colocalized with the TK.
Control of FUS Using Magnetic Resonance Thermometry
The methodology of automatic FUS control of hyperthermia was based on “on-line” MR thermometry and a feedback control algorithm as described by Salomir et al. [25]. The position of the tumor with respect to the FUS transducer can be seen in Figure 1. Temperature imaging was performed continuously and simultaneously with respect to FUS heating. Temporal resolution of temperature imaging was 2.3 sec. A typical example of an experiment in vivo is shown in Figure 4. Figure 4A shows the temperature evolution of the volume element that represents the FUS focal point together with the planned evolution. It can be seen that the actual temperature evolution closely matches the planned evolution. The temperature stability of the focal point during the time period in which a constant temperature level was planned is close to the noise in the temperature maps and in the range of 1°C (0.9°C for the example given). Figure 4B shows a temperature image obtained at the end of the 3 min heat shock, superimposed on an anatomical image. It can be seen that well-controlled localized heating is achieved within the tumor.
Histological Analyses of Induction of Gene Expression
Twenty-four hours after FUS treatment, the tumors were dissected and cut into several slices. The analysis of the presence of the exogenous GFP was performed on each slice by cytometry following tumor dissection and dissociation using proteases. Figure 4C shows an optical view of the skin and tumor area following heat shock. The dark area shows the area with the highest temperature elevation. The numbers indicate the relative amount of GFP+ cells as obtained by cytometry. The highest percentage of cells expressing an elevated level of these proteins is clearly observed in an area corresponding to the focal point location. Induction of expression is found in areas corresponding with at least 40°C at the end of the heat shock, in agreement with the in vitro response of the modified cell line (data not shown). The cells extracted from the heat-shocked tumor show a 30–50% higher fluorescence intensity than the cells shocked in vitro, and five to six times higher than the nonshocked cells in the nonheated area. A similar qualitative correspondence between temperature maps and percentage of GFP-positive cells was found for all animals (n = 7). A quantitative analysis of the results is underway.
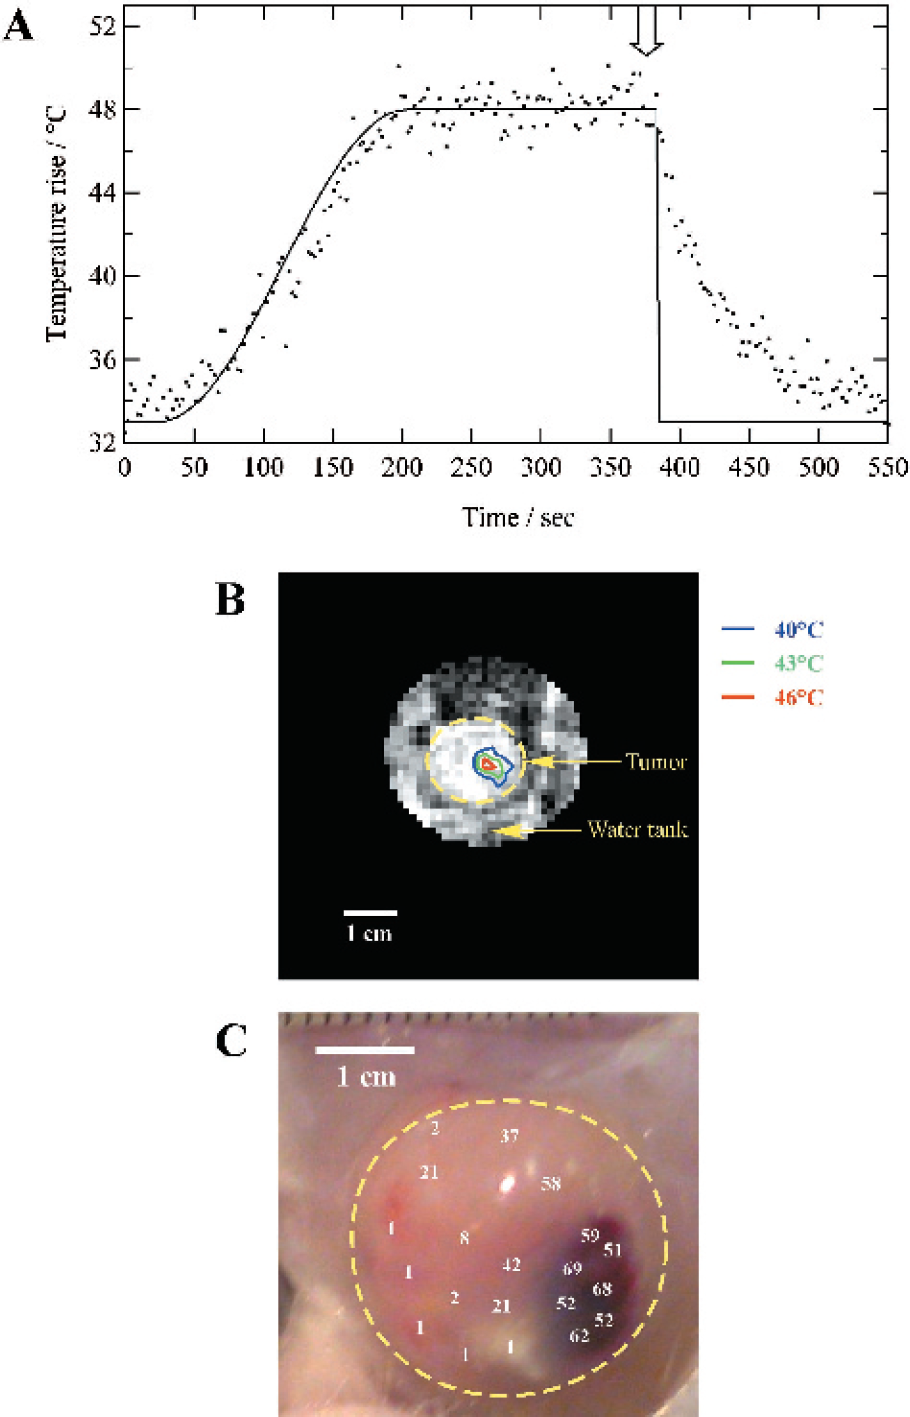
(A) the temperature evolution of the volume element that represents the FUS focal point together with the planned evolution. MRI data are obtained simultaneously with FUS treatment. It can be seen that the actual temperature evolution closely matches the planned evolution. The temperature stability of the focal point during the time period in which a constant temperature level was planned is close to the noise in the temperature maps and typically in the range of 1°C for the temporal and spatial resolution used. (B) Temperature image obtained at the end of the 3 min heat shock, superimposed on an anatomical image with a yellow broken line surrounding the tumor. (C) Optical view of the skin and tumor area following heat shock with a yellow broken line surrounding the tumor. The numbers indicate the relative amount of GFP+ cells as obtained by cytometry 24 hr after the heat shock. The highest expression level of these proteins is clearly observed in an area corresponding to the focal point location. Induction of expression is found in areas corresponding with at least 40°C at the end of the heat shock.
Discussion
The ability to express a gene of interest under the control of a thermo-sensitive HSP70 promoter has been demonstrated with stably transfected C6 cells in vitro and in vivo. The gene of interest was a fusion gene (containing a marker, GFP, and a “suicide gene,” TK). The physical factor controlling expression is temperature. In vitro results have demonstrated that temperatures between 42°C and 48°C led to strong induction with a maximum TK-GFP concentration at about 12 hr with a persistent high concentration up to about 72 hr. The optimum induction period depends on the temperatures used, and varied between 30 min for 42°C to about 10 sec for 48°C. The procedure therefore requires tight spatial and temporal control of temperature in vivo. This has been made possible in vivo with the recent development of FUS heating under MRI feedback control.
The current study was limited to an evaluation of the GFP component of the fusion protein. The results in vivo have shown that the areas of expression clearly correspond with the regions of increased temperature and also correspond qualitatively with the induced expression in vitro.
The future interest of the TK component is twofold. Expression can be mapped by PET using the ganciclovir analogue [18F]fluoroganciclovir, and a therapeutic action can be induced by addition of ganciclovir itself. These studies are currently in progress.
The technique described in the present work may find widespread applications in the field of tissue repair, control of local inflammation, and modulation of apoptosis. Control of inflammatory reactions and tissue repair after surgery with strategies of conditional expression of anti-inflammatory cytokine or growth factor delivered locally during the surgery step might become possible.
Footnotes
Acknowledgments
We thank Veronique Bouchaud; Pr. Nicolas Grenier for assistance, discussions, and support during this project; Dr. S. Loimas for a kind gift of the plasmid ETLGB; and Dr. C. Y. LI for the plasmid pcDNA3-HS. This research was supported by “La Ligue Contre le Cancer,” France, the Conseil Regional d'Aquitaine, and Philips Medical Systems.