
Abstract
Cancer cells invade by secreting degradative enzymes which, under normal conditions, are sequestered in lysosomal vesicles. The ability to noninvasively label lysosomes and track lysosomal trafficking would be extremely useful to understand the mechanisms by which degradative enzymes are secreted in the presence of pathophysiological environments, such as hypoxia and acidic extracellular pH, which are frequently encountered in solid tumors. In this study, a novel method of introducing a fluorescent label into lysosomes of human mammary epithelial cells (HMECs) was evaluated. Highly glycosylated lysosomal membrane proteins were labeled with a newly synthesized compound, 5-dimethylamino-naphthalene-1-sulfonic acid 5-amino-3,4,6-trihydroxy-tetrahydro-pyran-2-ylmethyl ester (6-O-dansyl-GlcNH2). The ability to optically image lysosomes using this new probe was validated by determining the colocalization of the fluorescence from the dansyl group with immunofluorescent staining of two well-established lysosomal marker proteins, LAMP-1 and LAMP-2. The location of the dansyl group in lysosomes was also verified by using an anti-dansyl antibody in Western blots of lysosomes isolated using isopycnic density gradient centrifugation. This novel method of labeling lysosomes biosynthetically was used to image lysosomes in living HMECs perfused in a microscopy-compatible cell perfusion system.
Introduction
Malignant tumors can invade surrounding tissues and metastasize to distant sites throughout the body. Proteolytic enzymes, which degrade extracellular matrix proteins, are required at several stages in the metastatic cascade, such as the invasion of cancer cells through the stroma of surrounding tissue, detachment of single cells from the solid tumor, and intravasation and extravasation of metastasizing cancer cells [1–3]. Overexpression and increased activity of matrix metalloproteinases [4], serine proteases (urokinase plasminogen activator, plasmin) [5], and cysteine/aspartic proteases (cathepsins) [6] are associated with increased malignancy and increased invasion of cancer cells. Several pro-cathepsins (L, B, and D) [6–8] are sequestered in lysosomal vesicles. Most of these precursors have no proteolytic activity until they are activated in an acidic environment [9]. Cathepsins play a role in cancer progression either by direct degradation of the extracellular matrix [10–12] or by activation of other proteases, such as urokinase-type plasminogen activator [13–15]. The tumor microenvironment, frequently characterized by hypoxia and acidic extracellular pH, may also affect lysosomal trafficking and release of degradative enzymes in cancer cells [16,17]. Therefore, the labeling of lysosomes to noninvasively image lysosomal trafficking would be extremely useful for understanding the mechanisms by which degradative enzymes are secreted by cancer cells.
Lysosomes are membranous organelles found in almost all mammalian cell types. They contain hydrolytic enzymes that are responsible for the intracellular digestion of macromolecules. Lysosomes maintain an intralysosomal pH of about 5 using an H+-pump localized in the lysosomal membrane. There are about 40 types of lysosomal hydrolytic enzymes, including proteases that are optimally active at low pH. Lysosomes are also involved in other functions including antigen processing [18], bone remodeling [19], and the regulation of growth factors [20]. Both lysosomal enzyme expression and lysosomal enzyme activity are increased in tumors with high metastatic potential [21], such as Lewis lung carcinoma [22], melanoma [23], as well as several breast cancers [24,25]. Cancer cells also contain intracellular large acidic vesicles (LAVs, ≥ 5 μM in diameter), in which endocytosed extracellular matrix is digested [26,27]. These LAVs have been detected more frequently in breast cancer cells compared with normal cells and tend to be highly acidified, to a pH of less than 4, which is much lower than the typical lysosomal pH of about 5 [26].
Lysosomes can be visualized in fixed cells by immunofluorescence using antibodies against a lysosomal protein of choice, provided that the protein expression level is high enough to be detected. Lysosome-associated membrane proteins, LAMP-1 and LAMP-2 [28,29], are highly abundant in lysosomal membranes and have been detected in most human tissues [30]. Immunofluorescence staining of LAMPs has been used to visualize lysosomes in fixed cells and tissue.
The following three strategies have been used to label lysosomes in living cells using fluorescence detection. (1) Substrates for lysosomal hydrolytic enzymes, for example, fluorescent casein, have been developed that are cleaved to fluorescent products by these enzymes, releasing a fluorophore that is quenched in the substrate before cleavage. (2) Acidotropic fluorescent probes, usually weakly basic amines, have been applied to accumulate in acidic organelles, such as lysosomes, because their pKa values lead to retention of these molecules in acidic cellular compartments. (3) Fluorescent probes such as dextrans that are endocytosed and then accumulate in lysosomes have also been used to determine the distribution of the lysosomal compartment as well as the intra-lysosomal pH. Typical substrates for lysosomal hydrolytic enzymes, such as FITC-labeled or BODIPY-labeled casein, have been used to monitor lysosomal enzyme activity [31,32] but not to image lysosomes. Although there is a specific interest in the localization of endocytosed extracellular matrix material in breast cancer cells, which has led to the development of an invasion assay using fluorescence-labeled extracellular matrix [26,27], this method is not generally suitable for labeling lysosomes for the following two reasons: (1) it is coupled to the invasion assay and (2) it lacks specificity for lysosomes since LAVs, but not all lysosomes, are labeled. Acidotropic fluorescent probes, such as neutral red [33], acridine orange [34], LysoTracker [35], and LysoSensor [36], target acidic compartments in cells. However, these are not specific to lysosomes since other acidic compartments such as endosomes, phagosomes, secretory organelles, and cell-type specific microvesicles such as synaptic vesicles found in neurons [37,38] also provide an acidic environment to sequester these dyes. The specific pKa value of an acidotropic compound can be used to target a cellular compartment of matching pH value. Since lysosomal pH varies with cell type and cellular environment, this approach of imaging lysosomes requires verification of the lysosomal staining of a given acidotropic probe with an independent technique.
Fluorescent probes that are endocytosed (e.g., FITC-dextran [39]) have been used to measure intra-lysosomal pH in living cells. Again, the uncertainty of distribution of the compound into lysosomes through endocytosis and the dependence of lysosomal incorporation on the incubation time applied [39] necessitate the use of independent verification of lysosomal labeling.
Since most proteins in the lysosomal membrane contain branched oligosaccharides, dansylated glucosamines can be used as a novel targeting strategy to introduce a fluorescent label specifically into the lysosomal compartment. The lysosomal membrane contains a collection of highly glycosylated membrane proteins, the most abundant of which are the homologs LAMP-1 (lgp 110) and LAMP-2 (lgp 120) [28,40–42]. These LAMPs carry up to 20 N-linked glycans each and are expressed in sufficient concentration to form a nearly continuous carbohydrate-covered coat over the luminal surface of the lysosomal membrane [41]. These glycans, which consist of mannose, N-acetylglucosamine, fucose, galactose, and sialic acid moieties, have been shown to protect LAMPs against degradation by lysosomal proteases [43].
We evaluated and validated this new approach to optically image lysosomes, by labeling highly glycosylated lysosomal proteins with the novel compound 5-dimethylamino-naphthalene-1-sulfonic acid 5-amino-3,4,6-trihydroxy-tetrahydro-pyran-2-ylmethyl ester (6-O-dansyl-GlcNH2). The lysosomal localization of dansylated glycoprotein produced from 6-O-dansyl-GlcNH2 in human mammary epithelial cells (HMECs) was identified by two independent methods: (1) colocalization of 6-O-dansyl-GlcNH2 fluorescence with immunofluorescent staining for LAMPs, which are widely used as lysosomal markers, and (2) isolation of lysosomes using isopycnic density gradient centrifugation combined with subsequent Western blot detection of the dansyl group using an anti-dansyl antibody. Finally, this novel method of biosynthetically labeling lysosomes was applied to image lysosomes in living HMECs that were perfused in a microscopy-compatible cell perfusion system, by confocal laser scanning microscopy.
Materials and Methods
Cell Culture
Four HMEC lines representing different stages of malignancy were used in this study. MCF-12A, a spontaneously immortalized nonmalignant cell line established from MCF-12M mortal cells [44], was obtained from the American Type Culture Collection (ATCC, Rockville, MD) and cultured in DMEM-Ham's F12 medium (Invitrogen, Carlsbad, CA) supplemented as described previously [44]. MCF-7, an estrogen-sensitive lowly metastatic mammary epithelial cancer cell line, was obtained from the ATCC and cultured in EMEM medium (Mediatech, Herndon, VA) supplemented with 10% fetal bovine serum and antibiotics [45]. Two invasive and metastatic HMEC lines, MDA-MB-231 and MDA-MB-435, were provided by Dr. R. J. Gillies (Arizona Health Sciences Center, Tucson, AZ) and Dr. Joseph Backer, respectively. These cell lines were maintained in RPMI-1640 medium (Invitrogen) supplemented with 10% fetal bovine serum, 100 units/mL penicillin, and 100 μg/mL streptomycin (Invitrogen, Carlsbad, CA). The three human breast cancer cell lines were originally isolated from pleural effusions of patients with breast cancer. All cells were kept in a humidified atmosphere of 5% CO2 in air at 37°C.
Immunofluorescence Staining of HMECs
HMECs were grown on Permanox chamber slides (Nalge Nunc, Naperville, IL) to 70–80% confluence. Cells were washed twice with ice-cold phosphate-buffered saline (PBS) and fixed with 4% paraformaldehyde in PBS for 20 min on ice. Then, cells were washed three times with ice-cold PBS and incubated with 5% normal goat serum in PBS for 30 min at room temperature. Cells were incubated with a 1:50 dilution (dilution buffer consisting of 0.5% bovine serum albumin and 0.01% sodium azide in PBS) of the monoclonal antibodies H4A3 (hLAMP-1) or H4B4 (hLAMP-2) [30] (kindly provided by Dr. J. Thomas August, Johns Hopkins University, Baltimore, MD) overnight at room temperature. This was followed by three washes with PBS. Subsequently, cells were incubated with a 1:50 dilution of a Cy3-labeled goat anti-mouse antibody (Jackson ImmunoResearch Laboratories, West Grove, PA) for 1 hr at room temperature and washed five times with PBS. Cell nuclei were counterstained with a 1:3000 dilution of Hoechst H-33342 (Molecular Probes, Eugene, OR) for 10 min at room temperature, cells were washed, and a cover glass was attached with Fluoromount-G (Southern Biotechnology Associates, Birmingham, AL). Fluorescence microscopy was performed with a Zeiss LSM 410 laser scanning microscope using a 40×/1.2 water immersion lens (Zeiss C-Apo ×40). Cy3 was excited with a 543-nm laser and fluorescence emission was detected with a photomultiplier using a 570-nm long pass filter. Simultaneously, H-33342 was excited with UV lasers at 351 and 364 nm and the fluorescence emission was detected with an additional photomultiplier, by application of a 560-nm dichroic beam splitter and a 400–470 nm band pass filter. Cy3 fluorescence was displayed in red, H-33342 fluorescence was displayed in green, and both images were superimposed. Additional magnification was achieved electronically by application of different ZOOM factors.
Chemical Synthesis of 6-O-Dansyl-GlcNH2
The synthesis of 6-O-dansyl-GlcNH2 (

Schematic of the three-step chemical synthesis of 6-O-dansyl-GlcNH2 (
Protection of 1-OH and 2-NH2 with tert-butyloxycarbonyl (Boc) groups
Powdered sodium methoxide (501 mg, 9.98 mmol) was added to a suspension of 6-(2-amino-2-deoxy-β-
Selective dansylation at the 6-OH group
Dansyl chloride ((5-dimethylamino-naphthalene-1-sulfonyl) chloride) (427 mg, 1.58 mmol) was added to a cooled solution of compound
Deprotection of tert-butyloxycarbonyl (Boc) groups
Compound
Melting point 98–103 C; 1H NMR (500 MHz, CDCl3/CD3OD, v/v 1:1) δ 8.62 (d, J = 8.5 Hz, 1H), 8.29 (m, 2H), 7.62 (m, 2H), 7.47 (s, 1H, CF3COOH), 7.33 (d, J = 7.6 Hz, 1H), 5.05 (d, J = 3.5 Hz, 1H), 4.27 (d, J = 7.1 Hz, 2H), 3.93 (m, 1H), 3.73 (dd, J = 10.4 Hz, 9.0 Hz, 1H), 3.30 (dd, J = 9.9 Hz, 9.0 Hz, 1H), 2.97 (s, 6H, −N(CH3)2, 2.96 (s, 5H, −OH), 2.79 (dd, J = 10.4 Hz, 3.5 Hz, 1H); 13C NMR (125 MHz, CDCl3/CD3OD) δ 160.90 (q, JC-F = 35.7 Hz), 150.69, 131.59, 131.37, 130.12, 129.66, 128.88, 123.74, 117.20, 116.30, 114.93, 98.02, 89.51, 70.17, 70.11, 69.86, 69.65, 54.80, 45.67 (2C, −N(CH3)2); mass spectrum (MALDI, 2,5-dihydroxybenzoic acid) M•+: m/z = 412 and (nano-ESI) (M + H)+: m/z = 413.
Incorporation of 6-O-Dansyl-GlcNH2 into HMECs
Different concentrations of 6-O-dansyl-GlcNH2 (Figure 1, Compound 4) in the range of 250 μM to 2 mM were tested on all four HMEC lines. The cell morphology was observed every 24 hr for a time period of up to 5 days and the doubling times were determined for the different 6-O-dansyl-GlcNH2 concentrations for each HMEC line. The time-course of 6-O-dansyl-GlcNH2 (Figure 1, Compound 4) incorporation into HMECs was characterized using HMECs grown on chamber slides and incubated for a period of 5,10, 22, 36, 60, 94, or 120 hr in cell culture medium containing 500 μM 6-O-dansyl-GlcNH2. Subsequently, cells were fixed with paraformaldehyde as described above under “Immunofluorescence Staining of HMECs.” Cellular uptake and final localization of staining from 6-O-dansyl-GlcNH2 were analyzed by fluorescence microscopy (Zeiss LSM 410, 40 × /1.2 water immersion lens). The dansyl group was excited with 351 and 364 nm lasers and the emission above 515 nm was detected with a photomultiplier using a 515-nm long pass filter. Identical microscope settings were used for all images to directly compare the fluorescence intensity between the time points. This resulted in partial oversaturation of the photomultiplier while acquiring images for the later time points.
Colocalization of 6-O-Dansyl-GlcNH2 and Immunofluorescent Staining for hLAMP-1 or hLAMP-2
HMECs were grown on chamber slides and incubated with 500 μM 6-O-dansyl-GlcNH2 in cell culture medium for 94 hr. Cells were then fixed with paraformaldehyde and immunofluorescence staining for hLAMP-1 or hLAMP-2 was carried out as described above (“Immunofluorescence Staining of HMECs”). A Zeiss LSM 410 laser scanning microscope with a 40 ×/1.2 water immersion lens was used to image the fluorescence of these two fluorophores. Cy3 was excited with a 543-nm laser. Simultaneously, the dansyl group was excited with UV lasers at 351 and 364 nm. Fluorescence emission was split by a 560-nm dichroic beam splitter and Cy3 fluorescence was detected with a photomultiplier using a 570-nm long pass filter. The fluorescence of the dansyl group was detected with an additional photomultiplier using a 505–530 nm band pass filter. Cy3 fluorescence was displayed in red, the dansyl group fluorescence was displayed in green, and both images were superimposed.
Isopycnic Density Gradient Centrifugation and Enzyme Assays
Subcellular organelle fractionation and enzyme assays were performed as described previously [48,49]. Lysosomes were obtained by isopycnic density gradient centrifugation of the total mitochondrial fraction in a preformed continuous density gradient of iodixanol (OptiPrep, Axis-Shield PoC, Oslo, Norway) and sucrose.
Approximately 1.5 × 10⁷ HMECs were washed twice with ice-cold saline and harvested (scraped) in 10 mL ice-cold homogenization medium containing 0.25 M sucrose, 1 mM EDTA, 10 mM Tris-HCl, protease inhibitor cocktail (Roche Diagnostics, Mannheim, Germany), pH 7.4. Cells were homogenized with a tissue tearor (Biospec Products, Bartlesville, OK) at 9000 rpm for 5 min. The homogenate was centrifuged at 1000 × g for 10 min and the 1000 × g pellet was stored for enzyme assays. The supernatant was centrifuged at 17,000 × g for 15 min. The 17,000 × g supernatant was stored for enzyme assays. The 17,000 × g pellet (“total mitochondrial fraction”) was resuspended in 0.6 mL homogenization medium using a 1-mL syringe attached to a 25-G 5/8 needle and mixed with 1.4 mL of 50% Optiprep working solution to give a 35% (w/v) iodixanol-sucrose solution with a density of 1.199 g/mL. The sample suspended in 35% iodixanol-sucrose solution was layered under 10 mL of a preformed continuous gradient of 30% to 10% iodixanol-sucrose in a disposable 13.2 mL polyallomer ultracentrifuge tube (Beckman Coulter, Fullerton, CA) using a Pasteur pipette. The density gradient was generated by carefully overlayering 2 mL each of 30%, 25%, 20%, 15%, and 10% iodixanol-sucrose solution (w/v) in a polyallomer ultracentrifuge tube. The tube was sealed with parafilm, slowly rotated to a horizontal position, and kept at room temperature for 60 min to form a continuous density gradient by diffusion. The tube was then returned to the vertical position and stored at 4°C until use. The density profile of the gradient was checked by fractionation and refractive index measurement in a trial experiment as well as after each ultracentrifugation. After the sample had been layered under the gradient, it was centrifuged at 52,000 × gav for 1.5 hr at 4°C using a swinging bucket SW 41 Ti rotor (rav = 110.2 mm) in a Beckman L7-65 ultracentrifuge (Beckman Coulter). The gradients were fractionated into 15 fractions of 0.75 mL each. All procedures were carried out at 4°C. Each gradient fraction, as well as the 1000 × g pellet and the 17,000 × g supernatant, was directly assayed for protein content by a modified Lowry assay (Bio-Rad, Richmond, CA) and for several organelle-specific marker enzymes, such as acid phosphatase (lysosomes), β-galactosidase (lysosomes), catalase (peroxisomes), succinate dehydrogenase (mitochondria), alkaline phosphatase (plasma membrane), and NADPH-cytochrome c reductase (endoplasmatic reticulum). All enzymes, apart from catalase, were assayed as described by Graham [50]. Catalase activity was measured using titanium oxysulfate [51]. The density of each gradient fraction was determined by measuring the respective refractive index using an Abbe refractometer (Thermo Spectronic, Rochester, NY). Proteins of each fraction were also separated by 9% SDS-PAGE and were subjected to immunoblotting as described in the section titled Western Blot Analysis.
Western Blot Analysis
HMECs were cultured in 10-mm tissue culture dishes until they reached 70–80% confluence. For experiments with 6-O-dansyl-GlcNH2, cells were cultured in the presence of 500 μM 6-O-dansyl-GlcNH2 for 4 days. Cells were then scraped and homogenized with lysis buffer containing 150 mM NaCl, 100 mM Tris-HCl, pH 8.0,1 mM EDTA, 0.5% Triton X-100, and a protease inhibitor cocktail (Roche Diagnostics, Germany). Ten microliters of protein lysate was used to quantify the amount of soluble proteins by means of a modified Lowry assay (Bio-Rad). Protein lysates were heated to 60°C for 1 min in sample buffer [6 × buffer contained 280 mM Tris-Cl, pH 6.8, 30% (v/v) glycerol, 1% (w/v) sodium dodecyl sulfate (SDS), 0.0012% (w/v) bromphenol blue, and 50 mM di-thiothreitol (DTT)]. Twenty micrograms of total protein were loaded to each lane, while two lanes were loaded with a prestained protein ladder (BenchMark, Life Technologies, Rockville, MD) as a molecular weight standard, and electrophoretically resolved by 9% sodium dodecyl sulfate-poyacrylamide gel electrophoresis (SDS-PAGE). The separated proteins were transferred to polyvinylidene difluoride membranes (Immobilon PVDF, Millipore, Bedford, MA) by Western blotting. After blocking with 5% dry milk overnight at 4°C, membranes were incubated for 1 hr with either 1:100 dilutions of hLAMP-1 (H4A3) or hLAMP-2 (H4B4) specific monoclonal antibody (mouse), both of which were kindly donated by Dr. J. Thomas August (Johns Hopkins University, Baltimore, MD), or with a 1:500 dilution of dansyl group specific polyclonal antibody (A-6398, rabbit) (Molecular Probes). Subsequently, membranes were washed three times with wash/dilution solution (PBS containing 1% dry milk and 0.1% Tween 20) and incubated for 1 hr with either 1:3000 diluted sheep anti-mouse (LAMP) or donkey anti-rabbit (dansyl) horseradish peroxidaseconjugated second-step antibody (Amersham, Arlington Heights, IL) followed by five washes with wash solution. The protein bands were visualized by an enhanced chemiluminescence Western blotting detection system (Amersham) and recorded on X-ray film (Kodak Biomax, Kodak, Rochester, NY). The molecular weights of the protein bands were assigned using the prestained protein ladder (BenchMark, Life Technologies).
Biosynthetic Labeling of Lysosomes in Living Cells Using 6-O-Dansyl-GlcNH2
HMEC lines were seeded on 22− × 22-mm cover glasses using a cell density that was adjusted to reach 70–80% confluence on Day 4 after seeding based on the respective cell doubling time determined previously [52]. To label lysosomes biosynthetically in living cells, HMECs were cultured on a 22- × 22-mm cover glass with cell culture medium containing 500 μM 6-O-dansyl-GlcNH2 for 4 days (94 hr) prior to the experiment. The cover glass was then sealed within a microscopy-compatible perfusion chamber and continuously perfused with cell culture medium at 37°C throughout the experiment as described below (Microscopy-Compatible Cell Perfusion System). Living cells were analyzed by fluorescence microscopy using a Zeiss LSM 410 laser scanning microscope and a 40×/1.2 water immersion lens. The dansyl group was excited with 351 and 364 nm lasers and the emission above 515 nm was detected with a photomultiplier using a 515-nm long pass filter. To keep potential phototoxic effects as low as possible, a low laser power setting of 0–5 was used. This corresponded to an energy of 6–17 μW as measured with a IL1400A radiometer/photometer (International Light, Newburyport, MA). This was possible because the intensity of fluorescence emission from the dansylated lysosomal proteins was high allowing a low laser power to achieve sufficient excitation of the probe. Differential interference contrast (DIC) images were acquired for each field of view (FOV) to analyze the localization of the lysosomes in relation to the cell borders. Fluorescence as well as DIC images were acquired every 20–30 min for a time period of 8 hr.
Microscopy-Compatible Cell Perfusion System
HMECs were grown on sterilized 22- × 22-mm cover glasses (two cover glasses were stored in a 60-mm tissue culture dish) to 70–80% confluence in the presence of 500 μM 6-O-dansyl-GlcNH2 for 4 days. The perfusion chamber (Figure 2, designed and constructed by Dr. Djikolngar Maouyo, Ross Confocal Microscope Facility, Johns Hopkins University) and paraffin were heated on heating plates to 55°C. Melted paraffin was spread out on the plain side of the chamber and a 35- × 50-mm cover glass (Port City Diagnostics, Wilmington, NC) was attached. The chamber on the heating plate was turned around and paraffin was spread out into the indentation on the other side of the chamber. A 22- × 22-mm cover glass with HMECs attached was taken from the storage dish, its empty side and the edges of the cell-containing side were carefully dried from cell culture medium, and it was sealed into the indentation. The perfusion chamber was briefly cooled with tap water to solidify the paraffin. The chamber was filled with cell culture medium through the influx-hole using a 25-G 5/8 needle attached to a 1.0-cm3 syringe (Becton Dickinson, Franklin Lakes, NJ). This entire process took approximately 1 min. The medium in the perfusion system (Figure 2) was driven by gravity. The perfusion system, which was capable of providing five different media each controlled by a two-way micro tubing valve (Cole-Parmer Instrument, Vernon Hills, IL), was preloaded with cell culture medium. The perfusion tubing (Tygo tubing, inner diameter 0.040 in., outer diameter 0.070 in.) was connected to the perfusion chamber using a connector, a 25-G 5/8 needle, and a tip, cut off from a pipette tip for gel loading that was directly fitted into the influx hole of the chamber. Tubing for the efflux was attached using a further cut pipette tip on the opposite side of the chamber. The cells on the cover glass were perfused continuously. The perfusion chamber was connected to a recirculation water bath (Figure 2) to maintain a temperature of 37°C. The experiment commenced once the perfusion chamber was placed on the stage of a Zeiss LSM 410 laser scanning microscope.

Schematic of the side (left) and bottom (right) view of the microscopy-compatible cell perfusion system that enabled us to study living cells under controlled extracellular conditions. The assembly of the system is described in detail in the Materials and Methods section.
Results
Chemistry
A three-step synthesis yielded the dansylated glucosamine 6-O-dansyl-GlcNH2 (Figure 1, compound 4). This novel compound was synthesized by introducing a dansyl (5-dimethylamino-naphtalene-1-sulfonyl) group [46] regiospecifically to the 6-hydroxyl group of 6-(2-amino-2-deoxy-β-
Cellular Uptake and Localization of 6-O-dansyl-GlcNH2
A concentration of 500 μM 6-O-dansyl-GlcNH2 in cell culture medium was found to be optimal to label HMECs. A concentration of 250 μM 6-O-dansyl-GlcNH2 labeled HMECs but did not result in lysosomal staining with sufficient fluorescence emission intensity. Concentrations of 250 as well as 500 μM 6-O-dansyl-GlcNH2 did not alter the cell morphology of the four different HMEC lines. The cell doubling times for HMECs [52] were not altered by 250 or 500 μM 6-O-dansyl-GlcNH2. Concentrations higher than 500 μM reduced cell growth. Cell death occurred at concentrations higher than 1 mM. The dansylated glucosamine 6-O-dansyl-GlcNH2 was incorporated into human breast cancer cells (MDA-MB-231, MDA-MB-435, and MCF-7) as well as immortalized HMECs MCF-12A and eventually localized in small intracellular vesicles. The cells were cultured with the dansylated glucosamine for 5, 10, 22, 36, 60, 94, or 120 hr, washed, fixed, and analyzed using confocal fluorescence microscopy. Figure 3 demonstrates that vesicular fluorescence in MCF-7 cells increased gradually with prolonged exposure of cells to 6-O-dansyl-GlcNH2. After 5 hr of incubation, the dansyl fluorescence was distributed over the cytoplasm of the cell and concentrated in some bright areas close to the nucleus, whereas the nucleus itself remained unlabeled. The 22-hr incubation time led to punctuate staining in some cells, while others still displayed the distributed labeling pattern. Incubating for 94 and 120 hr with 6-O-dansyl-GlcNH2 ultimately led to vesicular staining in all MCF-7 cells. Similarly, 6-O-dansyl-GlcNH2 was taken up and localized in small intracellular vesicles within MDA-MB-231, MDA-MB-435, and MCF-12A cells. No differences in uptake of 6-O-dansyl-GlcNH2 or distribution of dansylated lysosomal proteins were observed between the four HMEC lines tested.
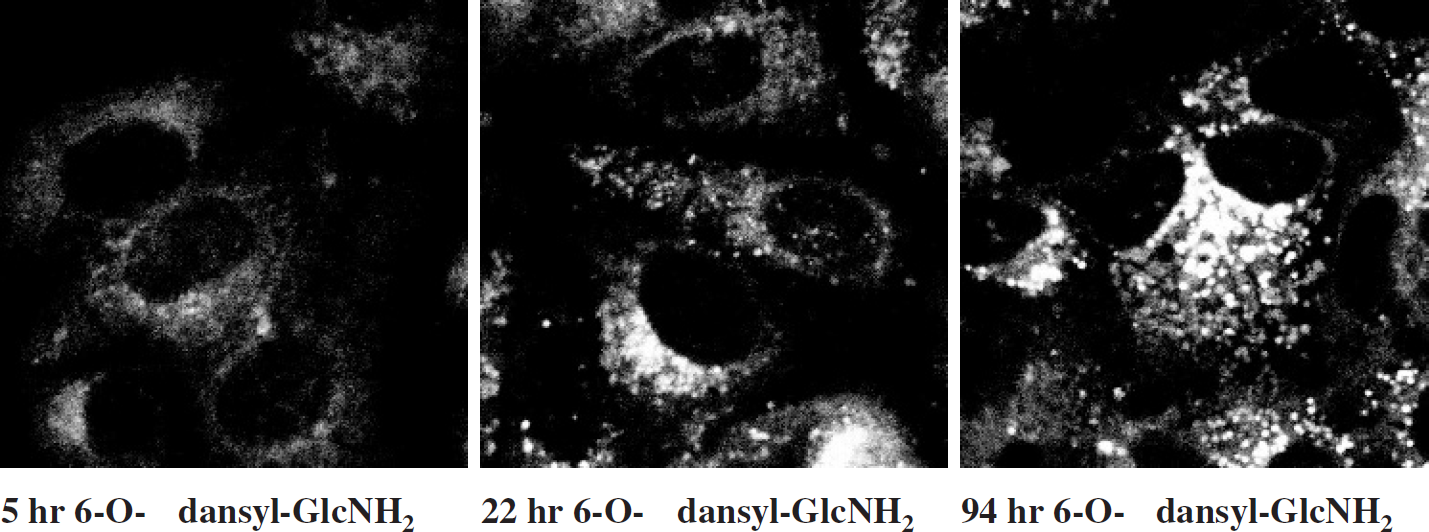
MCF-7 human breast cancer cells exposed to 500 μM 6-O-dansyl-GlcNH2 for 5 hr (left), 22 hr (middle), or 94 hr (right). The FOV of all images is 80 by 80 μm. After exposure to cell culture medium containing 6-O-dansyl-GlcNH2, cells were fixed and analyzed by fluorescence microscopy. Identical microscope settings were used for all images resulting in partial oversaturation in the 22- and 94-hr images. Vesicular fluorescence from the dansyl group increased gradually with prolonged exposure of the cells to 6-O-dansyl-GlcNH2.
Lysosomal Localization of Dansylated Glycoproteins
Lysosomal localization of dansylated glycoproteins produced from 6-O-dansyl-GlcNH2 was identified by two independent methods: colocalization of dansyl group fluorescence with immunofluorescence staining for LAMPs, hLAMP-1 and hLAMP-2 (Figure 4), and isolation of lysosomes using density gradient centrifugation combined with subsequent Western blot detection of the dansyl group using an anti-dansyl antibody (Figure 5). LAMP −1 and −2 have been shown to be localized in lysosomes and endosomes of mammalian cells [28–30]. LAMP −1 and −2 are now widely used as lysosomal markers. Figure 4 demonstrates that the hLAMP-1 fluorescence displayed in red (left) colocalized with the dansyl group fluorescence displayed in green (middle) resulting in a superimposed image which appeared yellow. These images demonstrated the excellent colocalization of dansyl-carrying glycoproteins with hLAMP-1 in the lysosomes. Both hLAMP-1 as well as hLAMP-2 fluorescence colocalized with the dansyl fluorescence in all four HMEC lines.

(A) Fluorescence from hLAMP-1 displayed in red. (B) Fluorescence from the dansyl group displayed in green. (C) Superimposed images from A and B. The FOV of all images is 160 by 160 μm. Colocalization of hLAMP-1 and the dansyl group is evident from the yellow apparent in C. Images were obtained from MDA-MB-231 human breast cancer cells cultured with medium containing 500 μM 6-O-dansyl-GlcNH2 for 94 hr and subsequently fixed and immunofluorescence stained for hLAMP-1.
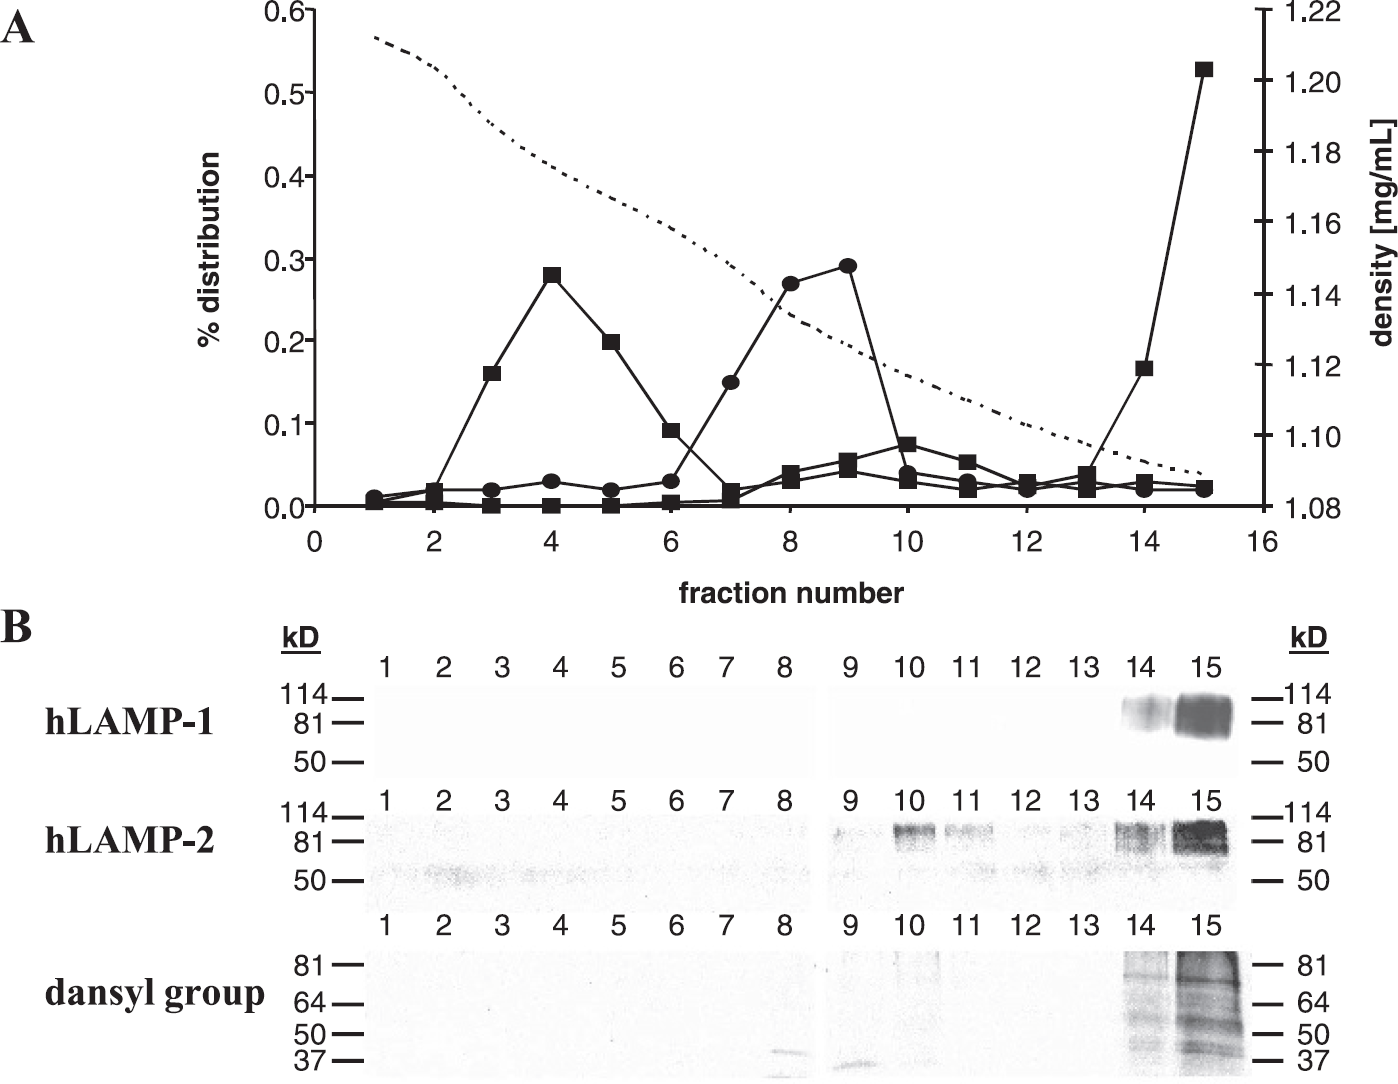
Isopycnic density gradient centrifugation (35–10% (w/v) preformed iodixanol gradient) of the total mitochondrial fraction of MDA-MB-231 human breast cancer cells cultured with 500 mM 6-O-dansyl-GlcNH2 for 94 hr. (A) The distribution of major organelles as assayed by marker enzymes for mitochondria (succinate dehydrogenase: •), peroxisomes (catalase: ▲), lysosomes (acid phosphatase, β-galactosidase: ■), and the density profile (—). (B) Western blots of all fractions obtained by density gradient centrifugation using antibodies against hLAMP-1 (upper panel), hLAMP-2 (central panel), or the dansyl group (lower panel). Organelles do not overlap. The lysosomal fractions 14 and 15 contain hLAMP-1, hLAMP-2, acid phosphatase, β-galactosidase as well as the dansyl group.
The organelle distribution after isopycnic density gradient centrifugation of the total mitochondrial fraction and the density gradient over all 15 fractions are shown in Figure 5A. Lysosomes were recovered in small quantities in fractions 9–11 and in large quantities in fractions 14–15. The respective densities of these fractions, which were of the order of 1.12-1.09 mg/mL, are typical of lysosomes [49]. Other organelles did not overlap with the lysosomal fractions (Figure 5). Endoplasmatic reticulum (NADPH-cytochrome c reductase) and plasma membrane (alkaline phosphatase) were only detected in the 17,000 × g supernatant that was recovered while generating the total mitochondrial fraction. Identification of lysosome-containing fractions detected by enzymatic assay of the lysosomal enzymes acid phosphatase and β-galactosidase was additionally verified by SDS-PAGE electrophoresis followed by Western blot detection of hLAMP-1 and hLAMP-2 (Figure 5B). Protein separation and immunoblotting with the anti-dansyl antibody showed that only the lysosome fractions 14–15 contained the dansyl group suggesting that the dansylated glycoproteins produced from 6-O-dansyl-GlcNH2 as substrate were accumulated specifically in the lysosomes.
Protein Analysis
The presence of the proteins used as lysosomal markers was verified using SDS-PAGE electrophoresis followed by Western blot analysis. Both hLAMP-1 and hLAMP-2 were present in all four HMEC lines as shown in Figure 6. Western blot analysis using an anti-dansyl antibody revealed that protein lysates of cells cultured with 6-O-dansyl-GlcNH2 contained a protein of an apparent molecular weight of about 70 kDa that carries the dansyl group (Figure 6). This 70-kDa band was detected in all four HMEC lines (Figure 6). No immunoreactive bands were detected using the anti-dansyl antibody in the four HMECs following incubation without 6-O-dansyl-GlcNH2.

Western blots probing for hLAMP-1 (left), hLAMP-2 (middle), and the dansyl group (right) in cell lysates from HMECs that were exposed to 6-O-dansyl-GlcNH2 for 94 hr. Left to right lane: MCF-12A, MCF-7, MDA-MB-231, and MDA-MB-435 cells. While hLAMP-1 and hLAMP-2 antibodies reveal immunoreactive bands between 100 and 140 kDa that are typical of mature highly glycosylated hLAMP-1/-2, the anti-dansyl antibody reacts with bands at approximately 70 kDa in all four HMEC lines.
Imaging Lysosomes in Living HMECs Using 6-O-dansyl-GlcNH2
To observe lysosomes in living cells, HMECs were grown on a 22- × 22-mm cover glass in the presence of 500 μM 6-O-dansyl-GlcNH2 for 4 days (94 hr). This cover glass was then sealed into a microscopy-compatible perfusion system (Figure 2) as described in the Materials and Methods section and attached to a confocal fluorescence microscope. The cells were continuously perfused with fresh cell culture medium, while the temperature was maintained at 37°C using a heated recirculation water bath. The perfusion was driven by gravity. Figure 7 shows images of living MDA-MB-435 cells from the same FOV visualized by both DIC (top) and confocal fluorescence (bottom). The fluorescence signals were extremely bright and stable for up to 8 hr (longer measurement times may be possible). Fluorescence as well as DIC images were acquired every 20–30 min for a time period of 8 hr. Neither cell morphology nor lysosomal fluorescence staining pattern changed during the 8-hr live cell imaging.

Typical differential interference contrast (upper panel) and dansyl group fluorescence (lower panel) images of living MDA-MB-435 human breast cancer cells that were perfused in the microscopy-compatible cell perfusion system for 0.5 hr (left) or 6.5 hr (right). The FOV of all images is 80 by 80 μm.
Discussion
A new noninvasive method of labeling lysosomes and potentially following lysosomal trafficking was validated. This method can be used to understand the effects of cellular microenvironments, such as low extracellular pH or hypoxia, on the lysosomal trafficking of living cells in real time. A novel compound 6-O-dansyl-GlcNH2, which is a dansylated glucosamine, was synthesized using a relatively straightforward three-step procedure. A dansyl (5-dimethylamino-naphtalene-1-sulfonyl) group [46] was regiospecifically introduced to the 6-hydroxyl group of 6-(2-amino-2-deoxy-β-
Localization of dansylated glycoproteins in lysosomal vesicles of HMECs required a relatively long incubation time of approximately 94 hr to achieve lysosomal labeling of all cells within the cell population. Cells incubated with 500 μM 6-O-dansyl-GlcNH2 exhibited a nonvesicular staining close to the nucleus at earlier time points of 5, 10, 22, and 36 hr. This indicated that 6-O-dansyl-GlcNH2 was biosynthetically incorporated into highly glycosylated lysosomal proteins by passing through cellular sites of protein glycosylation. N-linked glycans that are major constituents of proteins located in the lysosomal membrane [41] are added cotranslationally to newly synthesized polypeptides in the endoplasmic reticulum (ER) [53,54]. These glycans are then extensively modified as the glycoproteins mature and move through the ER and Golgi complex to their final destination in the cell [53,54]. The compound 6-O-dansyl-GlcNH2 is very similar to the biologically relevant substrate N-acetylglucosamine typically used in the pathway described above. Therefore, 6-O-dansyl-GlcNH2 may be used as a substrate for N-linked and/or O-linked glycans in the cellular biosynthesis of highly glycosylated lysosomal proteins. Total protein lysates of cells exposed to 6-O-dansyl-GlcNH2 for 94 hr showed only one immunoreactive band at 70 kDa in Western blots using an anti-dansyl antibody. This finding further supports the conclusion that 6-O-dansyl GlcNH2 was used in the biosynthesis of a protein that remains to be specified, but is localized only in lysosomes.
The novel lysosomal probe presented here was used to visualize lysosomes in living HMECs perfused in a microscopy-compatible cell perfusion system that provided well-defined extracellular conditions. A comparison of DIC images and confocal fluorescence images of these cells demonstrated that the 6-O-dansyl-GlcNH2 moiety produced bright and stable fluorescence signals from living cells over a duration of at least 8 hr.
The novel compound 6-O-dansyl-GlcNH2 provides the important advantage of being specifically targeted to lysosomes, whereas commonly used acidotropic probes (e.g., acridine orange or LysoTracker) accumulate in all acidic cellular compartments and are therefore less specific. Fluorescent probes such as FITC-dextran that are endocytosed and pass through several types of acidic endosomal compartments before localizing to the lysosome are also less specific than 6-O-dansyl-GlcNH2 because the distribution of such a compound into the lysosomal compartment is uncertain and needs to be verified by other methods. The use of the novel compound 6-O-dansyl-GlcNH2 provides a new approach to optically image lysosomes by labeling highly glycosylated lysosomal proteins which can be applied in vitro as well as in living perfused cells in real time. This novel approach will be very useful to study whether there are specific changes in lysosomal trafficking that are involved in cancer cell invasion and metastasis. This approach can also be applied to study various lysosomal diseases, such as lysosomal storage diseases [55] like Gaucher's disease [56], as well as neurodegenerative diseases like Alzheimer's disease [57,58]. This method can be applied to study host-parasite relationships such as that of Trypanosoma cruzi trypomastigotes [59] that involve participation of the host's lysosomes. This approach can also be used to follow therapeutic targeting of lysosomes. The novel method of imaging lysosomes in living cells presented here may be helpful to study changes in lysosome distribution in a variety of nonpathological situations, such as embryonic development [60] and cytokinesis [61]. Furthermore, this method may be applied to address cell biological questions, such as lysosome biogenesis [62], vesicular transport in the endosomal-lysosomal system [63], autophagy [64], as well as to understand the role of specific lysosomal proteins in the biogenesis and maintenance of the lysosomal compartment [65].
Footnotes
Acknowledgments
This work was supported by P20 CA86346. We thank Dr. Djikolngar Maouyo for the use of the confocal microscopy-compatible cell perfusion system and for expert technical assistance in performing the experiments with this system, Dr. J. Thomas August for providing us with monoclonal antibodies against hLAMP-1 (H4A3) and hLAMP-2 (H4B4), and Dr. Ioannis Stasinopoulos and Dr. Liudmila Cebotaru for helpful discussions. We also thank Mr. Gary Cromwell for maintaining the cell lines.