
Abstract
Background:
Near-infrared fluorescence (NIRF) imaging combined with enzyme-activatable NIRF probes has yielded promising results in cancer detection.
Objective:
To test whether 3-dimensional (3-D) noninvasive in vivo NIRF imaging can detect effects of epidermal growth factor receptor (EGFR) inhibitor on both polypoid and flat tumor load in azoxymethane (AOM)-induced colon tumors or tumors in Apc Min/+ mice.
Methods:
The AOM-injected KK-HIJ mice received EGFR inhibitor diet or chow diet. These and Apc Min/+ mice were given cathepsin-activatable probes (ProSense 680) before imaging. In vivo imaging was performed using quantitative tomographic NIRF imaging. Ex vivo imaging and histologic examination were performed. Dual imaging by micro computed tomography (CT) and 3D NIRF imaging was used to verify tumor location.
Results:
Tumor load reduction by EGFR inhibition was detected ex vivo using cathepsin B probes. In vivo imaging revealed intense activation of probes only in large tumors. Dual imaging with microCT and 3D NIRF imaging improved tumor detection in vivo.
Conclusions:
The 3-D NIRF imaging with ProSense 680 can detect and quantify drug effects on colon tumors ex vivo. The NIRF imaging with ProSense 680 probe has limitations as a valid nonendoscopic method for intestinal tumor detection. Combing with other imaging modalities will improve the specificity and sensitivity of intestinal tumor detection in vivo.
Keywords
Introduction
Colorectal cancer (CRC) is the second most common malignancy in the developed world, and despite recent advances in chemotherapeutics, this disease remains the third cause of morbidity and mortality in the United States in both males and females. 1 In recent years, a rapid decline in the incidence rate of CRC has largely been attributed to increased screening colonoscopy for detection and removal of precancerous polyps. 1 However, miss rates of precancerous polyps and flat tumors using traditional white light colonoscopy are still estimated at around 20%. 2 -4 Contrast enhancement-based narrow-band imaging modalities or other advanced endoscopic technologies, such as high-definition colonoscopy and chromoendoscopy, have been extensively investigated but neither showed improvement in detection of adenomas. 5 -7 Flat tumors are difficult to distinguish from background inflammation but are biologically aggressive leading to higher mortality rates. Thus, improved detection methods are desirable to maximize detection of small and flat colorectal lesions, 8 quantitatively measure tumor size and number, and monitor drug effects, 9 with the ultimate goal of increasing the efficiency of endoscopic or noninvasive screening procedures in clinical practice.
Compared to the white light used in traditional endoscopes, imaging at near-infrared fluorescence (NIRF) results in less autofluorescence background, deeper tissue penetration, and reduced hemoglobin absorption 10 and has success in detection of colonic adenomas in preclinical models. 10 -13 Enzyme-activatable NIRF optical probes are a type of molecular beacon. These probes are optically silent in their uncleaved state and increase their fluorescence intensity after enzyme-mediated cleavage of specific peptide sequences due to elimination of fluorochrome quenching, resulting in signal amplification at the site of probe cleavage. 14,15 If the enzymes specific for the peptide sequence in the NIRF probe are overexpressed in tumors, imaging with these activatable probes could significantly increase contrast between tumor and normal tissue and generate higher target to background ratios. 16
Cathepsins are proteases that actively participate in the proteolytic degradation of the extracellular matrix. Cathepsin B is overexpressed in a number of cancers, including colon cancer, 17,18 providing a potentially valuable target molecule for CRC detection and monitoring different stages of colon carcinogenesis or response to cancer therapies. Cathepsin-activatable NIRF probes have been used to detect colon tumors in several colon tumor models including the Apc Min/+ mouse model, 19,20 mouse xenografts, 11 which cannot fully recapitulate the microadenoma–adenomas–adenocarcinoma progression, 21 , and the interleukin-10 null model, as well as colitis-associated cancer and dysplasia. 18,20,22 To date, the use of NIRF imaging with cathepsin-activatable probes to detect intestinal tumors has focused on ex vivo fluorescence reflectance imaging (FRI). Recent studies 18,19 combined white light and NIRF colonoscopy to demonstrate that cathepsin-activatable probes successfully detected dysplastic foci in a mouse model of colitis-associated colon cancer, indicating potential benefits of this methodology in clinical endoscopy. However, few studies have tested the utility of enzyme-activatable probes for monitoring or quantification of colorectal tumor response to therapies. Such approaches could provide significant benefit to preclinical studies, where quantification of tumor load, particularly small or flat lesions, is labor intensive. Moreover, there is evidence for improved polyp detection by activatable NIRF probes during colonoscopy in preclinical models. 23,24 A real-time in vivo nonendoscopic imaging of colon tumorigenesis is highly desirable in preclinical models to provide the potential for longitudinal noninvasive monitoring of the same animal.
The current study tested the hypothesis that ex vivo or in vivo 3-dimensional (3-D) noninvasive NIRF imaging would reliably quantify tumor load in azoxymethane (AOM)-induced tumors in KK-HIJ mice, which develop primarily polypoid but also some flat lesions 25 and would be useful to detect and quantify the impact of epidermal growth factor receptor (EGFR) inhibitor tyrphostin on tumor load from both polypoid and flat tumors in a single mouse model. We tested whether signal intensity correlated with tumor size and whether small lesions detected by probe activation could be histologically validated based on β-catenin staining. Our findings demonstrate that ex vivo NIRF imaging of an activatable cathepsin probe reliably detects and quantifies tumor load and response to EGFR inhibitor. Ex vivo NIRF imaging also detected many small lesions that would have otherwise been difficult to detect using conventional white light microscopy. Noninvasive live animal NIRF imaging, even with attempts to reduce abdominal background by use of liquid diets, did not reliably discriminate AOM-induced colon tumor load in control versus EGFR inhibitor–treated mice. More promising in vivo results were obtained with Apc Min/+ mice versus tumor-free controls, a model with greater numbers of tumors throughout the small intestine.
Methods and Materials
Animal Models
All studies were approved by the Institutional Animal Care and Use Committee of the University of North Carolina at Chapel Hill (protocol number: 10-197). KK-HIJ mice were purchased from the Jackson Laboratory (Bar Harbor, Maine). Twelve-week-old mice were given intraperitoneal (IP) injections of AOM (Sigma, St. Louis, MO, Cat # A2835; 10 mg/kg body weight) once a week for 5 weeks. Eight weeks after first AOM injection, KK-HIJ animals were randomly divided into control and treatment groups. Controls were fed with regular AIN-93G diet (Research Diets, Inc, New Brunswick, New Jersey; n = 9). Mice in the treatment group were given EGFR inhibitor premixed in the AIN-93G diet (n = 8). The EGFR inhibitor (tyrphostin) was purchased from LC Laboratories (Cat # AG-1478; Woburn, Massachusetts) and premixed in the AIN-93G diet at a dose of 0.144 g tyrphostin per kg diet, which has been shown to effectively reduce tumor load in the AOM model. 26 At 24 weeks after the first AOM injection, colonoscopy was performed to verify the presence of tumors and mice were injected with ProSense 680 probe for in vivo and ex vivo imaging as described in Figure 1A. Apc Min/+ mice on a C57BL6 background were purchased from the Jackson Laboratory and the colony was maintained in our specific pathogen-free facility. At 16 to 20 weeks of age when Apc Min/+ mice reliably develop multiple small intestinal adenomas, 27 they were injected with ProSense 680 probes and used in imaging experiments.

Epidermal growth factor receptor (EGFR) inhibitor diet feeding reduced number and size of polypoid tumors in azoxymethane (AOM)-treated KK-HIJ animals. A, Scheme of AOM treatment in KK-HIJ mice. B, Representative photographs of colon of chow or EGFR inhibitor diet–fed animals visualized by colonoscopy. C, Representative white light photographs of fresh whole colon from chow or EGFR inhibitor diet–fed animals. Small lesions (small tumors or lymphoid aggregates) are indicated by white arrows. D, Scatter plot of tumors/lesion size in chow or EGFR inhibitor diet–fed animals. Each yellow dot represents individual tumor/lesion. n = 8 to 10/group.
Colonoscopy
Colonoscopy (n = 3 for regular chow diet group and n = 4 for EGFR inhibitor diet group) was performed between 23 and 24 weeks after the first AOM injection (Figure 1A). Mice were fasted overnight before colonoscopy to eliminate colonic stools. During the colonoscopy, the mice were anesthetized with 1.5% to 2% isoflurane and 3 to 4 cm of the colon from the anal verge was visualized after inflation of the colon with air. A “Coloview system” (Karl Storz Veterinary Endoscopy, Goleta, CA) was used to visualize tumors. The colonoscopic images were digitally recorded on an AIDA Compaq PC, Palo Alto, CA.
Near-Infrared Fluorescence Molecular Imaging
Protease-activatable NIRF imaging probe, ProSense 680 (PerkinElmer, Waltham, Massachusetts) was used for NIRF imaging. These probes are optically silent until cleaved and activated in vivo by proteases, such as cathepsin B, L, S, and plasmin with reportedly highest specificity for cathepsin B. 18 The 680 probe fluorophore is excited at 680 ± 10 nm and emits fluorescence at 700 ± 10 nm. ProSense 680 was given via retro-orbital injections under 2% isoflurane anesthesia, 24 hours prior to imaging, according to the manufacturer’s instructions (PerkinElmer). Each probe was diluted in 1× phosphate-buffered saline (PBS) before injection and administered using the recommended dose of 2 nmol (100 µL) per mouse.
Ex Vivo 2-D FRI Imaging
Fluorescence reflectance imaging was carried out using 2-D imaging mode in the FMT 2500 fluorescence tomography imaging system (PerkinElmer) to detect and quantify activated probe on dissected colon. Regions of interest (ROIs) were placed on the entire distal colon in KK-HIJ mice or entire intestine (small intestine and colon) in Apc Min/+ mice and fluorescence intensity was calculated (in counts/energy). Total counts/energy for entire distal colon and for individual lesions was assessed on dissected colon tissues from each AOM-treated mouse.
In Vivo 3-D Imaging
Both KK-HIJ mice and Apc Min/+ mice were given liquid diet (Nestle Nutrition, Minnetonka, Minnesota; Nutren 1.0 Fiber:dH2O = 1:1) instead of normal solid chow for 4 days before in vivo imaging to clear the bowel of solid fecal matter, which is a source of autofluorescence at NIRF wavelengths. 28 Liquid diet was prepared fresh daily and given ad libitum in mouse feeding bottles (Cat # 9019 and 9015; Bio-Serv, Frenchtown, New Jersey). The mice were housed in cages with wire mesh bottoms to prevent coprophagia. Water was provided ad lib throughout the period of liquid diet feeding.
For in vivo 3-D fluorescence tomography imaging, mice were anesthetized with Nembutal (50 mg/kg body weight, IP) and abdominal and torso hair was removed using Nair lotion (Ovation Pharmaceuticals Inc, Deerfield, Illinois) to permit light transmission. Anesthetized mice were then carefully positioned into the imaging cassette and placed into the imaging chamber of the FMT 2500 LX system (PerkinElmer). For 3-D tomography imaging, this system uses the NIR laser diode to conduct a transillumination raster scan through the body of the mouse. A thermoelectrically cooled charge-coupled device (CCD) camera with corresponding optical filters collects both excitation and emission NIR fluorescence. The entire image acquisition sequence takes approximately 3 to 5 minutes per mouse. A built-in reconstruction algorithm then reconstructs the 3-D distribution of light source and provides spatial quantification of the fluorophore.
The 3-D ROI analysis quantified fluorochrome in the colon or the entire abdominal area of each mouse (ROI volumes are the same across the animals). A threshold was applied to all animals equal to 30% of the mean signal intensity in ROIs of water control mice as reported in previous studies. 14 Total amount of fluorochrome in the target ROI was then automatically calculated from the reconstructed images using TrueQuant Imaging Software (Ver. 2.0.0.19) based on preacquired calibrations with phantoms containing known amounts of activated probe. Data are expressed as absolute total pmol of activated fluorescent probe per animal.
Dual-Imaging by Micro Computed Tomography and 3-D Fluorescence Imaging
As a potential strategy to improve the detection of the spatial distribution of fluorescent signal from 3-D fluorescence tomography imaging, multimodality imaging with contrast-enhanced computed tomography (CT) and FMT imaging was performed on Apc Min/+ mice. Mice were injected with ProSense 680 probes 24 hours before imaging, as described above. Iodine-based CT contrast agent (iohexol [300 mg-I/mL]; GE Healthcare, Inc, Chicago, IL) was orally gavaged into mice 1.5 hours prior to CT imaging using a total volume of 0.4 mL in 2 separate gavages (30 minutes apart). Each mouse was then placed in the FMT animal cassette and imaged using a microCT scanner (eXplore CT120; GE Healthcare, Inc), followed by 3-D fluorescence imaging in the same cassette. Fiducial marker holders on the animal cassette were filled with contrast agent to facilitate registration between CT and FMT imaging. The CT imaging protocol used 70 keV X-ray energy level, a current of 30 mA, 100 µm isotropic resolution, and total imaging time of 5 minutes. After in vivo imaging, the animal was euthanized, and intestine and colon were dissected for validation by ex vivo fluorescence imaging. The CT images and FMT images were registered based on coregistration of fiducial markers.
Tissue Collection for Quantification of Tumor Load by Microscopy
Mice were euthanized by IP injection with Nembutal (100 mg/kg body weight) after in vivo imaging. Colon from KK-HIJ mice and entire small intestine and colon from Apc Min/+ mice were flushed with ice-cold 1× PBS and opened longitudinally for quantification of tumor number and size by conventional white light imaging using a dissecting scope followed by ex vivo NIRF imaging to detect and quantify activated probe. After ex vivo imaging, tumor and nontumor tissue samples were fixed in 10% zinc formalin overnight and paraffin embedded.
Histology and Immunostaining
Zinc formalin-fixed and paraffin-embedded tumor and nontumor tissue were sectioned for staining with hematoxylin and eosin or immunohistochemistry. Immunostaining for β-catenin was used to confirm that lesions detected based on increased activation of NIRF probes showed the characteristic increase in cytoplasmic and nuclear β-catenin typical of dysplasia or adenomas. For β-catenin immunostaining, sections were deparaffinized in xylene, rehydrated in graded ethanol solutions and subject to heat-induced epitope retrieval. This method involved heating sections to 120°C for 30 seconds and 90°C for 10 seconds in citrate buffer pH 6.0 (Vector Laboratories, Burlingame, California). Sections were then blocked in 5% normal goat serum (NGS) diluted in 0.05 M Tris buffer for 1 hour and endogenous peroxidase activity was blocked in 3% H2O2 for 10 minutes at room temperature. β-Catenin antibody (Abcam, Cambridge, MA, Cat # ab32572) was diluted (1:500) in 5% NGS/Tris buffer and sections were incubated with primary antibody overnight at 4°C, washed in 0.05 M Tris buffer, incubated with biotinylated goat antirabbit IgG mouse (Jackson ImmunoResearch, Cat # 111-065-144) for 1 hour at room temperature, and after washing, the diaminobenzidine (DAB) reaction (Invitrogen, Carlsbad, CA, Cat # 00-2014) was performed according to the manufacturer’s protocol. After washing with 0.05 M Tris buffer, ABC (Vector Laboratories, Burlingame, CA, Cat # PK 6100) was performed for 3 minutes before counterstaining with hematoxylin. Cover slips were mounted in a mixture of distyrene, a plasticizer, and xylene (DPX) mountant (BDH Chemicals, Dawsonville, GA, Cat # 360294H). Photographs were acquired using a Zeiss microscope, Jena, Germany.
Statistical Analysis
Signal intensities for activated probes were expressed as mean ± standard error of the mean. Student’s t test was used to test for statistical differences between signal intensities in AOM-injected KK-HIJ mice fed chow or EGFR inhibitor diet and between Apc Min/+ mice and wild type (WT) nontumor controls. Tumor load for each KK-HIJ or Apc Min/+ mouse was calculated as tumor size × tumor number. Simple linear regression was used to calculate Pearson’s correlation coefficients and test for correlations between ex vivo intestine 2-D quantification of NIRF and in vivo 3-D quantification of abdominal signal in the same animal. All statistical analyses were performed using GraphPad Prism5 (GraphPad Software, Inc, La Jolla, California) software. A P value <.05 was considered statistically significant.
Results
EGFR Inhibitor Diet Effectively Reduced Colonic Tumor Number and Size in AOM-Injected KK-HIJ Animals
Deregulation of the EGFR pathway occurs in up to 50% of CRCs, which has led to the development of numerous pharmacological agents to block EGFR activity. 29 An EGFR inhibitor that targets the kinase domain of EGFR has proved effective in the reduction of intestinal tumors in animal models. 26,30 In the current study, colonic tumors were induced in KK-HIJ mice according to previously published methods, 25 as summarized in Figure 1A. Eight weeks after the first AOM injection, mice were fed with either normal chow or EGFR inhibitor premixed diet for 15 to 16 weeks before colonoscopy and imaging. Colonoscopy verified detectable colon tumors in chow-fed mice and revealed fewer tumors in mice fed EGFR inhibitor diet as illustrated in Figure 1B. Using the dissecting microscope, we also observed decreased tumor number and size in mice fed EGFR inhibitor (Figure 1 and Table 1). For quantitative purposes, tumors visualized under the dissecting microscope were categorized into either large (>1 mm in diameter) polypoid lesions or small (≤1 mm in diameter) lesions. Representative white light photographs (Figure 1C) demonstrate multiple large polypoid tumors in chow-fed mice and dramatically fewer large lesions in mice fed EGFR inhibitor diet and this was verified across multiple animals (Figure 1D and Table 1). However, mice on EGFR inhibitor diet had small lesions (Figure 1C, arrows) and significantly greater numbers of these lesions than mice on chow diet (Figure 1D and Table 1). Tumor load for each group of animals was calculated by size × number of visible lesions. Compared with chow-fed KK-HIJ mice, mice on EGFR inhibitor diet had significantly lower total polypoid tumor load (3.8 ± 0.5 in EGFR inhibitor diet group vs 11.3 ± 2.1 in chow diet group, P < .05).
Average Colonic Lesions in Both Chow-Diet and EGFR-Inhibitor-Diet-Fed KK-HIJ Animals.a
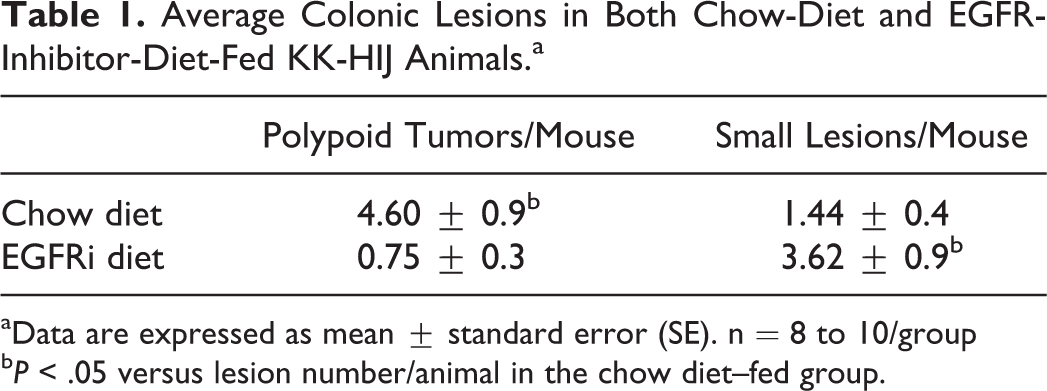
aData are expressed as mean ± standard error (SE). n = 8 to 10/group
b P < .05 versus lesion number/animal in the chow diet–fed group.
Ex Vivo Detection of EGFR Inhibition or Induced Reduction in Tumor Load by Using Cathepsin-Activatable NIRF Probes
Ex vivo imaging was performed on whole colon of KK-HIJ animals 24 hours after ProSense 680 probe injection. Representative FRI images are shown in Figure 2A. Quantification was performed on 2-D images of entire distal colon for each animal (ROI is shown as purple rectangle). Compared with chow diet–fed animals, significantly less total fluorescence was detected in the colon of EGFR inhibitor diet–fed animals (Figure 2B). Comparing total tumor load versus total fluorescence signals for each animal as shown in Figure 2C, we found that EGFR inhibitor–fed mice had smaller tumor load and also lower distal colon fluorescence signal (Figure 2C). This strong correlation between distal colon tumor load and 2-D quantification of tumor load using NIRF indicates that FRI 2-D imaging validly detects tumor load differences across treatment groups; FRI signal for each lesion was also tested for correlation with tumor size (Figure 2D, chow diet group and Figure 2E, EGFR inhibitor diet group). A similar pattern was seen in Figure 2D and E. Larger tumors show stronger FRI signals, suggesting that FRI signals can reliably distinguish tumor size. Consistent with the findings from colonoscopy and conventional assays of tumor number and size in Figure 1, we found that the majority of EGFR inhibitor diet–fed animals have smaller tumor size (tumor size < 1 mm in diameter), while 80% of the lesions detected by 2-D FRI in chow diet–fed animals have large tumors (tumor size > 1 mm in diameter). Together, these data demonstrate that ex vivo 2-D FRI for activatable ProSense 680 has utility to validly detect the therapeutic effect of a known inhibitor of tumorigenesis, EGFR inhibitory on AOM-induced colonic tumors.

Detection of decreased colonic tumor load in epidermal growth factor receptor (EGFR) inhibitor diet–fed azoxymethane (AOM)-treated KK-HIJ animals by 2-D fluorescence imaging and ProSense 680 activatable probe. A, The 2-D fluorescence reflectance imaging (FRI) images demonstrate reduced tumor load in EGFR inhibitor diet–fed animals. B, The 2-D quantification analysis suggests significant lowered FRI signals in the colon of EGFR inhibitor diet–fed mice versus chow diet–fed animals. C, Graph of distal colon 2-D FRI signal intensity (counts/energy) and tumor load in each animal indicates EGFR inhibitor diet–fed animals have smaller and less colonic tumors. Each dot represents individual animal (red dots represent animals from EGFR inhibitor diet–fed group, green dots represent animals from chow diet–fed group). D and E, Graph of 2-D FRI signal intensity (counts/energy) and lesion size for individual lesion from chow diet–fed animals (D, green plot graph) and EGFR inhibitor diet–fed animals (E, red plot graph).
Ex Vivo 2-D FRI Using ProSense 680 Probe Can Distinguish Large Tumors From Small Lesions, but Has Limited Ability to Differentiate Small Tumors and Lymphoid Aggregates
In the current study, we aimed to test the hypothesis that ex vivo imaging of activatable ProSense 680 probe could detect small tumors and distinguish benign lesions, such as lymphoid aggregates from malignant lesions. To test this hypothesis, individual lesions (including polypoid tumors and small lesions) from AOM-injected KK-HIJ animals were collected based on the signal intensity measured by ex vivo 2-D FRI images (as shown in Figure 3A), then fixed and embedded for histological sectioning. Cut sections were stained with β-catenin antibody. Based on immunostaining as shown in Figure 3B, and a grading system shown in Table 2, we assigned numerical grades to normal epithelium, lymphoid aggregates, and nuclear β-catenin-positive small adenomas and large adenomas. Fluorescence reflectance imaging signal intensity of each lesion was also quantified and tested for correlation between FRI signal intensity and the grade of each lesion (Figure 3C). We found that the signal in lesions from category 4, which represents large nuclear β-catenin-positive lesions (tumors), was significantly stronger than signals from the other 3 lesion types (Figure 3C). The FRI signal intensities from these other 3 categories were not significantly different based on 2-D FRI quantification. This indicates that the ProSense 680 probe does not reliably distinguish lymphoid aggregates from small tumors if the tumor size is <1 mm in diameter.

The 2-D ex vivo imaging with ProSense 680 activatable probe can differentiate large nuclear β-catenin-positive tumors versus small lesions, but not small tumors and lymphoid follicle from normal epithelium. A, Representative 2-D fluorescence reflectance imaging (FRI) images of lesions in each category. B, β-Catenin immunostaining photomicrographs to illustrate lesions in each category (1-4) based on the grading scheme in Table 2. C, Scatter plot of each categorized lesion based on 2-D fluorescence signal intensity (counts/energy). *P < .05 versus categories 1, 2 and 3.
Lesions Were Divided Into 4 Categories Based on Histology Observation.

Detection of AOM-Induced Colonic Tumors in KK-HIJ Mice In Vivo by ProSense 680
FMT 3-D in vivo imaging with NIRF probes has the potential benefits of deeper tissue penetration and quantification of fluorescent signals, and it is a potential new technology for noninvasive imaging tumor development and drug treatment in preclinical studies or even with future enhancement in the clinic. Previous studies have verified that activatable cathepsin-based probes can reliably detect intestinal tumors by ex vivo FRI. 18,19,21 In the current study, we investigated whether intestinal tumors could be detected in vivo by FMT. We imaged each animal’s abdominal area in both chow and EGFR inhibitor diet–fed AOM-treated KK-HIJ mice. For in vivo quantification, ROIs were either placed on the whole abdomen (Figure 4A) or only the distal colon area (Figure 4C). Three-dimensional quantification analysis was performed as described in the Methods. Quantification data from whole abdomen or colon areas suggested that there is no significant difference in total signal between chow diet and EGFR inhibitor diet–fed animals despite major differences in tumor load (Figure 4B, D). Although some animals having particularly large colonic tumors (as seen under a dissecting microscope and ex vivo FRI imaging) do show stronger signals in the distal colon area by in vivo FMT quantification than animals that have smaller colon tumors, we did not observe intense and localized activated signals in the ROI. This suggests that nonspecific signals confound in vivo FMT-based detection and quantification of colon tumors. Nonspecific signals could be generated from various sources including fecal contents, enzyme activation by skin, metabolized probe, or signal due to probe concentrated in the liver and bladder. Software available with the FMT 2500 imaging system does not yet permit selection of ROI to specifically image the colon. These data suggest limitations of both FMT technology and ProSense 680-activatable probe for in vivo detection of mouse colon tumors.
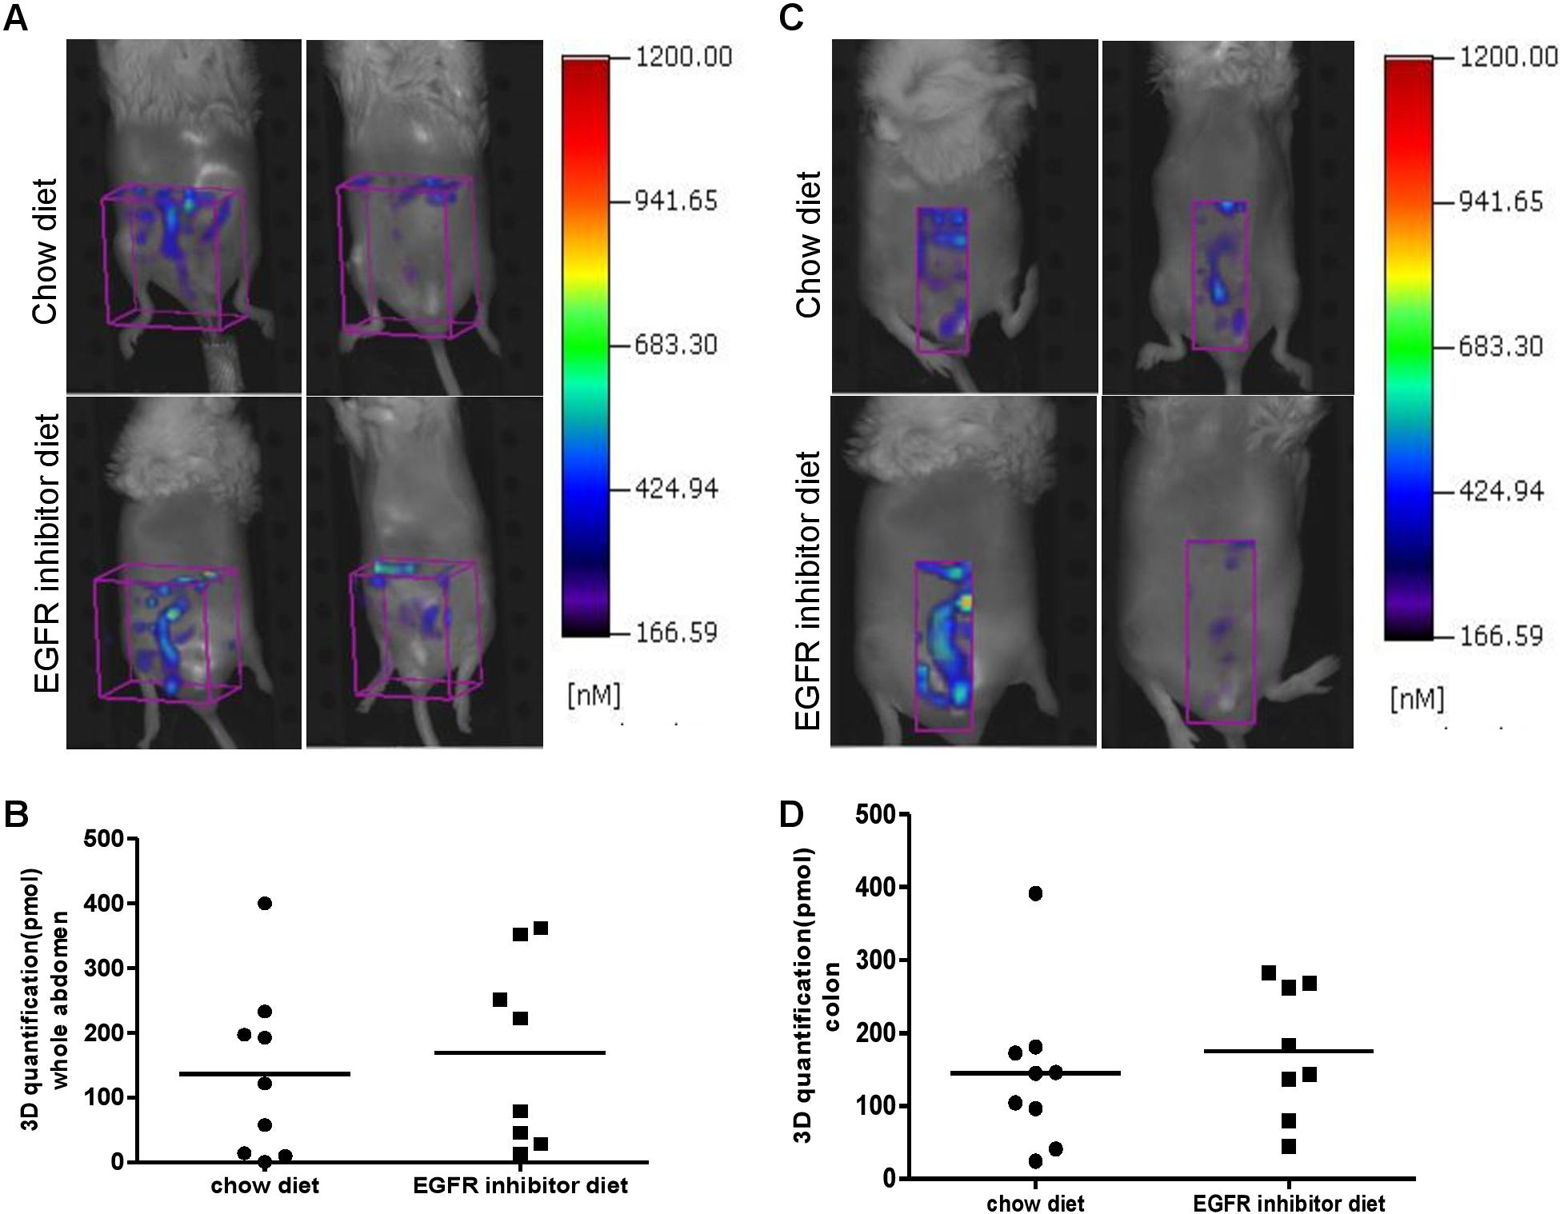
Three-dimensional (3-D) in vivo fluorescence tomography imaging using ProSense 680 molecular probe is not effective to detect the reduction of colonic tumor load in epidermal growth factor receptor (EGFR)-inhibitor-diet-treated azoxymethane (AOM)-injected animals. A, Representative 3-D Fluorescence Molecular Tomography (FMT) images from chow diet– and EGFR inhibitor diet–fed animals. Region of interest (ROI) in purple is placed in abdominal area. B, Three-dimensional (3D) quantification by FMT in abdominal area (ROI volumes are the same across the animals) suggests no difference in fluorescence signal intensity between chow-diet and EGFR inhibitor diet–fed animals. C, Representative 3-D FMT images from chow-diet and EGFR inhibitor diet–fed animals. Region of interest in purple is placed in the colon area. D, Three-dimensional quantification by FMT in the colon area suggests no difference in fluorescence signal intensity between chow-diet and EGFR inhibitor diet–fed animals.
Detection of Intestinal Tumor In Vivo by ProSense 680 Probe in Apc Min/+ Mice
We used Apc Min/+ mice to further investigate the ability of molecular probes to detect intestinal tumors in vivo because this mouse model spontaneously develops fifty to hundreds of small intestine adenoma polyps after the age of 120 days. 31 We took advantage of the large tumor load in this mouse model and hypothesized that in vivo 3-D fluorescence imaging with the FMT system may detect the large tumor load in the small intestine. The 3-D fluorescence images obtained by the FMT 2500 system at 680 excitation wavelengths are shown in Figure 5A. We found that enzyme activation for ProSense 680 probes was higher in the abdominal area of Apc Min/+ mice than in WT nontumor controls (Figure 5A). However, background signals were still observed in abdominal ROI of control mice. Quantification of FMT signal demonstrated significantly higher total signal in the abdomen of Apc Min/+ mice than control mice (Figure 5B). After in vivo imaging, whole intestine was dissected and opened for imaging ex vivo at 680 nm excitation wavelength. Two-dimensional quantification was performed on the whole intestine, including the small intestine and colon. Regression analysis tested for correlations between abdominal 3-D signal intensity and whole intestine 2-D signal intensity in each animal. As shown in Figure 5C (control mice) and Figure 5D (Apc Min/+ mice), no significant correlation was found in ProSense 680 probe activation by these methods. This suggests that nonspecific probe activation in the abdomen of Apc Min/+ mice is a bias when analyzing 3-D fluorescence images acquired from the FMT system.

In vivo 3-dimensional (3D) fluorescence imaging using ProSense 680 activatable probe can detect abdominal tumor load in Apc Min/+ mice. A, Representative 3-D in vivo fluorescence images of Apc Min/+ mice and nontumor control mice injected with ProSense 680 probe. Region of interest (ROI) in purple is placed in abdominal area. B, Three-dimensional quantification results in the abdominal area indicate significant higher fluorescence signals in Apc Min/+ mice than nontumor control animals. Data are expressed as mean ± standard error (SE). n = 4 to 5/group. *P < .05 versus nontumor control mice. C and D, Linear regression analysis on ex vivo 2-D whole intestine fluorescence signal intensity and in vivo 3-D abdominal fluorescence signal intensity suggests no significant correlation in control mice (C) or Apc Min/+ mice (D).
In Vivo and Ex Vivo Dual-Model Imaging
To test the reliability of 3-D NIRF imaging with NIRF-activatable probes, we performed dual modality imaging with contrast-enhanced CT and FMT imaging, and intestinal polyps in Apc Min/+ mouse were clearly detected in the CT images (Figure 6A). Registration between the 2 images showed some visual correlation between tumor location detected from microCT and fluorescence signal from FMT imaging; however, discrepancies between fluorescence signal and tumor detected from CT images were observed (Figure 6A, B), indicating a need for improved 3-D FMT imaging and caution in interpretation of in vivo 3-D fluorescence imaging in mouse tumor models.

Dual-model microCT/FMT imaging on intestinal adenomas in Apc Min/+ mice. A, Tumor nodules were detected by contrast-enhanced microCT imaging (white arrows). B, Coregistration of microCT image with 3-dimensional (3D) fluorescence image activated by ProSense 680 probe. Three-dimensional image was taken at 24 hours after injection of ProSense 680 activatable probe and fused with microCT image for anatomical colocalization. C, Two-dimensional fluorescence reflectance imaging (FRI) images of small intestine. After coregistration of in vivo imaging, the small intestine was dissected and imaged ex vivo by FRI for validation.
Discussion
Data from the current study support using cathepsin-activatable probe and NIRF imaging to detect and quantify colonic tumors and test the impact of therapeutic interventions such as EGFR inhibitors on colonic tumor number and size in preclinical models. The EGFR is a member of the human EGFR family of receptor tyrosine kinases, and it has become an important target for anticancer therapy for a variety of solid tumors, including CRC. 32 -34 Previous studies have shown that both Apc Min/+ tumors and AOM-induced tumors display increased EGFR activity 35,36 and also respond to EGFR-targeted treatment. 26 In the present study, we confirmed that EGFR inhibitor dramatically reduced the number of the AOM-induced tumors. Importantly, we demonstrate the ability of a cathepsin-activatable NIRF probe to detect and quantify the effect of EGFR inhibitor on tumors by ex vivo FRI imaging. The current challenge for the traditional white light colonoscopy is detecting flat tumors and small tumors to improve diagnosis and lower the miss rate. Recent studies 8,18,37 targeting imaging flat colonic tumors indicated improved detection combining white light and NIRF endoscopy. Our preliminary data also indicate the potential of using cathepsin-based activatable probes to detect flat tumors in a colonic tumor mouse model (data not shown). To date, however, the ability of NIRF imaging with activatable NIRF probes to reliably detect small tumors (tumor size < 1 mm in diameter) is not established. Two very recent preclinical studies 19,13 aimed to validate the NIR endoscopy platform to detect small colonic tumors and could only detect tumors larger than 1 mm. To our knowledge, our data is the first to show that cathepsin-activatable probe can detect small tumors in the colon by ex vivo FRI but still has limited capability to validly distinguish small tumors from lymphoid aggregates or normal mucosa. This is based on grouping all the lesions into 4 categories based on histology, as shown in Figure 3, and the signal intensity in individual lesions by 2-D quantification. We found that the signal intensities of small tumors (verified by β-catenin staining) are not different from those of lymphoid aggregates or normal mucosa. Thus, currently, it is not possible to validly distinguish small neoplastic lesions from nonneoplastic lesions using FMT imaging system and cathepsin-activatable probe without follow-up histology.
The use of NIRF-activatable probes has the potential advantages of deep tissue penetration and higher target to background ratio. Unlike many other imaging modalities, optical imaging does not rely upon ionizing radiation to generate images, opening the way for low-risk screening applications in clinic. 38 Also, the technique that uses 3-D reconstruction is superior to reflectance imaging (2-D FRI) because 3-D FMT can actually quantify the accumulation of molecules in the target. 39 With all of these potential advantages of NIRF imaging technology, we hypothesized that FMT imaging with NIRF probes could give a better view of intestinal tumors in vivo; however, we did not see high fluorescent signal localized to tumors in the colon by in vivo imaging. The failure of in vivo fluorescence imaging in our study can be attributed to the following 2 major reasons: (1) the nonspecific activation of the fluorescence probe injected in vivo causes a high level of nonspecific background signal and (2) less than ideal 3-D fluorescence imaging reconstruction algorithms, which cannot successfully estimate true signal intensity and location. Several publications using NIRF probes (660 nm excitation wavelength and 730 nm emission wavelength) have shown probe biodistributions and demonstrated normal that liver, skin, kidney and bladder can have high fluorescence signal intensity comparable to tumors or targeted tissue. 39,40 For example, the cathepsin B-based activatable probe (ProSense 750) has been shown to be highly activated in normal organs such as skin, liver, kidney and bone 17 and not just esophageal adenocarcinoma during upper gastrointestinal (GI) endoscopic examinations. Therefore, protease enzyme activation of ProSense probes in nonspecific organs, most notably bladder, kidney, and skin, largely contributes to the background signal when performing noninvasive in vivo imaging. Consistent with these other reports, in the present studies, the specificity of the NIRF 680 probe for colonic tumor detection was significantly compromised due to high background signals. Given this evidence, more specific activatable probes that are only activated in tumors need to be developed. Current algorithms are unable to correct the effects of attenuation and scattering of light penetrating through tissue and thus cannot successfully estimate true signal intensity and location, especially when the sources of the signals are weaker and deeper in the body. We have observed that the FMT 2500 system does much better job in reconstructing signals from superficial locations than signals from deeper within the body. The 3-D fluorescence imaging field has been continuously developing since the FMT 2500 system was put on the market in 2009. More 3-D optical imaging algorithms are being developed to make the signal estimation more robust and accurate with less error. 41,42 Our results suggest that caution should be used when interpreting in vivo 3-D optical results from the FMT 2500 system. Another factor that could mask the true fluorescent signal is bowel fecal content and food, which could generate an autofluorescent background when using in vivo nonendoscopic imaging. Previously, we observed that feces and food in the GI tract generate strong autofluorescent signals when imaged at 660 nm excitation wavelength (unpublished). We also imaged liquid diet ex vivo and showed minimum fluorescent signal, suggesting that feeding animals with liquid diet could lower autofluorescence in the GI tract. We further compared in vivo abdominal images from chow-fed animals with those from liquid diet–fed animals and found, in the latter animals, a significantly reduced whole abdomen signal intensity after giving cathepsin-activatable ProSense 680 probe injections, which demonstrated that 4 days of liquid diet feeding is sufficient to reduce the GI background during in vivo imaging. However, in the current study, animals were fed liquid diet for 4 days before in vivo imaging and the signals from activated probes in the tumors were still not strong enough to be differentiated from the surrounding nonspecific background signals, suggesting low resolution and low specificity of NIRF-activatable probes to detect spontaneous and sporadic intestinal tumors in vivo.
As reported previously, FMT imaging with NIRF probes is highly sensitive, but its spatial resolution is low. 40 Computed tomography has some benefits in high resolution and 3-dimensional reconstruction of tissue of interest, but its inherently low sensitivity results in poor soft tissue contrast. 43 Therefore, development of 3-D fluorescence imaging/microCT dual-model imaging with combined structural and functional information can be complementary for both imaging modalities. 44 In the current study, we coregistered FMT images with microCT images to optimize a better noninvasive imaging model in detecting intestinal tumors in vivo. As shown in Figure 6, an added advantage of FMT-micro-CT compared to standard FMT is that the 3-D distribution of activated probes can be evaluated in much more detail. We observed only slight overlap between FMT fluorescent images and microCT images, which is problematic when attempting to use FMT to detect tumors in vivo. With the advantage of high resolution, micro-CT detected more tumors than NIRF imaging with activatable probes. Several previous publications suggested success of NIRF scope to visualize tumors from inside the GI tract 10,12,13,17,18 ; however, this is an invasive method that can cause damage and is not suitable for patients who are unable to be sedated. As discussed previously, our noninvasive NIRF imaging method has limitations in visualization and quantification of intestinal tumors.
In conclusion, our results support the use of cathepsin-based-activatable probes in colon tumor detection by ex vivo NIRF imaging. Data presented here allow us to suggest that ex vivo NIRF imaging of cathepsin activity can potentially provide a rapid and objective method to monitor the effects of drugs on intestinal or colon tumors, particularly large tumors. However, our data also indicate the inability of activatable probes to differentiate between small adenomas and lymphoid aggregates or normal mucosa without histological follow-up. Our data also indicate some limitations of using real-time live animal FMT imaging as a nonendoscopic method for sporadic and spontaneous intestinal tumor detection. As it was used in our study, in vivo FMT is not a practical technique for noninvasive in vivo tumor detection and characterization. However, combining live animal FMT of intestinal tumors with other imaging modalities, such as microCT, may bring about an improvement in overall specificity and sensitivity of tumor detection.
Footnotes
Acknowledgments
The authors sincerely thank Dr Hans Herfarth (Department of Medicine, University of North Carolina) for assistance with mouse colonoscopy. The authors also thank Mr Josh Robbs for assistance in preparing this manuscript for submission. The authors also acknowledge J. Ashley Ezzell and the Histology Core Facility and Carolyn B. Suitt and CGIBD Histology Core by the Department of Cell Biology and Physiology.
Declaration of Conflicting Interests
The author(s) declared no potential conflicts of interest with respect to the research, authorship, and/or publication of this article.
Funding
The author(s) disclosed receipt of the following financial support for the research, authorship, and/or publication of this article: This study was supported by NIH grant DK047769 and a grant from the UNC University Cancer Research Fund (UCRF).
Supplemental Material
Supplementary material for this article is available online.
References
Supplementary Material
Please find the following supplemental material available below.
For Open Access articles published under a Creative Commons License, all supplemental material carries the same license as the article it is associated with.
For non-Open Access articles published, all supplemental material carries a non-exclusive license, and permission requests for re-use of supplemental material or any part of supplemental material shall be sent directly to the copyright owner as specified in the copyright notice associated with the article.