
Abstract
Social media platforms like Facebook and Twitter have emerged as effective channels for advertising that enable consumer targeting based on demographics, interests, and user behavior. Social media marketers have utilized information spillover within these platforms to reach a larger customer base. This information spillover also exists across groups of users within the platform and enhances returns from social media advertising. Thus, this information spillover can be utilized to strategically sequence targeted advertising to amplify the returns from social media ads. In this paper, we present a theoretical model for information retention and show that the sequential advertising strategy is effective in targeting groups of users on a social media platform. In addition, we provide empirical evidence through two series of randomized field experiments. From experiments for a health services organization, we find that sequential advertising campaigns provide 23% more clicks when compared to campaigns that target groups simultaneously, which translates to a saving of 18.7% in the advertising budget to achieve similar results as simultaneous advertising. Additionally, we found that sequential advertising campaigns targeting a smaller group first followed by a larger group provide 10.7% additional clicks when compared to targeting a larger group first followed by a smaller group. These results were consistent for consumer packaged goods that were advertised on Facebook and Twitter. These results provide implications for social media advertising research and practice.
Keywords
INTRODUCTION
Social media is transforming the way advertisers reach consumers using innovative targeting strategies. Social media platforms share consumer information with advertisers but leave the decisions about content selection, timing, and delivery to the advertisers' discretion. As a result, these advertisers experience a wide variation in ad costs and performance. Literature has studied the role of spillover effect on social media (Aral & Walker, 2011; Garg et al., 2011; Huang et al., 2020) and the process of scheduling advertisements to maximize revenue (Kumar et al., 2007, 2006; Shen, Li, Chen, et al., 2021). But, it is important, from both an academic and practitioner's perspective, to identify the value of the combination of the spillover effects on social media and social advertisement scheduling. In this paper, we propose and test a sequential approach for online advertising that exploits spillover effects to improve ad effectiveness (conversion and clicks). Hence, strategic advertising by sequentially targeting two groups of consumers can boost ad effectiveness by capitalizing on information spillover.
Advertisers can target consumers by demographics, interests, and affinities on online platforms where these consumer groups often overlap. Targeted advertising has been found to be more effective than traditional advertising, even for niche products (Leskovec et al., 2007). Facebook allows advertisers to target a specific audience based on location, demographics, interests, behavior, and connections (Facebook, 2017). For example, a coffee brand advertiser can target an audience of female users in the age range 18 to 40 who are interested in the Starbucks brand. Or, a health services company can target Texas residents in the age range 21 to 50 who follow humanitarian organizations like the American Red Cross. An advertiser may target the entire audience simultaneously with an ad campaign or strategically sequence the campaigns to subgroups of that larger audience to capitalize on spillover effects.
Therefore, this paper seeks to examine the ad effectiveness (e.g., clicks or conversion) of a sequential advertising strategy. Toward this goal, we first provide a theoretical model for information retention on social media platforms and analytically demonstrate that sequential social media advertising can lead to higher information retention. To test that theory, we conduct two randomized field experiments for two different industries (consumer packaged goods and health services organization [HSO]) on Facebook1 and Twitter. We found that sequencing social advertisements aimed at two groups (e.g., Starbucks followers and Coffee Bean and Tea Leaf followers) can provide better returns when compared to simultaneous advertising to those groups. For simplicity, we henceforward refer to these distinct groups of targeted consumers as large (e.g., Starbucks followers) and small (e.g., Coffee Bean and Tea Leaf followers) groups. We found that targeting a smaller group of consumers first, followed by targeting a larger group, is more effective in both clicks and conversions when compared to reverse sequence or simultaneous targeting. Finally, we also observe that when targeting each group individually, small groups provide better returns on Twitter and large groups provide better returns on Facebook.
The paper is organized as follows. Related literature on social media marketing is discussed in the next section. The theory of sequential campaigning is developed in Section 3. The experimental setup and results from the field experiments are presented in Section 4. The managerial implications and conclusion are discussed in Section 5.
LITERATURE
To develop the theory around information retention and to empirically estimate the role of sequential advertising across heterogeneous groups, we draw from the extant literature on advertising and information diffusion in information systems, marketing, and operations. Diffusion has been studied empirically since the mid‐twentieth century in the context of new pharmaceuticals being introduced in a physician's medical group (Coleman et al., 1957), in the imitation of a new technology or process across firms (Mansfield, 1961), and in the new‐product–related word‐of‐mouth (WOM) (Arndt, 1967). The extent of information diffusion (or WOM) can be mediated by the number of previous consumers (Bass, 1969; Mahajan & Muller, 1979), the strength of ties (Brown & Reingen, 1987), connectivity of ties (Stephen & Lehmann, 2016), or the information adoption rate among ties (Bakshy et al., 2009). Table 1 summarizes existing research on information diffusion, WOM, and targeting.
Literature table.
WOM plays a crucial role in the diffusion of information in a social network and can lead to a higher return on investment (Kumar et al., 2013). It is beneficial to target influential consumers at the beginning of a campaign, as they are likely to trigger purchases by others (Libai et al., 2013; Yoon et al., 2018), which is a consequence of the social interactions and visibility that are unique to social media. Still, consumers exhibit a multistage decision process where they respond best to higher level product information until they have narrowly construed preferences (Lambrecht & Tucker, 2013). Thus, initial awareness of a product provides higher level (e.g., product brand) information that may evolve customer preferences when she receives similar information from alternative sources like social media ads. In this case, strategic targeting could help optimize the returns from social advertising by first allowing information spillover from peers and then following with direct advertisement on the social media platform. In this paper, we present a theoretical model of consumers' retention of information and analyze the impact of the sequential ads over multiple groups.
Because of the challenges with clean identification of social influence (Anagnostopoulos et al., 2008; Manski, 1993; McPherson et al., 2001), recent empirical studies have developed methodologies to carefully measure diffusion of information in social groups (Garg et al., 2011) by running randomized field experiments (Aral et al., 2009; Castillo et al., 2014; Godes & Mayzlin, 2009; Tucker & Zhang, 2010), using dynamic panel data (Ma et al., 2014), or developing quasi‐experimental frameworks for panel data (Krijestorac et al., 2020). Since we are interested in studying the impact of temporal sequencing on social media campaigns, we control for externalities and exposure outside social media by utilizing randomized field experiments on three popular social media platforms (Facebook, Instagram, and Twitter). In this paper, we first present a theoretical model for information retention and utilize a randomized field experiment to estimate the effects of sequenced social ads across two different industries.
Sequential strategy is not new to operations. Moorthy and Png (1992) show that sequential introduction of products is better than simultaneous introduction when cannibalization can happen and consumers are impatient. Thus, Moorthy and Png (1992) found that introducing a high‐quality product followed by a low‐quality product reduces the substitution of the high‐quality product for a lower quality product. In the presence of outside options, however, introducing a low‐quality product first might be better to alleviate product substitution by price‐sensitive consumers (Pedram & Balachander, 2015). In the context of digital information, repeated consumption could lead to an increase in information retention—though too much repetition could cause information overload. Thus, in social media advertising, the spillover of information from one group to another plays a crucial role in complementing retained information. This spillover can help optimize the returns from the advertising budget by following a sequential advertising strategy.
Social media has also shown potential to improve operations, for example, ramping up inventory or allocating more storage for items trending on social media, assessing the importance of on‐time delivery, and extracting reasons for product returns from social media responses, extracting consumer sentiment to get advanced demand forecasts or new product assortments (Rooderkerk et al., 2022), and optimizing resources and relief packages during COVID (Gour et al., 2022). Research has also shown that revealing preferences and adopting a platform could reduce price sensitivity and increase purchasing behavior (Ba et al., 2022). Furthermore, advancements in technology can disrupt the existing production management processes through the use of new algorithms and optimization models with intelligent operations decisions (Choi et al., 2022). Our paper builds on that existing literature to utilize advertisement campaign sequence optimization to enhance the returns for the retail and service industries.
Furthermore, research has shown that strategic positioning of advertisements (Jerath et al., 2011), strategic network seeding (Dou et al., 2013), optimal network seeding in influencer marketing (Mallipeddi et al., 2022), scheduled sequencing (Kumar et al., 2007, 2006), optimized advertisement scheduling (Shen, Li, Guan, et al., 2021), and displaying advertisements based on conversion expectation (Mookerjee et al., 2017) can maximize revenue for all delivery platforms. Guha and Kumar (2018) provides state‐of‐the‐art and future directions of big data research in operations and information systems. While extant literature on operations does capture the importance of revenue‐maximizing advertising under limited resources (e.g., space, budget, or time) and explores sequential scheduling within a group, there is a gap in understanding of how sequenced information over multiple groups can maximize consumer conversions. Notably, sequential strategy has been explored in operations management (OM) literature in sequential auctions (Hausch, 1986), sequential product innovation (Liang et al., 2018; Sun et al., 2022), and sequential allocations in crowd‐sourcing (Tian et al., 2022). However, the role of sequencing in social media advertising still needs to be explored. In this paper, we investigate the role of temporal sequencing in scheduling social media advertisements across different user groups. Our paper builds on operations literature by contributing to the work on advertisement scheduling and sequential strategy. In the next section, we present our theoretical model for sequential advertisement scheduling to different groups on a social media platform.
THEORY
Social media advertising can be targeted to a specific group of people based on demographics such as age, gender, and location, and can include other characteristics such as interests or behavior. The goal of this targeting is to increase the exposure and retention of new information and lead consumers to desire, and action states (Barry, 1987; Wijaya, 2015). Traditional advertising funnels like AIDA (attributed to E. St. Elmo Lewis in 1898; Strong, 1925) explained various mental states (Awareness, Interest, Desire, and Action) experienced by a consumer before making a purchase. This advertising funnel was introduced to present the movement of customers along a unidirectional path from exposure to action, and did not take into account WOM, spillover effects, or social influence. On social media platforms, a WOM spillover of information from one individual to multiple other users can cause an increase in awareness of that information (Garg et al., 2011) or an increase in information retention because of longer exposure (Morrison & Dainoff, 1972) that can increase interest or desire to purchase (Gu et al., 2012; Yoo, 2009). Thus, this initial WOM spillover from any consumer can affect any of the other stages (exposure, retention, desire, or action) of the decision‐making process. Hence, targeting a group of individuals with an ad can create a cascade of information spillover to other individuals on the social media platform. Furthermore, literature on influencer marketing (Chae et al., 2017) has utilized various methods to show the existence of this spillover of information at the consumer level. We posit that the presence of this spillover allows us to increase the returns from a social media advertisement. This spillover effect across groups on social media provides the foundation for the value of a sequential advertising strategy versus a simultaneous strategy. Under the presence of multiple social groups and intergroup spillover of information, Figure 1 presents the updated advertising funnel that motivates our analytical model.
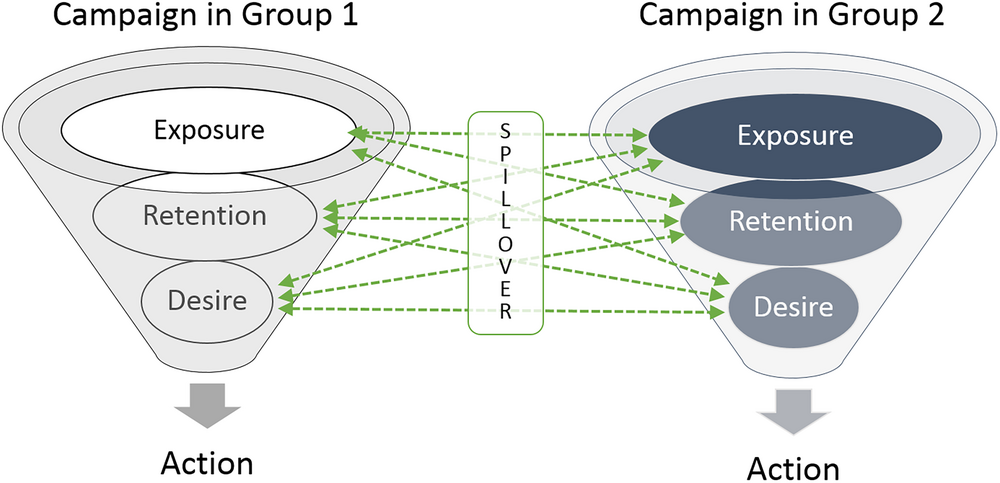
Marketing funnel and spillover.
Figure 1 shows that if users in group 1 are exposed to a piece of information, they will go through the various mental stages presented in the funnel, and during any stage, they can create a spillover (via “like,” “tweet,” “comment,” or other WOM mechanisms), which can influence users outside that group (e.g., group 2). For example, on Facebook, if one user “likes” a product, some of her friends can also get exposed to that product. These users can also cause increased retention of that product information or desire for purchase action (Bapna & Umyarov, 2015). Thus, advertisers can utilize social media platforms to increase returns by capitalizing on spillover between user groups.
Consider advertising campaigns over two groups on Facebook, say (1) Starbucks or (2) The Coffee Bean & Tea Leaf. Since there are more followers of Starbucks than The Coffee Bean & Tea Leaf, a consumer following the Starbucks page might be exposed to more information from Starbucks, or other followers of the Starbucks page, or social media advertisers targeting Starbucks followers (similar to the empirical finding in Gomez‐Rodriguez et al., 2014). Thus, if Madrone Mountain Coffee, a coffee startup, decides to advertise on these two groups, they can achieve larger exposure when targeting Starbucks followers versus targeting The Coffee Bean & Tea Leaf followers. Thus, Starbucks followers, being exposed to information from the internal group or external advertisers, are likely to be exposed to greater information volume.
We use this intuition to develop our theoretical foundation on information retention. Consider a piece of information that is displayed to a representative user j. As the amount of information displayed to user j increases, the retention will be inversely proportional to the amount of information presented to the user in that given time period. Therefore, a user is more likely to retain a particular advertisement if she is exposed to fewer posts on a page in a given time period. Suppose we consider an individual j who belongs to various groups 


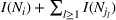


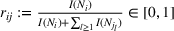


The subsequent decay of individual retention for groups with different sizes on Facebook and Twitter is shown in Figure 2 when a piece of information is presented at 
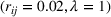
The decay of retention of an individual on Twitter and Facebook. Plotted for
As the size of a group increases, we expect that the number of individuals being exposed to the information, on average, increases concavely. The larger follower size attracts more users who are then exposed to an advertising campaign (Bass, 1969). Since aggregated retention is likely to be associated with product sales, we are interested in retention accumulated over time. Aggregating the information retained by all users j in a group i during any given time period [0, T] will allow us to measure how aggregated information in the group is changing over time due to the arrival of new users, users' exposure to information, and decay of information contained with users. Assuming 


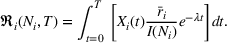
This aggregate retention is likely to impact the returns from an advertising campaign. Figure 3 shows different aggregate retention when targeting different size groups on Facebook or Twitter at the same time. Once a target audience has been exposed to some information, an advertiser can choose to strategically capitalize on social WOM to maximize the conversion from their social ad campaigns. This WOM spillover could take some time and could be within a targeted group or to an alternate, similar (and possibly connected) group. Thus, we extend this model (Equation 2) to capture this sequential effect across different groups (with possible overlap4). Thus, as a next step, we model the aggregate information retention for sequential information presentation considering cross‐group spillover.
The aggregate retention for small and large groups of Facebook and Twitter.
Sequencing
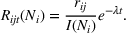
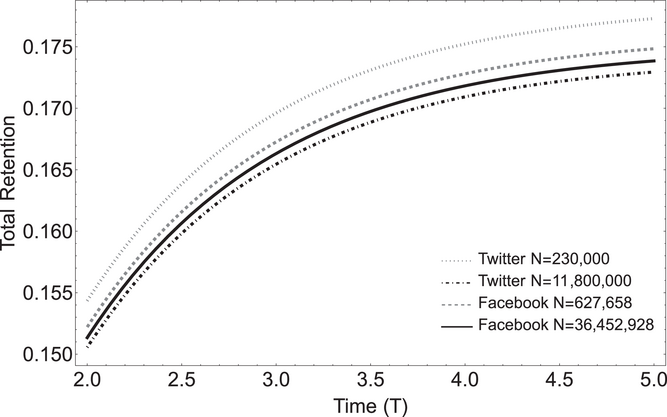
When the ad campaigns are carried out in two different groups (say 1 and 2) in sequence, a portion of the audience in group 2 could already be exposed to the campaign through group 1. This situation could happen due to any combination of the following reasons: (a) There is overlap between the audience of groups 1 and 2 that are presented with the information, (b) the engagement activity (such as likes, comments, or shares) of an audience in group 1 is made visible to some of the audience in group 2, or (c) a bridging tie5 between 1 and 2 creates a spillover. Due to sequencing, there will be a spillover of awareness from group 1 to group 2, which could result in greater exposure and retention. Figure 4 illustrates this point.
Spillover from people in group 1 to group 2.
As presented in Figure 4, the diffusion of information across any two groups could be a result of the overlap between the groups or possibly external uncontrolled factors (Garg et al., 2011). For example, an audience outside two targeted groups (gray, number 4) could observe the information through an influencer' s activity in one group and may spread the information to another group (yellow, number 5).6 Thus, diffusion of information through WOM can happen because of overlap in the targeted groups or through external factors. This would also depend on the social activity of users in the targeted groups and the amount of information to which each of these groups is exposed. It is also important to note that the extent of spillover from one group to another could depend on the platform structure and the exposure of other users' engagement activities on that platform.
Our goal in this paper is to understand the role of sequential advertising on a social media platform. When campaigning over multiple groups, the sequencing of the ad campaigns can be performed in multiple ways (permutation model). Similarly, advertising campaigns targeting two groups (say groups 1 and 2) can be performed in two ways temporally, namely, group 1 first or group 2 first. Consider two pieces of information (perhaps ads) presented in a sequence to these two groups. Without loss of generality, let the first piece be presented to group 1 (of size N
1) at If the spillover exists (


As the second piece of information is presented to group 2, the increase in aggregate retention happens because (a) additional users are exposed to the information and (b) some of the users are presented with the information twice, which increases the chances of information recall. Figure 4 shows how the information from one group could spread to another group over time. The information is first presented to the audience in the blue group (left, number 1) at 

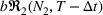
To capture this spillover, when information is presented to two groups in sequence (i.e., to group 1 at 


Due to sequencing, there will be a spillover of awareness from group 1 to group 2, which will result in higher overall individual retention. This situation is captured by the parameter 

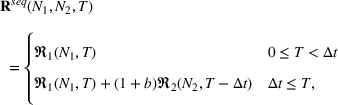
We can now analyze whether the group with higher aggregate retention from a single exposure (dominant group) should be the first in the sequence campaign. Figure 5 shows an instance where the dominant group need not be targeted first in the sequence campaign.7 The first exposure to the information occurs at 


The accumulated retention for two sequences: from N 1 to N 2 and from N 2 to N 1.
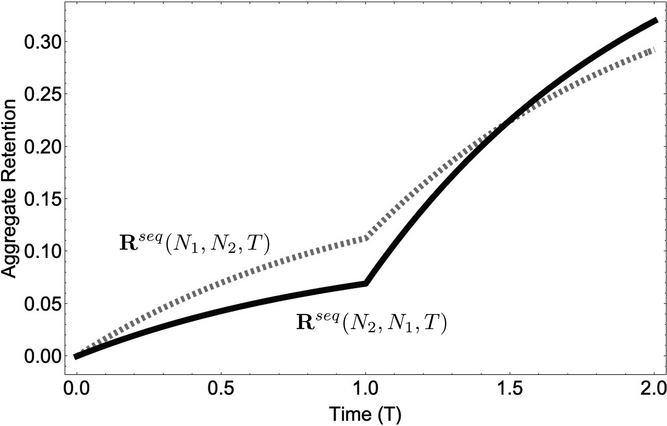
In the following proposition, we characterize the optimal sequence order when targeting two groups if the arrival rate of exposed users does not change over time, that is, Without loss of generality, say 


Proof of Proposition 1 is provided in E‐Companion.
Proposition 1 characterizes the optimal sequence order with the conditions on the ratio 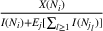


Model extension to simultaneous exposure
We can further generalize our theoretical model to incorporate additional advertising strategies like simultaneous (burst) advertising. In the case of simultaneous advertising, Equation (2) will have 

As a result, as seen in Figure 6, an individual's information retention presented in Equation (2) from simultaneous exposure may achieve higher retention during an earlier time period but may decay to a lower level during a later time period when sequentially shared information will have stronger retention. Thus, we posit that sequentially shared information within a group may have stronger retention during longer time periods when compared to simultaneous exposure to information because of information diffusion or spillover effects in a social network.
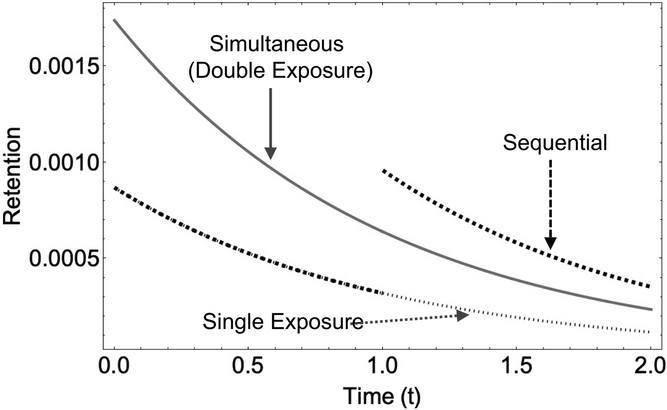
Retention (per‐individual) for the same group sequential versus simultaneous versus single exposure.
EMPIRICAL ANALYSIS
To empirically estimate the causal effect of sequencing on social media advertising campaigns, we conducted two sets of randomized field experiments: (1) We executed a large‐scale randomized field experiment (in partnership with an HSO) on Facebook and Instagram to test whether sequenced social ads indeed provide better returns compared to a baseline (simultaneous burst advertising), and (2) we executed a smaller scale randomized field experiment (for an e‐commerce retailer) to validate relative effectiveness of two different sequential strategies across two social media platforms (Facebook and Twitter).9 As per the AIDA model, exposure (ad impression) to a piece of information enables awareness that could lead to click/purchase (Gu et al. 2012; Yoo, 2009). Thus, for all experiments, we consider these digital advertising KPIs (clicks and conversions) to measure the outcomes.
From the first set of experiments, we found statistically significant returns (clicks) from the sequential advertising strategy. From the second set of experiments, we were able to find consistent results across different social media platforms that small‐to‐large‐group sequencing outperforms large‐to‐small‐group sequencing. Next, we provide experiment design considerations followed by results from these experiments.
Experiment design considerations
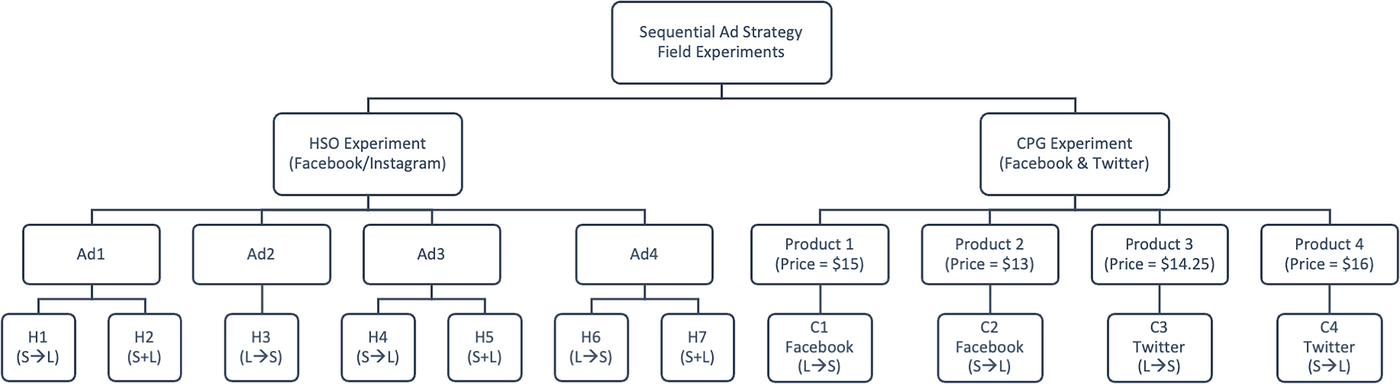
The randomized field experiments are designed to cleanly estimate the difference in simultaneously targeting two groups versus sequentially targeting those groups. In addition, the experiments estimate the differences in the direction of sequence (targeting the small group first vs. the large group first). Since we created eight experiments (four for HSO and four for CPG), the experiment design needs to limit the spillover from one experiment to the other. If we allow the overlap of users between any two experiments, we will create additional spillover and repeated exposures (Zhou et al., 2015) that will bias the estimates for experiments. Thus, for a clean randomized field experiment on social media platforms, we executed eight experiments (Figure 7: Ad1, Ad2, Ad3, Ad4, Product1, Product2, Product3, Product4) targeting nonoverlapping user groups. Within each experiment, we ran one or more ad campaigns that targeted user groups simultaneously or sequentially (leaf nodes in Figure 7). To identify an audience for each of the eight experiments, we first selected a broader audience interested in a topic (e.g., Starbucks, Red Cross of America) and then divided that audience based on physical location (e.g., living in the state of New York, living in the state of Texas) to minimize the overlap across the two experiments. Furthermore, we segmented by age (e.g., 18–30, or 18 to 65+)10 to change the size of the target groups within each experiment. We provide additional experiment‐level design considerations below.
Social ad campaigns.
Experiment setup: HSO
For the first study, in June 2019, we conducted several ad campaigns across four experiments on Facebook and Instagram in three US regions, where each experiment followed a sequenced or simultaneous strategy. Advertisements ran daily across two sequences of groups. The ad campaigns targeted groups with interests in either a small (The American Red Cross, ages 18 to 30) or a large (United Way of America, ages 18 to 65+) organization. Furthermore, asymmetry was introduced in the targeted audience groups by adjusting the target audience age range (e.g., ages 18 to 30 or 18 to 65+). All groups were targeted in the United States to maintain similarity in brand awareness. Multiple campaigns over six groups of users were executed over 10 days from Saturday to Monday (24 to 48 h) on Facebook and Instagram. Their potential reach ranged from 5600 to 35,000 users in target audiences based on region and brand affinity (The American Red Cross or United Way of America). Table 2 presents the summary of different groups that were targeted on Facebook and Instagram to test the sequential advertising strategy.
Social ad target groups (health services organization).
These six groups (G1–G6) of customers were targeted using four different ads resulting in a total of seven campaigns (represented as H1 to H7 in Figure 7). To avoid overestimation of the value of sequential advertising that could arise due to spillover of the same ad across different campaigns, we use visually different ads for each experiment to have a cleaner identification. Figure 8 provides examples of Facebook advertisements used in these campaigns.11 Each of the H1 to H7 campaigns ran for at least 24 hrs and no more than 48 hrs and achieved an average campaign cost per click of $3.30 with a total spend of $3996.42. These experiments targeted audiences that had not previously been targeted by the health services company. For all campaigns, spread across 10 days, the overall potential group size targeting American Red Cross and The United Way was 111,200. The campaign resulted in an actual reach of 71,423 and a total of 254,771 impressions. Data were collected every hour with all advertisement KPIs including impressions, clicks, money spent, click‐through rate (CTR), clicks‐per‐mille (CPM) impressions, and likes; we used clicks and impressions as our variables in the panel data analysis with 4‐h intervals of clicks and impression data (Table 3 presents the summary statistics). In online advertising, clicks and impressions have been used previously as representative measures of performance in ad pricing (Fridgeirsdottir & Najafi‐Asadolahi, 2018; Mookerjee et al., 2017). Table 4 presents model‐free evidence with four ad groups showing that the sequential ad campaigns performed better, on average, when compared to the simultaneous strategy.
Summary of continuous (hourly) explanatory variables used for panel data regression.
Abbreviations: HSO, health services organization; CPG, consumer packaged goods.
Model‐free evidence (clicks‐per‐mille [CPM] clicks/1000‐impressions of health services advertisements).
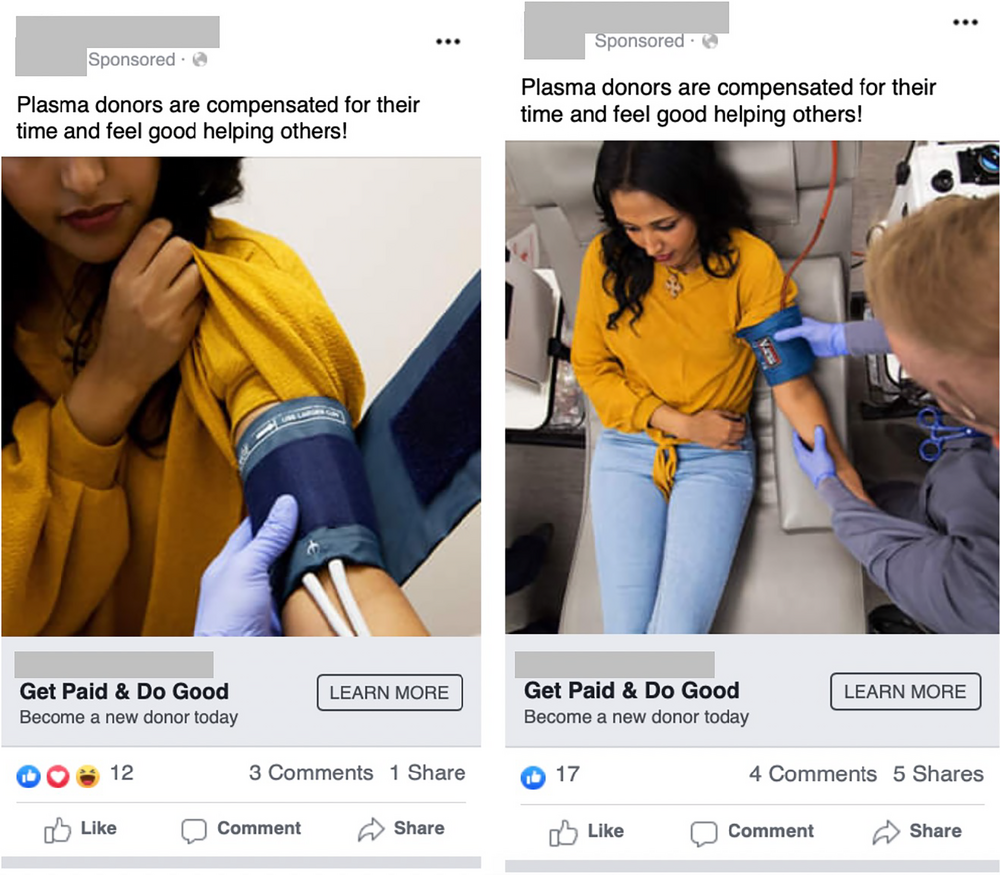
Screenshots of Facebook advertisements from the health services organization campaign.
Experiment setup: Consumer packaged goods (CPG)
The second study, aimed at CPG, was conducted in October 2016, where we executed four campaigns across both Facebook and Twitter (represented as C1 to C4 in Figure 7). We chose four products from the same category (coffee beans) served by the same seller on Amazon, and we advertised those products on Facebook and Twitter as shown in Figure 9. The goal of this study was to test whether our findings were generalizable (extending to another platform, Twitter, and in a different product category) with a focus on comparing the small–large group sequencing strategy with large–small group strategy.
A screenshot of an advertisement post from the consumer packaged goods (CPG) campaign category.
The products chosen had similar prices and shipping costs, similar characteristics (reviews, ratings, and recommendations), as well as comparable initial product rankings. These parameters helped us compare the campaigns from different sequences without being influenced by biases toward one kind of product over another.12 Furthermore, the products were chosen with no reviews or ratings to avoid any externality with existing user platforms or brand popularity. There were no running campaigns on Facebook or Twitter with these products. Table 3 provides a summary of the observed variables for the products (all other attributes were similar, such as ratings and reviews, before the campaigns).
The ad campaigns targeted consumers with interest in a large (Starbucks, ages 18 to 50, United States) and a small (The Coffee Bean & Tea Leaf, ages 18 to 50, United States) group. Therefore, these groups are asymmetric in their number of followers/likes and group activity (in terms of posts, likes, comments, and shares/retweets). These users were targeted on both Facebook and Twitter. As seen from Figure 7, campaigns C1 and C3 targeted a large group during the first week from Wednesday to Friday (1 to 72 h) on Facebook and Twitter, respectively. Campaigns targeting small groups took place in the second week from Wednesday to Friday (169 to 240 h) on the respective platforms. For the alternate sequential advertising, campaigns C2 and C4 targeted small groups first and later the large groups on Facebook and Twitter, respectively. These ad campaigns had a total cost of $120 on Twitter and $240 on Facebook.13 Additionally, product‐rank data were recorded for more than 144 hrs (during the campaign execution).
Every hour, we collected data on (1) product: price, shipping cost, estimated shipping times, product rank in the groceries category,14 and prices of related products displayed on each product's page; (2) advertisement KPIs: impressions/reach, clicks, money spent, CTR, clicks‐per‐1000 impressions, and so on; and (3) group details: number of followers/likes, top post details (likes, shares, comments), likes for trending posts, and more. Any time period with missing data was dropped. The number of followers on the Starbucks and The Coffee Bean & Tea Leaf pages (i.e., the size of the group (
Results: HSO
In the first set of experiments, to estimate the effect of sequencing, we executed seven campaigns, each with the same budget, which targeted groups either in sequence (i.e., small‐to‐large or large‐to‐small) or simultaneously. Groups were targeted based on interests related to either the American Red Cross or the United Way of America. In order to reach separate groups, ads were targeted to three nonoverlapping regions in the United States. The average estimated audience size was 6067 for the American Red Cross audience and 31,000 for the United Way of America. Results were estimated with clicks as the dependent variable, using a fixed effect panel data regression model with the following empirical specification for this experiment: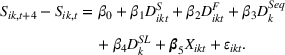
In Equation (4), 


Panel data regression model for health services company (Facebook and Instagram).
Significance level 0.1*, 0.05**, 0.01***.
In Table 5, we consider two sequences: (a) small first and large later (SL) and (b) large first and small later (LS). The coefficient of the dummy variable 

From Model 2 in Table 5, we find that sequential advertising campaigns provide 10.61 (β3) more clicks when compared to campaigns that target groups simultaneously. This translates to 
To further explore the generalizability of these results, we conduct a series of additional randomized field experiments for an alternative product category on two distinct social media platforms (Facebook and Twitter). We present the empirical model (similar to Equation 4 above) in the next section, followed by empirical results.
Results: Consumer packaged goods (CPG)
We conducted another set of randomized field experiments to investigate the relative returns from the two different sequence orders: (1) a campaign targeting a large group first followed by a smaller group and (2) a campaign targeting a small group first followed by a larger one. For these experiments, CPG products from Amazon.com were advertised on Facebook and Twitter. The product ranks on Amazon were used as a proxy for sales (Chevalier & Mayzlin, 2006; Godes & Mayzlin, 2004). As this experiment was focused on comparing two sequences, the baseline was set as the large‐to‐small sequence. The first‐difference, fixed‐effect, panel data regression model specification for this experiment is given as follows:
Using the hourly product rank data, we estimate the difference in sales as 


Thus, in Equation (5), β1 is the impact of targeting a small group (i.e., The Coffee Bean & Tea Leaf), and β2 is the impact of targeting sequentially small‐to‐large groups. We conducted two experiments each on Facebook and Twitter to measure the platform effects. The platform‐specific coefficients of panel data regression given in Equation (5) are presented in Tables 6 and 7. For each of the Facebook and Twitter regressions, the analysis considered the following three models: (1) partial model to measure the effect of targeting a small group (i.e., with 


Panel data regression model for CPG coffee (Facebook).
Note: No. obs. = 66.
Significance level 0.1*, 0.05**, 0.01***
Panel data regression model for CPG coffee (Twitter).
Note: No. obs. = 58.
Significance level 0.1*, 0.05**, 0.01***.
From Table 6 (Models 2 and 3), we observe that sequentially targeting small groups first followed by large groups on Facebook provides an increase in sales (as measured by a decrease in ranking) by approximately 0.01% (β2) during each 4‐h window. Considering the average CTR from Table 3 is about 2% for CPG, 0.01% increase translates to an additional gain of 0.5% sales for every 4 h by targeting a small group first on Facebook. Table 7 (Models 2 and 3) presents similar results when sequentially targeting small groups first followed by large groups on Twitter, where sequentially targeting provides an increase in sales (as measured from the change in ranking) by approximately 0.02% during each 4‐h window, which translates to 7% gain in sales.16 The coefficient estimates for 
Overall, from multiple randomized field experiments on different social media platforms (Facebook, Instagram, and Twitter) and targeting different industries (HSO and CPG), we find that sequentially targeting a small group first followed by a large group consistently provides higher clicks and conversions. This empirical finding supports the results discussed in Proposition 1 and is reflected in the statistically significant coefficient for sequence dummy (
Sequencing and platform heterogeneity
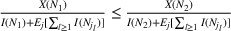
To further investigate the differences in aggregate retention between two advertising sequences over time, we present the difference in aggregate retention (Equation 3) accumulated as a consequence of sequencing on Twitter (dashed curve) and Facebook (solid curve) in Figure 10.17 The first campaign was executed at 


The benefit in aggregate retention generated for campaigning with a small‐to‐large sequence over a large‐to‐small one
If we focus on the curve at the end of the time frame (i.e., 


DISCUSSION
In this paper, we present a model to study the impact of sequential advertising strategies on social media and provide empirical evidence using a series of randomized field experiments conducted on Facebook, Instagram, and Twitter. We find that strategic sequential advertising can provide higher returns—both in terms of clicks (Awareness to Interest in the AIDA framework) and conversion (Awareness to Action in the AIDA framework)—possibly because of the WOM in social media. We found that any two social media platforms might behave differently (i.e., targeting small group is better on Twitter, whereas targeting large group is better on Facebook), but, interestingly, the sequence order of targeting a smaller group first and large group later provided better returns on both platforms. To the best of our knowledge, this is the first study that presents an information retention model to develop an analytical method and to provide empirical evidence for improving returns from social media advertising campaigns using a sequential strategy.
Sequential campaigns allow the exploitation of spillover effects of information from one group to another through WOM. Hence, sequential campaigns are better than simultaneous campaigns. Furthermore, as small groups are less overloaded with information than larger groups, in a sequential campaign, targeting a smaller group first creates higher retention, and hence, more clicks and sales. Our experiment suggests that overall sequential advertising leads to a saving of 18.7% in the advertising budget, making it an effective advertising strategy.
From a managerial perspective, this strategic sequencing of advertising campaigns can help improve returns on advertising dollars. On all social media platforms, managers could split the audience into two groups and sequence the campaigns, rather than presenting simultaneously, to maximize the returns. Typically, social media advertisements are developed with one of two focal strategies: (1) simultaneous targeting of all potential consumers or (2) repeated targeting of a smaller consumer base. The first advertising strategy focuses on maximizing exposure, whereas the second strategy focuses on maximizing conversion. Using the sequential advertising strategy, advertisers can balance this trade‐off by exploiting the spillover effect. This spillover exists because of overlap between two groups of users—users that may have multiple preferences (e.g., liking both Starbucks and The Coffee Bean & Tea Leaf brands) or users who may have memberships in multiple social groups (e.g., both the American Red Cross and United Way of America). Sequential advertising helps utilize spillover effect from one group to another because of this overlap. Furthermore, we found that starting with a smaller group first can encourage higher information retention per user, which can then enable stronger spillover effects—thus maximizing the effects of sequential advertising.
Related benefits may also be generalized beyond sequencing within a social platform. For instance, marketing firms may consider alternative sequencing strategies that go beyond platforms but also include devices and locations. By optimizing the utilization of their advertising budget and maximizing the outcome (such as awareness, penetration, or engagement), marketing firms could train the model and strategically invest in ads across multiple groups/platforms/devices/locations. For example, if Red Bull chooses to run a Facebook campaign for coffee lovers for 2 weeks, Facebook may automatically choose to run the campaign first to users interested in The Coffee Bean & Tea Leaf and then to users interested in Starbucks. Thus, our model can be implemented on these subgroup sequences, yielding better outcomes than running a campaign randomly. Insights and applications of our model can be also extended to other advertising channels such as search and display advertising like Google Ads. Temporal sequencing of ads across various websites (e.g., New York Times and CNN) could be used to target an audience strategically, gaining higher brand awareness or conversion rates and strengthening advertisement positioning across various pages. The operational (in particular, strategic) decision of temporal sequencing could further enhance the existing understanding of the optimal positioning of advertisements in online search advertisements.
Limitations and future directions
Similar to any empirical research in social media, our work also has some limitations around cleaner identification. For instance, a field experiment on social media platforms cannot tease out the potential effects of learning by these platforms. It is possible that social media platforms like Facebook can learn from each advertising campaign to adjust attributes (e.g., audience targeted) for improving the ad impressions and conversions from future ad campaigns. That said, if such learning exists in practice, pursuing sequential campaigns on social media will help advertisers further enhance the returns from their ad campaigns. Moreover, our results are aggregated and averaged at the group level and have the potential to be extended to the individual level. One can further our study to create and measure these spillovers at an individual level, where we can estimate the role of various user and network characteristics.
Furthermore, we tried to generalize our findings across two different platforms to achieve robustness. We also recognize that our analytical model is limited to the repeated exposure of a specific piece of information. However, the re‐exposure could consist of a mixture of information types (such as text, image, or video), which may affect the extent of retention. While interesting, the effects of heterogeneous, rich media on our model are beyond the scope of this paper.
There are several promising directions for future research. For instance, Chuang et al. (2022) study the role of inventory inspection timing in the presence of the decay of information. A similar approach could be used to extend our study to optimize the sequential campaign timing to maximize information retained in groups of users. Next, in this study, we consider sequencing over only two groups. It would be interesting to extend the analysis to sequencing over multiple groups, possibly over multiple platforms. Krijestorac et al. (2020) investigate the impact of cross‐platform spillover on the consumption of viral content. With digital advances, sequencing over multiple platforms, devices, and media would be the next great leap. Furthermore, the inclusion of individual social media information can improve the accuracy of a firm's sales forecast (Cui et al., 2017). Such an improved demand forecast enriches the strategies to boost revenue. However, the feasibility of accessing such information poses challenges, not to mention the ethical conundrum of handling such data.
Footnotes
ACKNOWLEDGMENTS
We are thankful to Dr. Subodha Kumar (the department editor), the anonymous senior editor, and the anonymous reviewers. Their feedback has substantially improved the paper. We also thank the members of the INFORMS Social Media Analytics Section, and attendees of the Marketing Science Conference, Conference on Digital Experimentation, DSI Conference, INFORMS Annual Meeting, POMS Conference, and Conference on Digital Economy.
1
Facebook and Instagram ads are merged in the health services experiment.
2
We use
3
Note that we distinguish the notations t and T. T is reserved for the campaign's total time interval.
4
Nonoverlapping groups would imply targeting completely different audiences, and fully overlapping groups would imply retargeting to the same audience.
5
6
We allow this overlap between groups within one experiment but not across experiments. In this study, we execute eight experiments to estimate the sequential advertising effects empirically.
7
Plotted for
8
For the cleaner insights, we focus on a simpler case when
9
We ran the small‐scale experiment (2) earlier to test our theoretical model and then ran the large‐scale experiment (1) later to build on the generalizability.
10
One can segment an audience based on various other demographic characteristics that are made available on each of the social media platforms (Facebook, Instagram, and Twitter).
11
Both male and female models were equally featured throughout the sequenced scheduling of the ads.
12
We chose the products such that the possibility of cross‐product recommendation was minimal. The products listed in “You May Also Like” or “People Also Viewed” on the Amazon page did not list any of the products chosen for the experiment.
13
We started with a small advertising budget to test if strategic sequential advertising would provide any return on a small budget. This initial experiment provided the evidence and support for expanding the study to a larger scale randomized field experiment for HSO.
14
The product rank in the groceries category was perfectly correlated with overall product rank, so we used grocery product rank as our variable in the analysis.
15
We executed panel data regression with
17
Plotted for
18
The time frame is a relative scale.