
Abstract
The United Nations Sustainable Development Goals have recently emphasized the importance of diversity inclusion. Motivated by this goal, we examine the impact of employing individuals with disabilities in apparel manufacturing cells on overall team productivity (PD). We formulate a series of deterministic and stochastic PD maximization assignment problems to study the impact of disability inclusion on a production line. We extend the baseline PD maximization formulation to study a multi‐objective problem that simultaneously maximizes PD, disability diversity (DD), and language diversity (LD). Each analysis is performed across two different garments drawn from a real‐world setting. The models are tested using archival time study data collected in partnership with an apparel manufacturing firm where more than 75% of the billed work hours are from individuals with significant disabilities. The following insights emerge from the analyses. First, the PD of teams that have individuals across multiple, different types of disabilities is higher than the PD of teams with employees who share a single, specific type of disability. Second, teams that employ both individuals with and without disabilities perform slightly better than teams that consist of only individuals with disabilities. In some instances, contrary to intuition, teams of only individuals with disabilities even have higher PD than teams of only individuals with no disabilities. Finally, our results from the multi‐objective problem that simultaneously maximizes PD, DD, and LD suggest that PD is not generally sensitive to increases in DD. However, PD is sensitive at extreme levels of DD and LD. Limitations and possible future extensions of the study are discussed.
Keywords
INTRODUCTION
Diversity, equity, and inclusion (DEI) has become an important component of sustainable economic and societal growth. Ensuring DEI in employment is explicitly emphasized in the United Nations’ Sustainable Development Goals (SDG) (United Nations, 2015). The elimination of inequalities among individuals is embodied in the pledge “Leave No One Behind.” This pledge conveys the aim to include individuals with disabilities, from different cultural backgrounds, and with different abilities in the workplace (Mohammed, 2019; UCLG, 2018). Further, disability inclusion is regarded as the next frontier of corporate social responsibility and a critical component of diversity. It is monitored and valued by regulators and investors (Accenture, 2018).
In the United States, individuals with disabilities are a substantial part of the economy. In 2022, about 12% of the population had some form of disability, with older individuals more likely to have a disability. Individuals with disabilities are roughly: (a) one‐third as likely to participate in the labor force (23.1%) as opposed to individuals without (67.8%), (b) twice as likely to be unemployed (7.6%) as compared to individuals without (3.5%), and (c) twice as likely to work part‐time (30%) as compared to individuals without (16%) (BLS, 2023). Collectively, these point to a pattern of unemployment and/or underemployment. To combat this, disability inclusion has become a priority for an increasing number of companies that pursue inclusion efforts to hire and integrate employees with disabilities into their regular workforce. For example, large firms such as Microsoft, Bank of America, Walgreens, and JP Morgan have already implemented programs on disability inclusion (Accenture, 2018).
In addition to disabilities, the inclusion of individuals across languages is another important dimension of sustainable development. Language forms a foundation of communication (Piekkari et al., 2015; Tenzer et al., 2017). A diverse range of languages is an important trait in a multi‐cultural workforce (Lazear, 1999a). In environments where individuals need to work with others in teams, language barriers can adversely impact team productivity (Hicks, 2015). Specifically, individuals with disabilities are likely to face substantial communication barriers (CDC, 2020). Many individuals who are physically disabled also experience language challenges, which makes it difficult to find or switch jobs, impacting their ability to live independently (Kindy, 2019).
Many not‐for‐profit firms that support individuals with disabilities face substantial challenges to remain viable. These enterprises that provide rehabilitation to employees with disabilities struggle financially (Santos et al., 2015). They cannot focus purely on production efficiency. Rather, these firms must split their focus between improving employment opportunities for individuals with disabilities (a core mission) and maximizing productivity. Many of these firms also must devote resources to seeking out external sources of funding (including from governments), in addition to supporting their own operations (Akbulaev et al., 2019). Therefore, it is critical for these firms to balance the need for improving productivity alongside inclusion.
The current literature lacks a systematic assessment of team productivity in the context of the employment of individuals with disabilities, particularly in settings where individuals also speak a diverse set of languages. To fill this gap, we examine the influence of disability and language inclusion on team productivity in an apparel manufacturing setting where individuals with different disabilities and native languages work together. We partnered with Peckham Inc.’s, a work integration social enterprise (WISE) in Michigan, apparel manufacturing unit. The firm predominantly employs workers with disabilities in addition to diverse languages and ethnic backgrounds.
Our work aims to address the following research questions: RQ1: What is the implied cost of disability diversity with respect to team productivity ? RQ2: What is the impact of disability diversity and language diversity on team productivity ? RQ3: What are the trade‐offs between disability diversity, language diversity, and productivity? In this paper, we examine the research questions using archival time study data and simulate an apparel assembly line to investigate how disability diversity and language diversity collectively impact productivity. We use both single‐objective and multi‐objective problems to assess the impact of disability diversity and language diversity on the productivity of an apparel line.
To accomplish this, we first examine the implied cost of disability inclusion (RQ1) on a team's productivity (PD) using apparel manufacturing as a setting. The implied cost is assessed through the creation of simulated lines whose objective is to maximize PD where teams are constructed from individuals that: (a) have no disabilities, (b) are restricted to a specific type of disability, and (c) are drawn from varying combinations of different types of disabilities. The teams are constructed using deterministic optimization with the production rates for each step of the manufacturing process drawn from prior time studies. We also use stochastic optimization to study the same numerical scenarios and solve the problem using a heuristic algorithm to take the problem closer to real‐world settings. Further, the stochastic multi‐objective problem allows us to better assess the trade‐offs across PD, disability diversity (DD), and language diversity (LD) simultaneously.
Our results show that a production line that comprised individuals who have differing types of disabilities could achieve higher optimal PD than one with individuals with only a specific type of disability. In some cases, where individuals are picked from multiple types of disabilities, the teams perform better than teams where individuals have no disabilities. When workers from a diverse range of disability types are employed, it provides lines with greater flexibility in assigning workers to tasks, which helps increase PD in addition to inclusiveness. Overall, our results suggest that firms that support individuals with disabilities may be better off supporting individuals across a spectrum of disabilities.
Questions RQ2 and RQ3 focus on how inclusion across DD and LD impacts PD and their relative trade‐offs. To examine RQ2, we extend our optimization framework formulated in RQ1 to design multiple scenarios with the objective of maximizing PD with several constraints in different scenarios. These scenarios include: (a) unconstrained case (no constraints on the employees’ disability types), (b) partial disability inclusion (at least one employee from each disability type is picked), (c) maximum disability inclusion case (disability inclusion is maximized using the Blau index; Harrison & Klein, 2007), (d) partial disability inclusion with maximum language inclusion (LD is maximized from the partial inclusion case, scenario (b)), (e) maximum disability inclusion with partial language inclusion (DD is maximized holding the LD from scenario (b)), and (f) extreme inclusion case (both language and disability diversities are restricted to their respective maximum values). We observe that the decrease in optimal PD is minimal with increasing inclusion of DD. The decrease in PD is substantial when LD is extreme in parallel with extremely high levels of DD. This PD drop likely happens due to a drop in the level of allocation flexibility.
We also evaluate the trade‐offs across several objectives by using a multi‐objective optimization approach that simultaneously maximizes PD, DD, and LD in a stochastic setting to find multiple Pareto‐optimal solutions for the three objectives. Our findings from the deterministic setting continue to hold. Furthermore, consistent with intuition, teams that have a mix of individuals with and without disabilities Pareto dominate teams that have only individuals with disabilities.
In the remaining parts of this paper, we survey the related literature in Section 2. Peckham Inc. (our study site) and the context in which the firm operates are described in Section 3. In Section 4, we describe our data, the analysis methodology, and discuss the implied cost of disability inclusion when the processing times are deterministic and stochastic. In Section 5, we discuss the impact of disability and language diversities on team PD and their trade‐offs. In Section 6, our findings are discussed along with key limitations.
LITERATURE REVIEW
This section briefly reviews the literature on diversity in general, and more specifically, DD and LD.
Research on diversity
The impact of diversity inclusion on team performance has been widely studied. Prior studies have examined gender, racial, demographic, values, beliefs, and attitude‐based diversity and their impact on team performance. These studies focus on the impact of diversity in top management teams (e.g., Webber & Donahue, 2001). Specifically, Herring (2009) shows that racial diversity in firms is associated with increased sales. Hoogendoorn et al. (2013) explore the relationship between gender diversity and team performance. Erhardt et al. (2003) examine the impact of demographic diversity in the board of directors on firm financial performance. Marimuthu and Kolandaisamy (2009) empirically examine the effect of ethnic and gender diversity of boards of directors on financial performance. Within the operations management literature, Huckman and Staats (2011) explore the impact of team diversity on the performance of software teams. Staats (2012) examines the impact of team familiarity on the performance of software teams. Narayanan et al. (2014) and Akşin et al. (2021) examine the role of diversity in task exposure on team performance.
In contrast to prior operations management and strategy literature, we focus on manufacturing lines and explore the impact of DD and LD of a team on its PD. Further, while prior studies pursued an empirical approach, our paper utilizes a modeling approach that uses time study data to examine the impact of diversity on teams’ PD. Specifically, our objective is to examine the implied cost (in PD terms) of employing a team of workers with disabilities by simulating production lines. In addition, we also examine the trade‐offs between PD, DD, and LD.
Disability diversity
There have been conflicting findings about diversity management approaches in past literature related to the employment of individuals with disabilities (Woodhams & Ardha, 2000). Studies note that it is challenging to simultaneously integrate individuals with diverse disabilities in team‐based settings and achieve high PD (Hernandez et al., 2008). Within the context of employing individuals with disabilities, much of the existing research is in the rehabilitation literature or settings where individuals with disabilities work on their independent tasks (e.g., Egede, 2007; Muchmore et al., 2003). However, the literature is unclear about the impact of DD on team performance (Thanem, 2008). Other research suggests the idea of “collective superiority” in that groups are superior in task execution than individuals. The impact of disabilities can be mitigated by leveraging individual skills for specific tasks within a team (Miralles et al., 2007). Ford and Crowther (1922, p. 87) provide the earliest example of potential DD in action within workgroups. Specifically, they classify jobs in the factory based on specific abilities required rather than the common assumption that all assembly line jobs demand equal physical strength. They argue that employees with physical deformities or with lower physical strength could perform assigned tasks in the plant. Recent research examining the impact of DD on PD using empirical data suggests that it is possible to increase PD by employing individuals with multiple distinct types of disabilities (Narayanan & Terris, 2020). In answering similar questions, we aim to set up counterfactuals to understand the implications of deploying multiple types of disabilities on team PD and extend our understanding to examine the simultaneous influence of LD.
Language diversity
In addition to DD, teams also face challenges from employing individuals across diverse languages. Languages may have a similar impact to disability. Specifically, language influences how employees interact and communicate with one another, and thus influences performance (DiStefano & Mazneski, 2001; Lazear, 1999a). In the early days of the assembly line, workers came from different language/cultural backgrounds. This was seen as an issue. One of the primary functions of the sociological department at Ford Motors was to control the influence of these differing backgrounds and train employees in local languages that facilitated better communication (Ballaban, 2014). The department's aim was not just to control turnover but the belief that a homogeneous language within a group would likely help improve assembly line PD.
In an influential article, Lazear (1999a) discusses the role of language in the context of the rise of multiculturalism in business environments. While language impacts international trade (Lazear, 1999b), its impact on manufacturing teams is less acknowledged. Studies such as Kahane et al. (2013) find that the presence of foreign workers—measured by languages—increased the performance of the overall team using data from the National Hockey League. Similarly, Hamilton et al. (2004) and Leonard and Levine (2003) study the impact of worker LD on firm performance. Hamilton et al. (2004) focus on ethnicity variation in the apparel industry and find that teams with individuals from one ethnicity are more productive than teams with individuals from multiple ethnicities. Leonard and Levine (2003) study LD in a retail setting and instead find no impact on store performance. Overall, it is unclear how the diversity of language backgrounds that employees bring into the group influences the PD of teams. Our research fills this important gap in the literature by exploring the simultaneous impact of disability and language diversities on team PD.
STUDY SITE, PECKHAM INC
Founded in 1976, Peckham Inc. is a non‐profit vocational rehabilitation organization that prides itself on providing a range of opportunities to individuals with disabilities. It is among the largest vocational community rehabilitation programs in Michigan. The firm offers 32 human service programs and has five key business areas. Our work focuses on the manufacturing organization specializing in high‐value and high‐quality apparel manufacturing. The firm operates under the auspices of AbilityOne, an independent federal agency. Contracts with AbilityOne mandate that 75% of the hours billed are from workers with significant disabilities. The disabilities and language backgrounds of employees on the floor are diverse since the firm supports employees with diverse disabilities as well as refugees from various countries, most of whom may not share English as a native language. Disabilities are externally certified by physicians. Many of the employees with disabilities are provided with specific accommodations on the production floor to support their ability to perform the work. A detailed introduction to the firm is in Appendix A in the Supporting Information.
STUDY APPROACH
To examine the key research questions, we pick two garments (Garment A and Garment B). These garments had a history of high‐volume production. Further, the manufacturing lines for these garments were balanced for flow, and employees were allocated to different steps. The garments differed in their level of complexity with regard to staffing and the average number of steps per employee. Garment A had 23 steps and needed 17 employees with 1.35 steps (on average) per employee (considered simple). Garment B had 62 steps and needed 12 employees with 5.17 steps (on average) per employee (considered complex). For each garment production line, we obtain (i) a copy of the line layout, (ii) the standard production rate of each step, (iii) the steps an individual had to perform should they be assigned to the line per balancing information, (iv) the precedence relationships of the steps, and (v) the difficulty level of each step.
Study data
The input data to simulate the line came from time studies the firm undertook on employees who worked on the production lines. We used data from 1,554 instances of employee time studies that were performed over a period of 5 years from April 2011 through March 2016 within the firm to construct the production rate estimates for an employee across different sewing steps and consequently the pace of the line. Each time study instance was matched to the specific employee's primary disability type, language type, and difficulty level of the job (details of disability types, language type, and job difficulty level are presented below). Individuals are anonymized to protect any possibility of identification. Further, each time study instance recorded an employee's actual productivity for a specific garment step, expressed as a percentage of the standard production rate. The standard production rate (pieces per day) of a step is the pre‐determined rate at which an individual would have to work to achieve the target takt time for the overall line. This standard production rate for each step was detailed in the line design for the product and expressed in pieces per day for the specific step. The takt time is calculated to meet the target cost of manufacturing the garment. To prepare input data for the simulation, we used the average and standard deviation of the actual productivity from the time study data for each disability type, language type, and job difficulty combination. Using the standard production rate (pieces per day) and the actual productivity (a percentage number) of each step of a particular garment, the actual production rate for the step assigned to an employee with a specific disability and language combination can be determined as: actual production rate= actual productivity × standard production rate. To account for outliers in the time study, we winsorized the actual productivity data at the top and bottom 5% and replaced the values of these top and bottom 5% of actual productivity data with the next values inward from the respective top and bottom ends. During the preparation of the actual productivity data, we trimmed the data to ensure that the resulting coefficient of variation for each disability, language, and job difficulty combination was 0.2 or below. This was done with the intention of avoiding extremely variable, managerially irrelevant, solutions.
The firm originally had 10 disability codes and 22 language codes. In addition, the difficulty of jobs across the firm was categorized into three levels—basic, medium, and difficult. This resulted in 660 possible combinations of actual productivity numbers. However, we did not have enough time study data to estimate the actual productivity of each combination of disability, language, and job difficulty. Therefore, to simplify the disability and language types, we worked with the managers to combine both disability and language codes into larger sets, primarily relying on their experience and judgment. Specifically, disability types are narrowed down to five: (0) none, (1) mental disabilities, (2) physical disabilities, (3) cognitive disorders, and (4) short‐term disabilities. Language types are narrowed down to six based on the regions where the language was spoken. The six regions are: (1) the United States (English), (2) South Asia and Middle East (languages such as Hindi, Nepali, Urdu, and Farsi, among others), (3) Spanish, (4) Far East (languages such as Cantonese), (5) Africa (languages such as Swahili, Kirundi, and Somali), and (6) Eastern Europe (languages such as Bosnian).
Productivity maximization problem and implied cost of disability inclusion
We first focus on maximizing the overall line PD (total number of garment pieces produced by the line per day) of an apparel manufacturing cell by varying the diversity of individuals with disabilities. We formulate and solve a deterministic problem where the completion time of a step when assigned to an individual is deterministic, and we take the expected processing time that is derived from the time study data as described in Section 4.1. We then formulate a PD maximization problem with stochastic completion times of steps in the line and describe our solution approach and the resulting findings. This set of analyses explicates RQ1.
For the deterministic problem, we combine the “steps” an individual has to perform in the production process of an assigned garment into a task. We use the average production rates at the step level to calculate the average production rates at the task level (a combination of steps) for the deterministic problem based on the existing line balancing information. For a given production line, both the number of employees needed and the task that an assigned employee works on are dependent on the existing line balancing information. These lines were balanced in the plant after several rounds of trial and error. The line PD for a given assignment is determined by the production rate of the bottleneck.
For the stochastic problem, we generate sample paths of step‐level completion time in a production line to evaluate the line PD for a given assignment since the step‐level production rates are stochastic and the bottleneck can shift. We now detail the feasibility constraints of our assignment problem (common across both deterministic and stochastic settings) and then describe the objective function(s).
Feasibility constraints
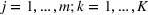
For a given garment, let m denote the number of tasks that the production line consists of (recall that each task is a pre‐specified combination of multiple steps), and n denote the total number of available employees for assignment (


The firm had three classification levels for each step (basic, medium, and high difficulty) and three employee skill levels (1, 2, and 3). The difficulty level of a task is set as the highest difficulty level of the steps that comprise the task. An employee assessed at the highest skill level (Skill Level 3) could perform tasks across all difficulty levels (i.e., basic, medium, and high difficulty tasks); an employee assessed at Skill Level 2 could perform basic and medium difficulty tasks; and an employee assessed at Skill Level 1 could only perform basic difficulty tasks. Let


Notations.
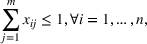
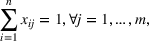
These constraints ensure that: (1) one employee cannot be assigned to more than one task; (2) all tasks must be completed; and (3) for each task, the skill requirement of the task must be satisfied by the employee assigned to the task.
To examine the impact of disability inclusion, we design numerical scenarios where teams could be constructed that: (a) have no disabilities, (b) are restricted to a specific type of disability, and (c) are drawn from varying combinations of different types of disabilities. For each scenario we study, we search for the maximized PD in a single objective optimization problem.
Deterministic model objective
We begin by introducing the objective function of the deterministic problem. We assume fixed task completion time and no substitutability or task sharing among employees. Although substantial complexities exist in the real‐world setting, we use the baseline formulation to illustrate the basic idea of PD of a given task assignment. Let 


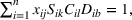


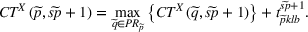
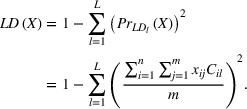
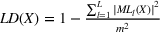
The 

Stochastic model objective
Since processing times in manufacturing stations are uncertain, we now use stochastic optimization to construct the same scenarios as in Section 4.3.1. In contrast to a deterministic setting (where we use task‐level production rates), in the stochastic model, we use the data in the form of step‐level processing time as the bottleneck step can vary. Let 


We fit the distribution of 


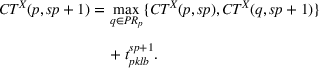
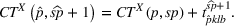
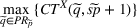
Due to the precedence constraints for different steps, that is, a step cannot start until the processor steps are completed, we use the sample path method to describe the expected production rate for a given assignment (Dallery & Gershwin, 1992). We use If step p is the only step in the associated task it belongs to, then at time If step p belongs to a task that includes multiple steps, at time On the other hand, if there does not exist such a step 


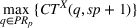


Let 


We use a small‐sized example to illustrate the working process and the calculation of expected PD when the processing times are stochastic. The example garment contains three steps and requires two workers. Figure 1a shows the step number, worker assignment, step difficulty level, distribution of step completion time in seconds, and the predecessors. For example, the processing time of Step 1 when assigned to Worker 1 is normally distributed with a mean of 6 seconds and a standard deviation of 1 second. Steps 1 and 3 need to be assigned to one worker (Worker 1), and Step 2 needs to be assigned to another worker (Worker 2). Steps 1 and 2 are the starting steps without predecessors, and they are the predecessors of Step 3.
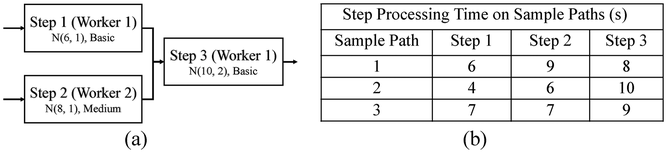
An illustrative simulation example with stochastic processing times.
We consider three sample paths as shown in Figure 1b and assume that the system starts empty. The sample paths are generated from the processing time distributions of the three steps. For example, on Sample Path 1, the processing time for the three steps (1, 2, 3) are 6, 9, and 8 seconds, respectively. Each sample path represents the production of one garment unit. We use the inventory of a step to denote the number of available finished sample paths after each step. When the system starts to run, Worker 1 starts Sample Path 1 at Step 1, and Worker 2 starts Sample Path 1 at Step 2. At the end of 6 seconds, Worker 1 finishes Sample Path 1, and the inventory of Step 1 increases from zero to one (Sample Path 1, cell Step 1 in Figure 1b). Note that Step 3 on a sample path can only be started if Steps 1 and 2 on the same sample path are completed. Since Worker 2 is still working on Sample Path 1, there are not enough materials to start Step 3. Hence, Worker 1 cannot switch to Step 3 and must work on Sample Path 2 at Step 1. At the end of 9 seconds, Worker 2 finishes Sample Path 1, and the inventory of Step 2 increases from zero to one (Sample Path 1, cell Step 2 in Figure 1b). Worker 2 then starts Sample Path 2. At the end of 10 seconds, Worker 1 finishes Sample Path 2 at Step 1, and the inventory of Step 1 increases from one to two (Sample Path 2, cell Step 1 in Figure 1b). Since there are enough materials to start Step 3 (both Steps 1 and 2 on Sample Path 1 are completed), Worker 1 then will switch to Step 3, and the inventory of Steps 1 and 2 decreases by one. Workers 1 and 2 keep working until all three sample paths are completed. At the end of 44 seconds, Worker 1 finishes Sample Path 3 at Step 3. The PD is calculated as 3/44 pieces per second. Details of the action changes and inventory are provided in Appendix B in the Supporting Information.
Two aspects of the problem make it difficult to solve using traditional optimization approaches in our computational study. First, as the processing time of each step is stochastic and the bottleneck of the line could shift substantially from time to time, the line PD of a given assignment cannot be presented by a closed‐form expression. Second, the production operations need to follow the precedence constraints with stochastic processing times, and it is challenging to have a generic mathematical expression to address the precedence constraints.
In light of these complexities, we employ an evolutionary algorithm, Nondomindated Sorting Genetic Algorithm (NSGA)‐II, to search for the optimal assignment when the processing times are stochastic and adopt the sample‐path simulation approach to evaluate the expected PD for a given assignment in the algorithm. NSGA‐II is an elitist non‐dominated sorting procedure, and it has been applied to many different practical problems spanning from engineering design to spacecraft trajectory optimization (Deb et al., 2002). We modify the existing NSGA‐II code to make it suitable to our assignment problem and delve into the working principles behind NSGA‐II in Appendix C in the Supporting Information. For each optimization problem we study, we use a large set of initial solutions (100 feasible solutions). For each initial solution, we iteratively improve the solution by up to 300 times in the NSGA‐II algorithm (called 300 generations) and run the algorithm 25 times to comprehensively explore the search space in seeking the optimal solutions.
In addition, we conduct robustness checks to verify the quality of the results by NSGA‐II in both the deterministic and stochastic models. In the deterministic problem, we apply NSGA‐II to search for the optimal task assignments. Our results show that NSGA‐II can provide the assignments with the same performance as the optimal assignments found by CPLEX. To verify the quality of the results by NSGA‐II in the stochastic model, we use the optimal assignments of the deterministic model found by CPLEX as the benchmark assignments. Under the setting of stochastic processing times, we find that the performance of the assignments found by NSGA‐II is better than the performance of the benchmark assignments. Given that NSGA‐II is commonly applied to solve multi‐objective problems, we also employ this algorithm to search for the Pareto frontier in the stochastic problem described in Section 5.4.
Results for the productivity maximization problem
Our detailed results are presented in Table 2. The left panel shows the details of the deterministic problem scenarios, and the right panel shows the details of the stochastic problem scenarios. In addition to the PD details, Table 2 also shows the corresponding DD and LD numbers for completeness. These diversity numbers are extracted based on the final assignments of workers on the line. We use the well‐known Blau index (Blau, 1977) to compute the diversity metrics (see Section 5.2 for formulae). Our results from both the deterministic and stochastic problems show that a higher level of DD is not always associated with reduced PD. In some cases, a higher level of DD may be accompanied by increased PD, especially for Garment B where steps are pooled to a greater extent.
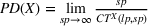
Productivity (PD) maximization results of the deterministic and the stochastic problems.
Note: PD is displayed in pieces per day (24,000 s); fraction PD numbers in the deterministic problem are a result of adding partially done garments at the end of the simulated time; PD in the stochastic problem is the average production of 10‐day simulated time.
For the deterministic problem scenarios of Garment A (Table 2, panel A), we observe that, compared to teams of individuals with no disabilities (a benchmark case—266.61 pieces per day), the PD of teams composed of individuals from only one type of disability is lower. In some cases, it can be substantially lower (e.g., teams composed exclusively of individuals with physical disabilities—187.45 pieces per day). However, teams where individuals are assigned from a pool that has at least two distinct disability types perform substantially better or at least as well as teams with only one type of disability. For example, a team of individuals with physical and mental disabilities perform at least as well as a team composed solely of individuals with mental disabilities. Similarly, teams with individuals assigned from three or four distinct types of disabilities perform even better on average. For example, teams composed of individuals from four distinct disability types achieve PD of 260.29 pieces per day (just short of the benchmark case of 266.61 pieces per day). When all individuals with and without disabilities are assigned with no constraints on disability type in the assignment, the PD is the same as the team comprising individuals with no disabilities. Further, the results from the stochastic version of the assignment problem (Table 2, panel C) align with the results of the deterministic problem. We note that the PD results of the stochastic problem (panel C) are slightly higher than the results of the deterministic problem (panel A). This can be attributed to the convexity of line PD with respect to task processing times.
We now turn our attention to the results for the deterministic scenarios of Garment B (Table 2, panel B). For this garment, each assigned worker undertakes about 5.17 steps on average (compared to 1.35 steps on average for Garment A). In this setting, the results are somewhat similar. We observe that, compared to teams of individuals with no disabilities (a benchmark case—76.64 pieces per day), the PD of teams comprising individuals from only one type of disability is generally lower, except for individuals with cognitive disabilities where the PD is slightly higher. However, the results for teams where individuals are assigned from a pool that has at least two distinct disability types (compared to a team where individuals are assigned from a pool with only one distinct disability type) perform substantially better or at least as well as teams with only one type of disability. Similarly, we also find that teams with individuals assigned from three or four distinct types of disabilities perform even better on average, just as in Garment A. For example, a team with individuals from four distinct disabilities could provide a line PD of 82.05 pieces per day (7.06% higher than the benchmark case of 76.64 pieces per day). When all individuals with and without disabilities are assigned with no constraints on disability type in the assignment, the PD increases further to 90.89 pieces per day (18.59% higher than the benchmark case of 76.64 pieces per day). Finally, the pattern of results from the stochastic version of the problem is similar to the deterministic solutions (Table 2, panel D). Collectively, the results of our PD maximization analysis paint a picture that more inclusive teams (individuals drawn from a higher number of disability types) likely perform better than less inclusive teams (individuals drawn from a lower number of disability types).
Intuitively, the improved PD can be attributed to the allocation flexibility of workers on the line. Analyzing further, our results show that workers with disabilities can perform similarly, or better, than workers with no disabilities under some conditions. For example, workers with only cognitive disabilities do better than workers with no disabilities for Garment B. This ability of workers to outperform others, despite their (physician‐certified) disabilities, enables the firm to match workers to tasks better. When workers from a diverse range of disability types are employed, it provides lines with greater flexibility in assigning workers to tasks, which helps increase PD. Of interest is that workers with cognitive challenges are the best‐performing group in Garment B. Including workers from other disability categories can enhance both PD and inclusiveness of the team, demonstrating the merits of allocation flexibility that accrues from DD. When we spoke to managers on the site, they noted that workers with cognitive challenges (such as learning or some form of development issue) can perform repetitive jobs well—sewing is a repetitive job. This is also in line with other job design studies, which argue that routinization of work frees up cognitive resources for individuals (Chae & Choi, 2019). In a setting that deploys individuals with challenges, this freeing up of cognitive resources may lower job stress. When individuals have a higher level of job pooling (e.g., Garment B), their performance in the tasks may be even better.
The overall results in Table 2 also have some degree of empirical validation. Specifically, Narayanan and Terris (2020) find with line‐level data that team PD increases when individuals have more distinct types of disabilities within a line (up to a certain point). This was attributed in their study to better allocation of workers to jobs achieved through repeated trial and error. A more diverse range of disabilities employed on the line facilitated such trial and error.
MULTIPLE INCLUSION OBJECTIVES
Thus far, we have described a setting where improving PD is the primary objective when workers from distinct types of disabilities are deployed. We now focus on a setting where we assess the impact of increasing the level of inclusion across both disabilities and languages. To do this, we study a series of deterministic‐constrained optimization problems (described in Section 5.1). This set of analyses explicates RQ2. To answer RQ3, we then study a multi‐objective stochastic optimization problem that simultaneously maximizes PD, DD, and LD (described in Section 5.4). In particular, we examine the Pareto frontier in the stochastic optimization setting to assess the trade‐offs in inclusion across multiple parameters.
Constrained deterministic optimization problem
To examine the implications of the pursuit of multiple inclusion objectives on the PD of the team, we design several scenarios to maximize the PD in the deterministic problem. These scenarios are: (a) unconstrained case (no constraints on the workers’ disability type), (b) partial disability inclusion (at least one worker from each disability type is picked), (c) maximum disability inclusion case (disability inclusion is maximized using the Blau index), (d) partial disability inclusion with maximum language inclusion (LD is maximized in addition to the partial disability inclusion case, scenario (b)), (e) maximum disability inclusion with partial language inclusion (DD is maximized holding the LD from scenario (b)), and (f) extreme inclusion case (both language and disability diversities are restricted to their respective maximum values). Scenarios (d), (e), and (f) are designed to examine the implications of simultaneously pursuing both disability inclusion and language inclusion. Scenarios (a) through (f) include both solely workers with disabilities and a mix of workers with and without disabilities. For the scenarios (b) through (f), additional constraints are included beyond Equations (1)–(4) as summarized in Table 3.
Scenarios in constrained deterministic optimization.
Language diversity and disability diversity
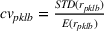
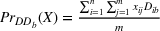
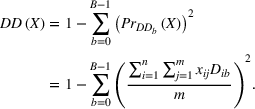
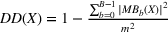
We use the Blau index to compute the LD of a task assignment (Harrison & Klein, 2007). The value zero indicates assignment to only one type of worker. In contrast, a larger value indicates a more diverse group. Let 
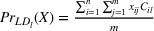

Note that 


Similar to the LD, we use the Blau index to compute the DD of an assignment (Harrison & Klein, 2007). Let 


Results of constrained deterministic optimization problem
The detailed results are presented in Table 4 for Garment A and Garment B. First, across both garments, we observe that for the case where we draw individuals that include a mix of both individuals with disabilities, and individuals without disabilities, PD is higher than the case where teams are drawn exclusively from individuals with disabilities across all scenarios irrespective of constraints. Second, for Garment A, the optimal PD does not drop with increasing DD when all workers with and without disabilities are available to be assigned. We observe that even with increasing LD or both increasing DD and LD, the optimal PD does not decrease. For Garment A, an assigned worker only works on a single step or two connected steps with an average of 1.35 steps per worker. Specifically, there exists a single solution that achieves the highest PD, DD, and LD simultaneously when all individuals with and without disabilities are available (Case All, Table 4), as well as when only individuals with disabilities are included (Case Only disabled, Table 4). Therefore, when we add constraints of diversity inclusion while maximizing the PD, the maximized PD does not change.
Results of constrained deterministic optimization problem.
For Garment B (where workers pool a greater number of steps), the decrease in optimal PD is minimal with increasing DD from (a) unconstrained case to (c) maximum disability inclusion case. The optimal PD when all individuals with and without disabilities are available (Case All in Table 4) drops by 5.01% from (a) unconstrained case to (b) partial disability inclusion case and another 2.07% from (b) partial disability inclusion case to (c) maximum disability inclusion case. Using (a) unconstrained case as the benchmark and comparing the two scenarios (d) partial disability inclusion with maximum language inclusion and (e) maximum disability inclusion with partial language inclusion, we observe that the optimal PD decreases more while achieving the maximum LD than achieving the maximum DD. The optimal PD decreases by 18.60% (9.83%) if a maximum LD of 0.83 is achieved and by 6.98% (1.53%) if a maximum DD of 0.79 (0.75) is achieved when all individuals with and without disabilities (only individuals with disabilities) are available to be assigned. Further, the optimal PD decreases substantially when both maximum DD and maximum LD are simultaneously achieved. In general, these results suggest that the lines may be more sensitive to simultaneously pursuing extremely high levels of both DD and LD. When organizations must optimize across multiple inclusion criteria (language and disability), they are likely to face a trade‐off between maximizing PD by gaining allocation flexibility on the one hand and maximizing inclusion across both disability and LD, which might reduce potential allocation flexibility, on the other hand. However, the lines may be less sensitive to increasing DD on their own. Practical intuition also suggests that a higher LD may result in substantial communication challenges in the line. Especially when each worker is in charge of multiple pooled steps, a higher level of coordination is needed. We now extend these ideas to examine settings with stochastic processing times.
Results of stochastic multi‐objective optimization problem
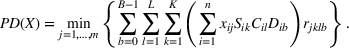
To examine the impact of DD and LD inclusion in a stochastic setting, we formulate a three‐objective problem that maximizes PDPD, DD, and LD simultaneously and search for the Pareto frontier. Two general approaches to multi‐objective optimization are discussed in the literature: (1) to determine a Pareto solution optimal set and (2) to combine multiple objective functions into a single function (such as MAUT) or move all objectives but one to the constraints (Konak et al., 2006; Marler & Arora, 2004). In the latter approach, combining multiple objective functions to a single objective requires specifying the weight of each objective. Further, each objective that is moved to a constraint also requires specification of boundary values for the constraint. However, it is difficult to determine these values in practice, and small perturbations to these values could result in different solutions. In contrast, Pareto solution optimal sets are practical for real‐life problems as multiple solutions can be examined for trade‐offs. Since we do not assign preferences on the three objectives but aim to assess the trade‐offs between team PD, DD, and LD, we search for the Pareto solutions using a population‐based approach NSGA‐II, which is well‐suited to solve multi‐objective problems.
We summarize our results in Table 5. The left‐most column in Table 5 lists the garment type, the number of steps of the line, and the number of workers needed on the actual line. First, Scenarios I and II are settings where we simultaneously maximize PD, DD, and LD. Scenarios III and IV are settings where we simultaneously maximize PD and DD. Further, Scenarios I and III are based on time study data drawn from all individuals, including those with and without disabilities. In contrast, Scenarios II and IV are based on time study data only drawn from individuals with some form of disability. For each scenario, we present the performance of the solutions (PD, DD, LD) that has the maximum PD (panel Maximum PD), maximum DD (panel Maximum DD), and maximum LD (panel Maximum LD) among all Pareto solutions.
Pareto optimization results of the stochastic multi‐objective optimization problem.
Note: # of Pareto solutions refer to the number of points on the Pareto frontier.
For Scenario I, Garment A, the optimal PD of the maximum DD assignment (268.29 pieces per day in panel Maximum DD) is not much different from the maximum PD assignment (268.47 pieces per day in panel Maximum PD) for a small increase in DD. In addition, the optimal PD of the maximum LD assignment (268.45 pieces per day in panel Maximum LD) is also close to the maximum PD assignment for a small increase in LD. For Scenario I, Garment B, the optimal PD of the maximum DD assignment (82.93 pieces per day in panel Maximum DD) is 1.04% (0.87 pieces per day) lower than the maximum PD assignment (83.80 pieces per day in panel Maximum PD). This occurs with a DD increase of 9.72% (0.07) and a simultaneous LD increase of 11.76% (0.08). In addition, the optimal PD of the maximum LD assignment (73.60 pieces per day in panel Maximum LD) is 12.17% (10.2 pieces per day) lower than the maximum PD assignment. This occurs with an LD increase of 22.06% (0.15) and a simultaneous DD increase of 8.33% (0.06).
Overall, these results are consistent with the results we obtain in the deterministic optimization setting where we find that trade‐offs are stronger for the more complex garment. For the simple garment (Garment A), the PD is insensitive to changes in DD or LD. Of relevance is that the sensitivity of PD toward an increase in DD or LD is not high. Besides, the results comparing Scenario I (Scenario III) and Scenario II (Scenario IV) also suggest that peak performance of teams composed exclusively of workers with disabilities behave somewhat similarly in our simulation to teams composed of a mix of workers with and without disabilities, with slightly lower maximum PD. Figure 2a(b) plots the Pareto frontier in Scenario I (Scenario II) for Garment B. Across the plots, there is a noticeable decrease in PD particularly when both language and disability diversities are high. This is consistent with our findings in Section 5.3 that simultaneously achieving both high DD and high LD could lead to a substantial drop in PD, especially for more complex garments. Although the approach of deterministic‐constrained optimization in Section 5.3 is fundamentally different and provides optimized intermediate solutions, we find similar results in the stochastic multi‐objective optimization problem. This provides us with more confidence in the insights.
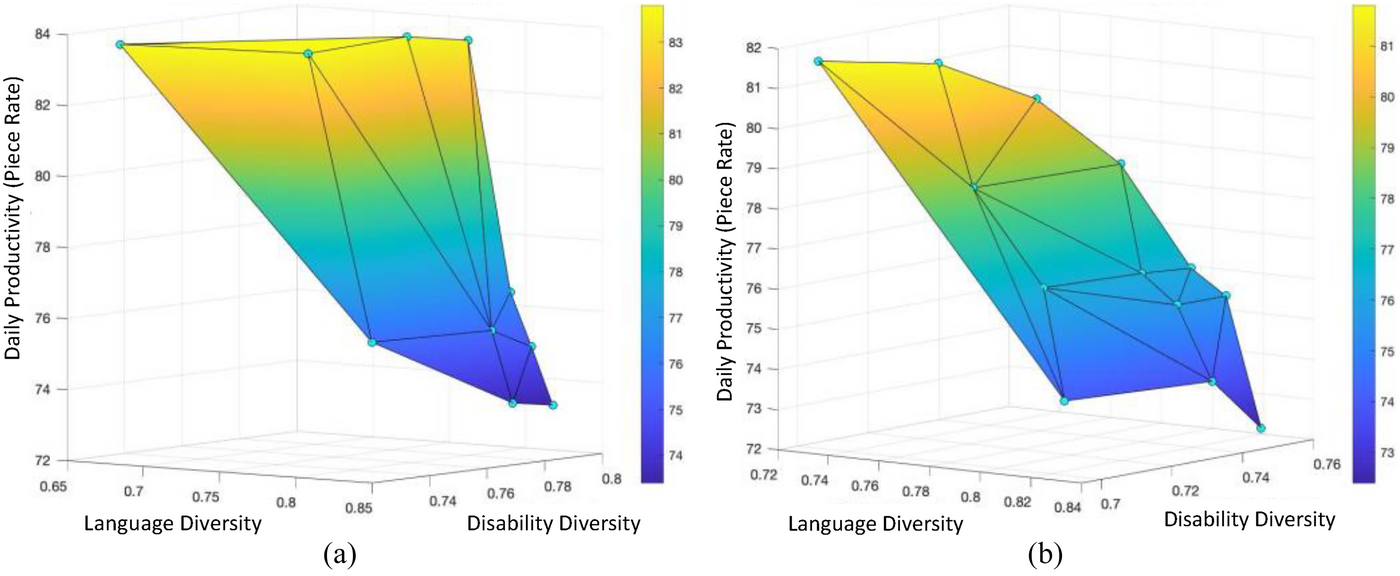
Garment B: Three objective optimization of the stochastic problem, all individuals (a) and only individuals with disabilities (b).
As a robustness check, we observe that in the two‐objective scenarios where PD and DD are maximized simultaneously, the maximum possible PD (Scenario III, panel Maximum PD)) is close to that when the maximum possible DD is achieved (Scenario III, panel Maximum DD) for both garments as shown in Table 5. This suggests minimal to no penalty on PD when maximizing the DD of workers in our simulation study.
Finally, we undertake the computational analysis on an additional (third) complex garment (102 steps, 19 workers with an average of 5.37 steps per worker). We obtain consistent results as in Garment B. In addition to using the time study data, we also perform other validation checks. The PD obtainable on the line for each of these garments is validated by the available archival data. Specifically, the observations from the highest PD obtained on the floor match with the optimal PD in our simulation analysis. These provide us with the confidence that the PD values obtained in the simulation are close to those obtained on the line.
DISCUSSION
Diversity inclusion has become an important element in the context of sustainable operations. Within the broader operations area, research scholars have increasingly emphasized that inclusion has become a key element of operations (Kalkanci et al., 2019; Sunar & Swaminathan, 2022), along with an increasing focus on issues that include race (Cui et al., 2020), gender (Cui et al., 2022; Pierce et al., 2021; Plambeck & Ramdas, 2020; Tang, 2022), and disability (Narayanan & Terris, 2020). In this context, the United Nations SDGs 8 and 10 also emphasize the notion of reducing inequality. Non‐profit consortia such as the Disability Equality Index that offer benchmarking tools for disability inclusion have increasingly cited greater participation among Fortune 1000 firms in the realm of disability employment (Kubik, 2018). Yet, compared to those without disabilities, unemployment rates for individuals with disabilities have consistently been almost double, and participation rates have been half for several years in a row (BLS, 2019, 2022). This disparity requires more action in both research and practice.
A key issue in this context is the importance of examining the productivity (PD) of individuals with disabilities. Prior studies note that employers espoused positive attitudes toward employing individuals with disabilities (Hernandez et al., 2008). However, “when specific attitudes related to the hiring of this group were assessed, views were more negative.” (Hernandez et al., 2008, p. 158). Yet, internal studies in some of the firms such as DuPont and Walgreens have revealed that employees with disabilities have superior PD (Hernandez et al., 2008; Kaletta et al., 2012). Overall, more systematic research on PD implications of disability employment continues to lag (Erickson et al., 2013). This also requires more studies within the operations domain. In this setting, our study contributes to this broader domain by examining the implications for disability diversity (DD), and language diversity (LD) on the PD of apparel manufacturing teams, and contributes the following to the existing literature.
First, our study finds that a team consisting of individuals across multiple disability types performs better than teams composed of individuals with a specific type of disability. When simulated teams are created based on a single type of disability, the line PD is, for the most part, lower than teams that are constructed across multiple types of disabilities. A key insight here is that the deployment of a diverse range of disabilities provides allocation flexibility to employers, particularly when individuals work in team settings. This intuition is consistent with another recent study by Narayanan and Terris (2020), who used empirical large‐scale data but not time study data as used in this study. Apart from the general approach being different, this study also finds that teams made of individuals with cognitive or mental challenges tend to perform better. When a team is complemented with individuals from other disability types, the results suggest that the implied cost of disability inclusion, compared to a no‐disability case, is minimal. This insight also complements other studies such as Miralles et al. (2007) who show that the traditional division of assembly line tasks becomes a perfect tool to “hide” individual disabilities in a related setting. Furthermore, in settings where workers are able to pool steps as in Garment B (compared to Garment A), individuals with cognitive disabilities could perform even better. It is likely that pooling working steps may compensate for the lack of PD in one phase of the task with higher PD in another. However, pooling steps are likely to require additional time for training the individuals. In general, this appears to be a fruitful area for future research, particularly from an operations management standpoint.
Yet, an important challenge that needs to be overcome in these settings is the need for specific accommodations. According to the Americans with Disabilities Act, individuals with disabilities need to be provided with reasonable accommodations (Thanem, 2008). Accommodations may range from reduced work hours to additional breaks, counseling services, adaptation of shift schedules, and automation of jobs for the workers depending on the needs and barriers that a specific employee faces. On the one hand, accommodations in a team setting can be more complex to administer given fairness concerns. On the other hand, accommodations can be compensatory and allow an individual to avoid a potential drop in performance. Prior studies have suggested that the cost of accommodations is minimal (Hernandez & McDonald, 2010). Yet, the quantitative impact of accommodations has not yet been addressed in research, to the best of our knowledge, and consequently cannot be included in our study. It is likely that in the short run, accommodations can influence PD negatively. However, over the longer run, a line may adjust to the challenges of specific workers while learning their behaviors.
Second, integrated teams that have individuals with and without disabilities perform better than teams that only have individuals with disabilities. This result suggests that the performance of teams when individuals with disabilities are deployed can be enhanced by adding individuals without disabilities. Many states in the United States have increasingly moved toward a model of integrative employment of workers with and without disabilities, with no difference in pay and privileges (Allison et al., 2017; Hoffman, 2013). Our results present some evidence that settings that provide competitive integrated employment (CIE) may be helpful overall. This stands in contrast to traditional segregated employment models that continue to grow even in the United States (Wehman et al., 2018). It is likely that CIE may succeed when employees across a diverse range of disability types are employed given the flexibility that job assignments in this setting may provide. For example, the Walgreens warehouse in Anderson, SC, has a goal of 30% employees with disabilities (GreenvilleCan, 2013). Firms such as Walgreens also follow a CIE setting, just as Peckham. Additional research in settings that compare environments with and without CIE employment may be needed to make a definitive statement on the issue.
Third, we extend our results from single‐objective problems to a multi‐objective problem that maximizes PD, DD, and LD on a production line simultaneously to analyze the trade‐off between these objectives. From a social perspective, pursuing such a multi‐objective approach is justified by the traditional challenges of social enterprises. Social enterprises, like the one we study, need to effectively balance a social mission with business viability (Battilana & Lee, 2014). Lacking either can present substantial challenges in fulfilling the firm's objectives (Battilana et al., 2015). Specifically, while efficiency is not sought to increase profitability as in traditional firms, and is not a goal unto itself, efficiency provides the ability to serve more customers. Thus, joint optimization may not only reinforce the need for superior PD but also reinforce the purpose and value of the firm for accomplishing the social mission (Ebrahim et al., 2014, p. 83). The key idea in such joint optimization is to unearth the trade‐offs between different objectives that firms may pursue in these contexts and enumerate them. In this regard, our results from both the deterministic and stochastic optimization models suggest that teams are not sensitive to increases in DD. The results from the full disability inclusion and partial disability inclusion cases in the deterministic problem are consistent with the Pareto frontier in the stochastic problem. However, simultaneously having high levels of DD and LD in complex settings may result in reduced PD.
With specific regard to LD, communication is an important attribute in team settings. In settings where the employees in a team come from multiple native languages, language‐related communication barriers can lead to productivity drops, particularly when complemented with a high level of disability inclusion in more complex jobs. In studying work disabilities in British Columbia, Senthanar et al. (2021) note that immigrant workers had substantial language barriers. Meyer (1980), when examining the historical perspective of the Ford assembly line, cites the influx of immigrant workers into the assembly line. In early Ford factories, an overwhelming majority of workers were of foreign origin (Meyer, 1980). Managers (at the time) believed that this diversity in the workforce caused productivity losses, compared to laboratory settings, and referred to this as the “human element of production” (Meyer, 1980). During interactions with individuals in the study site, one supervisor noted that on occasions, it may be difficult on the floor to communicate with employees who have different native languages. In practice, language‐related challenges may be managed with training efforts. Within Peckham, non‐native English speakers are provided additional training for English communication.
Overall, by examining the trade‐off between DD, LD, and PD, our results show that high levels of LD have a more significant impact on the loss of PD at high levels of DD.
CONCLUSION AND LIMITATIONS
This study has aimed to gain practical insights into the role that inclusion and diversity play within the workforce and whether inclusion has any trade‐offs with PD. In this regard, this study examines the impact of deploying a diversity of individuals with disabilities in team‐based settings. Results suggest that employing individuals across multiple disability types in teams can be beneficial in improving the PD of teams. This is primarily attributed to the allocation flexibility provided to employees. Further, increasing the level of DD has little penalty in terms of PD. In contrast, narrowing focus on a single type of disability appears to have a higher penalty. Besides, we also find that pursuing both high levels of LD and DD can be challenging and reduce productivity substantially. This study is not without its limitations, many of which can be remedied in future research.
First, it is important to note that it is likely that the selection of employees into sewing plays a key role. However, such selection issues span the entire plant. For example, Peckham had a process for training individuals across its sewing tasks and assessing their performance. It is likely that the results may be different across other settings where individuals work on their own. Further, similar studies can also be performed in assembly line settings that are not apparel.
Second, despite the focus on disabilities, we could not get a deeper insight into the task‐level attributes of disabilities. For example, there are several forms of disabilities and ways of handling them that can impact PD. Studying disability at a detailed level had considerable practical limitations, a key one being medical confidentiality. This needs to be done using qualitative approaches.
Third, based on our consultation with floor employees, we grouped both disabilities and languages. While this was done primarily for tractability reasons for the time study data, such grouping is based on the fact that these language groupings were more similar within types. Thus, the language groupings may not be perfect. A closer analysis of the language groupings suggests that we underestimate the impact of LD. However, using more granular categorizations should not impact the fundamental results around allocation flexibility that firms may gain from employing individuals across disability types. Specifically, allocation flexibility trade‐offs may likely manifest at a lower level of LD. Future studies can address this issue by using a larger time study dataset.
Fourth, our study focuses on estimating costs of disability inclusion as its productivity implications but not direct dollar costs. In general, firms such as Peckham Inc. also focus on social goals, in addition to dollar costs, like any other WISE (e.g., Battilana et al., 2015). As mentioned before, accommodations are an important cost, and studies around understanding the cost of accommodations are inconclusive (e.g., Cimera, 2000; Hernandez & McDonald, 2010; Stamps, 1995). Given the high social cost of unemployment among individuals with disabilities, the costs here need to be weighed against both the cost of employment and the cost of improving productivity through accommodations (Cook & Burke, 2002). Further, our study does not capture the cost of accommodations directly since specific accommodation data were more difficult to collate due to regulatory hurdles. Future studies can incorporate the costs of accommodations more directly.
Finally, our study is restricted to a repetitive manufacturing environment within a single firm. Each line within the firm is likely to be different, even though we use information from multiple lines, and the insights are somewhat consistent. Thus, we propose our approach as a multiple case‐study setting where each line is separately optimized. Future studies can optimize this problem at the firm level, which may give different insights since optimization is performed across lines. These are likely to result in even better productivity since allocation flexibility can be higher at the firm level.
Footnotes
ACKNOWLEDGMENTS
The authors acknowledge funding from the Peckham Foundation Grant that allowed data collection. The paper also benefited immensely from three anonymous reviewers and the senior editor. We also thank Sarah George, Director, Mission Initiatives, Peckham Inc. for useful inputs on earlier drafts of the paper.