
Abstract
Companies across many industries seek to understand how customer ordering impacts supply chain distribution performance. In the US medical supplies industry, wholesalers are uniquely positioned to use information about downstream customers to study and potentially influence buyer policies and practices due to their industry scale and data visibility. In this study, wholesale medical supplies buyers are first examined based on their ordering practices over a 2‐year window using the theoretical lens of data clumpiness—patterns of data non‐conformity to equal spacing—to derive insights into how their ordering practices affect the distribution efficiency of the medical supplies wholesale distributor. The analysis also considers how different buyer and industry characteristics moderate these upstream ordering effects. The results reveal several significant findings for both theory and practice. First, buyers exhibiting less clumpiness in order sizing and greater clumpiness in order‐timing practices drive greater distribution efficiencies for the wholesale distributor. These effects are greater when buyers have more category experience and lower when ordering across multiple categories. Industry customers’ use of centralized purchasing also tends to lower wholesale distributor efficiency. Still, these negative effects can be mitigated when customer ordering practices favor replenishment based on customer needs and consistent order sizing. After discussing the implications of our analysis, we offer additional practical and theoretical extensions of our approach that can be applied to study other industry supply chains or that could affect related healthcare purchasing markets.
INTRODUCTION
Most medical supply delivery investigations have focused on the various performance stages at a general or hospital level and have yet to examine the value co‐creation process between wholesale distributors and primary provider care facilities at the delivery location or category level. In general, healthcare supply chains involve the flow of many different product types and the participation of several stakeholder groups—the producers, the purchasers, and the providers (Callender & Grasman, 2010). Therefore, a practical industry analysis of customer value and performance will require a multi‐level, multi‐stakeholder approach. In the medical supplies industry, wholesale distributors are generally considered second‐tier producers but have increasingly taken on more of an advisory role with the providers (physician offices and practices). They may also offer private‐label products in some categories. As such, the relationships involving the primary care providers and wholesale distributors in the medical supplies industry are a unique example of a supply chain value co‐creation problem. The co‐creation process, in this case, involves the producers (the wholesale distributor) creating superior value propositions with providers (the primary care customer locations) to enhance opportunities for shared benefits (Payne et al., 2008) and high levels of collaboration with primary care providers (e.g., Fawcett et al., 2021).
The medical supplies industry supporting primary healthcare centers in the United States has received relatively little research attention, but the Covid‐19 pandemic highlighted the importance of supply chain management and primary care (Finkenstadt & Hanfield, 2021). The pandemic also brought broad attention to the need for more wholesale distributor visibility about customer data and downstream purchasing practices. Specifically, it highlighted the need to understand individual customer ordering practices that may affect the flow of materials and associated supply‐chain costs (Golec & Karadeniz, 2020). From the industry wholesale distributor's perspective, the efficient management of a large number of inbound orders while controlling distribution costs is, in fact, a big challenge (Xu & Huang, 2017). Uncertainty about customer ordering can pose a significant demand‐side risk for industry wholesalers (Kesavan & Kushwaha, 2014), making fast identification of and response to abnormal ordering patterns desirable. For example, customer deviations from expected forecasts would likely significantly impact order fulfillment costs and efficiency (Chen & Lee, 2012; Mackelprang & Malhotra, 2015). Unpredictable variation in the order size or the unexpected timing of orders will lead to upstream variability that makes inventory management costly (Chatfield et al., 2004, p. 340). Wholesale distributors, and ultimately customers, would benefit if this extra uncertainty could be reduced. Inefficiencies of this kind in an industry with generally steady growth and transparent pricing standards are the most damaged by suboptimal ordering practices because they make upstream planning and delivery coordination more difficult for the wholesale distributors.
Due to their position and role in the medical supplies supply chain (see Figure 1), wholesale distributors possess valuable downstream information, so they are uniquely positioned as intermediaries to establish “profitable demand‐shaping decisions” for specific product categories (Lapide, 2014). Yet, most cost and internal supply chain data are highly aggregated or standardized for managerial accounting purposes and may not identify the customer or industry‐level characteristics that allow value co‐creation in distribution‐related exchanges (Ghosh et al., 2018). Healthcare wholesale distributors, in particular, will need to understand how different customer characteristics and practices affect their fulfillment costs and associated risks (e.g., Ferenc, 2010; Nathan & Trinkaus, 1997). Medical supplies industry wholesale distributors also offer additional value to their primary care customers because, unlike Amazon or other business‐to‐business (B2B) wholesalers, they provide distribution scale efficiencies, quality control, and consultative support to their customer base for specialized product delivery. Past operations research shows that in addition to the informational and transactional efficiencies provided by intermediaries such as these, they can also offer specific relational value in fast‐response supply chains and can help reduce information asymmetries related to customers changing needs to improve supply chain performance (Belavina & Girotra, 2012). Nevertheless, wholesale distributors in the medical supplies industry face several unique challenges associated with their specific primary care customer base that requires a better understanding of different customers’ value and cost to serve.
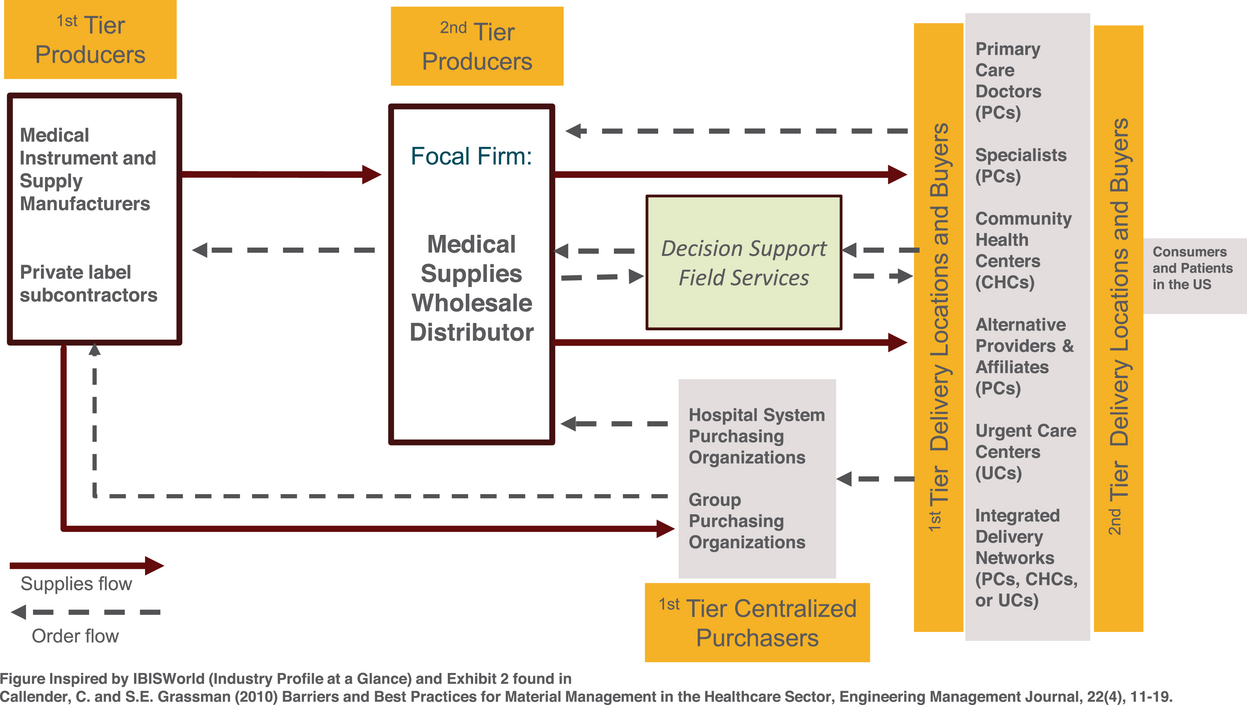
Visual representation: Primary care market for medical supplies distribution.
First, the US medical supplies industry is dominated by relatively few wholesale distributors serving mostly dispersed and fragmented primary care markets. These primary care customers may be stand‐alone physician practices, specialists, or physician practices (PCs) with multiple locations that may operate independently, community health centers (CHCs), or urgent care (UC) centers. Each primary care operator receives economies of scale advantages by working with the medical supply wholesalers, who manage these customer segments independently of their hospital distribution businesses. Second, industry wholesalers offer individualized decision support services using local sales representatives familiar with their primary and UC customer markets. Despite their ability to observe and consult with individual customers, medical supplies wholesale distributors need a robust means to identify what buying practices may contribute to inefficiencies in specific customer markets and some product line categories. This fact often surprises those outside the industry, given that the wholesale distributor deploys field representatives and generally has strong working relationships with their largest customers. Moreover, most products sold through this distribution channel are mostly considered commodities with very predictable demand profiles and little price volatility.
Because most industry wholesale distributors offer next‐day delivery for almost all product categories to primary care markets, each must carefully consider their internal delivery costs for specific products and customer locations. The upstream orders from these category–customer combinations may come via inexperienced or more experienced buyers, through centralized purchasing, or can involve purchases for single or across product categories. Regardless, wholesale distributors must use multi‐level analytical approaches to discern how industry customer characteristics, product categories, and ordering practices combine to improve distribution efficiency for this truncated portion of its downstream supply chain.
A major medical supplies industry wholesale distributor provided invoice and fulfillment cost information for over 60,000 customer delivery locations from 2015 to 2016 to develop and back‐test a new data‐driven approach for detecting ordering patterns and determining the value proposition for different customer groups and product categories. The theoretical approach is based on the data “clumpiness” general perspective from the marketing literature (Zhang et al., 2013, 2015) for segmenting different customer groups to determine their potential value. Data clumpiness is closely tied to actual customer behavior since it primarily considers irregular patterns in observed data across multiple industries. The first unique contribution of our research is that we show through buyer–wholesaler transactions that data clumpiness can be a valuable predictor of how customer ordering practices either enhance or diminish medical supplies distribution efficiency. Second, we examine key moderating variables representing current challenges across healthcare distribution. Third, in our post hoc analyses, we provide further insights by investigating specific product categories; finding the category type should be a key consideration as healthcare supply chain leaders develop inventory models moving forward. Our proposed methodology could be extended into other wholesaler‐dominated healthcare industries, such as pharmaceuticals, where wholesalers serve a “supply chain captainship” role (Whang, 1995) or can provide value‐added service co‐creation opportunities.
LITERATURE REVIEW
Healthcare in the United States is a unique context requiring stakeholders’ collaboration to be operationally efficient. Yet, specific factors make it difficult for entities to share specialized competencies across the network or to evaluate how best to create additional (or surplus) supply chain value. For example, wholesalers must identify and foster relationships with downstream medical supply customers to derive efficiency benefits. Industry wholesalers are co‐producers of service value with providers, so, therefore, they must assume an active role in customer exchanges to drive better efficiency (Vargo & Lusch, 2004). Several studies have linked this service‐dominant logic perspective to advocate for better coordination of the specialized skills and abilities that create shared purchasing competencies in healthcare (Chakraborty & Dobrzykowski, 2014). One of the unique challenges of healthcare supply chains is the difficulty in synchronizing the different competencies of the plethora of downstream actors or the characteristics of the principal purchasers (Dobrzykowski, 2019). For example, a skilled nurse in a physician's office may recognize the need to order more supplies and be assigned that duty, yet may lack the experience, purchasing skillsets, or supply chain background to make orders most efficiently. Therefore, category experience or history working with the wholesale distributor in a particular category could also significantly affect the resulting fulfillment efficiency (Golec & Karadeniz, 2020). Past OR/OM literature shows that it may be possible for customers and suppliers to coordinate to improve efficiency if they can bundle purchased products together and optimize joint shipments (e.g., Sajadieh & Akbari Jokar, 2009). This practice will be most effective when orders range across different product line categories so that the distributor can aggregate demand to exploit transshipment opportunities to deliver economies of scope (e.g., see Shockley & Fetter, 2015). In our study, we define category scope as the number of different product categories ordered for delivery to a particular customer location.
Another factor, somewhat unique to the medical supplies industry, is the presence of provider networks, third‐party groups, group purchasing organizations (GPOs), or centralized purchasing agent agreements that govern a customer's transaction. Centralized purchasing is a collaborative or cooperative purchasing agreement among multiple customers and locations to achieve more significant economies of scale, contract negotiation, and purchasing power (Hu et al., 2013). In healthcare, contracts are often in place for specific product categories and provider contracts may apply to some purchases and not others. This may impact the purchasing behavior of the entity. For example, a common practice is for buyers of medical supplies to use the “GPO price” in a particular product category as a starting point for their vendor negotiations, a practice known as custom contracting. Saha et al. (2019) find that custom contracts were more beneficial for larger entities (e.g., major hospitals) that already have sufficient buying scale and order for a central location but may have limited value for smaller entities across multiple locations as are typically seen in primary care.
Many industry‐specific external challenges also highlight the need for better distribution efficiencies for primary care providers. These challenges include the entrance of new competitors into the B2B medical supply market (e.g., Amazon and its affiliate network; Barlow, 2018, Kacik, 2017), financial margin pressures that have triggered an increase in the number and size of industry consolidations (Kacik, 2017), customer stockpiling and assortment control issues (Cook, 2007), and enhanced customer price negotiation power due to greater use of more centralized and GPOs (Hu et al., 2012). Medical supplies such as rubber gloves, bandages, and most other PPE items are generally considered commodity products with predictable demand patterns, so the industry distributors can manage the downstream uncertainty. Nevertheless, this is a high‐growth industry. Even before the Covid‐19 pandemic, considered an extreme system disruption (Sodhi & Tang, 2020), the demand for medical and surgical supplies was projected to be over $60 billion in 2020, with an associated growth rate of 10% until 2027.1 Medical supply costs are estimated to account for 20% of all healthcare expenses,2 second only to labor in total expenditure. Therefore, even marginal improvements in distribution efficiency can have a huge impact. Given the recent developments and attention to the industry, there has been a rethinking of the traditional delivery model toward emphasizing this aspect of more proactive customer service support to more effectively manage downstream demand and inventory control (Association for Health Care Resource & Materials Management of the American Hospital Assoication 2021). As a result, medical wholesalers have recognized that a critical part of their value proposition is understanding current customer practices better to efficiently deliver these products with the highest service level and at the lowest possible distribution cost.
With the ability to monitor customer orders, industry wholesale distributors can quickly identify the relative conformity or non‐conformity (clumpiness) of downstream ordering patterns in customer data. Most established empirical models rely only on factors such as order recency, frequency, and monetary value (RFM) to help predict a customer's current or future value proposition for the focal firm (e.g., Liu, 2022). While recognizing the value of these approaches, Zhang et al. (2013, 2015) incorporate measures of data clumpiness, defined as “the degree of non‐conformity to the equal spacing” in customer data, to understand how the “irregular behaviors” of customers can help improve forward decision‐making (Kumar & Srinivasan, 2015; Zhang et al., 2013, 2015). Zhang et al. (2015) further utilize B2C website visits and purchase data to quantitatively show that data clumpiness effectively predicts future customer value to retailers.
While clumpiness in the visit patterns of customers to an e‐commerce website signals that they are “willing to buy” and, therefore, should be targeted for immediate promotion, extant supply chain research suggests that clumpiness in buying practices can cause significant pain in a B2B supply chain because of the relationship between behavior‐based ordering uncertainty and effective upstream inventory control. For example, uncoordinated customer ordering behaviors and inventory replenishment policies can create the well‐documented “demand signaling” problem that makes managing upstream demand forecasts more difficult (Lee et al., 1997). The operations management literature suggests that wholesale customers could follow either a continuous review (Q‐type) replenishment policy or a fixed order period (P‐type) replenishment policy. In the case of continuous review, the customer will calculate the economic order size and order this fixed quantity whenever inventory levels fall below a set re‐order point. Given the stochastic nature of demand for the customer, this should reduce clumpiness in order replenishment size but increase clumpiness in periods between orders. Under a periodic review system, the customer would alternatively define a fixed period for making orders to the wholesaler, and then replenish each period to return the inventory back to a set “up to” level (Ojha et al., 2019). Again, given the stochastic nature of demand for the customer, this will lead to reduced clumpiness in the period between orders and increased clumpiness in order replenishment sizes. While customer inventory policies should be linked to specific product demand patterns (Fisher, 1997), research shows that customer ordering practices are often quite heterogeneous and can be altered by past experiences or personal behaviors without following the exact model or policy prescriptions (e.g., Kesavan & Kushwaha, 2014; Rumyantsev & Netessine, 2007).
From the industry wholesaler's perspective, however, customer orders drive significant variation in forecasted demand and can increase distribution costs. High demand variation also requires more inventory to meet service level guarantees (Rumyantsev & Netessine, 2007). The extant literature has investigated two avenues to address this demand forecast uncertainty—information sharing (Cachon & Lariviere, 2001; Lee et al., 2000) and supply chain responsiveness (Blackburn, 2012; de Treville et al., 2014). But how do these practices affect the predictability and variability in demand for the medical supplies wholesale distributor? Periodic ordering could make downstream distribution more efficient by allowing wholesale distributors to reduce the information‐sharing gaps in constructing their delivery forecasts to improve their performance, particularly if it has fast delivery lead times (Ojha et al., 2019; Sajadieh & Akbari Jokar, 2009). More predictable customer demand should simplify planning, decreasing inventory and distribution fulfillment costs. However, when customers pursue continuous replenishment policies, this should create more predictable upstream order quantities but less predictable order timing. While research shows that customers can use different order timing and frequency information about the suppliers’ service performance (Craig et al., 2016), the data clumpiness of customer order timing and sizing practices on wholesale distribution efficiency remains unclear. This is particularly true for the medical supplies industry, where the nature of the product categories, delivery locations, customer category experience and scope, and centralized purchasing practices may all contribute to upstream uncertainty.
Past research has concluded that harmful customer ordering practices and behaviors are both a pervasive problem for wholesale distributors that require further investigation at the industry level to understand how different customer buying strategies, operating scale, and category buying experience affect distribution performance (Chen & Lee, 2012; Mackelprang & Malhotra, 2015; Tokar et al., 2012). In the medical supplies industry, the wholesale distributor is the large‐scale purchaser of products and the intermediary between customers and vendors in a given supply chain transaction. They are also most favorably positioned to act on behalf of their customers (Niraj et al., 2001). For example, past purchasing and supply management theory espouses the benefits of centralized information control to improve distribution decision‐making, coordination, and efficiency (e.g., Shockley & Fetter, 2015; Whang, 1995). Similarly, some literature has promoted the benefits of “category captainship,” where the customer relies on large upstream wholesalers or manufacturers to provide both operating scale and improve their decision‐making regarding inventory policy and distribution management for particular product categories (e.g., Kurtulus et al., 2014). The B2B literature studying mid‐stream actors suggests generic “soft competencies” that can enable them to leverage their access to help facilitate coordinated logistics functions, which is defined as “the seller's ability to effectively track and manage the flow of materials and information” from customers (Rosenzweig & Roth 2007, p. 1316). Using the downstream customer information to help distribution logistics is even more critical when customer order patterns are non‐repeating or caused by dynamics due to customer heterogeneity (e.g., Dekker et al., 2019). In one case, centralized B2B e‐marketplaces were more successful if they enhanced the coordination of the corresponding distribution services the central actor provided for its customers (Rosenzweig et al., 2011).
Companies in the upstream part of the distribution channel must use data visibility to manage downstream customer demand (Zhang et al., 2011). However, more practical or academic guidance is also needed in the medical supplies industry to identify the customer characteristics that drive distribution inefficiencies. This study contributes to the above understanding by developing a model to predict “clumpy” ordering practices within the medical supplies customer portfolio base and how these ordering practices interact with customer and industry characteristics (Kumar & Srinivasan, 2015) to drive distribution efficiency (or inefficiencies). Namely, customers may leverage scale by buying across categories (buyer category scope) to take advantage of joint ordering efficiencies, may have significant category experience in a particular category of medical supplies, or may use centralized purchasing agents as part of an integrated delivery network (IDN) to lower their top‐line costs and seek out opportunities for co‐create additional value with the wholesale distributor.
HYPOTHESES DEVELOPMENT
To develop our hypotheses, we first examine the effect of customer order data clumpiness for order timing and sizing decisions on the wholesaler's ability to manage efficiency. Unlike its use in marketing science, it is generally hypothesized that less clumpiness in customer ordering practices among the primary care customer base benefits the upstream wholesaler's distribution efficiency by reducing uncertainty and improving the internal supply chain activities related to order fulfillment and transportation.
Clumpiness in customer order‐timing (CTime): It is generally assumed that customers with shorter times between purchases may have a reduced preference for a product with a high likelihood of a stockout than customers who wait extended periods between purchases. Generally, however, customer orders are based on their need to refill inventory per the dictated policy. Upon receiving new customer orders, the wholesaler can better manage the inventory and delivery schedules because this timing information can be used to forecast future demand more effectively. It is presumed that an efficient buyer will replenish stock based on need and avoid the practice of periodic ordering, which may cause them to replenish based on timing convenience (e.g., every 2 weeks). However, the impact of order timing decisions on the fast response supply chain at the wholesale distributor level needs to be clarified in this case (Ojha et al., 2019). Numerical analysis of the effect of clumpiness in demand volatility suggests that the same actions and policies could also be applied to study order fulfillment and extended delivery time windows to upstream suppliers (Bicer et al., 2018). In these cases, the increased demand uncertainty without the accurate order timing (which reflects the real market demand) can increase order fulfillment costs for the wholesaler for improved inventory management and scheduled deliveries. For example, bad policies can amplify demand and inventory forecast uncertainty (Kesavan & Kushwaha, 2014), resulting in an increased cost tradeoff to the supplier trying to be more responsive by offering next‐day fulfillment and delivery (Bicer et al., 2018). Immediate downstream customers’ actions on the timing of orders can also negatively influence the wholesalers’ demand management activities (Craig et al., 2016). Therefore, higher dispersion (increased clumpiness between order periods) indicates that customers are seeking more continuous replenishment rather than practicing ordering at periodic intervals or directly coordinating regular orders with the upstream supplier‐wholesaler. If the wholesaler tries to be more responsive to rapid customer demand changes, then there could be increased costs for the wholesaler being more responsive, reducing its overall distribution efficiency (Bicer et al., 2018).
Clumpiness in customer order sizing (CSize): Our research design and conceptualization of data clumpiness first considers the dispersion of order‐sizing decisions as a proxy for the degree of non‐conformity to the equal spacing of different order sizes received by the wholesaler for a given category–customer combination. Comparing the actual quantity with the optimal amount, firms can identify a partner's reliability, which can further long‐term preferences and private information about the customer's implied service level (Craig et al., 2016). Customers may also place orders based on the wholesaler firms’ available inventory to support promotions (Cui et al., 2018). However, variations in order sizing can also indicate fulfillment inconsistencies (Bendoly et al., 2018), indicating the degree to which customers fail to follow optimal ordering policies that consider economic tradeoffs between ordering and holding costs. Unlike the logic on the effect of order timing dispersion on wholesaler efficiency, there is little ambiguity on the mutual benefits of consistent order sizes for downstream customer's inventory control and the ability of wholesalers to manage coordination costs. Lower clumpiness in customers’ (a) order‐timing (CTime) and (b) order‐sizing (CSize) practices will be associated with greater wholesale distribution efficiency.
Moderating customer‐level effects on medical supplies ordering and distribution efficiency
Buyer category scope
Supply chain research has begun to consider how category scope between buyers and sellers in a supply chain may affect order sizing and timing because it offers the opportunity to exploit quantity discounts and transportation consolidation. Yet, the impact of the greater scope of order sizing and timing decisions on distribution efficiency at the wholesale level has received comparatively less attention. For example, Ma and Mallik (2017) derive several propositions suggesting that the supply chain surplus from ordering across different categories (a practice known as bundling) is greater for customers than it is for upstream members (manufacturers/wholesalers) in the supply chain. Strict batch size requirements across different categories may also limit the ability of customers to use the scope of category orders to take advantage of quantity discount opportunities and are only effective if they are tightly coordinated with the upstream suppliers (Munson & Rosenblatt, 1998). Additionally, Cachon et al. (2007) develop alternative measures of material flow to find that aggregated products and extended periods tend to mask the negative effect of ordering behaviors to upstream distributors in the supply chain. Moreover, increasing the scope of category ordering may introduce additional complexity that may amplify positive or negative ordering behaviors. Choi and Krause (2006) and Ellis et al. (2011) argue that complexity reduction in purchasing may lead to lower transaction costs and increase the supplier's efficiency but may also cause disruptions between suppliers and buyers and can increase risk.
Other research suggests that multi‐product joint ordering practices improve distribution efficiency by enhancing the distributors’ ability to aggregate loads. Using the case of Best Buy, Chopra and Meindl (2016) show that the company could lower costs by combining multiple orders on a single truck. To take full advantage of this situation, both lot sizes and order timing for the different products must be manipulated to achieve the lowest cost result (p. 282). Similarly, Shockley and Fetter (2015) show that the availability of drop shipping improves distribution performance to downstream customers when a competing network of suppliers uses a consolidated shared warehouse for managing the fulfillment of different product categories. In particular, reducing the size of the orders and delivering more frequently at consistent intervals better utilizes delivery capacity and reduces distribution costs. Nevertheless, there is a great deal of empirical research that shows that retailers in practice do not follow direct policy prescriptions (Kesavan & Kushwaha, 2014) and may pursue different inventory policy strategies based on customer requirements in various industry segments and specific needs for inventory responsiveness (Shockley & Turner, 2015). Therefore, we propose that the effect of clumpiness in order‐timing and order‐sizing behaviors on wholesaler distribution efficiency will be moderated by customer category scope due to increased economies of scale and opportunities to practice customer joint ordering and delivery location management across different product categories. The relationship between clumpiness in customers’ (a) order‐timing and (b) order‐sizing practices on wholesalers' distribution efficiency will be further enhanced by buyer category scope.
Buyer category experience
Individual buyer attributes, particularly buyer category experience, will affect how buyers engage and cope with equivocal decision‐making situations, providing confidence that their actions will be more likely to reflect a more extensive and richer interpretation of their external environment (Ellis et al., 2011). This interpretation of the environment will bias their resulting ordering practices, such as their reaction to a low stock or disruptive inventory planning situation. Buyers with more experience are also more likely to be informed or comply with existing procurement policies and procedures, such as using preferred suppliers or purchasing in optimal sizes and at the right time. Prior literature studying order signaling issues in the bullwhip effect shows that buyers’ advanced knowledge improves the ordering behaviors that cause the demand signaling problem, improving distribution performance (Tokar et al., 2012). However, this same stream of research suggests that buyer experience may have diminishing returns in supply chains, given that knowledge acquisition may be limited in such environments. In healthcare, it may be that purchasers who have more experience are better equipped to choose products that meet the needs of their patients and provide better care. Research has suggested that healthcare may be far behind other industries in improving supply chain processes (Golec & Karadeniz, 2020). For example, coordination problems may cause those same buyers to place unnecessary orders to mitigate the potential risk of orders going unfilled based on prior negative experiences (Croson et al., 2014). It is also noted that buyer expertise and experience ordering in a category may not be equivalent (Tokar et al., 2012). Nevertheless, a consensus is that a buyer's experience should result in superior order management and coordinated order fulfillment. Therefore, the effect on upstream inventory planning and distribution performance should be improved if a buyer has more experience ordering in a specific medical supplies category. The relationship between clumpiness in customers’ (a) order‐timing and (b) order‐sizing practices on wholesalers’ distribution efficiency will be further enhanced by buyer category experience.
Centralized purchasing
Centralized purchasing is assumed to benefit buyers because they can leverage the collective size to negotiate larger purchase quantities at a discount. However, some research challenges this notion. For instance, Hu et al. (2013) show several conditions where pooling purchases may reduce buyer profits. One possible explanation is that centralized purchasing agreements may not be tailored to the individual provider location, require minimum order quantities, or place other constraints that may magnify the supply chain's batch order quantity problem, known to signal order distortion (Chen & Lee, 2012). For example, GPOs aim to help hospitals, long‐term care facilities, and, increasingly, primary care providers realize efficiencies by leveraging their collective size for provider price concessions (Ahmedi et al., 2019; Nyaga et al., 2015). GPOs sell this service to industry customers by convincing them that transferring negotiation responsibilities to the GPO will allow staff to deliver value to patients more effectively. Studies of centralized hospital purchasing challenge the notion that group negotiation benefits the supply chain, seeing no value creation for systems affiliation or high‐volume purchases through large national GPOs (e.g., Nyaga et al., 2015). GPOs have faced many criticisms, including suggestions that they do not realize the promised lower prices for members because the required fixed fee structure eats into any espoused benefits, that they stifle process innovations that might improve purchasing behaviors, and that they create unstable markets by providing more significant benefits to a large member (like hospitals) than they realize for smaller members (Hu & Schwartz, 2011). To our knowledge, there have yet to be studies that have examined the effect of group purchasing contracts, ordering practices, and distribution efficiency in primary care‐oriented healthcare supply chains or for different medical supply industry product categories.
The extent to which primary care and community health centers can leverage centralized or network‐level purchasing for medical supplies can vary depending on several factors, such as the size of the healthcare center network, its locations, and its direct affiliations. According to a report by the National Association of Community Health Centers (NACHC, 2017), 92% of community health centers and 73% of primary care practices use GPOs to some extent for negotiating contracts to purchase medical supplies. This high utilization by primary care and community health centers is due to the perceived cost savings and efficiencies that centralized purchasing contracts provide and the ability to leverage the purchasing power of multiple organizations to negotiate better prices with suppliers (like the focal distributor). Although purchasing trends may have shifted since 2017, the NACHC report does indicate that centralized purchasing is widely used by primary care and community health centers for purchasing medical supplies.
Centralized and collaborative purchasing, in general, helps to reduce demand variation, resulting in higher profits because the purchasing scale and negotiation power they provide should lead to greater buyer efficiencies (e.g., Eppen, 1979; Eppen & Schrage, 1981). The general finding from this literature is that pooling purchases may help reduce distribution costs by merging different stochastic revenue streams, improving storage centralization opportunities, and allowing for inventory sharing (if need be) between the various sites serviced by the distributor (Hu et al., 2013). However, small and medium enterprise buyers, like those we see in primary care healthcare, may reject the notion of “partnership” in group purchasing given that past qualitative research reports that group purchasing did not achieve the promised benefits and reported examples of abusive practices (e.g., Morrisey & Pittaway, 2004). This lack of trust and commitment may be an important reason why there are so many mixed findings from studies examining the relationship between group purchasing and actual purchasing power achieved from the relationship (e.g., Pazirandeh et al., 2013). While it is generally assumed that these centralized purchasing strategies should help primary care buyers reduce their top‐line costs, the impact on upstream wholesalers’ distribution efficiency is unclear. However, centralized purchasing should allow customers and wholesalers to coordinate demand forecasts and orders more efficiently to reduce supply chain costs. Therefore, we predict that the effect of clumpiness in order‐timing and order‐sizing behaviors on the wholesaler's distribution efficiency will be positively moderated by centralized purchasing due to the increased benefits of their scale, expertise, and similar experiences working with other buyers. The relationship between clumpiness in customers’ (a) order‐timing and (b) order‐sizing practices on wholesalers’ distribution efficiency will be further enhanced by customers’ use of centralized purchasing.
SOURCE DATA, VARIABLES, AND THE EMPIRICAL SETTING
The focal company in our research is one of a few major wholesale distributors that supplies non‐acute healthcare products to physician practices (PCs), community health centers (CHCs), and UC centers in the B2B primary care marketplace. It provides customers with a comprehensive distribution channel across 27 product line categories. Before the pandemic, the focal company generated over $2 billion in annual medical supply product sales in just its primary healthcare markets. The company offered detailed access to customer order and transaction invoice data, which included records for all the focal wholesaler's customers in a 2‐year window: 2015 and 2016. The invoice data include all the individual customer profiles, actual orders, product categories, costs, realized sales, purchase origination locations, and delivery destinations (e.g., delivery zip code, state). Each order invoice is generated and assigned to a particular shipping customer location (backorders or stockouts are not specified). If the order comes from a centralized group purchasing agent, each item is shipped by the company (parent company) to a designated customer location on the invoice. The focal company uses an activity‐based costing system for distribution services planning that considers warehouse inventory holding (inventory), inbound and outbound logistics warehouse labor (labor), and transportation costs for each product shipped out of the warehouse to a given location (logistics). For this cost assignment, the wholesaler relies on product weight and volume/size metrics for each category item to calculate transportation and handling costs.3 At the same time, it considers the dollar cost of the item in considering actual inventory holding and planning costs. These detailed data enable us to consider both the series of mixed multi‐level industry and customer‐specific factors (market, category experience, category scope, group [or centralized] purchasing) as well customer ordering practice factors (the individual customer's data clumpiness regarding order sizing and order‐timing decisions) in our analysis.
The unit of our analysis is at the category–customer location level, and we aggregate the invoice level data to the customer category and delivery location level. This reasonably estimates the focal company's total downstream distribution efficiency associated with any product category order for a specified customer location and contract. The data include stand‐alone or network practice locations, community health centers and clinics, and specialist physician practices. The treatment of the sample and underlying data is similar to that in operations management literature on platform economies and operations (e.g., Uber, Amazon, Alibaba, etc.).4 However, this study focuses on the individual customers’ decision‐making around orders for medical supplies and controls for possible heterogeneity using a single rather than many industry wholesalers.
The sample is limited to the company's primary care targeted markets: (1) practice‐based care (PC) and (2) community healthcare (CHC).5 Issues arise in dealing with CHC organizations as they often lack the technological resources and managerial acumen to implement effective demand planning, order fulfillment, and inventory control systems to support wholesale distribution efforts (Likumahuwa et al., 2013). Developing a better understanding of the resource needs and areas to guide this customer market is critical for future industry profits and social responsibility reasons (Niraj et al., 2001). During the sample development process, the 18,396,691 detailed order and transaction records are first aggregated to 874,663 distinct customer location–category combinations. The sample size further reduces during the variable development regarding customer order behaviors—CTime (clumpiness of buyer order‐timing decisions) and CSize (clumpiness of buyer ordering‐sizing decisions)—because of the need to establish ordering patterns for the different customer location–category combinations.6 The resulting sample observation size for analysis is 131,356. Table A1a–c in the Supporting Information summarizes the sample distribution across the different regions, industries, and states.
Variable construction
Identifying the key multi‐level customer and industry variables
Table 1 shows the definitions and operationalization of the key variables used in our analyses. First, to achieve better firm performance and potentially improve final‐stage distribution in its supply chain, industry wholesale distributors must be able to determine each customer's distribution cost efficiency. The first step in this process was to organize the customer‐location order data around the product category. From this perspective, this distributor was interested in how much value (wholesale sales) it drove versus each order's total downstream landed distribution cost. Wholesale sales (sales) pricing margins remain relatively constant across categories, and most companies in the industry compete on distribution support and services (IBISWorld, 2020). A customer's distribution cost efficiency to the wholesale distributor can be understood by examining the output‐to‐input ratio at the customer location–category level. The inputs are the total internal distribution landed costs, and the output is realized revenue for the orders. For each customer location–category observation i in product category j and customer parent firm k, we use sales generated as a single output measure Sijk . For the input measure, the total downstream distribution cost Cijk includes the material handling costs of an order—consisting of inventory carry cost, warehouse‐related cost, logistics cost, and related labor costs. Our dependent variable for further analysis is the estimated customer efficiency score for each customer location–category combination. We further transformed the measure using a logarithmic function. This allows the customer location–category to have a meaningful relative scale for cross‐comparison between the different resource units.
Model variables and summary of operationalization.
Note. Additional control variables are summarized in Table B1, Supporting Information, which are used in both the main analysis (i.e., parent firm and product category) and in robustness checks (e.g., zip, state, customer abnormal cost, total cost, parent size, etc.).
Distinguishing the clumpiness in customer ordering patterns
CTime and CSize
To better understand the dynamics of medical supplies order fulfillment in the medical, we compare efficiency with the revealed clumpy data pattern of customer ordering behaviors using CTime and CSize in the data. In addition to providing sufficient controls for traditional RFM of industry customers, “clumpiness” of the ordering pattern of a customer in a product category is posited to have additional explanatory effects on performance (Kumar & Srinivasan, 2015; Y. Zhang et al., 2013, 2015). CTime reflects the degree of non‐conformity to equal spacing in downstream customer order timing, while CSize reflects the degree of non‐conformity to equal ordering sizes. Following the literature in quantifying such variability (e.g., Ahuja et al., 2022), we develop both measures by calculating the coefficient of variation for customer location–category observation i within product category j and customer parent firm k.
Individual customer and industry characteristic variables
CHC
A significant factor in managing customer efficiency in this industry may relate to the customer's market characteristics. In this industry, the customer identifies with one of two primary markets: (1) practice‐based care (PC) and (2) community healthcare (CHC). Most retail customers belong to PC (95.8%), while CHC customers are the remaining 4.2%. The nature of the two markets is very different. Practice‐based care may include individual doctor's offices or larger physician practice groups. In contrast, CHCs provide the healthcare needs of largely underserved populations where there may not be complementary providers to support the delivery function. Each market may have different incentives for managing orders or inventory control systems. We create a dummy variable for our analysis to capture the market for each order (CHC = 1 if the market is CHC, CHC = 0 if the market is PC). This measure is specific to a delivery location observation i within parent company k.
Category Scope (CS)
We develop the category scope (CS) measure using the number of different product categories ordered by a particular customer in the wholesaler buyer sample. Customer ordering practices could be positively affected by learning and multi‐product joint ordering practices or negatively amplified when the complexity limits order coordination. This measure is specific to a customer firm within the parent company k.
Category Experience (CE)
Customers may learn and improve their ordering practices when they increase the frequency of ordering within a given category on average. Experience reflects the recency and frequency of category orders and may allow buyers to engage and cope with equivocal situations and confidence after they have a richer understanding of the optimal practices and financial implications of different approaches. Recency is accounted for by the 2‐year window of our study design, which removes customers with fewer than two orders within the time frame. At the same time, the frequency can be evaluated by the volume and/or number of orders a buyer makes in a specific category. We use the total order counts within the single category and then take the average of the values across multiple categories. First, we take the natural logarithmic transformation of the raw order counts due to order count skewness. Second, the order counts (log) correlate significantly with our order size dispersion (r = −0.637). We then used the residualized order counts (log) as the scale measure to reduce the potential collinearity issues in our analysis (e.g., McCann & Bahl, 2017). In a linear predictive model, we include order timing clumpiness (CTime) and order size clumpiness (CSize) as the predictors for the order counts (log). We find that the two variables have good predictive power, explaining 46.2% of the variance in the outcome variable. Here, CTime has a significant positive effect, while CSize has a significant negative effect. After fitting the model, we extract the residuals as the scale measure (i.e., the difference between actual order counts (log) and the predicted order counts (log). This residualized score captures a customer's ordering practices on the number of times in ordering, removing any effect from our measures of ordering clumpiness—CTime and CSize. Third, after we obtain the calculated values within each customer‐category, we take the average value to represent the overall category experience (CE) for a customer. This measure is specific to a customer firm within the parent company k.
Centralized Purchasing (CP)
We develop a dummy variable, Centralized Purchasing (CP), to indicate those category–customer location orders linked to the same parent firm. This indicator is developed from customer invoice data, which separates the purchasing location of an order from its intended delivery location. Most orders are generated from a purchasing portal located at the customer's operating facility. Still, orders registered to multiple sites are linked to a centralized purchasing unit, IDN, or group network purchasing arrangement. Our descriptive data analysis (Table 2) shows that these centralized (or group network) purchases represent approximately 27% of all category–customer location observations but are evenly represented in the four quadrants. This measure is specific to the parent company k.
Descriptive analysis summary descriptive table by assigned order practice classification.
Note. Mean and standard deviation (in parentheses) are reported for continuous variables. Count and percentage (in parentheses) are reported for categorical variables. Quadrants are developed based on median values.
Mixed effects modeling
After constructing the critical variables for the analysis from the empirical data, we apply a multi‐level mixed‐effects modeling approach to determine the effect of individual customer characteristics on the distribution efficiency outcomes across the different category–customer location data. We follow guidelines from recent studies (Valentine et al., 2018) and apply mixed‐effects modeling for analyzing hierarchically structured data or units of observation nested within larger clusters (e.g., McNeish & Kelley, 2019; Raudenbush & Bryk, 2002).
Mixed‐effects modeling is appropriate because the hierarchical structure of the data across different clusters may cause the error terms from ordinary least squares estimation not to be independent (i.e., errors within a group or cluster may be correlated with one another). For example, in our sample data, each observation is nested within a product category and possibly a centralized “parent” firm or purchasing arrangement, resulting in the likelihood of cross‐level effects that may violate the independence assumption. Therefore, a mixed‐effects modeling approach is used to account for such cross‐level effects. Also, mixed‐effects modeling enables the examination of cross‐level interactions between individual ordering behaviors and customer characteristics at different levels to enhance the delivery value. The empirical model is as follows:

Equation (1) is at the customer location–category observation level, and Equation (2) is at the cross‐classified product category and customer parent firm level. Yijk represents the efficiency score for customer location–category observation i in product category j and customer parent firm k; Xijk represents the ordering behaviors (CTime and CSize); Mi.k represents the vector of the customer characteristics for the moderators (CS, CE, and GP); and Xijk · Mi.k represents the cross‐level interaction effects (see McNeish & Kelley, 2019, p. 25). Cijk includes the control variable in the model (CHC). To test our hypotheses, we model the fixed effects for ordering practices Xijk (CTime and CSize) and cross‐level interaction Xijk · Mi.k (interactions between CTime (CSize) and CS, CE, and CP), as well as for moderators Mi.k and control variables Cijk . Therefore, we mainly rely on the within‐fixed effect estimation of the vectors of coefficients β1 to test the effects of CTime and CSize, and β3 for the moderating effects of CS, CE, and CP. In addition, our crossed random‐effects model includes random intercepts for product category and parent firms (β0jk ). μ00j is the random effect of product category on the efficiency score, and φ00j is the random effect of a potential customer's parent firm (see Raudenbush & Bryk, 2002, p. 385). The model specification allows us to investigate the source for the variation of the efficiency score across product categories and parent firms and examine how the ordering practices and customer characteristics affect wholesaler distribution efficiency. Tables 2 and 3 present the aggregate descriptive statistics and a correlation matrix of variables that comprise the core empirical analysis.
Correlation of key variables.
Note. The table uses pairwise‐complete correlation, based on 131,356 observations at the customer location–category level after removing the observations with missing values.
EMPIRICAL ANALYSIS
Results
The analyses use mixed‐effects models to account for the cross‐level effects of product category and customer parent firms on the category‐delivery location measures (Table 4). Following a hierarchical modeling approach, we study how new variables affect modeling outcomes while adjusting for the effects of control variables. First, we include the product category and customer parent firms’ effects in the null model specification, Model 1, to investigate the sources of variation in the resulting distribution efficiency. Specifically, we seek to understand how much the product category contributes to the variation in the efficiency‐dependent variable. This is followed by a base model, Model 2, which includes CHC, CS, CE, and CP variables. The main effect of the customer ordering behaviors, CTime and CSize, is in Model 3. Models 4–6 include the interaction effects between CTime (and CSize) and CS, CE, and CP. Finally, Model 7 shows the results with interaction effects.7
Mixed effects modeling analysis (dependent variable: Efficiency).
Note. The analysis is at the customer‐product category level. We consider both parent firm and product category as random effects across models. For easy interpretation of the interaction terms and controlling for the collinearity, CTime, CSize, CS, and CE are standardized using normal distribution before they are included in the models. The calculation of the variance proportion for M1 is based on the variance components in the model.
*** p < 0.001; ** p < 0.01; * p < 0.05; + < 0.10.
The main effects of the ordering behaviors
The results in Model 7 show that the estimation of the ordering behavior in CTime on efficiency is positive and significant (b = 0.02, p < 0.001), indicating that a higher level of CTime (increased data clumpiness in a specific location's order‐timing practices) is associated with increased cost efficiency in the delivery process. To numerically interpret the results, we calculate the marginal effect of CTime and find that it is statistically different from zero (p < 0.10). The increase in the CTime from one standard deviation below the mean (0.22) to one standard deviation above the mean (1.54) leads to an increase of 0.054 (or 2.2% relative to the overall mean of 2.51) in efficiency. Assuming a fixed sales value implies a 5.37% (equivalent to $7.04 million) reduction in total summed distribution costs.8 The results from different models appear to remain internally consistent (Models 3–7). This result contradicts our hypothesis (H1a), suggesting that clumpiness in order timing would be associated with lower wholesale distribution efficiency because of the increase in the forecast uncertainty and a diminished ability of the wholesaler to coordinate and manage downstream customer orders. However, the opposite finding suggests increased clumpiness order‐timing practices benefit wholesaler distribution efficiency performance.
Meanwhile, we find that the ordering practices in CSize have a significantly negative relationship with efficiency (b = −0.02, p < 0.001). Based on the marginal effect calculation, increasing CSize from one standard deviation below the mean (0.15) to one standard deviation above the mean (0.37) leads to a reduction of 0.051 (or 2.0% relative to the overall mean of 2.51) in the wholesaler's distribution efficiency. Assuming a fixed sales amount implies a 5.15% (equivalent to $6.75 million) increase in total summed distribution costs.9 These results are consistent across the different models (Models 3–7) and support our hypothesis (H1b) regarding the adverse effects of order‐sizing clumpiness on wholesaler distribution efficiency. Unlike order‐timing, the lack of order clumpiness in customers’ order‐sizing practices may help reduce forecast uncertainty and improve efficiency.
Considering the results for both order‐timing and order‐sizing, downstream distribution efficiency can be improved when customers have higher clumpiness in their order‐timing practices but lower clumpiness in their order‐sizing practices. These empirical results collectively support the optimal inventory ordering practices with a fixed order quantity that customers respond to the stochastic demand by placing orders (fixed economic order size) whenever inventory levels fall below a set re‐order point. It is understood that fixed order quantities using continuous review ordering systems can benefit customers. Our study adds empirical evidence that customers’ strict adherence to optimal continuous review inventory control policies may also benefit the upstream wholesaler's distribution efficiency in cost‐oriented, wholesaler‐dominated industries by better matching orders with the customers’ actual level of demand. Such practices do not make anticipating demand more difficult for the medical supplies industry wholesaler within a fast‐response supply chain system (Bicer et al., 2018). Because predictable order sizes may help mitigate the effect of large demand spikes over time (Cachon et al., 2007; Chen & Lee, 2012), our clumpiness measure results suggest that inventory ordering practices would be good for customer inventory control are also what is suitable for the wholesaler.
Controlling for category, customer, and industry‐level characteristics
Product category: We model the effects across product categories as random effects. The variance decomposition in the Null Model, Model 1, shows that the product category has the most significant variance contribution (1.08), contributing to 73.25% of the total variance in distribution efficiency. Product category, therefore, is the most critical contributor to the distribution efficiency (of the wholesaler). Given the importance of product category mix to efficiency performance, we conducted several additional visual analyses of the data. Figure A2, in the Supporting Information, shows the distribution of the efficiency score by category as boxplots, indicating differences in the realized efficiency across the types of products supplied by the wholesaler. The figure shows categories sorted by those with the lowest average efficiency to those with the highest average efficiency. For instance, the plot can identify less efficient categories, like personal care, respiratory, and suction equipment. However, other categories, such as pharmaceuticals and laboratory, are more efficient than other categories, on average, but have a good deal of variation in efficiency scores among the customers who buy these products.
CHC: The results in Table 4—Model 2, show that the CHC market customers have lower overall efficiency for the wholesaler than the PC market customers (b = −0.02, p < 0.05). The results are directionally consistent across models (Models 2–7), although the effect estimations are not universally significant across all models. The result suggests that market heterogeneity exists regarding customer ordering practices and efficiency improvement, and CHCs tend to have a more negative effect than PCs on the wholesaler's distribution efficiency.
CS: Table 4—Model 2, shows a significant negative relationship between CS and efficiency (b = −0.03, p < 0.001). The consistent results from Table 4—Models 2–7, show that the category scope of customer orders, reflecting the joint multiple‐product ordering practices, may increase the complexity of ordering practices and lead to lower overall distribution efficiency.
CE: The results in Table 4, Model 2, show a significant positive relationship between CE and efficiency (b = 0.07, p < 0.001). The consistent results from Table 4, Models 2–7, show that the category experience with customer orders, reflecting both customer and category experience, improves overall efficiency for the wholesaler. This finding aligns with the benefits associated with the production economies of scale on inventory order efficiency found in other contexts (e.g., Rumyantsev & Netessine, 2007).
CP: Table 4 results reveal that there is a small but significant and negative main effect from CP on distribution efficiency for this truncated portion of the supply chain (b = −0.04, p < 0.001). The results imply that location–category orders generated from centralized purchase contract invoices will likely reduce the wholesaler's distribution efficiency, probably due to these types of entities’ top‐line price negotiation orientation.
The interactions with customer‐level characteristics
CS: Regarding the moderating effects of CS on wholesaler distribution efficiency, the results from Model 7 in Table 4 show that the coefficients are negative and significant for the interaction terms between CS and CTime (b = −0.01, p < 0.001) and between CS and CSize (b = −0.03, p < 0.001). This implies that when the number of different product categories ordered by the customer at one time increases, order clumpiness (both CTime and CSize) reduces wholesaler distribution efficiency. These findings may indicate that expanded ordering scope from joint multi‐product categories can add complexity and challenge already inefficient ordering practices. Moreover, it suggests that any potential distribution efficiency gains to the wholesaler from joint‐ordering opportunities or economies of scope across product categories do not compensate for the added complexity for the wholesaler (H2a,b are not supported).
CE: The model coefficients are positive and significant for the interaction terms between CE and CTime (b = 0.01, p < 0.001) and between CE and CSize (b = 0.02, p < 0.001). Thus, as the clumpiness in customer order timing increases, there is a net positive effect on the wholesaler's distribution efficiency with greater category experience. In contrast, as customer category experience increases, the negative effect of the clumpiness in order‐sizing on efficiency is somewhat mitigated. These findings may indicate that increased customer ordering experience with the buyer improves the distribution efficiency for the wholesaler (H3a,b are supported). Perhaps this is because a wholesaler with significant category buying experience with a particular customer will be able to improve coordination and better manage forecasted demand, as well as seek out supply chain surplus opportunities through joint ordering, transshipment, and just‐in‐time order rationalization.
CP: Centralized purchasing moderating effect on distribution efficiency varies depending on the specific ordering practices. We find that the coefficient is positive and significant for the interaction term between CP and CTime (b = 0.04, p < 0.001), but the coefficient is negative and significant for CP and CSize (b = −0.02, p < 0.001). These findings suggest that cooperative buyer agreements have different implications for wholesale distribution efficiency based on the CTime and CSize practices. When buyers have a higher clumpiness in their order‐timing, centralized purchasing tends to improve the wholesaler's distribution efficiency. Conversely, when buyers have more clumpiness in their order‐sizing practices, customers using centralized purchasing further reduced wholesaler distribution efficiency (H4a is supported; H4b is not supported).
Figure 2 illustrates the estimated conditional interaction effects among customer ordering practices and the moderating customer factors. For the effects of ordering practices, the illustrations clearly show that the predicted distribution efficiency is higher when customers have higher clumpiness in their order timing (CTime). This increase also presents customers order under centralized purchasing agreements, have less category scope, and have greater category experience (see Figure 2a1–a3). For the customer clumpiness in order sizing, the plot shows that the predicted distribution efficiency is higher when customers have less clumpiness order sizing (CSize). As CSize increases, the efficiency drops substantially when customers order under centralized purchasing contracts, greater category scope, or have less category experience (see Figure 2b1–b3). Finally, we summarize the main findings in Table 5.
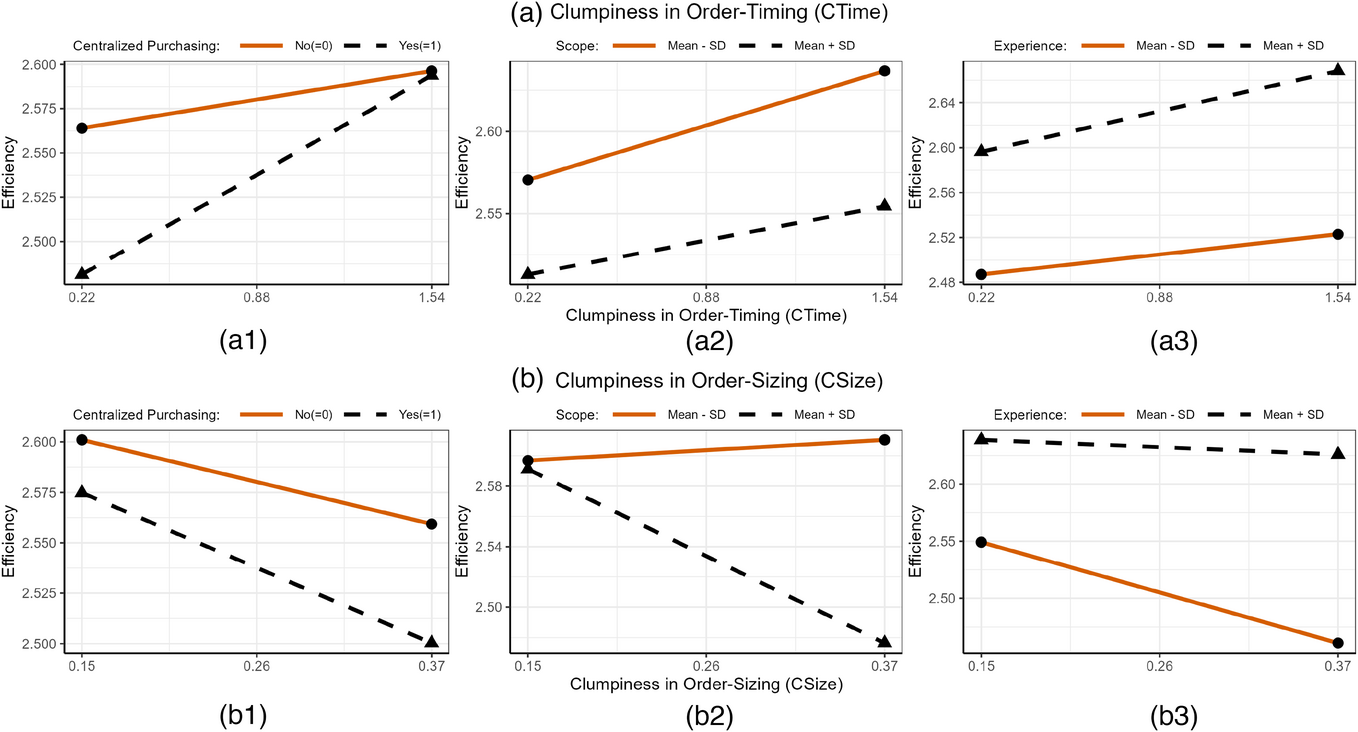
(a.1–b.3) Plot of predicted customer delivery efficiency for data clumpiness in order‐timing, data clumpiness in order‐sizing, and interactions. Note. The plots are based on the marginal effects estimated from the interaction model in Table 4, Model 7. The effect is calculated when we fix all other continuous variables at their mean values and categorical variables with an averaged proportion value over factor levels. The plots show how the efficiency will change when the data clumpiness in order‐timing (and data clumpiness in order sizing) changes from one standard deviation below the mean (Mean − SD) to one standard deviation below the mean (Mean + SD). In the interaction plots for centralized purchasing, centralized purchasing is a categorical variable: No ( = 0) or Yes ( = 1). For scope and experience, we take two levels: one standard deviation below the mean (Mean − SD) and one standard deviation below the mean (Mean + SD).
Summary results for hypotheses tests.
Summary of additional analyses and robustness checks
Abnormal customer costs
Because the unobserved operating cost of customers may affect their ordering practices, which, in turn, may affect the wholesaler distribution efficiency, we attempted to control for the buyers’ individual cost structures. Since obtaining all buyers’ accounting and financial data is impossible, we cannot directly measure buyers’ costs beyond the supply chain costs to the wholesaler. Thus, we attempted to address this issue by estimating the indirect and abnormal costs and then include this measure in our primary model to account for those buyers’ fulfillment costs. Following an estimation approach (Table B2, in the Supporting Information), we applied a linear fixed effects model based on peers’ locations, product categories, and the customer's ordering patterns and experiences to obtain the abnormal cost. Then we included it as a control in our primary analyses, finding that the results are consistent with our primary analysis.
Alternative dependent variables
We checked the robustness of our analysis by employing alternative dependent variables using different cost components. We replaced the aggregated costs with individual cost components: inventory carry costs, warehouse‐related costs, labor costs, and logistics costs. Meanwhile, we use profits, instead of sales, to develop an alternative measure. With these new dependent variables in the model, we report the results in Table B3, in the Supporting Information, which are broadly consistent with our main findings.
Different customer delivery location effects
To understand how the delivery location will affect the delivery efficiency, we assessed our model and results by considering the random effect of (1) zip code and (2) state. We find that the zip code can explain only 0.4% of the variance of the efficiency score, and the state can explain only 0.9% of the variance. Given the small variance contribution, we can safely ignore the random effect of location zip codes in our model. Nevertheless, we re‐ran the analysis, including the random effects of zip code and state, and found similar results (Table B4, in the Supporting Information).
Sufficient customer ordering pattern data
Our principal analysis focuses on the identified customers based on their clumpiness of their ordering timing and sizing practices. To maintain a sufficient ordering pattern for analysis, we limited our observations to include only the customers (category–customer location combinations) with non‐zero ordering size variance. Ad hoc analysis showed that in about 80% of these cases (Table B5 and Figure B1, Supporting Information), these were highly infrequent orders from smaller customers (<5 orders during the 2‐year study time period). We included all the observations with zero‐ordering size dispersion by using a dummy variable to indicate whether the ordering size dispersion is zero (e.g., see Model 1 from Table B5 in the Supporting Information). The analysis shows that the group of zero‐dispersion is very different from other groups and is most likely due to low order frequency and insufficient pattern data. It also shows that these ad hoc orders result in a lower efficiency linked to customers with zero‐ordering size variation versus those with non‐zero variation (Figure B2, Supporting Information).
Customer's category experience (CE) on the ordering clumpiness
It is possible that a customer's CE can enable customers to improve upon suboptimal ordering practices to identify the “learning effects” of achieving greater effectiveness. Thus, we specified a linear prediction model on the two ordering practices variables (CTime and CSize) as dependent variables, while treating product category, CE (measured as average number of category orders without residualizing), and their interactions as the predicting effects, controlling for the CHC effect. We find that CE can generally help increase CTime and decrease CSize. However, the effects of CE vary significantly across the different product categories (see Figure B3, Supporting Information, and Figure B4 presents an alternative view of the prediction results). For the effect of CE on CTime, we find the most considerable benefits of CE are present in product categories, including wound closure, pharmaceuticals/commodities, ostomy supplies, and instrument variable (IV) products and solutions. In contrast, the least benefit of CE are present in general wound care, incontinence, woven/non‐woven, and diabetic care. For the effect of CE on CSize, we find the most significant effects of CE in reducing CSize are present in product categories including general wound care, infection prevention/sterile, orthopedics, and laboratory; In contrast, the least benefits of scale are present in durable medical equipment/physical therapy and activities of daily living, medical equipment (non‐diagnostic), diabetic care, and nutritionals. The results remain similar after we include the three‐way interaction among scale, product category, and market.
Additional robustness checks
Various additional analyses were conducted to ensure the reliability and validity of our findings, including fixed effects modeling, IV analysis, and coarsened exact matching (CEM) analyses.10 These robustness checks (Tables B6–B18, Supporting Information) help address omitted sample issues, rule out alternative explanations, and ensure the results reported in Table 5 are consistent.
RESULTS DISCUSSION AND CONCLUSION
Information transparency and coordination opportunities for primary care can help facilitate the value co‐creation process for better healthcare product delivery (Chakraborty & Dobrzykowski, 2014). This research aimed to integrate marketing and operations/supply chain theoretical insights to develop a means for medical supplies industry wholesale distributor firms to use their customer data better to highlight deficiencies and improve their distribution efficiency performance. First, we sought to determine what customer ordering practices make a medical supplies industry customer more or less efficient for the focal wholesale distributor. We proposed that traditional notions from supply chain management could be studied as patterns of “clumpy” ordering practices. We found that such patterns became evident by the clumpiness of customer orders from invoices based on order sizing and timing patterns. The findings supported the general importance of buyer ordering policies that use consistent quantities and replenishment based on the customer's actual needs (demand) and not the wholesale distributor's periodic convenience. This finding contributes to prior operations management research studying traditional inventory continuous review policy–performance relationship at the firm and industry levels (Rumyantsev & Netessine, 2007) and studying how intermediaries supply chains may contribute to driving greater operational performance (Belavina & Girotra, 2012). Specifically, our study offers additional empirical evidence that reducing the clumpiness around order‐sizing practices within the same product category while simultaneously allowing the non‐conformity to equal spacing for the time between orders has a significant positive category and location‐level performance benefit for medical supplies distributors. Past studies of order variance across industries tend to suffer from time‐period or industry aggregation problems (e.g., Bray & Mendelson, 2012; Ojha et al., 2019; Rumyansev & Netessine, 2009) or have highlighted the within‐unit variation in primary care markets (Ahuja et al., 2022), so our research offers a new means to detect the clumpiness of upstream order patterns that may drive distribution inefficiency for medical supplies wholesale distributors that serve primary care market customers.
Moreover, our research shows that data clumpiness for order timing is not an adverse driver of wholesale distributor costs. This is in contrast to past operations management research suggesting that more consistent scheduling for labor (e.g., less clumpiness) improves transactional efficiency (e.g., Lu et al., 2022). In our industry context, it was found that greater order timing clumpiness was positively associated with an increase in upstream distribution efficiency. This finding also runs counter to our initial hypotheses (H1a), as well as the current thinking embedded at the focal firm (the supply chain organization leadership had believed that periodically scheduled orders [i.e., weekly deliveries] were actually more efficient). Nevertheless, the empirical evidence does show that consistent order sizing (lower order size clumpiness) was associated with greater wholesale distribution efficiency (H1b supported). Because our research design expressly excluded any fixed category‐level batch size or packaging restrictions, this finding implies that customers will order in variable quantities even though they can order in consistent quantities. Extant theory and our empirical findings suggest that this practice of varying order sizes during specific periods increases costs and limits the potential value captured for both the customer and the wholesaler.
Our findings suggest that customers and wholesale distributors are more likely to co‐create value opportunities if industry customers follow the prescribed operations management inventory policies in most categories. In a descriptive analysis, we found that a relatively large number of customer location–category observations deviate substantially from “best practices” in their category ordering policies (about 89% of the total observations fall out of Q4, see Table 2), indicating that there are significant opportunities for the wholesaler to improve transactional efficiency of this truncated portion of its distribution system. Upon further investigation at the focal distributor, one potential issue identified was that the wholesaler might benefit from de‐emphasizing the weekly order sheet that field representatives offer to some customers toward a more interactive, computer‐based platform for ordering. Periodic automatic review practices such as these, where a target inventory level is set, inventory is checked regularly, and orders are placed at uniform intervals, are widely accepted due to the ease of use and have largely been ignored in terms of cost and service‐level impact. While research on this topic has been relatively scant, past research has suggested that such widespread practices create significant supply and demand mismatches (Karamshetty et al., 2022).
The findings from this research show that weekly sheets promote incentives that may drive periodic ordering to the detriment of customers and wholesale distributors. These findings also offer preliminary evidence to support the academic argument that there may be a justified cost premium to being more responsive in replenishment (Bicer et al., 2018) and that there is a potential for shared value from improving and coordinating downstream customer ordering practices. In contrast, the move toward more automated systems (which tie more closely to the continuous review concept) has been a point of emphasis in the medical vendor market. Specifically, many consulting, software, and product companies have discussed inventory management while noting the benefits of continuous monitoring systems. Their goal is to sell their product/service, but the central tenet of what they are offering is the ability to assist in perpetual inventory tracking so as to streamline operations and gain the benefits of a continuous inventory system. One such implementation (
Another research goal was to show how multi‐level buyer characteristics in the medical supplies industry, such as category experience, scope, and centralized purchasing agreements, may interact with customer order clumpiness. We used a multi‐level empirical modeling approach to examine the main and moderating effects of the different customer characteristics (category scope, category experience, and centralized purchasing) to determine these effects. First, we hypothesized that category scope would positively moderate customer practices in favor of greater distribution efficiency. Here, we find mixed support for our second set of hypotheses, with greater category scope amplifying the negative impact of clumpy order sizing and timing practices on wholesaler distribution efficiency. At least in this truncated portion of the supply chain, neither buyers nor sellers could apply advantages from expanding service scope. It appears that cross‐category ordering from wholesale buyers introduces additional complexity that amplifies the negative impact of negative ordering practices, mainly when there is more CSize. For the focal firm, this new evidence suggests efficiencies might be gained by staging distribution facilities, as has been done in other industries, to recognize “drop‐ship” opportunities to combine orders across categories for common location delivery in their consolidated warehouses to lower costs (Shockley & Fetter, 2015).
Buyer category experience is also vital to the wholesaler's distribution efficiency performance related to better coordination of downstream customer orders. Past literature has shown that a buyer's advanced knowledge of product lines and delivery practices may be associated with improved performance (Tokar et al., 2012). One potential explanation, justified through behavioral studies (e.g., Croson et al., 2011), is that buyer experience may help the customer improve coordination with the distributor to reduce risk perceptions and avoid unnecessary ordering. Our results lend some empirical and industry‐specific evidence that category experience matters for improving efficiency and can complement favorable ordering practices in this industry. This is a consistent and robust result across all model specifications. While the wholesale distributor cannot control whom their customers hire to generate orders, the findings here justify that coordination opportunities exist within the industry to gain efficiency. Where there are less‐experienced buyers, the field representatives could work with them to improve ordering practices to benefit both the distributor and downstream customers.
The analysis also revealed interesting industry insights on the role of centralized purchasing agents across the different types of customers by showing slightly worse distribution efficiency performance when purchase orders were indicated as stemming from a centralized purchasing system. Interestingly, we find that the effects appear unrelated (independent) to the ordering scale (experience [or volume] within a particular category). Given that the use of centralized purchasing in this industry may be historically more oriented toward the top‐line price reductions that significantly lower the potential value of this business to the wholesaler (reduce efficiency), it is perhaps not surprising that we find that medical supplies transactions made under such systems are less efficient for the medical supplies wholesaler. However, one of the crucial insights concerning customer ordering practices suggests that the wholesaler can mitigate the negative performance when a customer uses centralized purchasing if better coordination occurs with the wholesaler regarding buyer replenishment practices. This suggests that when customers use centralized purchasing (such as through IDNs), they should work with these customers to successfully implement continuous review systems based on Q,r logic. These findings suggest that such systems will outperform those that have failed in this regard. For example, more clumpiness in order sizing may amplify the adverse effects of centralized purchasing. Conversely, when customers exhibit greater clumpiness in order timing, this almost eliminates any negative impact on the wholesaler's efficiency. This has important implications given that it is widely recognized in the industry that centralized purchasing, and GPOs are on the rise but also need to evolve into becoming more distribution and supply chain‐focused at the same time, as they have optimized most of the potential benefits from negotiating lower top‐line prices (IBS World US Specialized Industry Report, 2020).11 Our empirical findings show a possible opportunity for these purchasing agents to improve value‐added supply chain performance. Ultimately, wholesale distributor inefficiencies will be passed on to industry customers in wholesale price increases due to increased business costs.
Our post hoc analyses of clumpiness in customer ordering practices may also reveal suboptimal category‐specific performance related to harmful practices or wholesaler inefficiencies that some members exploit. For example, it was found that some categories do not benefit from buyer experience or a reduction in clumpy ordering practices. This analysis may signal potentially abusive practices within the supply chain structure, such as bad practices like loss gaming and stockpiling in some categories. It also helps reveal internal problems resulting from extensive SKU proliferation within some categories, suggesting additional SKU management and purchase control are necessary to improve efficiency in these areas. Our analysis shows that the product category accounts for over 70% of the measured variation in the distribution efficiency performance of a particular customer order. This is not terribly surprising as products within some categories may be bulky or have differences in their demand uncertainty profiles, which cause difficulties for order fulfillment, warehousing, or inventory planning purposes. Nevertheless, our analyses revealed that three categories—incontinence, pharmaceutical, and physical therapy—might be driving significantly lower distribution efficiency for this wholesaler. While not the primary objective, the proposed model offers the company a means to rank‐order efficiency scores to identify those customers that may leverage the wholesaler's distribution capabilities to fulfill only “loss‐leader” categories like adult diapers (incontinence category) that are generally expensive to store and deliver. Additional applications of our model could be used to examine if specific customers in the pharmaceuticals/commodities (non‐prescription) category may be stockpiling over‐the‐counter medication. While the category is not that inefficient overall, we find much inconsistency in the ordering patterns of some identifiable customers within this group, particularly for smaller‐scale customers. Finally, our analyses revealed that the physical therapy category had a proportionally higher number of SKUs and more irregular ordering patterns, which may mean that better assortment rationalization might be required for that category to control associated costs.
Our analyses further revealed several significant differences between the PC and the CHC customer market when comparing efficiency and ordering practices. First, we found that PCs are generally more efficient than CHCs, even when controlling for category mix and ordering scale effects. It was also found in a post hoc analysis that PCs show more significant efficiency improvement as they improve ordering experience compared to similar CHCs. While a more category experience is always associated with greater customer distribution efficiency, the CHCs do not reap the same rate of efficiency improvements. This suggests that CHCs may suffer from resource constraints prohibiting them from improving at the same rate as PCs. Since CHCs provide low‐cost services to underserved medical markets, increased partnerships between industry distributors within this healthcare market might enable CHCs to achieve the same benefits from increasing their ordering scale. This analysis offers potential insights for additional customer coordination opportunities to co‐create value to benefit the CHC market and society.
LIMITATIONS AND FUTURE RESEARCH OPPORTUNITIES
While our research offers a new means to analyze how downstream customer ordering practices and characteristics affect the distribution efficiency of a medical supplies industry wholesaler, it has several limitations that offer areas for future study. First, our analysis of the landed distribution costs uses estimates provided by the one focal distributor. It includes only the assigned expenses allocated to specific products based on aspects such as size and weight, as well as the delivery location. However, it does not incorporate all the “true” landed distribution costs associated with the entire supply chain of specific medical supplies product categories. One example may be in the pharmaceuticals/commodities category (e.g., aspirin), which may have different temperature storage, traceability, and handling requirements than incontinence products (e.g., adult diapers). Second, our research makes several underlying assumptions about customer ordering practices based on only 2 years of order pattern data in a relatively steady‐state environment. While our methodological approach controls for any efficiency bias from the customer characteristics embedded in our core model, access to a more extended period of data, including that of recent Covid‐19 pandemic demand surges, would likely improve the predictive nature and value of our empirically driven modeling of customer ordering practices and how they change under periods of extended supply uncertainty. Moreover, some model variables, like category scope and experience, may be unbalanced within certain customer groups or categories (a limitation of the data). However, our series of robustness checks attempts to control this issue.12
Another opportunity for future research across different healthcare supply chain contexts stems from our inability to directly identify whether any customer networks within the distributor's portfolio use GPO agreements. While we identify orders that originate from centralized purchasing and are delivered directly to customer locations, more granular data on the nature of these purchasing groups would be a fruitful avenue for future analysis. One recommendation to the focal firm was to capture at the customer level what orders were generated under different types of GPO arrangements, as well as the size and ordering experience of the centralized purchasing agent, something that is currently not practiced in the focal company.13 However, controlling for the presence of other factors in a specific category, being a member of a purchasing organization does not appear to improve a customer's ordering practices in isolation (in fact, we discover a slight reduction in distribution efficiency related to the centralized purchasing contracts even after controlling for the top‐line effect). This finding speaks to the historical top‐line goals of centralized purchasing. In contrast, these agents may have opportunities to work with wholesalers to improve the coordination of orders in specific industry categories to extend the supply chain surplus to these customer groups.14 As a result, we have recommended better alignment and data sharing between the value proposition group and supply chain organization to get to the heart of this issue and to develop an incentive structure for working with larger purchasing groups (including the larger GPOs) to improve customer‐level ordering practices. Finally, the growing presence and societal role of community‐based health organizations (CHCs) would be an additional area of research across multiple healthcare industries. Our findings suggest significant differences between these markets’ ordering practices and behaviors. Industry distributors could use this information to reduce costs for this healthcare supply chain. While our focus is on the medical and surgical supplies industry, there is no doubt that these market differences may exist in many other industries where CHCs buy materials and equipment. Future healthcare supply chain delivery studies should account for the unique differences between the CHC market and other primary medical care providers.
Footnotes
ACKNOWLEDGMENTS
The authors would like to thank the Healthcare Supply Chain session attendees at the 2022 Industry Studies Association Annual Conference in Philadelphia for their feedback while this research was in its early development. We are also grateful to Bradley Staats and the entire review team for their guidance and suggestions to improve the paper through the review process.
1
Healthcare Industry Distributors Association Chartbook,
2
American Hospital Association,
3
The focal company uses the concept of “dimensional weighting” or “Dim weight.” In this case, Dim weight is the amount of space a package occupies in relation to its actual weight. This is a practice that was initiated simultaneously by UPS and FedEx (in 2015) where packages are not simply weighed but instead are assessed via specific dimensional qualities (i.e., length × width × height). Companies like the focal firm will often use combinations of the actual weight or the Dim weight to assign direct labor and transportation costs depending on the specific aspects of what is being shipped.
4
Our approach here is similar to that seen in other industry studies using single firm cases as the main empirical setting. Alibaba is used as a platform to study the impact of high‐quality logistics provision (Cui, Li, & Li., 2019) and the spillover effects of price promotions (Zhang et al., 2019). Amazon is used to study the relationship between inventory availability information and consumer purchasing behavior (Cui, Zhang, & Bassamboo, 2019). Walmart, Nike, and Gap Inc. are studied separately on their practices on supply chain labor standards and social responsibility (Distelhorst et al., 2016; Gielens et al., 2018; Kesavan et al., 2022). Uber is used as an example for the study of the effect of digital platforms on the taxi industry (Liu et al., 2021). A single‐firm approach is also used to study the implications of data on decision‐marking and profits of an automobile replacement parts retailer (Kesavan & Kushwaha, ![]() ).
).
5
The focal company provided additional UC center data. The initial analysis withholds the UC customer market sample because the company only wanted to understand market differences between the PC and CHC markets for this study. However, the UC sample is retained later as a robustness check on the validity, and these validated results are reported in the Supporting Information.
6
It requires the sample to be limited to customers with repeated orders (more than two orders during the time period) to develop the variables. We validate our analysis by considering the single‐order customers; see Table B5, Figures B1 and B2, in Supporting Information.
7
We examined the potential curvilinear relationships between CTime/CSize and efficiency. However, we found that the quadratic terms of CTime and CSize are not statistically significant, and visually the trends closely aligned with the linear relationships (see Appendix B18 and Figure B6 in the Supporting Information). Thus, we opt not to incorporate the curvilinear relationships. We thank reviewers for this suggestion.
8
Given that efficiency is defined as
9
Similarly, here a = 0.980, and we can obtain the new cost C 2 = $137.78 million. The increase in costs is $6.75 million, which is equivalent to 5.15%.
10
A series of robustness analyses further ensures the validity of our findings. First, we expanded our sample to include data related to the Urgent Care Market Group, in addition to PC and CHC markets. To address potential time window effects, quarterly level data and mixed‐effects modeling analysis were used with fixed effects for time. Fixed effects modeling approaches with various multiway clustering standard errors. Potential endogeneity issues were addressed by using additional IV and CEM analyses. The findings were verified across alternative samples using various inclusion criteria, such as data from PC market only, urban areas, top categories, and number of orders per customer. The results we cross‐checked using an alternative measure of category experience based on the average of logged total number of orders across categories for a customer. Furthermore, we added additional controls, conducted subsample analysis based on order practice, developed a sample with comparable characteristics, and developed alternative measures of category scope using revered concentration measures. Finally, we checked the results by excluding sample with potential partial shipments and examined the influence of potential curvilinear relationships. See Tables B6–B18, Supporting Information.
11
This sentiment was also expressed in March 2021 interview with a senior executive at one of the major US GPOs—more information available upon request.
12
Robustness analysis with fixed effect modeling (Table B8, Supporting Information) and CEM (Table B10, Supporting Information) confirms the general findings.
13
According to focal company executives in the distribution/marketing function, it is assumed that the great majority of identified centralized purchasing customers (>90%) are, in fact, generated through some sort of GPO contract.
14
To help explain these findings, we interviewed a representative of one of the two major GPOs that works with large customers of the medical supplies wholesale distributor. He stated that there was a growing recognition that GPOs needed to become more involved with supply chain distribution efforts to improve costs related to bad inventory order behavior and control.