
Abstract
We propose a general modular approach to support decision‐makers' response in the early stages of a pandemic with resource expansion, motivated by the shortage of Covid‐19‐related intensive care units (ICU) capacity in 2020 in Italy. Our approach uses (1) a stochastic extension of an epidemic model for scenarios of projected infections, (2) a capacity load model to translate infections into scenarios of demand for the resources of interest, and (3) an optimization model to allocate this demand to the projected levels of resources based on different values of investment. We demonstrate this approach with the onset of the first and second Covid‐19 waves in three Italian regions, using the data available at that time. For epidemic modeling, we used a parsimonious stochastic susceptible‐infected‐removed model with a robust estimation procedure based on bootstrap resampling, suitable for a noisy and data‐limited environment. For capacity loading, we used a Cox queuing model to translate the projected infections into demand for ICU, using stochastic intensity to capture the variability of the patient arrival process. Finally, we used stochastic dynamic optimization to select the best policy (when and how much to expand) to minimize the expected number of patients denied ICU for any level of investment in capacity expansion and obtain an efficient frontier. The frontier allows a trade‐off between investment in additional resources and the number of patients denied intensive care. Moreover, in the panic‐driven early days of a pandemic, decision‐makers can also obtain the time until which they can postpone action, potentially reducing investment costs without increasing the expected number of denied patients.
INTRODUCTION
By the end of 2021, Covid‐19 had already taken an estimated 15 million lives as estimated by the WHO, in part due to a shortage of intensive care units (ICUs) and other resources. We provide a general approach to determine the optimal timing and extent of resource expansion, say, ICUs, in the early stages of a pandemic with budget constraints and the high uncertainty in the growth of infected people. Furthermore, we apply it retrospectively for the early stages of the first and second waves of Covid‐19 in three regions in Italy that suffered high fatalities.
We frame the problem as that of capacity expansion under demand uncertainty, an established topic in the operations literature (Luss, 1982; Van‐Mieghem, 2003). In healthcare, capacity management involves decisions related to the allocation of such critical resources as facilities, equipment, and personnel (Smith‐Daniels et al., 1988) that can have life‐or‐death implications. Moreover, in a pandemic, we must plan for peak demand to avoid waiting lists, even though the demand surge would eventually subside. Finally, we focus on the supply‐side response to a pandemic by expanding resource capacity proactively, keeping demand‐side responses such as lockdowns, quarantine, and vaccinations that “flatten the epidemic curve” outside the scope of this paper.
The modular approach we propose for resource capacity expansion allows alternative models to be used, depending on the pandemic or the type of resource. The three modules in our approach are (1) a stochastic extension of an epidemic model to create scenarios for the daily number of infections in the coming weeks, (2) a capacity load model to translate the projected infections to demand for the resource of interest, and (3) an optimization model to allocate the demand to the resource at different levels of capacity corresponding to different levels of investment.
We illustrate this approach by applying it retrospectively to the early days of the first and second Covid‐19 waves in the three regions in Italy—Lombardia, Piemonte, and Veneto—that have different per capita ICU capacity, taking care to use only the information available at the time. First, we used a parsimonious susceptible‐infected‐removed (SIR) epidemic model, suitable for a noisy and data‐limited environment, such as the onset of a pandemic. Second , we used a queuing model to translate the projected infections into demand for ICU. The variance of the number of arrivals in any interval here is larger than the mean in a pandemic, unlike a Poisson process. Finally, we used dynamic programming to allocate the demand to ICU capacity, which changes with different levels of investment. The decision‐maker can see the efficient frontier of the expected number of patients denied intensive care with investment. We also obtain the optimal time to postpone action, reducing costs without increasing the expected number of denied patients.
In the rest of the paper, Section 2 discusses our contribution to the existing literature. Section 3 describes our modular approach. Sections 4–6.1 detail the three modules in turn, along with the application to the Italian regions for the first two waves of the pandemic. Section 7 concludes.
CONTRIBUTION TO THE LITERATURE
In the literature on capacity expansion under uncertainty, the canonical objective is minimizing the investment while limiting the unmet demand, see Luss (1982) and Van‐Mieghem (2003). We invert this perspective by minimizing the unsatisfied demand with a constrained budget. Additionally, we provide the marginal cost (shadow price) for admitted patients as an output instead of requiring it as an input to the model. Nor do we need an ex ante penalty for the trade‐off between the cost of intervention and the value of a statistical life or a quality life year saved (Li et al., 2023), for example, $10 million in the United States (Kniesner & Viscusi, 2005).
We contribute to the pandemic‐focused healthcare operations literature with the economics of capacity expansion, enabling decision‐makers with an approach that is more comprehensive and flexible compared to similar papers. Furthermore, each of the three modules introduces innovations in our retrospective application for Covid‐19 in Italy. Important outputs of our approach for decision‐makers are (1) the minimum (expected) number of patients denied use of ICU (or other limited resource), given the existing ICU capacity and investment for increasing it; (2) the budget increase needed to accommodate an additional patient, that is, the shadow price; (3) the time until which decision‐makers can postpone action, reducing costs without increasing the expected number of denied patients; and (4) the ceiling beyond which further investment is useless.
A modular approach to capacity expansion in a pandemic
Our modular approach supports decision‐makers in the early stages of a pandemic with planned capacity expansion using (1) a stochastic epidemic model to project scenarios of the infection spread in the early days of a pandemic with high uncertainty, (2) a capacity loading system to translate infections into the need for the resources of interest, and (3) an optimization method to allocate the demand to the resources available at different levels of investment (Figure 1).
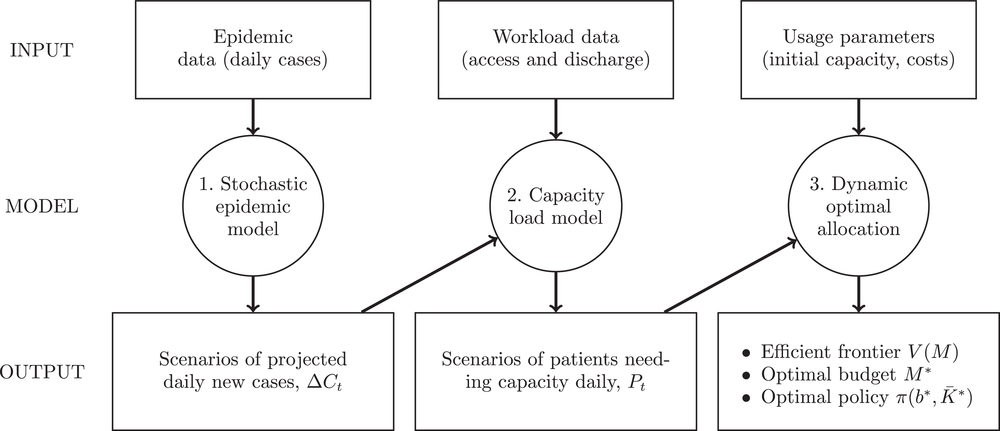
Our modular framework comprises three models: (1) The stochastic epidemic model produces infection scenarios, (2) the capacity load model converts these scenarios to the demand for resources, and (3) the optimal allocation model allocates the demand to the resources at different levels of investment.
The operations literature on Covid‐19 focuses either on containing the demand or increasing the supply of needed resources (Table 1). The demand‐focused stream investigates “flattening the epidemic curve” (Evgeniou et al., 2022; Ferguson et al., 2020; Jain & Rayal, 2023; Perkins & Espana, 2020; Shahmanzari et al., 2022) containment measures such as lockdown or quarantine, given a fixed capacity for the ICU (or other pertinent resource). The supply‐focused stream, in which our paper is positioned, focuses on capacity expansion of ICU (or other resource) (Alban et al., 2020; Lu et al., 2021; Ouyang et al., 2020; Shi et al., 2022; Wood et al., 2020). Unlike our use of three models—epidemic, demand, and optimization—many researchers have used just two of the modules. Moreover, they have not used stochasticity in their epidemic modeling. Some have used the Poisson process with deterministic intensity in the second module, which is not suitable for the early pandemic stages with data of questionable quality. Other researchers have not used optimization in the third module, limiting themselves to what‐if analyses. Table 1 provides an overview; Sections 2.2–2.4 below provide with module‐specific details.
Covid‐19 motivated papers in the OM literature.
Abbreviations: ICU, intensive care units; OM, operations management.
Wood et al. (2020) and Gonçalves et al. (2023) straddle both literature in considering both containment measures and ICU (or hospital) capacity. However, they use only what–if analysis rather than optimization in the last stage. Gonçalves et al. (2023) propose a complex compartmental model that captures links between the different quantities (e.g., hospital [or ICU] loading influences the number of infected individuals). However, their model is deterministic and cannot capture the uncertainty in the future demand by simply choosing parameter values randomly chosen from arbitrary ranges. In contrast, for generality of use in future pandemics, we use a parsimonious compartmental epidemic model (SIR) and estimate the parameters for future demand uncertainty and its evolution from the reported infection data to date.
Our work also contributes to the literature specific to each module. We have (a) a robust estimation and forecast procedure for the epidemic model during the early days of a pandemic, (b) the use of a Cox stochastic process rather than, say, a nonhomogeneous Poisson process for the arrival of patients, and (c) a stochastic dynamic programming model for capacity expansion. Below, we discuss each of the three modules.
Epidemic modeling
The epidemiology literature offers several models extending the baseline SIR epidemic model for the spread of infections. These are compartmental and agent‐based models. Compartmental models extend the baseline SIR model by adding more “compartments” depicting the status of individuals at any time: susceptible, exposed, infectious, hospitalized, critical, other–recovered, released, or dead (see, for instance, Mamon, 2020). Agent‐based models simulate the rule‐based interactions of individuals to infer the system's behavior, thus extending compartmental models (Cuevas, 2020; Kerr et al., 2021). Besides agents, compartmental models can be extended with more states. For instance, Bertsimas et al. (2021) present differential equations leads to predictions of hospitalizations and infections, an susceptible‐exposed‐infectious‐removed (SEIR)‐based model with 11 states to include varying states of patient recovery, detection, and quarantine. However, such models require estimating many parameters for which data would be difficult to obtain at the start of a pandemic. We use the stochastic version of the SIR compartmental model that has low data requirements at the onset of a pandemic because it has very few parameters.
Other researchers use time‐dependent parameters to extend compartmental models specific to a country (Calafiore et al., 2020; Y. Chen et al., 2020; Ferrari et al., 2021). Chatterjee et al. (2020) used a time‐dependent infection rate to study the pandemic in India and other countries. A more sophisticated model is adaptive SIR (Shapiro et al., 2021; Shi et al., 2022) with a time‐dependent reproduction number (and hence the infection rate). The daily value is estimated directly from data without assuming any particular functional form. However, this approach allows only short‐term projection for 1 or 2 weeks to manage emergency day‐to‐day operations. This is because the reproduction number is taken as the last estimated value when projecting forward.
We use a parsimonious SIR model with a parametric time‐dependent infection rate. In contrast to the above approaches, we have the flexibility to match past data and the ability to perform robust estimations during the early days of a pandemic when there is very little or noisy data. Like us, Chatterjee et al. (2020) also use a time‐dependent infection rate and Shahmanzari et al. (2022) use a stochastic extension of an epidemic model. However, the novelty of our approach lies in (1) the robust estimation method going beyond the point estimate of model parameters by reconstructing the empirical joint distribution of the estimators and (2) creating scenarios of projected daily infections, incorporating the uncertainty in the estimated parameters in the simulated scenarios of infections. In contrast, the recent Covid‐19‐related literature (Table 1) typically adopts deterministic compartmental epidemiological models, possibly with simulation to vary parameters over an arbitrary range.
Capacity demand modeling
The demand‐focused literate does not adopt a specific model for ICU (or hospital) demand (Table 1). For instance, Ferguson et al. (2020) consider the number of hospitalized cases requiring critical care simply as a fixed percentage of symptomatic patients. In the supply‐focused literature, demand is modeled with compartmental or queuing models. Z. Chen and Kong (2023) and Gonçalves et al. (2023) propose deterministic compartmental models, which include hospitalized and critically ill patients.
Queuing systems are widely used in the healthcare literature to model emergency unit workloads. Prior to Covid‐19, the literature typically used queuing models with a constant arrival rate (McManus et al., 2004; Ridge et al., 1998). More recently, Alban et al. (2020) and Ouyang et al. (2020) also use a constant arrival rate of patients to a fixed ICU capacity. The pandemic also motivated some researchers to make modifications: Lu et al. (2021), Wood et al. (2020), and Shi et al. (2022) assume a deterministic time‐dependent arrival rate linked to the average trend of the epidemic. In particular, Lu et al. (2021) simulate ICU demand for Covid‐19 patients with a deterministic epidemic SEIR (susceptible‐exposed‐infected‐removed) model and discrete event simulation of Covid‐19 patient flow in ICUs. Wood et al. (2020) use a multichannel queuing model to simulate the demand on ICU capacity. Shi et al. (2022) model hospital (and ICU) workload through the Covid pandemic by integrating a deterministic time‐dependent SIR epidemic model with a stochastic network model of patient movement among various units within the hospital.
The wider healthcare literature also uses queuing models with an infinite number of servers (hence, no queuing) to capture the future demand for patients needing a constrained resource like intensive care. Heemskerk et al. (2017, 2022) also propose an infinite‐server queuing system with a mixed Poisson arrival process in a random environment, a special case of a stationary Cox process. Boxma et al. (2019) also analyze an infinite‐server queue system where the arrival rate process is a shot‐noise process.
We contribute by applying a Cox queuing model with a stochastic intensity of arrivals that depends on the observed number of newly infected individuals. Doing so has two advantages. First, we can capture the variability of the arrival process (for the resource in question) due to the random nature of the disease spread, particularly in the early stages. Second, a common drawback in using Cox queuing models is that the intensity of the process is not observable, so estimating the model from data is difficult (Rydén, 1996). In our case, the patient arrival rate (for ICU or some other resource) is proportional to the observable number of daily new cases.
Optimal allocation of capacity
Not all researchers use an optimization module as we do in our three‐pronged approach. Indeed, Ferguson et al. (2020), Alban et al. (2020), Z. Chen and Kong (2023), Gonçalves et al. (2023), Lu et al. (2021), and Wood et al. (2020) do not propose any optimization of capacity or other policy levers. However, Ferguson et al. (2020) perform what–if analyses on nonpharmaceutical interventions (NPIs) on the demand side, while Wood et al. (2020) extend their analyses with different levels of ICU capacity. Lu et al. (2021) study the admission policy of patients concerning their death risk profile, given a fixed level of ICU capacity. Furthermore, Shi et al. (2022) use the projected demand of each hospital in a hospital system for decision models for resource (re)allocation.
In contrast, our work seeks to determine an optimal policy for capacity expansion. Moreover, we do so from the public health perspective for an entire region, similar to Jiang and Sodhi (2019) for NHS England, rather than for a ward or a hospital. We use stochastic dynamic programming with selected classes of control policies, similar to Shahmanzari et al. (2022). Like them, we prove the Pareto efficiency of the optimal policies. Moreover, we can demonstrate other analytical results, such as the existence of the optimal policy, the convexity of the efficient frontier, and strong duality. Our work and Shahmanzari et al. (2022) are complementary in that we analyze a supply‐focused problem to expand capacity with a given (stochastic) level of demand, while they study a demand‐focused one with containment measures to reduce demand with a given ICU capacity. We optimize the ICU capacity, given future epidemic scenarios that could include containment measures.
APPLICATION TO ICU CAPACITY EXPANSION DURING COVID‐19
We now apply our approach to a specific pandemic, Covid‐19, for ICU capacity as the limited resource in the Italian setting of 2020. Italy had the highest reported per capita death rate globally at the end of 2020, with Lombardia, Piemonte, and Veneto regions being the worst hit (each region being responsible for its public health). One reason for the high death toll in Italy (and other countries) was inadequate ICU capacity.
Expanding the capacity of such a resource is both costly and time critical. ICU costs already constitute a large portion of total hospital costs, accounting for 8–30% of the entire hospital budget (Kilic et al., 2019). The direct daily cost of a single ICU in Germany, Italy, the Netherlands, and the United Kingdom ranges from €1168 to €2025, with labor being the main cost (Tan et al., 2012). The cost was even higher during the pandemic—as much as 20% more for Covid‐19 patients—due to comorbidity and the need for more ICU staff per patient.
We obtained region‐specific daily data concerning infected, dead, recovered, and hospitalized people published on the official Italian Government site
1
from February 24 to December 31, 2020, for the three regions. Our focus is the onset of the two waves of Covid in 2020, so the decision horizons in our application span (1) March 10 to the end of May 2020 for the first wave and (2) October end to December end for the second. We then carried out the following steps for the first wave:
Stochastic epidemic modeling: First, we estimated the SIR model using the official data on the daily infected people available for the 2 weeks from February 24 to March 10, 2020, for the first wave. Then, we generated 10,000 scenarios of daily new infections for the decision horizon from March 10, 2020, onwards for 90 days to the end of May.
Capacity demand: Next, we translated infections into demand for ICU capacity. We estimated and simulated a queuing system with a stochastic arrival rate proportional to the epidemic process. We estimated the queuing model using official data of daily admissions in the ICU of Covid‐19 patients for the same 2‐week period from February 24 to March 10, 2020, relying on clinical estimates of the average length of stay (ALOS) of a Covid patient in the ICU. We then simulated the ICU demand from March 10 onwards for 90 days using the demand scenarios from the previous step.
Optimal allocation of capacity: Finally, we used our proposed optimization procedure to find the optimal capacity expansion policy regarding when and how much to expand to minimize the expected number of patients denied ICU. The principal optimization problem minimizes the cumulative expected number of patients denied ICU in the remainder of the 90‐day decision horizon at any time, given the budget constraint on total investment for this period. The optimal policy provides the optimal number of new beds and its timing by way of the critical ICU load to trigger the capacity expansion.
We followed the same procedure for the second wave. By then, Veneto had already acquired more‐than‐adequate ICU capacity. Therefore, we have omitted the results for the second wave for this region. Next, we describe the application of each successive module of our approach in Sections 4, 5, and 6.1, respectively.
MODULE 1: STOCHASTIC EPIDEMIC MODELING
This section details our stochastic SIR model and the robust estimation and projection procedure for infection scenarios.
The epidemic model
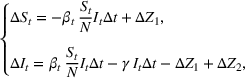
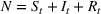
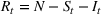
The SIR model is a compartmental model with the population divided into susceptible, infected, and removed groups, the last one including both recovered and deceased people. Recovered people are assumed to become immune till the decision horizon.
The stochastic epidemic SIR model. Let 


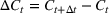

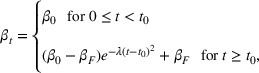
The rate parameters. The rate of removal γ is the sum of the recovery and death rates and is biological in that it is virus‐specific. The literature assumes γ is constant over time, at least within a single wave of a pandemic, although it does change slowly due to virus mutation and vaccination. In contrast, 

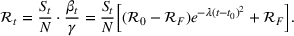
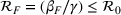
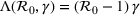
Basic and effective reproduction numbers. The reproduction number determines the progress of the epidemic, and it can be either basic or effective (Chowell et al., 2007). The basic reproduction number, 


Model estimation and scenario generation
Epidemic data have two sources of uncertainty, generally ignored in the literature, regarding the new cases each day: (1) the reporting error, such as delays in official registrations of daily cases, and (2) the disease dynamics that are inherently stochastic because recovery time and time to get infected are random variables. We incorporate the uncertainty by using the (joint) probability distribution of the parameter estimators to perform a Monte Carlo sensitivity analysis (Gonçalves et al., 2023) of the parameter values, as described below. We can produce longer‐term forecasts that are also more robust against reporting errors in the data. Doing so is particularly useful at the beginning of a pandemic, when there is not much data and that too is noisy, in part, due to reporting errors.
Parameter estimation. During the early days of an epidemic, the effects of the depletion of the susceptible population are small, and we can assume exponential growth for most infectious diseases (Anderson & May, 1991). Consequently, the number of new cases per unit of time 


Interval estimation of the parameters is important as the precision of the estimates. For this reason, we adopt a robust procedure producing an interval estimation of the parameters by reconstructing the (empirical) joint probability distribution of the estimators 


In estimating R
0 and γ jointly, we improve upon the typical practice for estimating compartmental models (Chowell et al., 2007; Favier et al., 2020; Shapiro et al., 2021; Shi et al., 2022). Typically, the value of removal rate γ in the SIR model (or the latent period in the SEIR model) is fixed to a value chosen using clinical observations, and the estimation (and bootstrap) procedure focuses only on the reproduction number. However, the estimators of parameters 


Forecasting the epidemic curve. We use these bootstrap estimates of 


Generating future scenarios. We perform the following steps to simulate the future numbers of daily cases 


We include both sources of variability in the simulation of future daily cases with this procedure. A Monte Carlo sensitivity analysis captures simultaneous changes in epidemic parameters. While Gonçalves et al. (2023) use a similar procedure, they randomly select all the parameter values from uniform independent distributions over arbitrary ranges. Moreover, they do not consider dependency between the parameter estimators. Instead, we capture the realistic uncertainty in future epidemic scenarios from the reported data.
The first Covid‐19 wave
We first calibrated the SIR epidemic model using 2020 data only from February 24 to March 10 with maximum likelihood to estimate 
Table 2 presents the estimated parameters of SIR model 


Calibrated parameters values 


Top: The bootstrap joint distribution of the estimator of parameters

We set the start date to be March 10, 2020, when the prime minister (decree of the President of the Council of Ministers) decreed several containment measures. Next, we had to assume a plausible range of values for the asymptotic value 


The second Covid‐19 wave
We recalibrated the SIR parameters for the second wave using data from October 7 to 30, 2020. The 60‐day decision horizon takes us to December end. As before, we took the reproduction number 


The table shows calibrated parameter values 

Abbreviation: CI, confidence interval.
We simulated the asymptotic value 


MODULE 2: CAPACITY LOADING
We now detail our 

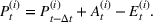
Creating scenarios for load on ICU. We simulated the queue to forecast its length, that is, the number of patients in ICU 


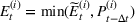

Estimating and forecasting the ICU demand model
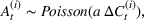
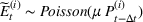
For each region, we fitted the ICU demand model using historical data of daily cases and ICU patients from February 24 to March 10 for the first wave and from October 7 to 30 for the second wave. We estimated the fraction a of the newly infected Covid patients needing ICU using a maximum likelihood procedure. The daily number of arrivals in ICU, 

The first Covid‐19 wave
The results are given in Table 4. The average fraction of newly infected individuals who need intensive care a in Equation (4), ranged from 4% to 10% (see Table 4). Note that this is the fraction of the reported new cases which underestimates the actual ones. Indeed, the estimated ratio between the actual and official number of total cases for Covid‐19 typically ranges from 4× to 10× in the literature (McCulloh et al., 2020; Shi et al., 2022), depending on the country and the stage of the pandemic. Thus, our method for estimating a compensates for the underestimation in official data, ultimately giving the correct projections for the demand for ICU.
Estimated average fraction of new cases that need intensive care, a (Equation 4), using data from February 24 to March 10, 2020.
Abbreviation: CI, confidence interval.
Regarding the ALOS in ICU, no data were available at the beginning of the pandemic on ALOS for Covid‐19 patients in ICU. We simply chose ALOS = 12 days, doubling the 6 days in ICU in pre‐Covid‐19 times in Italy (Agodi et al., 2018). Figure 3 compares the forecasting scenarios with the out‐of‐sample data of the ICU workload. We see that the actual progression of ICU load in the out‐of‐sample period for Lombardia and Piemonte falls within the forecast confidence intervals.

Historical ICU workload from February 24 until March 10 (blue) and later (cyan). The solid black line is the mean forecast demand, and the dashed black lines represent the 95% confidence interval around the mean. ICU demand is per 100,000 people for all three regions. ICU ALOS


For the first wave in Veneto, we performed a sensitivity analysis on the value of the reproduction number half‐life 

The second Covid‐19 wave
We estimated the ICU demand for each region from October 7 to 30, 2020. The results of our analysis reflect the different behavior of the two pandemic waves. For instance, estimated values of the proportion a of Covid patients needing ICU are much smaller than in the first wave (Table 5). Contact tracing was more effective, and even asymptomatic and paucisymptomatic patients were detected. Moreover, improvements in treating Covid‐19 reduced the fraction of critically ill patients.
Estimated average fraction a (Equation 4) of new cases that need ICU, using data from 7 to 30 October 2020.
Abbreviation: CI, confidence interval.
Unlike in the first wave, clinical information was already available on Covid‐19 patients by the beginning of October 2020. ALOS for Covid‐19 patients in ICU estimated from clinical observations had a wide range of values in the literature of that time. We chose ALOS = 20 days (Lapidus et al., 2020) 2 for the ICU workloads in Figure 4.

Historical ICU workload from October 7 to October 30, 2020 (blue) and later (cyan). The black line is the mean forecast demand after October 30, while the dashed lines are the 95% confidence interval around the mean. ICU demand is per 100,000 inhabitants for both regions. Half‐life value of the reproduction number
MODULE 3: OPTIMAL CAPACITY ALLOCATION
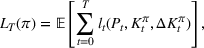
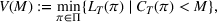
Our ICU capacity management model seeks to help decision‐makers achieve the best trade‐off between the cost of expanding ICU capacity and the number of patients denied admission to ICU due to inadequate capacity. We take these two quantities as the decision‐makers' ICU capacity policy π, selected from a set of feasible policies Π in Section 6.2.
Let 


The number of patients denied ICU access. The immediate loss 


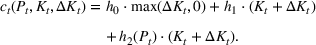
The expected cost of capacity expansion. The decision‐maker has to consider the costs. Each intensive (or subintensive) therapy unit is subject to setup and maintenance costs. Let the unit setup cost be h
0, the unit maintenance cost be h
1, and the extra cost for a patient due to medicine, hospital staff, etc. be h
2. The total daily cost 


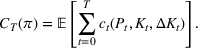
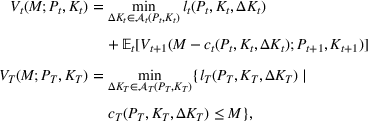
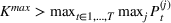
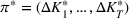
The capacity expansion optimization
We can now specify the optimization problem with a parameterized investment budget M.
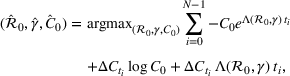
Efficient frontier. We minimize The number of beds 


Assumption 1 is not a serious limitation in numerical applications. In fact, Given Assumption 1, there exists an optimal policy for 

For proof, apply the Weierstrass theorem to each step 


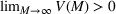
Next, we present an analytical result on the efficient frontier, which will be useful for the definition of the optimal investment level The set of feasible policy Π is convex.
Assumption 2 is satisfied both in the general case and in the case of irreversible expansion (see Section 6.2). In the general case, Π is the set of all the policies π such that the number of beds Given Assumptions 1 and 2, the efficient frontier 


The objective function 


The dual problem. The dual of the optimization problem in Equation (10) is Assume that 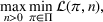


We can now assert Given Assumptions 2 and 3, strong duality holds for the primal problem in (10) and the dual problem in (12).
Proposition 3 holds given that the primal problem in 10 is convex; for proof, see Boyd and Vandenberghe (2004, Chapter 5).
Shadow price. Solving the dual problem in (12), we obtain the optimal value of the Lagrange multiplier 
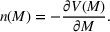


The optimal investment level 


Pareto efficiency of the optimal policy. Our capacity management model trades the number of patients denied access and the total expected cost. We could alternatively express our model as a multiobjective minimization problem to minimize both the number of patients denied ICU and the ICU total cost over a set of feasible policies. The optimization problem in Equation (10) is reconstructed, applying the ε‐constrained method to the multiobjective optimization problem. Then, the optimal policy If there exist two values 


For proof, see Ehrgott (2005, Section 4.1). In our numerical application, we verified the efficiency of our solutions solving both optimization problems (10) and (15).
Marginal cost of a single patient for ICU. We now consider the dual optimization problem of (15), that is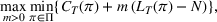


Capacity expansion policy
The two quantities of interest—the cost 


In an extreme case, the decision‐makers could adopt an emergency policy of expanding the resource capacity incrementally every day with updated infection information. However, we avoided such a daily (and possibly reactive) emergency expansion because of the lead times entailed for ICU expansion. Instead, we seek to plan ICU capacity expansion using a medium‐term perspective, in this instance, of a few weeks rather than a few hours. Such an expansion is typical in healthcare: structural changes, such as creating new hospital wards, need to be planned and are rarely reversible. Indeed, dismantling the medical equipment of ICUs leads to a minimal recovery of the invested resources. As such, our model anticipates a quantum and irreversible expansion (at least in the near term) of ICU capacity during the decision horizon at the start of a pandemic.
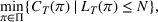
Such an expansion puts restrictions on the set of feasible policies Π. In particular, we choose the set Π, such that a policy π is admissible if the actions 
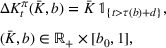


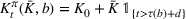
Percentage occupation as the trigger for capacity expansion. As soon as a predetermined fraction b of the initially available ICU beds (or other critical resource) is occupied, the decision‐maker decides whether or not to make an additional 

Application to the two waves of Covid‐19
Starting with the 100,000 scenarios for ICU demand described in the previous section on ICU workload, we performed a grid search to determine the optimal expansion policy, depending on the decision variables b and 


Costs. The cost parameters are the same for all three regions. The fixed cost of setting up each new ICU bed is 


The first Covid‐19 wave
Efficient frontier. Figure 5 shows the efficient frontiers obtained for the three regions using the ICU load scenarios developed earlier and obtained by solving Equation (10). The three efficient frontiers are convex and decreasing as proved in Proposition 2. Lombardia and Piemonte are quite different from Veneto in needing a larger ICU capacity expansion. The number of expected patients denied ICU access corresponding to the minimum investment 


Efficient frontier: The minimum achievable expected number of patients denied ICU as a function of the investment budget


Timing the decision to expand. Another important aspect of the proposed capacity optimization model is the “timing” of the optimal expansion strategy. The optimal decision time τ represents the time until which the decision maker can postpone action, reducing costs without affecting the expected number of denied patients. In our application, τ is determined by the critical loading level 


Efficient frontier: The minimum achievable expected number of patients denied ICU as a function of the investment budget

Shadow price of budget increase. Figure 7 reflects the solution of the problem in Equation (12) with the number of additional admitted patients for a given unit increase of the budget, 


The optimal investment level 


Shadow price: the increase in the number of admitted patients given a unit increase of budget

Contrasting our approach with a deterministic model. Table 6 compares the optimal investment and the optimal expansion policy obtained with our model to that obtained from a deterministic model with a unique demand scenario equal to the mean value of 


Sensitivity to a tolerated level of denial of access. Figure 8 shows the marginal cost per admitted patient in ICU 


The marginal cost for admitted patients as a function of the tolerated loss

The second Covid‐19 wave
After the first wave, Veneto expanded the number of ICU beds from 10.1 beds per 100,000 inhabitants to 16.8. Consequently, the region did not need to expand ICU capacity at the start of the second pandemic wave, as we also saw recommended by our models. The expansion carried out by Veneto was much larger than that suggested by our model (6.7 new beds instead of 2.2), incurring in additional and perhaps unnecessary costs. Lombardia increased the number of ICU beds from 8.6 per 100,000 inhabitants in February 2020 by 1.3 beds to 9.9 beds at the beginning of October 2020. During the first pandemic wave, the region reached a maximum of 14 ICU patients per 100,000 inhabitants by using temporary ICUs carved out of operating theatres, inpatient posts, or even military field hospitals. These beds were dismantled by the end of the first wave, leading to a shortfall of ICU capacity again in the second wave. Our model suggested a structural expansion of 6.5 new beds per 100,000 inhabitants, larger than the actual one of 1.3 (Table 6). Similar reasoning can also be applied to Piemonte. Before the second wave, Piemonte expanded the structural ICU capacity from 7.4 by 1.0 beds to 8.4 ICU beds per 100,000 inhabitants. Our model suggested 4.5 new beds per 100,000 inhabitants would have been ideal (Table 6). Figure 9 shows the efficient frontiers from Equation (10) for Lombardia and Piemonte regions, respectively, given the projected demand scenarios explained in the previous section. The two efficient frontiers are convex and decreasing (Proposition 2). The resource level ranges from €52 million–66 million for Lombardia and from €20 million–60 million for Piemonte. The minimum expected cost M 0, necessary to maintain the initial number of intensive care beds without any expansion, depends on the daily numbers of occupied ICU beds through the marginal cost h 2, as in Equation (9). The average value of M 0 is €52 million for Lombardia and €24 million for Piemonte.

Efficient frontier: The minimum achievable expected number of patients denied ICU as a function of the investment budget

Figure 10 shows the number of admitted patients for a unit increase of budget obtained by solving the dual problem in Equation (12). Table 7 shows the optimal investment level 

The optimal investment level 


Shadow price: the increase in the number of admitted patients given a unit increase of budget

DISCUSSION
This paper has introduced a general modular approach for capacity expansion under uncertainty in the early stages of a pandemic to meet the expected demand for the resources in the coming weeks. We used the approach—in retrospect—to three regions in Italy for the two waves of the pandemic between February 2020 to January 2021. The application illustrated the inputs and techniques needed and the output obtained for decision‐makers. In the Covid‐19‐related operations management literature, the emphasis is typically on the uncertainty of future demand. However, modeling this uncertainty is not straightforward during the early stage of a pandemic. There are a number of challenges at this stage: (1) noisy data from which to estimate parameters, (2) incorporating uncertainty in an optimization framework, and (3) the impact of uncertainty on optimal management decisions. Our work contributes by addressing these challenges. First, we proposed a robust estimation and forecasting procedure of epidemic and demand models, including both the variability due to noisy and limited data (through Monte Carlo sensitivity analysis of the epidemic parameters) and the inherently stochastic dynamics of epidemic and demand processes. Second, we formalized a stochastic dynamic optimization problem that incorporates the uncertainty into the management decision process. Finally, we showed that the uncertainty of future scenarios has a material impact on the optimal results. For instance in the first pandemic wave, for the three Italian regions, we compare the optimal ICU expansion policies obtained with the full model to a deterministic model that considers only the average future demand scenario. We conclude from the large differences that the model error is not negligible and, therefore, having a stochastic extension of the model is valuable.
Research implications
Managing health emergencies such as the recent Covid‐19 epidemic requires both supply and demand responses. This paper is focused on the supply side, providing an approach to capacity expansion of scarce resources like ICUs in the early stages of a pandemic. Further research may extend this approach to optimally manage the policy levers—the use of lockdown, isolation, quarantine, and vaccination—on the demand side. Note that our optimal solution is a policy, not a single‐number solution. The expansion is contingent on the filling up of capacity, so if demand‐side responses “flatten” the rise in the number of daily cases, the capacity expansion would be delayed as the threshold for expansion would not be met. On the demand side, assessing how delays in imposing restrictions impact the availability and the cost of ICU capacity is possible by integrating our model with what–if analyses (see, for instance, Ferguson et al., 2020) or with compatible optimization problems (see Shahmanzari et al., 2022). In particular, integrating demand and supply sides in a unique optimization framework present interesting theoretical and computational challenges. Moreover, new variants of Covid‐19 emerged even as vaccination drives are underway in many countries, including Italy. There is a need to investigate how to modify the stochastic epidemic model to incorporate vaccination drives with different (and possibly deteriorating) efficacy and new variants. The overall modular approach would still be helpful. Another policy lever is allocating the scarce ICU capacity to needy patients, which requires straightforward prioritization rules for uniform implementation across all hospitals in the region. Extending our approach to that of Lu et al. (2021) can lead to a more comprehensive discussion of the supply side levers, including prioritization of access. Finally, future research could investigate the long‐term consequences of the steep decline in ICU admissions of uninfected patients during the pandemic. For instance, researchers could analyze mortality data of oncological or cardiopathy patients.
Implications for practice
During a public health emergency response, leaders must make several critical decisions in a rapidly changing environment with limited data. We have shown that even with imperfect data from only the first few days of a pandemic, along with known cost and setup time parameters for expanding resources, our method can provide an efficient frontier of investment needed to limit the denial of beds to patients. Decision‐makers can then decide the acceptable trade‐off between investment in additional resources and patients denied care. Moreover, our model requires only a small number of variables. Therefore, decision‐makers can use our approach to capture the effect of the uncertainty in projecting future demand during the early days of a pandemic. How the high uncertainty in the future spread of infections is modeled is crucial, and our approach provides much more insight than a simplistic what–if analysis on a deterministic model with arbitrary parameter ranges. Additionally, decision‐makers would also make decisions at the right time. Our approach captures the nontrivial relationships between the setup time for capacity expansion and the optimal intervention time just as it does between the setup time and the expected number of patients who might be denied access to life‐critical resources. Regarding timing, while an early decision on capacity expansion intuitively denies ICU access to fewer patients, our model also shows when delays in expansion can be accepted without affecting the expected number of admitted patients. This is particularly useful as the passage of time provides better information to the decision‐maker. Finally, our approach suggests that in future pandemics the chaotic decision‐making observed during the initial days of successive waves of Covid‐19 can be replaced by rational decision‐making with model‐based information that our approach provides.
Footnotes
ACKNOWLEDGMENTS
The authors gratefully thank the Department Editor, Sushil Gupta, the anonymous senior editor, and two anonymous reviewers for their support and invaluable suggestions that went a long way in shaping this paper.
1
PCM‐DPC‐Covid‐19 data (
2
Rees et al. (![]() ), with their review of eight articles, report ALOS between 5 and 19 days. Lapidus et al. (2020) use a statistical procedure considering patients still in ICU on the date of estimation and with calculations based solely on the patients already discharged. They report ALOS of 23 days (18–30 days, with 95% confidence), much larger than earlier (biased) estimates (Rees et al., 2020).
), with their review of eight articles, report ALOS between 5 and 19 days. Lapidus et al. (2020) use a statistical procedure considering patients still in ICU on the date of estimation and with calculations based solely on the patients already discharged. They report ALOS of 23 days (18–30 days, with 95% confidence), much larger than earlier (biased) estimates (Rees et al., 2020).
3