
Abstract
A renewable energy site can expand its power generation capacity by an endogenous amount but may also want to shut down to save on fixed operating costs and interest payments if the market prospects deteriorate. We model such circumstances and derive managerial implications that help us explain real‐world conundrums, illustrating the intricate interactions between the operational decision to build up capacity and the financial decision to exit an industry. Shutting down may be delayed in the hope of expanding capacity upon recovery; an expansion may also be delayed in the presence of a valuable exit option. Numerical extensions provide further managerial insights. In particular, the presence of fixed or proportional financing costs may lead the firm to delay its expansion decision, but the scale of investment will only be affected by proportional costs. If herding behavior causes equipment prices to increase (respectively, decrease) when electricity prices are high (respectively, low), managers should invest earlier (respectively, later) and more (respectively, less) while equipment prices are low (respectively, high). Furthermore, although volume swings (due to capacity decommissionings and expansions) are marked in a homogeneous industry (when the default and expansion thresholds are reached), heterogeneity in the population of wind farms smooths out such effects.
INTRODUCTION
Because renewable (wind and solar) energy generation emits virtually no greenhouse gases, states often encourage private investment in these technologies. The free access to these energy sources, coupled with state‐led stimulus programs (e.g., in the form of a tax credit in the United States or feed‐in tariffs in Germany), have made the economics of renewable energy generation an attractive proposition. Renewable energy capacity has been on the rise for several decades and is expected to increase further. In the 2010s, nearly $2.7 trillion was invested in renewable energy globally (including $1.4 trillion in solar and $1.1 trillion in wind)—principally by China, the United States, Japan, Germany, and the United Kingdom— accounting for 13.4% of global power generation as of 2019 (UNEP, 2020). To reach the targets set by 87 governments around the world, an additional 721 gigawatts (GW) of renewable energy capacity is needed by 2030, including 460 GW in solar photovoltaic energy (“solar PV”) and 223 GW in wind (UNEP, 2020). Moreover, to appeal to environmentally friendly customers, investors, and potential recruits, an increasing number of corporations (including Apple, Facebook, and Microsoft) have pledged to source 100% of their power from renewables by 2030 (the “RE100 initiative”)—leading to an additional construction need of 105 GW. Taken together, these commitments by governments and corporations (826GW in total) will not suffice to curb the rise in global temperatures to “well below 2°C,” as targeted by nearly 200 states under the Paris agreement (UNEP, 2020, p. 12). Further investments are required. The Glasgow Financial Alliance for Net Zero, representing $130 billion in assets under management, has recently pledged to contribute to a shift from fossil fuels to clean energy sources (see The Economist, 2021).
The overarching research question in this paper is how project finance (which permits a default if the economics of a site deteriorate) plays a role in encouraging or discouraging renewables investment, a key question for the literature at the interface of finance, operations, and risk management (“iFORM”). In 2019, although 65% of renewables investment was financed “on balance sheet” by utilities, energy companies, and developers, 35% was funded via “project finance” (see UNEP, 2020, p. 35), a share that is likely to increase. Project finance helps fund the development and operations of a set of assets on a nonrecourse basis via special purpose vehicles (SPVs). The SPV owns all the affiliated rights, assets, and liabilities, while most of the financing is provided for by bank loans, with debt‐to‐capital ratios that can exceed 85% (Raikar & Adamson, 2020, p. 23). In the renewables market, the largest project finance deal to date is the $4.3 billion “Al Maktoum IV complex” in Dubai. The deal, which closed in March 2019 (for 700 MW in solar thermal power and 250 MW in solar PV), is 60% financed via debt (see UNEP, 2020, p. 46). When a bank funds a project under a project finance arrangement, it cannot make claims against the “sponsor” (or the SPV's shareholders); its recourse is limited to the SPV's assets. In other words, project finance effectively allows the sponsor to renege on the SPV's obligations if the economics of a particular site deteriorate. Because of long and costly development processes (including site identification, land acquisition, permit application, project design, connection to the power grid), which can exceed 10 years (Raikar & Adamson, 2020, p. 59), and the “not‐in‐my‐backyard” reluctance of neighboring communities, it is often easier for a sponsor to retrofit or redeploy an existing site than start a project from scratch. The fixed costs of financing and operating a wind farm contribute to the credit risk borne by the SPV and the overall attractiveness of the redeployment project. We contribute to the extant literature by treating credit risk endogenously: we consider the sponsor's propensity to renege on the SPV's obligations and study how this (endogenous) credit risk affects the sponsor's operational decision to expand capacity.
This paper models the situation faced by the sponsor of a renewable energy project (e.g., Equinor, Iberdrola, Ørsted, or Enel Green Power). The SPV incurs various fixed running costs (e.g., debt servicing, maintenance, property tax). The sponsor can decide to expand power generation capacity at a time and by a size of its choice (if the SPV's revenues attain a sufficiently large level) or let the SPV die to save on fixed running costs (should the revenues fall significantly). The bankruptcy of Suntech Power, a large solar panel manufacturer, is a reminder that the renewable energy sector is not safe from adverse developments. Using the terminology of real options (see Dixit & Pindyck, 1994; Trigeorgis, 1996, for an overview), the decision to expand capacity (respectively, let the SPV die) is akin to exercising an expansion (respectively, exit) option. The options here are nonstandard because (a) the sequence of decisions is not set ex ante, but is at the discretion of the decision‐maker (see, also, Kwon, 2010) and also because (b) the sponsor decides on the investment time and the capacity investment amount (see Bensoussan & Chevalier‐Roignant, 2018; Bensoussan et al., 2021; Dangl, 1999). This leads to interesting interactions between the operational and financial decisions because the SPV's initial, endogenous credit risk (which is linked to the sponsor's decision to stop covering the SPV's losses) depends on the potential future benefits for the sponsor from expanding capacity, which itself depends on the degree of credit risk borne by the SPV following the investment.
The stylized model developed in this paper is designed to address the following research questions (RQs). (A) What is the SPV's credit risk arising from its sponsor's financial decision to stop covering the SPV's losses? (B) How does such endogenous credit risk affect the sponsor's operational decision to expand capacity? (C) How do the future likely benefits from the capacity expansion affect the sponsor's initial credit risk? (D) How does the possibility of financing the capacity expansion by raising new funds affect the sponsor's expansion decision and its initial credit risk? (E) In an industry context, does cost heterogeneity in a population of wind farms help reduce the observed volume swings and how do herding behaviors (which affect equipment prices) influence a wind farm's operational and financial decisions?
While addressing these research questions, we obtain novel managerial insights that explain real‐world conundrums. To address RQ A, we model the sponsor's decision to stop covering the SPV's losses as an optimal stopping problem and determine a cutoff electricity price below which the sponsor will declare bankruptcy. Default is less likely if the SPV is less exposed to merchant risk and if its current generation capacity is larger. We study RQ B and establish that, if the credit risk is limited, for example, because the SPV secures large revenues from a power purchase agreement (PPA), the sponsor will invest if the electricity price exceeds another cutoff level that is increasing in the current capacity. Interestingly, if the SPV faces significant merchant price risk and is hence less exposed to credit risk, the cutoff level turns out to be nonmonotonic: for low initial capacity, the sponsor may agree to finance a capacity expansion to circumvent the SPV's default, while for large initial capacity, credit risk has a less significant effect on the sponsor's operational decision to expand. If the financial prospects remain gloomy despite the possibility of circumventing bankruptcy via a capacity expansion, the sponsor will stop covering the SPV's losses. Furthermore, a greater initial capacity leads to a delay in capacity expansion but has a lesser impact on the SPV's credit risk. A delay and an increase in the scale of redeployment may be caused by higher fixed costs, a stronger price buildup, or a more volatile environment. As part of our investigation of RQ C, we show that the option to expand capacity is valuable, so the sponsor will be more patient before liquidating the SPV if its revenues are less secured.
We build on the base model to address our other research questions and derive new insights numerically. In particular, we explore the effect of financial constraints on the sponsor's decisions (RQ D) and find that additional financing costs tend to delay the expansion decision, but that they only affect the investment scale if the costs are proportional. While we began by considering a wind farm in isolation, we expand our analysis by considering it as part of an industry (RQ E). We capture herding behavior, when greater equipment demand leads to inflated prices, by embedding a stochastic dependency between the equipment cost and the electricity price and observe that, to circumvent herding and preempt inflated equipment prices, the sponsor may expand earlier and is less likely to default since downturns offer investment opportunities. Finally, we study how cost heterogeneity in a population of wind farms reduces the volume swings observed when farms are decommissioned or expanded.
LITERATURE REVIEW
Our project contributes to the rapidly developing field of research at the interface of finance, operations, and risk management (“iFORM”) in the operations management literature, which was initially developed to challenge the assumed classical separation between operational and financial decisions in the finance literature (see, e.g., Babich & Kouvelis, 2018; Birge, 2015; Birge et al., 2007; Seshadri & Subrahmanyam, 2005; Wang et al., 2021). Among numerous topics, the iFORM literature explores how the trading of various financial securities by firms (including the issuance of corporate debt and the associated exposure to financial distress) affects their decisions to build up inventory (e.g., Alan & Gaur, 2018; Gaur & Seshadri, 2005; Iancu et al., 2017; Li et al., 2013) or to invest in production capacities (e.g., Boyabatlı & Toktay, 2011; Chod & Zhou, 2014; Gaur et al., 2011; de Véricourt & Gromb, 2018). We explore such interactions between the financial decision to let the SPV default and the operational decision to expand capacity in the energy context, drawing on notions from real options analysis (ROA) (see, e.g., Dixit & Pindyck, 1994; Trigeorgis, 1996).
There is a long tradition in the operations management literature of studying a firm's operational decisions about its capacity, which leverages—often explicitly—notions from ROA. Such capacity‐choice situations have been cast as multistage stochastic programs (e.g., Birge, 2000; Chevalier‐Roignant et al., 2019; Kouvelis & Tian, 2014; Miller & Park, 2005; Sting & Huchzermeier, 2014; Trivella et al., 2021; Van Mieghem, 2003), as classical optimal stopping problems involving a fixed capacity increment (e.g., Gollier et al., 2005; T. Wang et al., 2019), or as problems of continuous (e.g., Davis et al., 1987) or impulse control (e.g., Bensoussan & Chevalier‐Roignant, 2018). Some papers have adjusted these techniques to account for the idiosyncrasies of the energy sector (e.g., Brennan & Schwartz, 1985; Erlenkotter et al., 1989; Gollier et al., 2005; Lai et al., 2010; Nadarajah et al., 2015; Secomandi, 2010a, 2010b; Secomandi & Wang, 2012; Smith & McCardle, 1999; Trivella et al., 2021). Within this literature, our model is closest to the optimal stopping problems formulated by Dangl (1999), Bensoussan and Chevalier‐Roignant (2013), and Chronopoulos et al. (2017), which allow for a decision about capacity size at the time of investment. Conversely, our overarching research question is about the interactions between the firm's operational decision to expand capacity and its sensitivity to financial distress induced by the level of fixed costs (including debt servicing), the latter aspect being omitted by design in the aforementioned papers.
In contrast to the extant iFORM literature (see Wang et al., 2021, Section 6.6), we consider the output price to be a primary source of uncertainty and endogenize the credit risk by considering, in a multiperiod model, the shareholders' incentive to stop covering project losses in the spirit of Leland (1994) (RQ A). Our setup thus shares similarities with Kwon's (2010) model, which considers that the investor may exit the industry before or after an investment. However, we go further in that we determine the circumstances under which, given such ex post financial distress, a firm should expand production capacity and the scale of this investment (RQ B) and assess how the ex ante credit risk is reduced by this upside potential (RQ C). We also consider the possibility of raising new funds to finance the expansion (RQ D) and study the effect of cost heterogeneity and herding behaviors in an industry context (RQ E). (Another difference is that Kwon's paper considers profit, following an arithmetic Brownian motion, as a driver of uncertainty, while our driver is a commodity price that follows geometric Brownian motion as per the empirical evidence in the energy sector (see Pindyck, 1999; Schwartz & Smith, 2000).
The possibility in the energy sector of suspending production to respond to changes in energy prices or governmental policy and the incentives of producers to turn to renewable energy are known to be underresearched topics in the iFORM literature (see Wang et al., 2021, Section 4.4.2). Our model helps us derive novel insights in line with the stylized features of this sector.
RENEWABLES FARM ECONOMICS
As the equityholder of an SPV owning a renewable energy site (e.g., the Al Maktoum IV complex), the sponsor (e.g., a renewable energy developer, private equity firm, utility) is the residual claimant of the SPV's profit and faces the highest risk exposure. We review below the main components that affect the sponsor's profit (and ultimately its operational and financing decisions). Our goal is to design a stylized model that can be studied analytically and to provide numerical extensions to address our research questions.
Output
Consider a wind farm project with the specifications of Lazard (2020, p. 14). Given


Offtake strategies and power prices
Changes to power prices may be a source of risk. The exposure to price uncertainty is determined by the offtake strategy chosen by the SPV: Power purchase agreements. The SPV can sign a long‐term contract with an “offtaker” who will be required to purchase the output at a set price. Because the SPV is then exposed to counterparty risk, the offtaker is generally an investment‐grade company (Raikar & Adamson, 2020, p. 56). Offtakers were traditionally utilities, but are increasingly corporate buyers. For instance, in 2019, Google, Facebook, and Amazon signed PPAs covering 2.7, 1.1, and 0.9 GW, respectively (UNEP, 2020, p. 37). The power price in these contracts can be fixed or indexed, for example, to inflation. Spot market and merchant risk. If the SPV has not covered all of its output in a PPA, it will sell power in the open spot market. Merchant deals accounted for 1.3 GW of solar power in 2019 and are expected to become more common (see UNEP, 2020, p. 38). In such cases, the clearing price is typically set at the highest bid to generate the power that is necessary to match supply and demand (“merchant price”). As supply and demand change frequently, the merchant price is volatile, even within a single day. In the short run, power prices exhibit mean reversion (Schwartz & Smith, 2000; Smith & McCardle, 1999), but in the longer run, they vary with other factors, such as natural gas prices in markets relying on combined cycle gas turbine (CCGT) capacity. Geometric Brownian motion (GBM) is an appropriate model for equilibrium power prices in the longer term (Pindyck, 1999; Schwartz & Smith, 2000): Residual merchant risk. A farm may have a PPA, yet face significant residual merchant risk if the offtaker buys solely over specific periods, for example, during the day (leaving some output, e.g., during the night, exposed to merchant risk), if the term of the (e.g., corporate) PPA contract is shorter that the farm's useful life, or if the farm cannot find a financial institution willing to agree to over‐the‐counter derivatives contracts with long‐term maturities (over 10 years). Consider first an offtake strategy whereby 50% of the power generation is sold via a PPA. By definition, a farm will break even at the levelized cost of electricity (LCOE). We therefore set the fixed PPA price at the LCOE for a wind farm, namely $54/MWh (Lazard, 2020, p. 14). If 50% of the power generated is sold via a PPA agreement, the PPA revenues will be


Project margin
Project revenues are assessed by multiplying net generation from the project (at a given p‐value) by the power price (e.g., from the PPA). If variable inputs are optimized in the short term, we can include the result of this optimization via an exponent


Fixed expenses (excluding debt servicing)
The expenses necessary to keep the project operational are generally fixed: turbine operations and maintenance (O&M), balance‐of‐plant O&M, land leases, property tax, O&M for communication and transmission equipment, regulatory and professional fees, etc. (Raikar & Adamson, 2020, p. 35). We assume fixed O&M costs of

Debt servicing
Subtracting all the above expenses from the project revenues yields the “cashflows available for debt service.” At the outset, the SPV raises equity or debt to finance the engineering, procurement, and construction (EPC) costs for the wind farm. When an SPV is financed via bank loans (or via bonds, which is less common), the interest rate is generally floating, for example, LIBOR + 250 bps (Raikar & Adamson, 2020, p. 37). Furthermore, debt securities may differ by stage (construction vs. term loans), collateral, or seniority (Raikar & Adamson, 2020, p. 38). Because outstanding loan agreements are difficult to renegotiate, such interest commitments increase the SPV's financial burden and make it more likely that the sponsor will shut down the SPV. Merchant deals are more exposed to risk (and hence less attractive to risk‐averse banks). Consequently, merchant deals are often financed “on‐balance sheet,” as is still commonplace in the EU (Raikar & Adamson, 2020, p. 155). We consider two representative cases for the industry: Fifty percent of the power generation is sold via a PPA, and 60% of the project is financed via a (single, consol‐type) debt instrument, at a yearly (continuously compounded) interest rate of 8.0% (Lazard, 2020, p.14). Given 175 MW turbine capacity and EPC costs of $ If, instead, the farm sells 100% of its power generation on the spot market (as is increasingly common), debt financing is assumed to be precluded, and the firm makes no interest payments.


Sponsor's profit
The sponsor is entitled to the residual profit once all expenses, including debt servicing, have been paid for. For simplicity, we ignore adjustments to working capital or a buildup in the debt service reserve account. The sponsor thus earns a profit of


Stimulus programs
Historically, renewables investments have been driven to some extent by government incentives (e.g., the German “Erneuerbare‐Energien‐Gesetz”), which have come in different flavors: feed‐in tariffs, green certificates, tax incentives, etc. The impact of stimulus programs on renewables investments has been studied by Boomsma et al. (2012) among others. As the total cost (or levelized cost of energy) of wind and solar power declines and renewables projects gradually become viable on their own, governments are phasing out their incentive programs. For instance, in 2018, the Chinese central government announced that it would soon end subsidies to solar PV. It made a similar announcement for wind in 2019. Because these incentive programs are country‐specific and are becoming less critical to ensure the viability of renewables projects, we set aside such programs in our baseline cases, to focus on the interface between financial and operational decisions. However, we account for them via comparative statics of the parameters a and b in Equation (2). Naturally, such programs contribute to reducing the SPV's exposure to financial distress.
EPC costs
Sponsors of renewable projects typically hire engineers to design a farm meeting a set of contractual (e.g., PPA) and legal requirements, source the main equipment (e.g., wind turbines, solar panels, inverters) from the manufacturers, and purchase all other supporting components in a separate agreement called a “balance‐of‐plants” contract (Raikar & Adamson, 2020, p. 57). This approach helps to mitigate cost overruns. The EPC costs amount to

The project's useful life
Without retrofitting, the useful life of a wind farm is 20 years on average (Lazard, 2020, p. 14). Instead of considering a fixed lifetime (which is unreasonable and less tractable), we model equipment decay at an exponential rate of

Information and agency considerations
Information frictions are less critical in such a setting because extensive data are available on the energy sector (see, e.g., Lazard, 2020), and in real time. In addition, under project finance, the sponsor and the lender exchange in order to settle on reasonable assumptions for their financial models, in some cases hiring independent advisors (Raikar & Adamson, 2020, p. 31). Agency problems may, however, arise as the sponsor effectively manages the asset, with the lender having a more limited say in key decisions, except indirectly via covenants. An example of such a problem is the sponsor's unilateral decision to let the SPV go bankrupt if it is in its interest to do so, leading to endogenous default risk.
Table 1 summarizes the main parameters and symbols used in this paper and specifies restrictions on the state and control variables. Table 2 presents the values used for the parameters in our illustrations.
Nomenclature
Model calibration
Note: Sources, which include Raikar and Adamson (2020), Schwartz and Smith (2000), and Lazard (2020), are detailed in Section 3.
Abbreviations: EPC, engineering, procurement, and construction; PPA, power purchase agreement.
STYLIZED MODELS WITH SINGLE OPTIONS
We first develop simple models to address our research questions and gain some insights into the interactions between the operational decision to expand and the financial decision to shut down operations.
Net present value over the equipment's useful lifetime
Assume that the SPV operates the farm, making no adjustments until the equipment decays. At the end of the project's operating life, the SPV may be required to dismantle the equipment, but such costs are relatively small for solar and wind projects (Raikar & Adamson, 2020, p. 161) and are hence omitted for simplicity. The sponsor is thus entitled to the net present value (NPV), given by


Standalone financial decision to default
We first consider RQ A (Section 1) in isolation. Assume that the sponsor can decide not to back the SPV if the latter incurs losses. If the SPV defaults, the lenders and the (e.g., O&M) contractors will foreclose on the collateral (to recover the outstanding liabilities, interest, penalties, etc.) and the sponsor will receive nothing. The sponsor's payoff thus differs from the NPV ψ in Equation (5) and is instead given by If If Assume that 


Standalone operational decision to expand capacity
To develop a benchmark to study RQ B, consider the firm's operational decision to expand capacity independently of the financial risk. If repairs or capital expenditures for wind farms are not conducted promptly, the farm may not generate as much power as initially planned (and may ultimately have trouble covering fixed costs). Banks typically want the SPV to have sufficient reserves on its balance sheet to meet critical expenditures (e.g., O&M reserves, capital expenditure reserves, and debt service reserves) in case of foreseen or unforeseen circumstances (Raikar & Adamson, 2020, p. 48). Assume now that the SPV can replace or add wind turbines (with the same productivity parameter When PPA revenues are high (so that When the farm is exposed to large merchant risk, the SPV is prone to financial distress. The operational decision to expand will thus interact with the financial decision to default, leading to a more intricate problem that we deal with in the next section.


INTERACTIONS BETWEEN FINANCIAL AND OPERATIONAL DECISIONS
The interactions between the financial decision to let the SPV go under and the operational decision to expand production capacity when 
Operational decision to expand capacity under (endogenous) credit risk
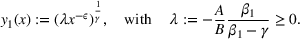
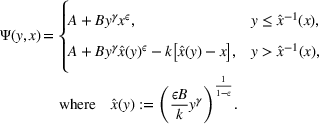
We reconsider RQ B but, unlike the discussion in Section 4.3, we now explicitly consider the effect of (endogenous) credit risk on the operational decision to expand capacity. Instead of the capacity‐choice problem in Equation (8), the sponsor now solves the problem The function 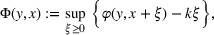


Because the sponsor incurs a negative fixed flow a, it faces two opposing forces. First, increasing power generation reduces the operating leverage, leads to larger profits, and effectively helps reduce the SPV's financial distress. This effect prevails when the generation capacity is limited, that is, 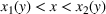


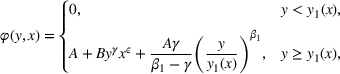
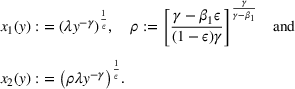
We want to determine the conditions under which expanding power generation creates NPV for the sponsor. Theorem 2 studies the function We distinguish the following cases: If the merchant price is low, namely 0 is the global maximum of 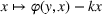


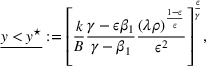


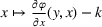


Figure 1 depicts the three cases identified in Theorem 2 under high merchant price exposure (i.e., The function 


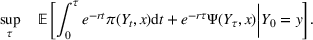
Study of the function


It is not surprising that a higher merchant price The expansion NPV Φ in (11) simplifies to The inequality 


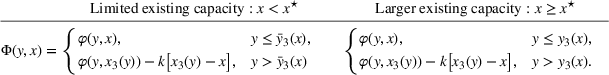


Figure 2 illustrates Corollaries 2 and 3. Panel a plots the cutoff merchant prices 


Regions


Expanding capacity versus shutting down
We now address RQ C, considering that the (possible) financial decision to shut down the SPV depends ex ante on the future, likely benefits the sponsor could gain from its operational decision to expand the wind farm's capacity in the future. This research question is addressed by considering the timing of the two options under high merchant price risk exposure (i.e., 


Because the control variable ξ is 


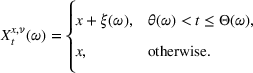
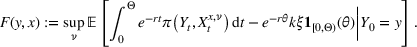
We study problem (17′) using dynamic programming. First, the sponsor can exercise the options immediately, so 


Case with large initial generation capacity

If a sponsor delays its decision, it achieves an economic profit or loss For a given 


To solve the VI (20), the Supporting Information Appendix (in Section EC.8) determines mild conditions on g to ensure that the sponsor will delay its decision whenever the merchant price is in the interval 


Case with low initial generation capacity

In this case, we know from Corollary 2 that the NPV Φ is nondifferentiable at 


We now come back to the simpler problem in Equation (10). The following proposition establishes that the free boundary for problem (10) is obtained by limit considerations of the problem with The solution 
Optimal stopping problem (10) for


If the SPV has large PPA revenues (i.e., 
Comparative statics
This section investigates (numerically) the sensitivity of the SPV's credit risk (RQs A and C), and of the sponsor's decision to expand (RQ B), to changes in the economic environment.
Change in initial generation capacity
Figure 3a plots the NPV at exercise Φ and the value function F in Equation (17′) for the base case 2 with 


Exit, hysteresis, and expansion regions. We assume that


Change in the farm's profitability parameters a and b, for example, owing to stimulus programs
According to Figure 4a, lower secured PPA revenues (a lower 


Comparative statics for


Change in merchant price dynamics
Figure 5 illustrates how changes to the drift μ and volatility σ of the merchant price affect the sponsor's timing decisions (in Panel a) and the expansion lumps (in Panel b). When faced with higher merchant price volatility σ, a sponsor should delay both the default and expansion decisions, out of caution. The effect of merchant risk on the sponsor's value 


Comparative statics for the value function


Change in equipment productivity and EPC costs
Using similar illustrations, it can be shown that a lower concavity ε of the production function makes the investment more attractive, so that the sponsor will hasten capacity expansion and invest a larger amount. In contrast, a larger EPC cost k (e.g., due to the increased price of particular components as a result of industry concentration) renders the expansion less attractive, so the sponsor delays further capacity expansion and invests less. Sponsors may have privileged access to EPC, giving them an edge versus other wind farms.
REFINED MODELS
This section presents refined models that capture further realistic features and help us address RQs D and E (Section 1).
Capital budgetary restrictions
As implied in RQ D in Section 1, there may be insufficient cash reserves to finance an expansion, meaning that an equity injection is required. Following Bolton et al. (2011), we assume that the total cost of raising the investment amount 


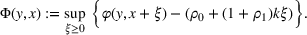
Figure 6 illustrates the corresponding value function (obtained by replacing Φ in Equation (11) by Φ in Equation (21) in Equation (19)) and highlights the point above (respectively, below) which the sponsor will expand capacity (respectively, default). First, if the sponsor faces a larger fixed financing fee ρ0, it should delay the expansion further due to hysteresis (while the investment size for a given electricity price remains unaffected) and should default earlier (see Panels a and c). Second, under a larger proportional financing fee ρ1, the sponsor should delay the expansion, reduce the investment amount, and exit earlier (see Panels b and d).

Comparative statics for the value function


Default and expansion decisions in an industry context
We now develop two model extensions to address RQ E.
Changing equipment prices/EPC costs
Equipment prices are subject to two main counteracting forces. First, there are continuous efforts to manufacture bigger, more powerful, and more effective equipment at lower unit cost (due to economies of scale). For instance, floating offshore wind turbines (used, e.g., at the Hywind Scotland wind farm) are less customized than traditional turbines, require less steel, and are easier to install. Although sponsors are slow to embrace new technologies (because lenders are averse to unproven technologies), such developments at the industry level are still likely to lead to reduced equipment prices. Second, the industry demand for wind turbines tends to be positively correlated with power prices. A reason for this trend is that an increase in carbon prices (which eventually pushes power prices up) leads to a relative improvement in the LCOEs of renewable technologies, enticing the energy sector to invest more in this renewable technology.
We model the above forces using a two‐state Markov chain for the EPC cost 


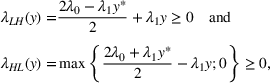


Figure 7 illustrates the effects of increasing transition probabilities (via λ0) on the sponsor's decisions. It follows from Panel a that, fearing increasing (respectively, hoping for declining) EPC costs, the sponsor has an incentive to expand capacity sooner (respectively, later) if the EPC cost is currently low (respectively, high). Indeed, uncertainty with respect to the equipment cost can either increase the value of delaying investment (if the EPC cost is currently high) or decrease it (if the cost is currently low). Interestingly, following Panel b, the sponsor should default earlier (respectively, later) when the EPC cost is low (respectively, high) because a recovery episode with the affordable expansion is less (respectively, more) likely.

Comparative statics for default and investment decisions with respect to λ0. The blue dots (red circles) correspond to the high (low) equipment costs


Figure 8 illustrates the effect of herding (via λ1) on the sponsor's decisions. In line with Panel b, as herding becomes more intense, the sponsor should expand capacity sooner to preempt a rise in EPC costs. A depressed electricity market leads to a more affordable expansion as λ1 increases. The sponsor is thus less likely to close up shop, as confirmed by Panel a.

Comparative statics for default and investment decisions with respect to λ1. The blue dots (red circles) correspond to the high (low) equipment costs


Effect of cost heterogeneity on industry capacity
We now study the effect of wind farm heterogeneity on industry capacity. Consider an industry—characterized by a unit measure of firms—that features heterogeneity (only) with respect to the EPC cost parameter k. Such heterogeneity may stem from sponsors' differing access to key equipment and services providers. This is likely to be the case as large utilities may negotiate better terms with these providers than a financial investor focused on a one‐time deal. Specifically, we assume that the EPC cost k is normally distributed with mean 


Figure 9 illustrates the situations in which the heterogeneity in k is large (red line) versus small (blue line). In particular, it depicts the distribution of the default threshold 


Firm heterogeneity in the investment cost parameter k. We assume that


Firm heterogeneity in a. We assume that


CONCLUSION
This paper studies, for a problem related to the sponsor of a wind farm, the intricate interactions between the operational decision to expand generation capacity (and by how much) and the financial decision to default. To explore this essential question from the perspective of the iFORM literature, we developed a nonstandard real options model in which the sequence of decisions is not set ex ante and in which the sponsor decides on capacity installment and investment time. We characterize the sponsor's decisions in terms of an interval outside of which the sponsor intervenes: it will default for low merchant prices and renew/install turbines for high prices.
The managerial insights from this model are numerous. For instance, when faced with significant merchant risk, the sponsor may install more capacity to avoid shutting down the SPV when the merchant price is low, but will virtually disregard the exit option for higher merchant prices. Furthermore, because the sponsor can either shut down operations or renew/install turbines, it will not default as soon as the merchant price falls below the cut‐off level of the (stand‐alone) exit option: it will exert more caution before killing both real options. Our numerical extensions provide further insights. Financing costs lead to delayed expansion, but the scale is only affected by proportional costs. Herding leads to an equipment price increase (respectively, decrease) when the merchant price is high (respectively, low), so the sponsor may hasten or delay investment to benefit from better procurement terms. Cost heterogeneity helps reduce observed volume swings as sponsors default or expand capacities over a larger range of electricity prices.
Like any model, our model has certain limitations. Some of them can be addressed within our general model framework; others are left for future research. For example, the efficiency of the power generation technology is assumed to be constant over time, thus ruling out the possibility that the sponsor may upgrade the technology when renewing/installing turbines. Furthermore, letting an SPV go bankrupt may lead to reputational damage for the sponsor, for example, an incumbent utility, which is not captured here. In addition, the flow of energy from wind and sunlight is not constant; modeling their random availability (e.g., via a Weibull distribution) would add another layer of complexity, which is also omitted in our model. Most importantly, we considered one segment of the energy sector in isolation, disregarding the fact that wind farms are only one class of productive assets among a pool comprising base (e.g., nuclear) and peak‐load assets (e.g., CCGT). The effect of wind farm decommissionings and capacity expansions on overall electricity prices is difficult to assess as these other generation technologies can offset such effects. If the economics of wind farms were to deteriorate (respectively, improve), investments may be channeled into (respectively, diverted away from) other flexible technologies (e.g., CCGT), which would mitigate the effect on the electricity price in the long term. However, unless significant storage capacities are installed, the increased investments in renewables may increase short‐term supply fluctuations, which may exacerbate the volatility of merchant prices, at least in the short term.
We believe, however, that our model has helped us address key research questions of relevance for the energy sector. The insights we revealed may be carried over to other industries where project finance plays a key role, for example, for funding infrastructure such as bridges, tunnels, and toll roads or for financing long‐term healthcare facilities such as hospitals.
Footnotes
ACKNOWLEDGMENTS
The authors would like to thank Subas Acharya, Abel Cadenillas, Herbert Dawid, Lillian De Menezes, Christoph Flath, François Le Grand, Florian Lücker, Peter Kort, Dmitry Rachinskiy, Frank Riedel, Suresh Sethi, ManMohan Sodhi, Andrianos Tsekrekos, Lenos Trigeorgis, Athanasios Yannacopoulos, participants at the international real options conference in Dusseldorf, INFORMS annual meeting in Phoenix and the second RCEA Warsaw Macro‐Finance Conference and participants at research seminars in Athens University of Economics and Business, CASS Business School, Cranfield School of Management, Emlyon Business School, UT Dallas, and the University of Bielefeld. Research supported by the National Science Foundation under grant no. NSF‐DMS 1905449 and grant from the SAR Hong Kong RGC GRF 14301321.