
Abstract
In this study, we conceptualize and empirically evaluate how large‐scale organizations can utilize the informational value of visual nudges on social media to promote safety among users and thus improve public health outcomes in the context of the coronovirus desease caused by the SARS‐CoV‐2 virus (COVID‐19) pandemic. We construct a unique panel dataset combining data collected from multiple public and proprietary sources. To operationalize visual nudges from user‐generated content, we engage in extensive manual classification of images collected from Instagram (IG), Twitter (TW), and Facebook (FB). To examine the relationship between visual nudging and COVID‐19 positivity, we rely on a combination of econometric and epidemiological models. We find that when institutional actors share more images containing mask‐related information on IG, their COVID‐19 positivity rates decrease by up to 25%, on average. Also, given the fragmentary evidence behind FB and TW effects, our results provide suggestive evidence of the “boundary condition” of the visual nudge effect. Finally, empirical evidence indicates the dynamic and curvilinear effect of visual nudges on positivity over time, such that the informational value of visual nudging is most prominent if communicated 3 to 5 weeks ahead of time, on average. Our results demonstrate the informational value of visual nudges communicated through pertinent social media channels, as well as their capacity to improve public health outcomes. This suggests the feasibility of institutional actors using social media engagement to promote safe behaviors. We conclude by discussing how our findings may be used to develop more effective communication strategies regarding public perceptions of mask use and other relevant safety measures.
INTRODUCTION
The COVID‐19 pandemic closed organizations, including educational institutions, across the country, with severe economic and social consequences (Mukherjee et al., 2021). The importance of reopening is well acknowledged, but there is less of a consensus on how educational institutions in the United States and abroad can reopen safely. For example, evidence suggests that widespread rapid testing, enforcement of mask‐wearing, social distancing, and contact tracing are among the most relevant measures for in‐person reopening (Abaluck et al., 2022; Dayaratna et al., 2020; Mukherjee et al., 2021). Under the conditions of uncertainty driven by COVID‐19's sheer novelty, engaging the public to adopt behaviors known to curtail the spread of the virus is crucial. Public health research shows that in health crises plagued by high levels of uncertainty, explicit policies and mandates, while necessary, may not by themselves be sufficient to ensure maximum compliance (Camargo & Grant, 2015). To this end, social media plays a significant role in providing the information necessary for the individual, communal, and organizational overcoming and recovering from emergency situations (Cui et al., 2018; Gour et al., 2022; Yan & Pedraza‐Martinez, 2019), thereby making it an indispensable medium for public communication and outreach on urgent matters of public health and crisis management (McKee, 2013). Motivated by the importance of social media engagement in crisis management, our study aims to examine the relationship between visual nudges containing mask‐related information and COVID‐19 positivity rates.
Building on the nudge theory, which advances indirect suggestions and positive reinforcement as ways to influence human behavior (Thaler & Sunstein, 2009), we demonstrate how social media posts can act as nudges associated with beneficial public health outcomes. The value of using nudges to direct behavior and decision‐making has been well established in the literature (Hanks et al., 2013; Kraak et al., 2017; Misawa et al., 2020). Recently, the role of nudges has been studied in the context of digital behavior (Charry & Tessitore, 2021; Purohit & Holzer, 2021), privacy and credibility of information (Bhuiyan et al., 2021; Nekmat, 2020; Wang et al., 2013), platform features (Purohit & Holzer, 2021), and disaster communication (Mirbabaie et al. 2021). Furthermore, in the context of COVID‐19, nascent streams of literature employ textual nudges (Sasaki et al., 2020) or platform affordances (Purohit et al., 2020). However, the use of visual nudges, which has traditionally been central to nudge theory (Thaler & Sunstein, 2009), has thus far not been evaluated in the context of social media nudges. While mask‐wearing is now known to slow the spread of the disease (Gurbaxani et al., 2021), the objective of this study is to assess whether sharing images displaying mask‐wearing on social media is related to reductions in COVID‐19 positivity rates.
The contribution of our study is threefold. First, we contribute to the literature at the nexus of information systems and public health by clarifying the relationship between institutional actors’ engagement on social media via so‐called “soft” nudges in the form of visual images and health‐related outcomes. Second, we elucidate the mechanism underlying the effect of visual nudges from the temporal perspective demonstrating the delayed effect between exposure to images and outcomes. Finally, our findings are of immediate significance to decision‐makers and practitioners as they lay out a potential approach for noninvasively and cost‐effectively shaping public health attitudes and, consequently, behavior through real‐time social media interventions.
The paper proceeds as follows. Section 2 discusses prior work on the concept of nudging and its relevance within the scope of universities using social media for stakeholder engagement. Section 3 includes a review of relevant literature. Section 4 provides the theoretical basis to investigate the mechanism underlying the relationship between visual nudges and health outcomes. Section 5 comprehensively describes data and variables. Section 6 presents our identification strategy and results on how visual nudges influence COVID‐19 positivity rates. Section 7 discusses theoretical and practical implications. Section 8 concludes.
BACKGROUND
Thaler and Sunstein (2009) developed their concept of nudging, which has its roots in their understanding of libertarian paternalism, or the set of approaches to behavior that preserve freedom of choice but steer people in a direction that will promote their welfare. According to Thaler and Sunstein (2009), a nudge is “any aspect of the choice architecture that alters people's behavior in a predictable way without forbidding any options or significantly changing their economic incentives. To count as a mere nudge, the intervention must be easy and cheap to avoid. Nudges are not mandates. Putting fruit at eye level counts as a nudge. Banning junk food does not” (p. 6). Consistent with the scope of our study, we consider images containing masks on social media to be nudges that constitute an added aspect to the choice architecture of institutional stakeholders. That is, to facilitate safe behaviors of the target population during the pandemic, institutions make strategic choices to adjust their content‐sharing approach by adding images (intervention) that convey the prominent and essential role of mask‐wearing. As a result, such nudges can have the capability to influence behavior by adding a choice that corrects any misapprehensions about social norms associated with mask‐wearing hesitation. Consider the following vignette:
Joan is a student at a large university. On campus, she follows the recommendation to wear a mask and practice social distancing. She is generally okay with following such safety measures on campus. However, when running errands off‐campus, she sometimes feels like those precautionary measures are no longer needed. It happens that Joan follows her university on social media, which has recently embarked on a content‐sharing strategy to facilitate mask‐wearing compliance (independently of place). As a follower of the university's Instagram (IG) account, Joan has been exposed to posts depicting other members of the community (students, faculty, staff, etc.) across different environments and interactions wearing a mask (or some form of face covering). By better informing Joan of the social norm from a standpoint of a reputable entity and trustworthy source of information, such visual nudges can reduce the information asymmetry and steer her toward desired behaviors both on and off campus. As a result, Joan resolves to keep her mask handy anywhere she goes and uses it more often.
Our focus is on university campuses that generally include not only students but also faculty, staff, and other personnel who together represent diverse groups in terms of gender, age, race, ethnicity, ability, sexuality, and other socio‐economic characteristics. Moreover, unlike other economic sectors, higher education institutions have sought to maintain at least a minimal in‐person presence during the pandemic, which makes its response to the pandemic a compelling example representative of large‐scale organizations. To this end, we seek to understand how COVID‐19‐related visual nudges exemplified by a university's social media messaging strategy are associated with the university's COVID‐19 positivity rate. Unpacking the effect of visual nudging in an informatics context such as social media can have direct implications for both the theory of managing large‐scale public health crises at the organizational level and the practice of devising effective social media messaging strategies to ensure maximum impact.
Unlike traditional methods of epidemiology and surveillance, which require significant time and resources to collect and analyze medical diagnostic information, thereby increasing the gap between emergency and response, social media surveillance offers quicker detection and response (St Louis & Zorlu, 2012) and has been implemented successfully in a variety of public health contexts such as influenza (Salathé et al., 2013) and human immunodeficiency virus (Young, 2015). Therefore, to examine the relationship between noncoercive visual nudging on social media and the spread of COVID‐19, we primarily focus on IG, a leading social networking service with the main focus placed on sharing visual content such as photos and videos. IG is the fourth most popular social network in the world with nearly 1.5 billion monthly active users. 1 For universities, this image‐sharing platform provides a versatile, useful, and aesthetic way to reach millions of various stakeholder groups. Notably, a recent report from Pew Research Center emphasized that IG has an especially strong following among young adults, as 71% of respondents between 18 and 29 years old reported their frequent use of this platform. 2 IG is an ideal platform for the study of visual nudging used by large‐scale organizations because of its emphasis on visual content. Research shows that humans enact visual information processing and interpretation much faster than they process and interpret information from text, which makes visual nudges more effective than textual ones (Serences & Yantis, 2006). Our study integrates this evidence with the behavioral aspect of nudging to create a framework of visual nudges on social media designed for maximum impact to be deployed in crises.
Further, we note that IG is not the only platform that can be used by universities to engage stakeholders with the content of a visual nature. For example, many academic institutions rely on Facebook (FB) and Twitter (TW) to share textual posts that can be complemented by photos and videos. FB, the most popular social network worldwide, 3 is generally used by academic institutions to reach targeted groups of people to increase student enrollment, to build an effective online community, and to maintain their reputation (Srikoo & Chung, 2021). Although FB was used by around half of America's teens in 2018, it no longer dominates the teen social media landscape, according to Pew Research Center, 4 as the age demographics have shifted considerably, with FB mostly used by older adults 5 and IG 6 amassing younger audiences. TW represents another popular social media platform used by nearly 23% of Americans. TW has been the go‐to social media platform that institutions and individuals turn to in times of crisis (such as COVID) due to the speed of information diffusion on the platform, and it has been used during and after major disasters in the last decade (Gong & Lane, 2020). In the context of universities, TW can provide a feasible engagement tool to share news and announcements, sparking real‐time discussions and fostering meaningful interactions. Recent reports indicate that nearly 84% of universities in the United States have a TW account (Gong & Lane, 2020). However, as a Pew Research Center study 7 shows, in contrast to IG, which is used by 71% of young respondents, only 42% of the people in this age category use TW. Moreover, while IG is used by 74% of American adults with a high school or some college education, only 40% of respondents in this demographic group use TW.
Although it is well documented that most higher education institutions in the United States are actively engaging these online channels and do, in fact, use multiple platforms simultaneously to cultivate and maintain stakeholder relationships, research also shows that the choice of a particular online platform may depend on a variety of factors such as the characteristics and affordances of the platform, stakeholders, and the university itself (Luttrell et al., 2017) or the modality of communication (i.e., IG emphasizes visual image sharing, TW emphasizes short text‐based information sharing, and FB provides the largest array of functions, including text‐based posts, photo sharing, and sophisticated privacy settings that allow one to curate specifically who can view each post; Shane‐Simpson et al., 2018). In addition to customizing the engagement strategy to align with a particular platform's affordances, geographic characteristics also appear to influence the choice and level of engagement with online channels. For example, in the United States, universities in the Southwest have a more robust FB and IG following, whereas the Midwest tends to cultivate more engagement on TW and LinkedIn (Srikoo & Chung, 2021).
Given the multiplexity of approaches to social media used by universities and their stakeholders, we acknowledge that in practice, it is not feasible to definitively say how many students, faculty members, or staff members follow a university's social media account since not all of them will do so. Moreover, it is not feasible to identify which of the accounts’ followers are students, faculty members, or staff members, as this information is not available to account owners or to the social media platforms of interest themselves. That is, while the platforms might collect some general demographics‐related information pertaining to individual user accounts at registration, it is nearly impossible to establish the specific role or affiliation of these users with other accounts that they follow. In view of this limitation, we attempted a multifaceted best‐practices approach to demonstrate the strong correspondence between universities’ followers and these institutions’ campus stakeholders. The results of our in‐depth analysis are provided in Supporting Information S1.
LITERATURE REVIEW
The theoretical and empirical investigations of the use of nudges on social media platforms have seen a significant increase in the information systems literature (Lee et al., 2018). This increase has been particularly robust since the onset of the COVID‐19 pandemic due to the potential of digital nudges to help combat disease misinformation online (Roozenbeek et al., 2021). Inherently interdisciplinary, resting on principles from behavioral psychology, economics, and informatics, this line of nascent research has promisingly included aspects of fields such as legal studies (Krawiec et al., 2021), disaster communication (Mirbabaie et al., 2021), and nutrition science and dietetics (Charry & Tessitore, 2021). In general, we can delineate two streams of underlying research: one that engages issues of information privacy and accuracy and another that focuses on modifying offline behaviors using online nudge tools and techniques.
The former stream relates to fighting misinformation and promoting healthy information ecosystems by fostering greater cognitive reflection (Pennycook et al., 2020), engaging trust, emotions, and cognitive biases (Chou et al., 2021), or implementing artificial intelligence (AI) based fake content detection tools (Ng et al., 2023) to minimize the risk of propagating inaccurate information through social media networks. Studies in this stream are primarily centered on understanding the factors that make online users susceptible to misinformation (Nekmat, 2020) and engaging these dimensions to promote greater vigilance and information literacy (Bhuiyan et al., 2021; Wang et al., 2013). The second prominent stream focuses on applying online nudges to offline behaviors such as promoting energy‐saving behavior (Jung et al., 2021), boosting educational attainment (Tang, 2022), encouraging patient acceptance of AI‐augmented healthcare delivery systems (Dai & Tayur, 2022), curbing the spread of COVID‐19 (Sasaki et al., 2020), and increasing compliance with public health measures in the context of the COVID‐19 pandemic (Moya, 2020). Unlike the first stream, in which digital nudges are deployed within the online ecosystem with the intention of improving it, the use of nudges in the second stream seeks to modify behaviors transcending online communication. Demonstrating a causal mechanism in the latter case is much more challenging, which is likely the reason for the primarily correlational nature of the studies in the second stream of literature.
Studies across both streams employ textual nudges (Sasaki et al., 2020) or platform affordances (Purohit et al., 2020), but the use of visual nudges, which has traditionally been central to nudge theory (Thaler & Sunstein, 2009), has thus far not been evaluated in the context of social media nudges. This omission constitutes an important gap in the scientific understanding of digital nudges since the rise of unstructured user‐generated content in online communities suggests that Internet users are exposed to a significant amount of non‐textual information which can, under certain conditions, assume the role of a nudge and influence human behavior, making studying its effects an indispensable part of digital nudge research. Examining the mechanism of visual nudge processing is even more pertinent in the context of the COVID‐19 pandemic due to the psychological impact of information overload, often consisting of conflicting messages, when simple visual cues can be perceived as easier to decode and interpret and are therefore more influential than textual information.
THEORETICAL DEVELOPMENT
We examine the theoretical foundation of nudges using a lens of dual process theory, on which the concept of nudging was built (Kahneman, 2011; Thaler and Sunstein, 2009). A common way of describing real‐world decision‐making in behavioral and cognitive science follows the so‐called dual process model, which distinguishes between two cognitive systems: the automatic (System 1) and the reflective (System 2; Kahneman, 2011; Van Gestel et al., 2020). Each system focuses on different cognitive and deliberative tasks, such that System 1 is commonly described as intuitive, uncontrolled, effortless, fast, associative, and unconscious thinking (e.g., being startled by loud noises or slowing down when entering a dark tunnel). In contrast, System 2 can be described as controlled, effortful, slow, deductive, and self‐aware, and represents a more deliberate way of thinking (comparing two products for the best value or filling out a tax form). Generally, it is considered that people act intuitively by default, as System 1 requires little effort, compared to System 2. Therefore, it often determines our behavior instead of the careful deliberation by System 2. This can lead to behavior inconsistent with a person's long‐term goals. For example, in the context of our study, a person might have a long‐term goal to stay healthy but may occasionally engage in risky behaviors such as not wearing a face covering in public places. In the literature, a default is defined as “an option that is preselected, such that, in the absence of an active decision, the decision‐maker will stick with the preselected option” (Van Gestel et al., 2020). Going back to the aforementioned vignette about Joan, the default option for her on campus is to wear a mask given the institutional recommendation (or enforcement). However, when off campus, the default for Joan can either be driven by her own beliefs or implied by the situation. In social settings, for instance, the normative choice (i.e., how others are behaving) that Joan is likely to make may be adopted unconsciously as a social default effect (Huh et al., 2014). In such a case, Joan is more likely to choose an option that she observes others choosing, even if she does not believe that other people are more knowledgeable. To facilitate comprehension of how different systems interact with nudges and model what nudges actually do, we rely on the four steps that detail assumptions behind nudges and the processes that they wish to instigate. Additionally, we elaborate on the different types of nudges and delineate what nudges interventions are not. This information is provided in Supporting Information S2.
Based on our theoretical elaboration, we conclude that in the context of mask‐related online images shared by institutional actors on their dedicated social media channels, a nudge framework is not only beneficial but indeed felicitous to analyzing their effects in the context of individual decision‐making (Rainford & Tinkler, 2011). We therefore propose the following: The higher the proportion of images displaying mask‐wearing shared by an institution, the lower the COVID‐19 positivity rates.
DATA AND VARIABLES
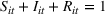
For the purpose of our analysis, we collected a unique panel dataset from multiple public and proprietary sources including (1) COVID‐19 testing data; (2) IG, TW, and FB images from official university accounts and associated metadata; (3) university COVID‐19 policies; (4) university characteristics; and (5) variety of local area (county) characteristics. We collected all data for a sample of N = 117 universities (both public and private) in the United States (representing 37 states, 104 counties, and 107 cities), which represents about 11% of the total number of schools that are regionally accredited and offer 4‐year undergraduate degree programs. Our sample of universities is limited to the universities that meet the following selection criteria: (1) conducts proactive asymptomatic and/or surveillance testing for COVID‐19, (2) maintains an active COVID‐19 tracking dashboard with regular updates (at least once every 14 days), (3) reports total numbers of (a) tests conducted and (b) positive cases 8 since the beginning of the university's reporting period, and (4) maintains an active public IG or TW account.
Dependent variable
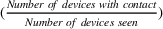
Our focal dependent variable is the COVID‐19 weekly positivity rate, defined as the

Independent variables
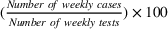
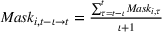
To capture our independent variable that represents visual nudges used by institutions to convey safety‐related information to stakeholders, we rely on images posted by the universities via their IG and TW accounts. Generally, such images portray students, faculty, representatives of top management, mascots, or even animals or statues wearing some form of face covering. To collect images posted on the universities’ IG accounts, we used an open‐source package 11 that permits downloading images from public IG accounts. To collect images posted on the universities’ TW accounts, we utilized another open‐source package 12 that allows fetching historical TW data. Finally, we manually collected a corpus of image‐based content posted by the universities on their official FB pages. For the purpose of our analysis, we collected data posted between July 2020 and February 2021. Our final sample included 28,913 images collected from IG, 23,819 from TW, and 12,567 from FB across 117 universities.
For image classification, our goal was to ensure lack of measurement error in the identification of the images that contained mask signals. Therefore, we relied on manual classification of all of the collected images. To this end, a human classifier labeled a given image as 1 (or 0 otherwise) if they could clearly observe an object (person, group of people, animal, statue, mascot, etc.) wearing some form of face covering. For empirical analysis, we aggregated processed image data at the university level by week. That is, given 1 and 0 labels for n images for a given university in a given week, we calculated the sum of images’ indicator values and divided that by n, resulting in a value that represents the proportion of mask images shared by the university in a given week. Additionally, we used a set of IG and TW account‐level control variables, such as the number of followers, followings, and an indicator if the account was formally verified. 13
Control variables
To ensure correct identification of the focal effect and reduce the impact of omitted variable bias, we include an elaborate set of control variables that can also impact the outcome variable.
COVID‐19 testing policies data
To account for the confounding effects associated with COVID‐19 testing policies implemented by the universities (Mukherjee et al., 2021), we conducted a comprehensive phone survey to obtain the following testing policy characteristics that were implemented by universities in our sample during the study period of 22 weeks (recorded as time‐invariant binary indicator variables): (1) testing of students residing on‐campus, (2) testing of students residing off‐campus, (3) testing of the entire university population (those eligible), (4) testing of selected groups 14 of the university population (known as cohort testing), (5) testing of random participants of the university population regardless of the exhibited symptoms (known as surveillance testing), (6) testing of the university population who exhibit symptoms (known as symptomatic testing), and (7) testing of the university population who do not exhibit symptoms (known as asymptomatic testing). Additionally, we manually collected information associated with universities’ policies toward mask‐wearing and social distancing. In our sample, nearly all observations (99%) had implemented the corresponding policies following the recommendation provided by the CDC and had also strictly enforced its population compliance. 15 Even though some universities had lifted the restrictions associated with such safety measures closer to the end of our study period, the recommendation to wear a face covering and practice social distancing remained.
University characteristics
To control for heterogeneity between universities of different types and sizes, we obtained data associated with the size of the university student population and type of ownership from College Scorecard, a database provided by the US Department of Education. In addition, to account for the differences in the universities’ approaches to social media engagement, we collected data on the number of social media platforms used by a given university as means of engagement. We collected these data manually from the corresponding universities’ main web page (usually this information is provided in the form of social media pictograms at the top or bottom part of the web page).
Local mask‐wearing prevalence
To capture the effects associated with safety measures originating outside the university campus, we obtained data posted by The New York Times (NYT) on the estimates of mask usage by county populations in the United States. 16 These data come from a large number of interviews conducted online by the global data and survey firm Dynata 17 at the request of NYT. The survey responses about mask use were obtained from about 250,000 responses between July 2 and 14, 2020. For analysis, we used the measure of the proportion of NYT survey respondents that replied “always” to the question “How often do you wear a mask in public when you expect to be within six feet of another person?”
Local mobility and social distancing
We used longitudinal proprietary data provided by Cuebiq to capture county‐level internal mobility and social distancing.
18
These data are collected by Cuebiq from a sample of daily active users (observed persistently daily) representing a little over 6% of the US population and are distributed evenly and representatively across the country. Cuebiq's Mobility Index (CMI) is a proprietary measure that quantifies the average daily distance travelled by devices associated with a given geography. Cuebiq's Contact Index (CCI) provides a proprietary measurement of the number of people stopping in the same place at the same time
Local population political affiliation
We acknowledge the significant political issues that have emerged around mask‐wearing, which ultimately are likely to impact COVID‐19 positivity. For example, a recent empirical study found evidence that “the tendency to wear a mask while in public is significantly lower in counties where then‐candidate Donald Trump found strong support during the 2016 presidential election” (Kahane, 2021). Therefore, to account for such potentially confounding effects, we obtained data on the local area's political affiliation from the 2020 US general election presidential results by county. 19 For analysis, we used the time‐invariant measure of the percentage of votes cast for the Democratic Party to serve as a proxy for the political views dominant in a given area (county) to capture the potential differences in the extent of mask‐wearing in public.
Local mass media
To account for the potential confounding effect of information communicated via other media sources, we obtained 2020 data associated with the number of active local newspapers. These data were provided to us by the University of North Carolina Hussman School of Journalism and Media.
Population characteristics
To control for the county‐level effects associated with their population size and density, we collected corresponding data from County Health Rankings and Roadmaps.
Weather
Finally, nascent literature emphasizes the significantly negative effect of temperature on virus spread (Ganslmeier et al., 2021). We account for such an effect in our study using a two‐fold approach. First, we control for the local (ZIP‐code level) temperature. To this end, we collected daily minimum and maximum temperatures using the Meteostat 20 Python library. For analysis, we aggregated data at the university level by week by taking the average between the two observations. Second, we collected county‐level data 21 on the corresponding climate zone where each university is located. Specially, we used International Energy Conservation Code classification and added zone indicators as controls.
Tables 1A and 1B present descriptive statistics and operationalization of the time‐varying and time‐invariant variables used in the analysis.
Operationalization and descriptive statistics of the time‐varying variables.
Abbreviations: CCI, Cuebiq's Contact Index; CMI, Cuebiq's Mobility Index; FB, Facebook; IG, Instagram; TW, Twitter.
Operationalization and descriptive statistics of the time‐invariant variables.
Abbreviations: IG, Instagram; NYT, The New York Times; TW, Twitter.
VISUAL NUDGES AND COVID‐19 POSITIVITY
Empirical approach and identification
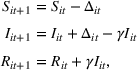
We now investigate the relationship between visual nudges and COVID‐19 positivity rates. Given the potential endogeneity concerns, we rely on the following three‐step identification strategy. First, we build a baseline regression model that accounts for alternative explanations by controlling for an extensive set of observed time‐variant and static confounders at different levels. Second, to address self‐selection bias originating from universities’ heterogeneous choices behind their idiosyncratic approaches to social media engagement strategies, we use coarsened exact matching (CEM). Finally, to address bias originating from omission of unobservable COVID‐19 true infectivity, we adapt an epidemiologic susceptible‐infectious‐removed (SIR) model to estimate it from the data.
In the baseline specification, we estimate the following regression model: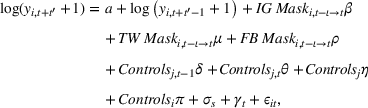


Next, 


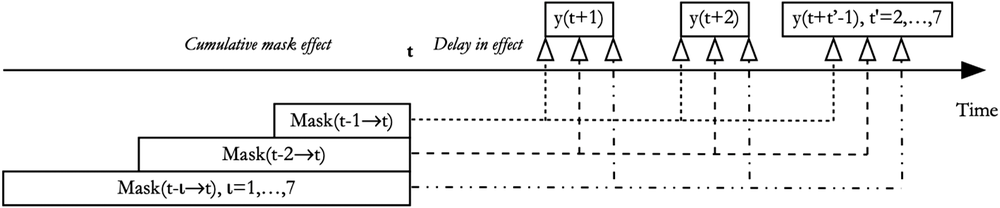
Modeling of the lagged cumulative effect of visual nudges on positivity rate.
Further, to ensure correct identification of the focal effect and reduce the impact of omitted variable bias, we include an elaborate set of control variables that can also impact the outcome variable. 


There are two main threats to identification in our baseline model specification. First, our estimates are subject to self‐selection bias given the considerable differences in universities’ approaches to sharing content in terms of the contextual variety of the images, their editorial quality, the specific timing of the postings, posting guidelines, and internal social media policies, whereas the only facet of their strategy observed to us is the proportion of the mask images. To this end, we use CEM (Iacus et al., 2012), an approach that we describe in more detail and for which we report results in Section 6.3. Second, although we made significant efforts to account for omitted variable bias by including a plethora of control variables originating at different levels, our econometric baseline model is unable to account for unobserved COVID‐19 true infectivity, which ultimately drives the positivity rates and could be correlated with the cumulative proportion of mask images. Therefore, to account for disease infectivity originating on and off campus (where school policies and mandates are not in effect), we adapt a compartmental epidemiological SIR model (Kermack & McKendrick, 1927). To ensure that omission of unobserved true infectivity does not bias our estimates, we use this model to conduct (a) comparison of beta coefficients between econometric and epidemiologic models, (b) temporal analysis of estimated infectivity components (beta coefficients) to detect potential structural breaks, and (c) counterfactual analysis. We describe this approach in more detail and report the results in Section 6.4.
Together, these strategies aim to identify the impact of informational value contained in visual nudges on the COVID‐19 positivity rates, accounting for self‐selection and omitted variable biases.
Main results
We further present our estimation results of Equation (1) in Table 2. The rows of interest correspond to the increase in the extent of accumulation of the mask effect ranging from 1 to 7 weeks. Similarly, the columns correspond to the duration of the delayed (lagged) effect of explanatory variables on the future outcome values ranging from 1 to 7 weeks ahead. Robust standard errors are provided in parentheses
Panel regression models of the cumulative proportion of mask effect on positivity rate.


Abbreviations: FB, Facebook; IG, Instagram; TW, Twitter.
p < 0.1; *p < 0.05; **p < 0.01; ***p < 0.001.
First, Table 2 provides evidence that signaling mask‐related content via IG is significantly associated with reduced COVID‐19 positivity rates. That is, universities that share more mask‐related visual content through IG observe, on average, a significant decrease in their positivity rates of 13%–25%. Correspondingly, on average, for a 10% increase in the proportion of shared IG‐masked images, there is an associated 1.3%–2.5% decrease in positivity.
Second, there is fragmentary evidence that universities that share more mask‐related visual content through FB also observe a significant decrease in their positivity rates ranging from 14% to 23%, on average. However, the observed effects are not consistent across all of the models tested and are marginally significant. Furthermore, in case of the TW effect, the impact is not statistically significant (p > 0.1). That is, the proportion of masked images shared by academic institutions via TW is not associated with COVID‐19 positivity. The obscured finding associated with FB and TW effect is somewhat counterintuitive; we believe the primary reasons behind it are rooted in the (i) irregularity of posting visual content including masks, (ii) platform differences in terms of the modality of communication, and (iii) compositional differences of the stakeholder audiences that follow the corresponding universities’ social media accounts. Having identified such a “boundary condition” of the visual nudge effect, we further discuss it in Section 7.
Third, in the case of the statistically significant IG impact, the results of our lagged models indicate the temporal dynamics of the nudging effect. To this end, based on the results presented in Table 2, we include Figure 2 where the Y‐axis represents the percent reduction in positivity rate, the X‐axis represents the duration in weeks between exposure to mask images on IG and observed change in positivity rate, and line patterns represent the extent of mask effect accumulation ranging from 1 to 7 weeks.
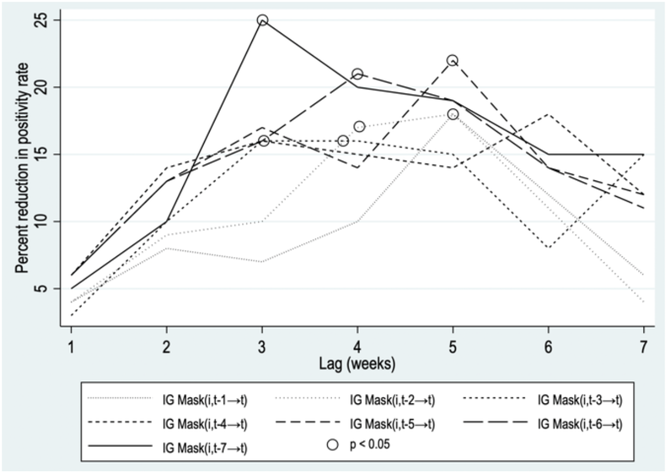
Visualization of temporal dynamics of the cumulative proportion of Instagram (IG) mask effect based on beta coefficients from Table 2.
We observe that the strength of the association as well as the magnitude of its effect increase with longer time periods between initial exposure to visual nudges and future positivity change. This effect is most notably prominent between 3 and 5 weeks of exposure (Models 3–5). However, the magnitude of association between the cumulative mask effect and positivity rate starts to dampen after Week 5 and becomes insignificant in about 6 to 7 weeks, on average. A potential reason for this diminished marginal gain could stem from the information saturation, a condition when the informational value of the visual nudge peaks and starts dampening as the visual's impact on cognitive perception begins to wear off. Additionally, we can see a correlation between the accumulation of the mask effect and reduced positivity. The effect is particularly noticeable in terms of magnitude with about 5 to 7 weeks of accumulation of mask content on IG. This observation suggests that stakeholders’ attention to the topic could pass from sight after some time. However, as we do not test this effect directly, we leave this matter to future research.
It shall be noted that the specific details behind idiosyncratic content‐sharing strategies adopted by each university are different and are largely unobserved to us. For example, the only facet of the strategy that is observed to us is the proportion of the images containing masks, but the contextual diversity of those images, their editorial quality, posting guidelines, or internal content‐sharing policies remain unobserved to us. In other words, each university's content‐sharing strategy implies their own unique “best” way of communicating the desired message. Therefore, to account for potential bias associated with any differences in universities’ individual approaches to social media engagement, we use CEM (Iacus et al., 2012). Specifically, to reduce the confounding impact and produce an appropriate covariate balance between the groups with a variable proportion of the shared mask images, we group universities by size, type of ownership, and locale of the institution in terms of rurality or urbanicity. To control for the nudging effect of past IG images (as the main statistically significant finding of our analysis), we first use


Last, for the outcome 


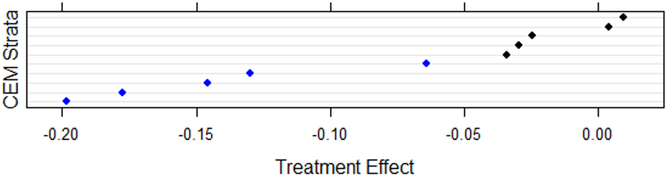
Coarsened exact matching (CEM) analysis results.
Epidemiological model
Although we have made significant effort to account for observed confounding effects in our econometric model specification, a critical factor that remains unobserved in our specification is the true COVID‐19 infectivity on the university campuses. True infectivity is the key factor that ultimately drives the observed positivity rates and at the same time is likely to be correlated with managerial decisions to share more or less mask‐related content. Omission of this latent variable in our modeling approach can lead to biased estimates and misleading inferences. Therefore, to ensure correct identification of the previously identified statistically significant IG effect, we need a model specification that considers the disease dynamics originating at different levels of the population and allows estimation of true infectivity from the data. To this end, we adapt the widely accepted compartmental epidemiological SIR model (Gnanvi et al., 2021; Kermack & McKendrick, 1927). 


Using the data available for each university, we benchmark four possible models to test Proposition 1. The corresponding models’ descriptions and associated dynamics are presented in Table 3.
Benchmarked models and underlying dynamics.
Abbreviations: CCI, Cuebiq's Contact Index; CMI, Cuebiq's Mobility Index.
For each model, university 


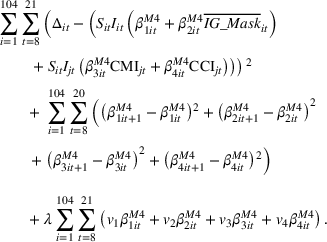
The first summand corresponds to the square errors of the regression, and the second summand penalizes deviations of β’s across consecutive weeks. This penalty models the intuition that β’s should vary gradually over time. The last summand adds a lasso penalized regularization that reduces the tendency of the estimator to explain solely using one of the covariates. For the estimation process, we heuristically tuned the lasso meta‐parameters, obtaining the lowest out‐of‐sample error with 
Next, we predict the new cases for out‐of‐sample week t, 


To compare models, we computed the root mean square error (RMSE) as 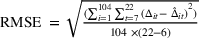
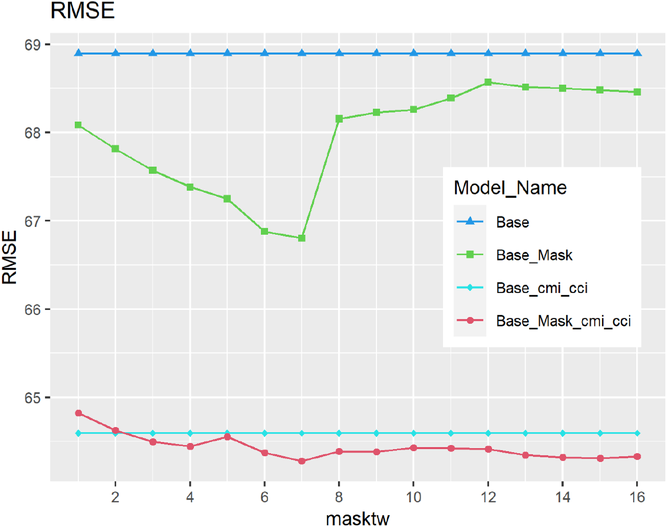
Root mean square error (RMSE) comparison of epidemiologic models M1–M4.
Last, we compare the estimated magnitude of the effect of visual nudges between epidemiologic and econometric models (in the case of both models, we observe the negative direction of the effect). That is, we compare the average of 

Temporal analysis of estimated coefficients
It shall be noted that in our models that account for the mask effect (models M2 and M4), we use an additive approach to estimate the base infectivity. That is, we take 


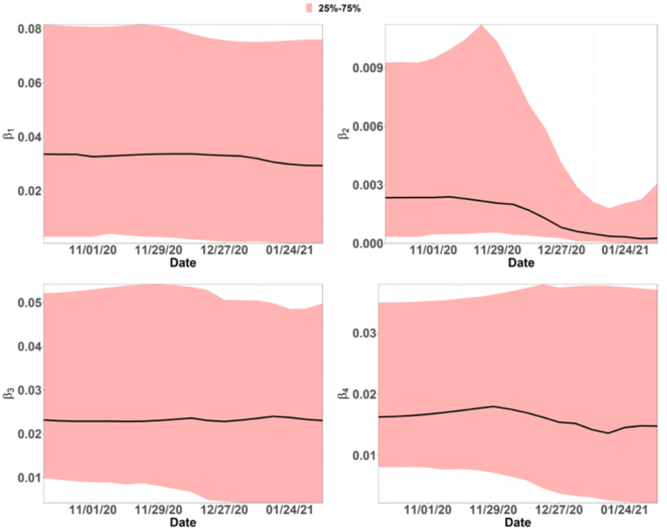
25%–75% quantiles of beta coefficients over schools per week.
First, the upper‐left graph represents the base infectivity 


To conclude, using the SIR model, we were able to alleviate the omitted variable bias by taking into account the COVID‐19 infectivity originating at different levels of the population. To this end, our comprehensive results provide evidence of the relative consistency in the magnitude, direction, and temporal dynamics of the IG mask effect between epidemiologic and econometric models.
DISCUSSION
Our work aims to show how innovative data analytics research can help promote public health. While nudge theory is a well‐established theoretical framework in public health research, we present a novel mechanism for applying nudge theory in decentralized, informal communication channels directly by community leaders such as individual organizations, instead of the top‐down approach practiced by government entities. This new approach to nudge theory, leveraging information and communication technologies, makes several theoretical and practical contributions to the literature and to health practitioners.
First, our findings contribute to prior literature by elucidating the informational value of visual nudges to promote safe behaviors in the context of mass health crises such as the global COVID‐19 pandemic. Nudge theory's effectiveness in the study of public health phenomena has been demonstrated in the areas of patient acceptance of AI‐augmented healthcare delivery systems (Dai & Tayur, 2022), dietary behavior (Arno & Thomas, 2016), cardiometabolic health (Lakerveld et al., 2018), and diabetes management (Kwan et al., 2020), among others. With the advent of the COVID‐19 pandemic, scientists have turned to nudge theory once again due to its decidedly noncoercive yet compelling effect on shaping public behavior when official policies fall short (Einfeld, 2019). Debnath and Bardhan (2020), for instance, show how the Indian government used nudge‐like text messaging strategies to promote compliance with public guidelines such as mask‐wearing and social distancing. Similarly, Pierre (2020) attributes the feasible handling of the pandemic in Sweden, a country that kept its economy and social structures largely open yet kept the number of positive cases under control, to the clever use of nudging strategies by the national public health infrastructure; in particular, complementing “hard” coordination, which includes policy levers such as budget allocations and official guidelines, with “soft” coordination nudges, or the daily routine exchange of information, has been credited with much of the nation's pandemic control success. Our study goes a step further by demonstrating the added value of using nudge techniques not just at the official government level but also in a diffused fashion by decentralized economic and social actors such as individual organizations. Specifically, our results indicate that in times of national and international crises such as the COVID pandemic, communicating information about safe behaviors through central channels like the CDC may not be sufficient to ensure the adoption of such behaviors by the public. The power distance between the public and such central agencies may be too great to sustain consistent compliance, but when these vital messages are disseminated through more proximal channels such as one's university, and in a more evocative way, through visual nudges, there is substantial informational value as evidenced by the significance of our results.
Second, we contribute to the nudge theory by introducing the concept of temporal dynamics in the application of visual nudges, which enables us to consider the time it might take from initial infection and incubation period to symptom onset and subsequent testing result to model the effect of visual nudges dynamically. The dynamic impact of nudges, and specifically the effect of prior nudges on future behavior, which goes beyond the limited framework of short‐term decisions to capture long‐term conditioning, has been studied in the realm of economic theory and altruistic behavior in the context of charity (Loomba et al., 2021). Through a series of behavioral experiments and empirical analyses, the authors find that exposure to nudges in the past does indeed inform future behavior, thus demonstrating the learned nature of nudging influence and its internalization potential (Loomba et al., 2021). The results of our study reinforce this notion by showing that signals received ahead of time, from 2 to 5 weeks as our results suggest, have a considerable effect on behavioral outcomes at time t. However, the effect starts to dampen considerably if signaled more than 6 weeks ahead of time. This finding highlights the challenge of “timeliness of information spread during a disease outbreak” to coordinate a speedy intervention (Gour et al., 2022) and further demonstrates the value of combing standard epidemiological models with heterogenous data‐driven modeling approaches (Evgeniou et al., 2023).
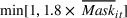
Third, our findings have significant implications for practitioners. To facilitate comprehension of our contributions to policymakers and public health officials, we conduct a counterfactual analysis. To do so, we use an epidemiological model (M4) to forecast the number of new cases per 1000 university population under three counterfactuals of mask images: (1) the observed intensity of images displayed, 

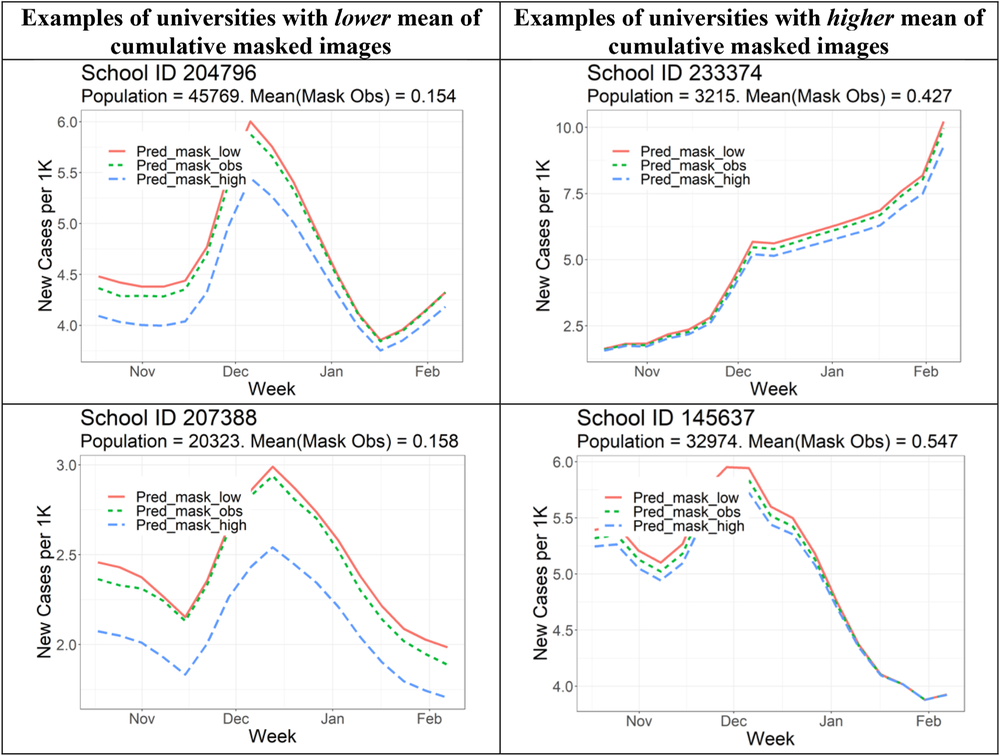
Counterfactual analysis.
We can see that for both scenarios, the predicted number of new cases is lower when universities use a higher intensity of signaling images containing masks. The direction of the effect and its magnitude (ranging from as low as 3% to as high as 15%) are generally consistent with those observed in the econometric and epidemiologic models. Furthermore, we find evidence of the temporal heterogeneity; that is, the mask effect is considerable during the active phase of the semester but declines during holidays and breaks. These findings can be of interest to policymakers and public health officials already using forms of visual nudges in their communication strategies by presenting a viable approach for maximizing the effect of their current and future campaigns. We also find that the effectiveness of visual nudges unfolds in a cumulative fashion, so practitioners may benefit from the intense sharing of content associated with mask‐wearing over a prolonged period of 3 to 5 weeks. Additionally, our findings provide insights for those actors in the information environment that have not yet adapted social media engagement in their crisis management practices. For example, we show such actors that their participation in the crisis information effort is likely to make a difference and also provide guidance on how to initiate such engagement by means of visual nudges most effectively.
Fourth, the results of our analysis revealed that the effect of visual nudges is not uniform across different social media platforms. The “boundary condition” of the visual nudge effect could arise from the following conditions. First, as our data show, there are considerable irregularity in posting visual content including that containing masks on different platforms. This observation is especially notable in the time preceding and around the beginning of the fall 2020 semester, when most of the mask‐related content was consistently shared on IG but not on other platforms. For example, while the average number of weekly photos was five on IG, six on TW, and three on FB, the corresponding share of masked images was 21%, 16%, and 11%, respectively. Second, when examining the visual nudge effect, one should account for the platform differences in terms of the modality of communication. That is, while IG emphasizes visual image sharing, TW and FB emphasize mostly text‐based sharing that can be complemented by visuals. Therefore, it is feasible to expect content shared through IG to activate university stakeholders’ visual information processing and interpretation to a greater extent compared to other platforms given IG's superior aesthetic and visual culture of imagery. Third, as with most social media engagement strategies, it is crucial to consider the compositional differences of the stakeholder audiences that follow the corresponding universities’ social media accounts. To this end, comparing FB, TW, and IG, the largest age group on FB between 2020 and 2022 is that of users between the ages of 25 and 34 (31.5%); IG reports a similar volume of audiences from that age group (31.2%), and a close second is the group between the ages of 18 and 24 (31%); and the largest age group on TW (42%) comprises users between the ages of 18 and 29. 28 Although seemingly similar, these statistics show that unlike the other two platforms, IG maintains a firm hold on Gen Z and millennial audiences who jointly constitute two‐thirds of its users. This is a key differentiating characteristic in the context of university stakeholders since the most populous stakeholder group is that of current students whose age range overlaps with the majority of IG's following.
Finally, there are other contexts at the macro‐ and micro‐levels where visual nudges can be used for public health applications. For instance, our findings can be used in the context of public COVID‐19 vaccination attitudes, especially amid reports of rising reluctance to receive the vaccine among certain social groups and the worrisome spread of COVID misinformation (Loomba et al., 2021). Numerous government officials and public figures such as the Dalai Lama, the US President and Vice President, and all nine Supreme Court justices announced their respective vaccinations, often through visual social media posts, 29 and research shows that this type of nudge is often preferable to traditional regulation levers, which may result in costly, ineffective, and invasive campaigning (Hansen et al., 2016). The effect of the university's social media nudging on COVID‐19 infection rates found by our study could, at least in theory, be related to localized empirical evidence from health communication studies in the COVID‐19 context. For example, a case study conducted by the city of San Jose, California, in collaboration with the Knight Foundation found that the use of “trusted messengers” (or “micro‐influencers”) at the local community level, rather than global celebrities or spokespeople, was associated with increased COIVD‐19 vaccination rates. 30 Unlike the high‐profile social influence campaigns public figures may engage in, the type of visual nudge explored in this paper represents a particular member of the family of classic nudges (discussed in Supporting Information S2) known as a soft nudge (Thaler & Sunstein, 2009). In the context of the dual process theory, which distinguishes between the automatic and reflective cognitive systems employed by decision‐makers, classic nudges differ from other forms of behavioral interventions such as social advertising in that they seek to engage the automatic system responsible for quick and intuitive decisions (Bovens, 2009). In this automatic system framework, soft nudges seek to alter choices without constraining the decision‐maker's opportunity sets; they do not provide material or monetary incentives for changing behavior, nor do they threaten negative consequences if the suggested behavior is not adopted, but rather they help individuals consider aspects of the decision‐making process they would not otherwise have considered (Ehrig et al., 2015). Thus, soft visual nudges constitute images simply depicting desirable public health behaviors such as mask‐wearing, without explicitly stating the value or, alternatively, the cost of (not) adopting this behavior, through text or other communicative strategies. These characteristics make soft visual nudges effective without posing an ethical threat to the communities and individuals exposed to them and are therefore safe and noninvasive. Such nudges can be used in addition to larger‐scale social welfare interventions aimed at changing social norms. At the same time, our findings indicate that in certain cases, soft visual nudges have the potential to cover ground in individual decision‐making left unaccounted for by large‐scale social norm campaigns because of their noninvasive character restricted to invoking the automatic cognitive system only.
CONCLUSION
Using a theoretically informed framework rooted in nudge theory in combination with novel deep learning techniques, we developed a robust econometric model seeking to illuminate the role of organizational social media strategy in mitigating the spread of COVID‐19. We found that using social media posts as a form of visual nudging to promote safe behaviors has a marked effect on COVID‐19 positivity rates, even after controlling for a variety of organizational characteristics and disease dynamics at different levels. We further show that the effect of nudges may not be immediately detectable, as it may take time to be processed and internalized. Specifically, our results suggest that the impact of visual nudges peaks between 4 to 6 weeks after initial exposure. Additionally, we demonstrated the marginal utility of nudging strategies depending on the level of virus spread across organizations, with the most heavily impacted organizations benefiting the most from the use of visual nudges. We believe that our model can be fruitfully adopted not just by medical practitioners but also by large‐scale organizations more broadly in ways that creatively use a channel of communication already in place to overcome the challenges posed by COVID‐19.
Our study is not without limitations. First, we acknowledge that in practice, it is not feasible to definitively say how many students, faculty members, or staff members follow a university's social media account since not all of them will do so. Second, while we address self‐selection bias originating at the university level, such bias can also be present at the individual level in instances when university stakeholders may choose to follow its social media and engage with it or not. Finally, it shall be noted that the inherent volatility of user preferences and engagement leads to constant shifts in platform popularity such that, although the platforms examined in this study have undoubtedly been the preferred online media communication channels for universities and their stakeholders during the analyzed timeframe, new social media platforms (e.g., TikTok, BeReal, VSCO) with a different set of affordances appear on the market and could change the observed dynamics of the nudges.
Footnotes
ACKNOWLEDGMENTS
This project has been funded by the Jump ARCHES endowment through the Health Care Engineering Systems Center.
1
2
3
4
5
6
7
8
In case one of the variables was not provided but the total positivity rate was reported, we used the reported positivity rate to calculate the missing parameter. We focused on the data that represent aggregated student, faculty, and staff measurements. If combined totals were not available, we collected student‐level data (< 8% of entities). Finally, we primarily focused on proactive surveillance/asymptomatic testing.
9
In most cases, entities updated their data on Sunday; however, about 20% did so on Monday or Tuesday. The results of our data collection initiative were publicly available via a dashboard published online from September 7, 2020, to June 1, 2022.
10
11
12
13
A verified badge is a check that appears next to an IG account's name in searches and on the profile. It means that IG has confirmed that an account is the authentic presence of the public figure, celebrity, or brand it represents. IG verification prevents impersonation. This is why verified accounts are exclusive for celebrities, public figures, or global brands. Being verified means that a company is a “big deal” because it is important enough to be at risk of impersonation. Other social media platforms such as TW or LinkedIn use similar features. University account verification is voluntary and largely based on the account managers’ strategic choices behind social media engagement practices.
14
When it comes to COVID‐19 testing policies, in general, universities (and other entities) adopt a testing strategy that implies (i) testing everyone, (ii) testing selected groups, or (iii) a combination of both. In the case of selected group testing, the groups to be tested are selected based on individual entities’ COVID‐19 response strategies and can include but are not limited to undergraduate students (due to the higher risk associated with their behavior), members of sports teams (due to the higher risk associated with potential exposure to others when travelling), staff (due to lower vaccination rates), unvaccinated population, and so forth.
15
See, for example, reports regarding disciplinary actions taken in response to violations of COVID‐19 regulations on college campuses such as: Dennon, Anne (October 2020) “College Students Suspended, Fined for Breaking COVID‐19 Rules” on BestColleges.com (
16
17
18
19
20
21
22
23
24
To compute the median, we arranged all of the scores in numerical order and then calculated the average between the two middle values given the even number of total observations.
25
We used the median to impute the missing values and ensure consistency of the estimates; no bias was observed using all available observations. Instead, the observed effects were more pronounced.
26
27
Similar to the case with CEM model estimation, the sample size has reduced because of the missing values that preclude the current model estimation setup. We used the median to impute the missing values and ensure consistency of the estimates; no bias was observed using all available observations. Instead, the observed effects were more pronounced.
28
29
30
References
Supplementary Material
Please find the following supplemental material available below.
For Open Access articles published under a Creative Commons License, all supplemental material carries the same license as the article it is associated with.
For non-Open Access articles published, all supplemental material carries a non-exclusive license, and permission requests for re-use of supplemental material or any part of supplemental material shall be sent directly to the copyright owner as specified in the copyright notice associated with the article.