Global trade is seafaring commerce; 90% of traded goods are carried by maritime transport, which has become vulnerable to security risks. This has led governments to initiate security programs serving tens of thousands of members worldwide. This paper studies the government's incentive design and the interaction between Customs inspection capacity and the incentives offered in security programs. Using the theory of incentives, we investigate the value of a partnership in improving the security of containerized supply chain. We developed a sequential game featuring the government, firms, and an adversary. The government selects the inspection capacity and incentives to foster the partnership, namely, an operational benefit in the form of a reduced inspection rate, and a security benefit obtained through reductions in the risks of adversarial infiltration. Firms subsequently decide on a collaboration level, followed by a strategic adversary's decision to infiltrate. Using the adversary's best response, we show that, in equilibrium, the government ranks all the firms and induces collaboration with only a subset of them. We demonstrate that, in equilibrium, while security incentives may benefit all participants, tailored operational incentives should be offered strictly to foster collaboration. The required condition to implement the inspection‐free lane for members is also characterized. Our results also inform practice to help security policymakers understand the underlying interaction between Customs inspection capacity and incentive design in forging collaboration with private firms. In particular, as firms opting for collaboration experience lower inspection rates, this further reduces overall congestion, which, in turn, creates a positive externality for nonmember firms. Therefore, having an excess inspection capacity may result in shorter wait times that could dissuade firms from collaborating.
Transporting over 90% of the world's cargo, maritime containers play a massive role in today's global supply chains. This huge volume creates enormous opportunities for illicit actors to infiltrate and abuse this mode of transport. Examples of bad actors include terrorists, smugglers, traffickers, and counterfeiters that pose health, security, and safety risks to people, firms, and infrastructures. With containers undergoing Customs inspections several times throughout their journeys, Customs administrations are at the front line battling these illicit activities. However, Customs alone cannot ensure container safety and security because the physical flow of goods and its related information rest in the hands of companies and supply chains who own the shipments, containers, and vessels. Therefore, government agencies must collaborate with private sector firms to improve the security of supply chains. Private companies also rely on intelligence and enforcement resources owned by governments in reducing the probability of disruption in their supply chains, marking the salience of public–private partnerships for risk and security management of global maritime supply chains.
In this paper, we study the World Customs Organization's (WCO) Framework of Standards to Secure and Facilitate Trade (SAFE) as an example of such partnership. The SAFE framework stresses security measures enhancement by prescribing a set of standards for participating firms. These standards entail fulfilling requirements aimed at managing risk and security issues in cargo, processes, personnel and physical assets, among many others (World Customs Organization, 2021). This framework for one member state of the European Union is called Authorized Economic Operator (AEO) and has more than 10,000 certified partners (European Committee Taxation and Customs Union, 2015). In the United States, this is known as Customs‐Trade Partnership Against Terrorism (C‐TPAT) with over 11,000 members (U.S. Customs and Border Protection, 2021). These standards are mutually recognized by the United States and the EU and several other countries.
The ultimate goal here is to collaboratively establish supply chain security for all parts of the supply chain, from container origin to destination. These programs aim to mitigate the risk of serious infringements that include smuggling, those related to Intellectual Property Rights, counterfeiting, terrorist activities, and others (European Commission, 2016). Throughout this paper, we refer to the infiltrating party as an adversary perpetrating different types of serious infringements.
Because of the voluntary nature of these programs, one of the main challenges is to design an incentive mechanism that encourages parties to implement and comply with the standards laid out in the program guidelines. Carrying out these dictates is costly for companies. One customs survey found that the three greatest implementation costs exceeding $55,000 arising from (i) establishing and improving physical security, (ii) setting up and tightening information technology systems and database development, and (iii) paying the salaries and expenses of personnel hired or contracted specifically to implement and manage the program (The Journal of Commerce, 2017). Firms thus seek apparent incentives and immediate benefits to justify the costs of certification and compliance. The benefits accruing to participants could be broadly categorized as two types. First, a certified member is assigned a lower risk score that may reduce the number of Customs checks carried out on their documents and goods at ports of entry (European Commission, 2016). Our model calls this operational benefit (OB). Second, through regular audits and training offered by governments, certified members benefit from state‐owned intelligence resources that better guard their supply chains against possible adversarial infiltration. We call this security enhancement benefit in our model.
Operational incentives yield lower waiting and processing times for containers at ports of entry. However, processing time also depends on the availability of inspection capacity. Thus, in order to ensure the effectiveness of these security programs, it is vital to align the Customs' strategic capacity decisions with operational incentives offered to member firms. Too much inspection capacity renders membership operational incentives less effective because all parties, regardless of membership status, enjoy rapid processing at ports of entry. However, a lack of Customs capacity may delay timely cargo clearance while degrading the effectiveness of security programs in detecting and deterring shipments as to serious infringements (The Journal of Commerce, 2016).
Strategically, the degree of collaboration between the government and the firm determines the risk of infiltration by adversaries. Specifically, a high level of collaboration between the state and the firm may deter the strategic adversary from infiltration. Meanwhile, low‐level collaboration could make a supply chain more susceptible to adversaries. This is supported by evidence‐based studies suggesting that adversaries are purposeful agents engaging in adaptive decision processes (Arin et al., 2011; Jaspersen & Montibeller, 2020). The main research questions that we strive to address in this paper are:
How should the operational and security enhancement incentives be best designed to foster collaboration between governments and supply‐chain firms? Additionally, how can Customs inspection capacity be optimized to support the incentive mechanism without hindering trade?
Which firms, and with what characteristics, should be given priority inducement by the government toward collaboration? How should limited public resources be assigned to assist firms in enhancing security status and reducing the likelihood of adversary infiltration?
How does such collaboration generate value for all public and private parties?
To answer these research questions, we have designed a game‐theoretic model with Customs, firms, and adversaries as players. Here, Customs first makes a decision on inspection capacity and the prescription of security requirements that a firm should meet to become a member. Customs also offers both operational and security enhancement incentives to induce compliance with the security program. Then, firms opt whether to become a member or remain a nonmember. Member firms may also enlist security enhancement aid, such as training, offered by Customs. Once the membership status and security level of firms are known, an adversary then decides which firms' containers to infiltrate and with how much effort. Through inspection, Customs can detect and confiscate containers suspicious of serious infringements. When a container escapes detection, this incurs harm to both society and the firm owning the shipment.
A brief preview of our main results is as follows. First, using adversary's best response function, our developed algorithm finds the optimal subset of firms induced for collaboration based on volume, sensitivity to delay, security level, and the impact of successful infiltration. This subset is identified minimizing the total expected cost of congestion plus the risk of adversary's infiltration. Second, our results show that the security incentive, which is a combination of a firm's investment in security compliance (same cost for all firms) plus the government's security enhancement assistance (may vary by firm), is applied mainly to satisfy member participation constraints. Meanwhile, the operational incentive acts more as a screening tool to help the government induce collaboration on a selective set of firms whenever the security incentive fails to induce. Third, our analyses detect an underlying interaction between inspection capacity and incentive effectiveness. In particular, collaborating firms experience lower inspection rates, further reducing overall congestion that, in turn, creates a positive externality for firms declining security partnership. Therefore, if the government wants to induce collaboration from a larger cluster of firms, it must consider cost–benefit implications of inspection capacity versus security and operational incentives. We show that excessive inspection capacity with briefer wait times may dissuade firm membership. Finally, our modeling approach enables the government to assess the scenario of inspection‐free shipping for certified members, dubbed the green lane concept in the U.S. Customs and Border Protection's (CBP) strategic plan (The Journal of Commerce, 2005). We characterize the conditions leading to firms being so securely defended against adversary infiltration, thus allowing Customs to set the inspection rate equal to zero for them. Our results shed light on the value of security partnership for all firms, including members, nonmembers, and the government.
The rest of this paper is structured as follows. In Section 2, we review the relevant literature. Sections 3 and 4 feature our model framework and the Customs container risk‐scoring process, respectively. In Section 5, we analyze our model for the benchmark problem with no partnership between the government and the firms. In Section 6, we analyze the partnership model, and in Section 7, we compare results of these two sections to generate insights on the value of partnership. Section 8 further extends the model to two other cases, and Section 9 concludes the paper.
LITERATURE REVIEW
Globalization of supply chains has increased vulnerabilities to man‐made and security disasters. Yet, security management has not received sufficient attention in the academic Supply Chain Management and Operations Management literature. Extant literature addresses problems mainly related to terrorist attacks. We refer to Gupta et al. (2020) for a comprehensive review of OM‐based research related to the prevention of terrorism. Evidently, supply chain security management has become a major concern for both public and private sectors after the disastrous terrorist attack of September 11, 2001. The public is extremely concerned with the susceptibility of transport abuse by illicit actors that might embed weapons of mass destruction in the shipments. The private sector is further concerned with the costs of both assuring the security of supply chains and avoiding potential disruptions associated with actual and threatened activities of adversaries such as terrorists (Lee & Whang, 2005).
When it comes to supply chain security, maritime shipment suffers from huge exposure to security‐related risks because its massive volume of container transport offers ample opportunities for illicit actors to infiltrate this mode. Since September 11, 2001, emphasis on boosting port and maritime security has led to responses from many national and international public and governmental agencies such as International Maritime Organization (IMO), WCO, U.S. CBP, among others (Willis & Ortiz, 2004).
A stream of literature has examined the role of government and its associated decisions in securing the containerized supply chains in the presence of a passive adversary that is not strategically responding to policies and decisions of public and private parties. Bakshi and Gans (2010) developed an economic model where the state offers firms incentives to improve security upstream in their supply chains in exchange for reduced inspection at ports. Assuming that the adversary may infiltrate into any container, the authors characterized optimal inspection rates of containers as a function of the container risk score. Subject to a limited budget for screening containers under linear modeling of the problem, McLay and Dreiding (2012) aimed to identify the primary security outcome where detection probability is maximized. Other studies have investigated the role of the government in security management, but not necessarily in the context of maritime transport, such as Hausken and Zhuang (2016). Assuming a passive adversary, they have studied problems regarding how the government and firms should form their relationships by exerting safety efforts when exposed to the risk of a disaster, including terrorist attacks. In these papers, the likelihood of the disaster hinges on the efforts of both parties mobilized to reduce the negative impact of the disaster.
A more relevant stream of literature to our paper has cast the adversary as strategic in responding to the decisions and strategies of the securing party, whether public or private. In this line of work, a growing body of literature has studied mainly the logistic problem of resource allocation faced by governments defending themselves against terrorism—often framed as defender/attacker games (Baron et al., 2018; Golany et al., 2009; Hausken et al., 2009; Nikoofal & Gümüs, 2015; Powell, 2007a; Zhuang & Bier, 2007).
In this stream of research, Bakir (2011) and Bier and Haphuriwat (2011) have featured defender/attacker configurations in the context of maritime transportation. Bakir (2011) presented a game‐theoretic model where the government (defender) must allocate resources to secure container transportation in the presence of a strategic adversary who subsequently observes the actions of the government before opting for how to conduct its attack. Results advise how to balance security between nonintrusive inspection capabilities at foreign seaports and the physical security at the destination port.
Bier and Haphuriwat (2011) have examined a similar problem aimed at identifying the right proportion of containers to be screened so that loss to the government (defender) is minimized, highlighting that it may be suboptimal to inspect all containers when lower level inspection may suffice to deter an attack. Haphuriwat et al. (2011) next extended that model (Bier & Haphuriwat, 2011) to identify the required percentage of containers that must be inspected to deter a terrorist from attempting a nuclear attack via container transport. Bagchi and Paul (2017) recently probed the design of the C‐TPAT program where the government sets the required program standards and inspection rates for members and nonmembers, as well as the level of costly espionage effort to detect terrorist activities. They examined the government's allocation of resources between espionage and inspection in securing critical infrastructure, such as a port. Their main results indicated that the government under‐spends in espionage relative to the level that could have minimized congestion. Also, the membership rate (size) of the program has been shown to depend nonmonotonically on the government's policies, such as expenditure on espionage or inspection rates.
To summarize, our paper contributes to the literature on supply chain security by developing a game‐theoretical model featuring the government, firms, and a strategic adversary. In our setting, the public and private sectors collaborate under decentralized decision‐making to invest in the security of containerized supply chain, with the adversary then endogenously opting for its infiltration plan. We consider compliance requirements and resources needed to enhance security (to characterize optimal security incentives), as well as the inspection rate and optimal capacity (to characterize optimal operational incentives), as levers for the government to foster collaboration with the firms. To the best of our knowledge, no prior research has developed a game‐theoretical model of security partnership against an adversary threat featuring these three strategic players.
MODEL FRAMEWORK
We model the problem as an interaction among the government, firms (supply chain stakeholders), and an adversary in a sequential game. We define the planning horizon T equal to the duration for which the firm's membership certification is valid, which is typically 4 years after initial validation (US Congress, 2019). The orderly timing of events and decisions shown in Figure 1 is described below. We list the notation for all parameters and decisions in Table 1.
Table of notation.
Decisions
:
Adversary's level of infiltration on firm i's containers
f:
Cost of complying with the security program during planning horizon T
:
Government's security assistance level allocated to firm i during planning horizon T
:
Binary decision variable that takes 1 if firm invests in the security program to become a member and 0 otherwise
:
Inspection rate for firm i if it becomes a certified member
:
Inspection rate for firm i if it remains a nonmember
r:
Capacity of inspection facilities
Parameters
F:
The operational cost of an inspection facility during planning horizon T
S:
Government total security assistance budget for planning horizon T
:
Firm i's arrival rate
μ:
Service rate of inspection facility
:
Expected loss suffered by firm i if adversary successfully infiltrates through its containers
:
Expected nationwide loss from successful attack from government's perspective
:
Expected nationwide loss from successful attack from adversary's perspective
ω:
Waiting cost per container per unit of time to the government
:
Firm i's delay cost per container per unit of time
γ:
The probability that an infiltrated container escapes detection
:
The inherent security level of firm's supply chain before any security investment
:
Firm i's risk factor
:
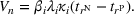
Expected waiting time of a container calculated as a function of
and
for inspection capacity r
Sets
K:
Set of all firms
M:
Set of all member firms
N :
Set of all nonmember firms
Timing of events and decisions.
Announcement stage: We consider Customs as the main governmental agency responsible for creating and maintaining the inspection facilities. At time zero, Customs sets the inspection capacity. This broadly comprises, for example, inspection facilities and staff needed to conduct inspection processes. We let r and F, respectively, indicate the inspection capacity and the cost per each unit of capacity during planning horizon T. In our model, the decision on inspection rate (i.e., operational incentive) is taken after quantifying inspection capacity. This aligns with real‐world practice and governmental maritime security strategy. Namely, the priority mission of Customs is to guard the borders and ensure that products entering countries are safe and secure. Still, Customs has limited resources to control borders; inspection capacity and rates should be set so as to not incur onerous burdens on trading firms. In other words, as stated in the U.S. National Strategy for Maritime Security, securing the supply chains should not result in transportation processes that impair free trade (Department of Homeland Security, 2005). Although setting inspection capacity is a long‐term strategic decision, inspection rates may need to adjust within abbreviated time spans (e.g., annually) in response to changes in the flow of containers, as well as the security and membership enrollment status of firms. We capture these elements using a sequential decision‐making process.
The government sets two types of incentives, namely, security and operational incentives, to lure firms for collaboration. Security incentives embody two components. The first requires firms to incur compliance costs f in improving their security levels and becoming certified members. This cost includes expenses of complying with C‐TPAT and has two components (Gettinger, 2021); implementation costs and maintenance costs. The C‐TPAT implementation costs incurred on average by members are: (i) improving or implementing physical security, (ii) Improving or implementing IT systems/database development, and (iii) salaries and expenses of personnel contracted specifically to implement the C‐TPAT program. Similarly, to maintain the C‐TPAT membership, the importers may incur (i) salaries and expenses of personnel hired/contracted specifically for the implementation of C‐TPAT, (ii) Improving/implementing use of security personnel, and (iii) Improving/implementing physical security. In our model, f represents the sum of all these cost components throughout the time horizon T. We assume that upon investing f, the security level of the firm improves proportionally to make it more difficult for the adversary to infiltrate its cargo. Thus, a firm benefits from security enhancement by becoming more firmly defended against infiltration compared with a nonmember. The second component of the security incentives embodies security assistance offered by the government to member firms. Denoted by
, this comprises training, as well as shared expertise and information, offered by the government to member firms.
Furthermore, other incentives includes assigning a supply chain security specialist to the firm to assist in the process of implementation and validation of the program.
The second incentive type (operational) offers the waiting time
and a reduced inspection rate for collaborators. Here, the inspection policy for member firm i means inspecting a fraction
of its containers, while policy dictates inspecting a fraction
of containers should firm i remains nonmember,
.
Collaboration stage: Each firm independently opts whether to enroll under security guidelines or not. We let
be assigned 1 when firm i opts to invest f and become a member, and 0 otherwise. We assume each firm decides on collaboration simultaneously. We define M and N as the sets of member and nonmember firms. To capture the collaborative relationship between government and firm, we assume that security incentive
is conditional on the firm's decision
through the constraint
, where G is a big number. In other words, the government may assign
to help firm i enhance its supply chain security only when firm i becomes a member,
.
Infiltration stage: We model the game sequentially, hence, the adversary responds strategically after each firm, either member or nonmember, decides on its security level. Note that we have adopted a common approach in the defender–attacker literature in which the defender, as the leader of the game, moves first by allocating limited resources among a set of targets, and the attacker, as the follower, chooses which target to attack and what level of effort to choose to maximize his payoff/damage (Guan & Zhuang, 2015; Nikoofal & Zhuang, 2012). In our problem, the total defense budget on firm i's containerized supply chain is the outcome of the firm's participation decision, which is
. The strategic adversary, as the follower, can assess the total level of defense allocated to each firm's supply chain and then decide on his infiltration plan. Note that, the adversary does not necessarily observe the firm's participation decision, but, he can assess the total defense budget allocated to each firm, that is,
if
and
if
.
Under this setting, one can study the effectiveness of the defender's defense resource allocation in response to the attacker's threat. The literature in this stream assumes that the attacker behaves strategically by optimally responding to the defender's resource allocation. Under this assumption, the defender, as the Stackelberg leader, can strategically manipulate the attacker's response and predict which target will most likely be attacked (Bier et al., 2008; Nikoofal & Zhuang, 2015; Powell, 2007b; Zhang & Ramirez‐Marquez, 2013; Zhuang & Bier, 2007). Similar to these studies, in order to have a manageable mathematical model to help us answer the main research questions (i.e., to characterize the value of public–private partnership), we assume that the game is played sequentially implying that an adversary can observe the total security investment of each firm. This assumption is also supported by the nature of these standards. It is because security measures required by C‐TPAT or AEO are mostly related to people and physical security that are observable by the adversaries. For example, cargo handling and storage facilities must have a physical barrier to deter unauthorized access, gates must be manned and monitored, private passenger vehicles should be prohibited from parking adjacent to cargo handling and storage areas and security technologies should be used to monitor premises (Customs and Border Protection, 2019). These types of actions could easily be observed by the adversary before planning any infiltration. Furthermore, we assume that the membership status of firms is public knowledge and can be observed by the adversary. This is aligned with practice as companies reveal their membership status. This is because many companies prefer to work with certified suppliers, carriers, and so on. As an example, Apple in its supplier's code of conduct, states that to the extent that the supplier transports goods for Apple into the United States, the supplier shall comply with the C‐TPAT (Apple, 2022). In addition to this, governmental agencies provide public databases with the list of member firms. For example, European Commission offers a query page on its website where the membership status of AEO‐certified firms can be verified.
The adversary next decides the level of infiltration effort
in order to maximize its payoff. Rising
reflects a lower likelihood of Customs detecting infringement. Our model assumes that the adversary chooses the effort level
to infiltrate any container of the target firm, aligning with the common assumption in defender–attacker literature (see Bier et al., 2007; Nikoofal & Zhuang, 2015; Powell, 2007a; Shan & Zhuang, 2020; Zhuang & Bier, 2007, and references therein). Note that once a successful attack through a firm's containers is realized, the firm and government may experience different levels of loss. This is because the government is a social planner, hence, any loss that a firm experiences is also counted by the government. Let
and
, respectively, indicate the expected loss suffered by firm i and nationwide loss suffered by the government following a successful attack. Then, we assume
is a lower bound for
, that is,
.
Inspection stage: To carry out container inspection, an inspection rule is executed differentiating inspection rates for members versus nonmembers. We model the inspection process as
queuing where the service time for each facility follows an exponential distribution having a service rate μ. Modeling the inspection process as
queuing offers analytical tractability to compute wait time
, given inspection capacity r. Figure 2 illustrates the inspection process.
Inspection process and congestion with security partnership.
Finally, the expected loss for both firms and the government is evaluated. This will be demonstrated in Sections 5 and 6.
THE RISK SCORING
Once container information such as manifest, bill of lading, and invoice are received, Customs performs a risk assessment and assigns a risk score to each individual container as a probabilistic representation of the threat posed for that container per U.S. CBP's Automated Targeting System (ATS), as well as the WCO's Cargo Targeting System (CTS). In our model, risk score captures the vulnerability of a container to infiltration considering the government, firms and adversary decisions as a function of the: (i) collaboration level between firm and government,
, (ii) firm's investment f in the security program, (iii) government's security assistance
in firm i, (iv) inherent security level of firm i's supply chain before joining the security program,
, (v) adversary's infiltration effort on firm i's containers,
, and (vi) firm's risk factor,
. This risk factor captures the risk level of a container belonging to firm i based on its origin (e.g., geographical region), content, expert opinion, and available intelligence. We let
denote the probability of infiltration, that is, risk score, given that the adversary targets firm i's container. Thus, any firm's container assigned a positive risk score, that is,
, could be inspected.
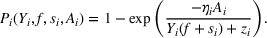
We assume that
increases with
, but decreases with both f and
. Also,
has the following regularity properties: (i)
is twice differentiable with respect to
; (ii)
; and (iii)
. An appropriate candidate for the probability of infiltration function satisfying the above properties is the cumulative exponential function (Bier et al., 2008; Gerchak & Safayeni, 1996; Nikoofal & Gümüs, 2015):
Note from Equation (1) that the adversary may infiltrate a nonmember's container with less effort than what is required for a member's container. As benefits of C‐TPAT are outlined for members in U.S. Customs and Border Protection (2021), the security partners are assigned reductions in their overall cargo risk score. Such reductions, in turn, translate into fewer examinations at import and export facilities.
A BENCHMARK: MODEL ANALYSIS WITHOUT PARTNERSHIP
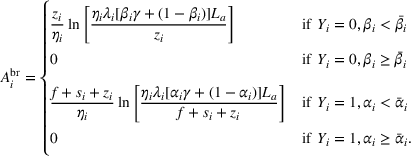
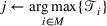
Before analyzing the partnership model, we study the problem as a benchmark where the government and firms do not form a security partnership and thus firms play a passive role. The government sets inspection capacity and rates; then, the adversary decides which container to attack. As the game is played sequentially, we need to work backward and first solve for the adversary's optimal decision.
Adversary's optimization problem
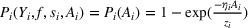
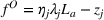
Suppose the government and firms do not form a partnership; that is,
. Then, firm i's risk score in Equation (1) becomes as follows:
. Consequently, the government sees all firms as nonmembers and sets an inspection rate
for each firm i. The adversary next chooses which firm's containers to infiltrate and at what levels of effort
to maximize its payoff. Note that we assume the risk of attack to different targets is independent, but the adversary targets only one shipment. This is aligned with the common assumption in government‐attacker literature that the attacker concentrates his effort to launch a successful attack once and on only one target to incur the highest damage (see Bier et al., 2007; Golany et al., 2009; Nikoofal & Zhuang, 2015; Powell, 2007a, 2007b; Shan & Zhuang, 2020; Zhuang & Bier, 2007, and references therein). In our model, the adversary's payoff increases with the: (i) probability of successful infiltration
, (ii) probability of an infiltrated container escaping detection after inspection, γ, and (iii) expected societal loss when an infiltrated container escapes detection,
, all offset by the level of infiltration effort
. Given the inspection rate
, the strategic adversary seeks to maximize his payoff by launching an attack through firm j's supply chain, where j solves the following equation:
An infiltrated container can remain undetected with probability
. The first term,
, is the probability of not being detected during the inspection arising from type II error, γ, of the inspection process. The second term,
is the probability of the container escaping inspection. Here, the expected loss when an infiltrated container escapes detection is
. We normalize the adversary's marginal cost of infiltration effort to 1 and assume that the total cost of attack linearly increases in
. By optimizing the adversary's payoff function with respect to
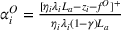
, the best response of the adversary to the government's inspection rate is expressed in Lemma 1.
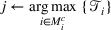
There is a threshold,
, on the customs inspection rate
where the adversary's best response function
is
From Lemma 1, we observe that adjusting the inspection rates is the only strategic instrument the government has to deter an infiltration. Specifically, there is a threshold inspection rate of containers for a firm i,
, where the government can deter the adversary from infiltrating firm i's containers by setting an inspection rate exceeding the threshold,
. Here,
increases with
,
and L but decreases with
. In other words, to effectively deter an adversary, Customs must elevate the inspection rate for a rising arrival rate of containers, the risk factor of firm i, or societal loss from infringement. As intuition suggests, the inspection rate should drop as the inherent security of firm i tightens.
Government's optimization problem
Absent security partnership and per the timing of decisions in Figure 1, the government makes two sequential decisions: (i) the inspection capacity r, and (ii) the inspection rate
for a firm
. We use backward induction to frame the government optimization problem.
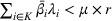
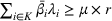
Given inspection capacity r, inspection rate,
, should fulfill the inspection capacity utilization constraint,
. This ensures that the expected arrival rate of containers to the inspection facility does not exceed its expected processing rate. The optimal inspection rate of firm i,
, minimizes the expected loss due to infringement and can be obtained by solving the following Equation (4):
where
is the binary indicator function assigned to 1 when firm i's container is attacked by the adversary, that is,
. Therefore, as long as the capacity utilization constraint is met, the government increases
for each firm j just enough to either deter the adversary from infiltration completely or at least minimize the expected damage when it cannot be completely deterred.
Finding the optimal level of inspection rate
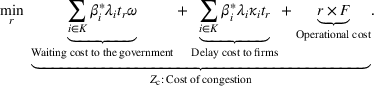
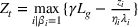
and plugging them into Equation (5), we can find the optimal level of inspection capacity, r, that minimizes the total cost from congestion. The optimal inspection capacity should be set to minimize loss due to congestion, that is,
The first and second terms calculate the government's cost of waiting and the delay to firms, respectively. Waiting cost is denoted by ω per container per time and includes the generic waiting cost to Customs due to congestion at the terminal, that is, the costs related to trucks waiting to be loaded at the container terminal. Delay cost is firm‐specific and may depend on the content of a container for firm i being denoted as
per container per unit of time. This delay cost includes, among others, shortage cost, spoilage cost for perishable goods, and obsolescence cost of fashion products. It also includes customs' cost of handling and storage of the container paid by the firm. Government, as a social planner, should minimize these costs. The last term calculates the investment cost toward inspection capacity. Proposition 1 characterizes the equilibrium absent a security partnership:
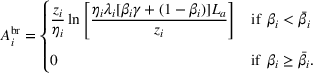
Let
if
and
otherwise. Without a security partnership, given inspection capacity r, the equilibrium characterization is as follows:
If
, then the optimal inspection rate is
, and
.
If
, then
rank the firms with respect to adversary's preference score
where
such that 1 and K indicate firm with the highest and the lowest adversary's preference score, respectively. Let
;
the optimal inspection rate is
for
and
for
and
.
Let
. The optimal level of inspection capacity is
.
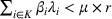
The results of Proposition 1 indicate that when the utilization constraint is not binding, inspection policy is effective in deterring infringement only for firms with a sufficiently high inherent security level, that is,
. For ample inspection capacity, however, a firm's low inherent security level,
, makes it susceptible to infiltration where even 100% inspection by Customs may not effectively deter an adversary, that is,
. This emphasizes the importance of the government's design of incentive mechanisms to enhance firms' security levels. Furthermore, where inspection capacity is limited to the point of capacity utilization constraint being binding, then the inspection will never effectively deter an adversary. It is because the adversary can always identify and target containers not inspected at a sufficiently high rate. This makes critical the aligning of capacity and inspection policy decisions. This result confirms practical evidence suggesting that a lack of resources has made it difficult for Customs to guarantee cargo security (The Journal of Commerce, 2022).
Therefore, as expressed in Proposition 1, the inspection capacity should be set by increasing its level where operational gains from reduced waiting and delay times outweigh the investment costs for greater inspection capacity. This characterization of the equilibrium reveals another interesting insight: inspection rate and capacity reinforce each other because a higher inspection rate demands greater inspection capacity. Therefore, all factors that increase the optimal inspection rate (such as arrival rate, firm‐specific risk factor, or expected loss from adversary attack) or decrease this rate, that is, firm‐specific inherent security level, likewise affect the optimal inspection capacity.
ANALYSIS OF PARTNERSHIP MODEL
In this section, we analyze the case where the state and firms may partner to enhance security. In the benchmark model, the government's security policy includes setting only inspection rate
. With partnership, however, a government's security policy is redefined as
where
indicates the inspection rate for member firm i (
for nonmembers), f is the invested level of security compliance by members, and
is the security enhancement assistance assigned to firm i after being certified as a member.
To analyze the model proposed in Figure 1, we apply the Stackelberg equilibrium concept where the government moves first, followed by the firm and finally the adversary. For a sequential game, we can solve the problem backward. We first solve the adversary's decision on which container to infiltrate and at what effort (
) to exert. We then solve the firm's decision (
) on whether or not to become a member. Given inspection capacity, r, we then characterize the government's optimal security policy. Finally, we analyze the government's strategic decision to obtain the optimal inspection capacity, r.
Adversary's optimization problem
The adversary strategically responds to actions taken by the government and firms by planning to infiltrate any of firm
's containers that maximizes its payoff:
The best response function of the adversary, denoted by
, can be obtained by solving the first‐order condition for its payoff function (6) with respect to the infiltration effort
:
Given the collaboration level
, there are thresholds on the inspection rates of member and nonmember firms, respectively,
and
, where the adversary's best response function,
, is given by
From Lemma 2, we note that the adversary's infiltration effort depends mainly on the collaboration level
between the government and firm i, as well as inspection rates
and
. In addition, Equation (7) indicates that the government can deter adversary infiltration (i.e., inducing
to zero) by raising inspection rates. Specifically for a nonmember firm (i.e.,
), the minimal inspection rate that deters infiltration echoes that in the benchmark case where no collaboration forms. Where the firm is a member (i.e.,
), however, the government can impede adversary infiltration with a lower inspection rate than that set for nonmembers, that is,
as collaboration boosts the defense level of member firm i by
. This essentially means that collaboration not only helps the government reduce the risk of an adversary infiltrating firms (i.e., security enhancement benefits), but it also streamlines the container flow for the member firms (i.e., OBs).
Firm's optimal collaboration level
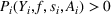
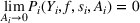
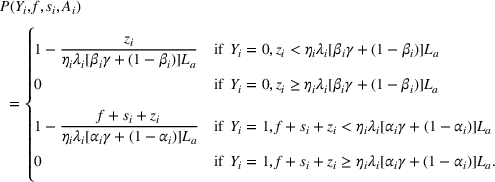
Given the best response function of the adversary, firm i next decides whether to comply with the security program and become a member (see Figure 1) or remain nonmember.1 This decision is made solving the following optimization problem:
where the probability of infiltration
can be expressed by substituting the adversary's best response function characterized from Lemma 2 into Equation (1) as follows:
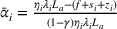
For ease of exposition, we define
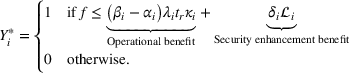
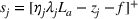
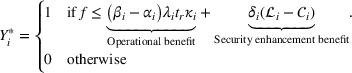
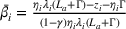
as measuring the reduction in the likelihood of the adversary's infiltration into firm i's containers when it becomes a member and invests in security compliance. The following proposition characterizes firm i's optimal collaboration decision:
Given the government's announcement on
,
,
, and f, then
firm i's optimal collaborative level is:
Given the compliance decision by all firms, then, in equilibrium, there is no profitable deviation for firm i by unilaterally changing his compliance decision
.
From Proposition 2, we note that firm i opts whether to collaborate or not by comparing the cost of collaboration (i.e., f) versus its benefit (i.e.,
). There are two types of benefits: (i) OB that is proportional to the relative difference between waiting costs with and without collaboration, and (ii) security enhancement benefit yielded through improved security. Once a member adheres to the standards outlined in the security program, then expected future damage from security incidents is reduced. This security enhancement benefit is captured by
.
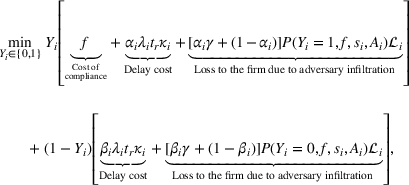
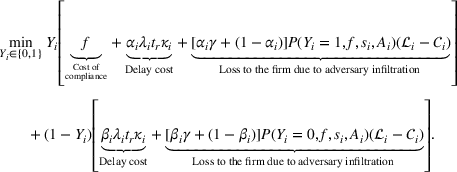
Government's optimization problem
Beyond the nonpartnership benchmark analysis where the only security decision is to select inspection rate
, the government's optimization problem under a security partnership means solving for the optimal values of the following interrelated decisions that induce the best level of collaboration among firms: the optimal levels of inspection rate for members (
) versus nonmembers (
),2 the security compliance level (f), and the government security enhancement assistance (
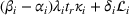
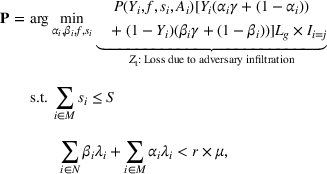
) that minimize loss due to adversary's infiltration threat, all given by:
where
is the binary indicator variable that takes 1 if firm i's container is chosen by the adversary, and 0 otherwise, and where
can be determined from Equation (9). Note that the key step in characterizing the government's security policy is to determine the subset of firms that may be induced for collaboration. To start, let us assume that there is no firm who opts for collaboration. This can be easily achieved by setting
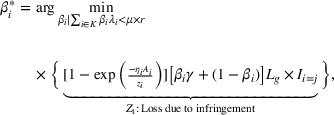
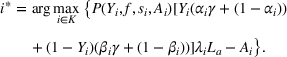
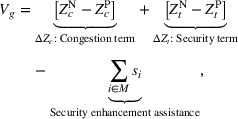
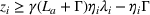
with f sufficiently large. To characterize which firm would be induced for collaboration, we must first identify adversary's most preferred target. This is characterized in the following lemma:
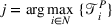
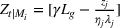
Among all nonmember firms, N, the adversary targets firm
, namely, “adversary preference score”, that enables the government to rank nonmember firms for collaboration in decreasing order in terms of
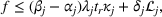
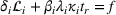
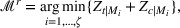
. As we will later see, this yields an efficient iterative procedure where at each step the government may cut the expected infringement loss by inducing collaboration with the most preferred target. With rankings set for candidate firms to be induced by the government, we next identify the conditions where a partnership between firms and the government can be established. With j indicating the firm with the highest adversary preference score, the government's policy decision should satisfy the following two constraints to induce collaboration on firm j:
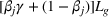
The first constraint (13) is a participation constraint to ensure that collaborating firm j's payoff is larger than that without collaboration as characterized in Proposition 2. Constraint (14) is a deterrence constraint derived from Equation (9) ensuring that the both the level of security assigned to firm j (i.e.,
) and the inspection rate
suffice to deter adversary infiltration of firm j cargo. As the state's security budget is limited, we can show that both the participation and deterrence constraints are binding in equilibrium, thus allowing us to characterize the cost of compliance f and security enhancement assistance
for firm j. The level of security compliance f that satisfies firm j's participation may also incentivize other firms to participate. According to Proposition 2, a nonmember firm i will have an incentive to collaborate as long as the total benefit of collaboration exceeds the cost of compliance, that is,
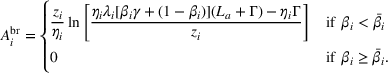
. In this regard, two types of firms arise. The first type enjoys a high security benefit (SB) from collaboration regardless of OB. The second type corresponds to the firms where the SB is too small to cover the cost of compliance, casting the decision to collaborate on sufficiently value‐added OB. Proposition 3 characterizes the government's decisions required to induce firm j for collaboration, as well as the subset of firms (denoted by
) whose participation constraints would also be satisfied once firm j is induced for collaboration:
Let
denote the firm with the highest adversary preference score among all the nonmembers. Given inspection capacity r, find
the government security policy that induces firm j for collaboration is as follows:
if
, then
,
, and
,
if
then
,
, and
;
the list of firms who opt for collaboration, that is,
is as follows:
if
, then firm i opts for collaboration (i.e.,
), receives inspection rate
, and security enhancement assistance
,
if
, then firm i opts for collaboration (i.e.,
) iff
, under which the firm receives inspection rate
, and security enhancement assistance
.
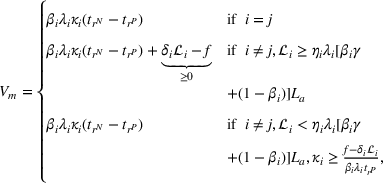
The government's security policy prescribes the adversary's deterrence for: (i) the firm with the highest adversary preference score, that is, firm j, and (ii) others joining the security program, firm i,
. Proposition 3 characterizes conditions in terms of incentive type, delay cost, and infiltration loss for both firm j, and firm i,
where these conditions suffice to deter the adversary. For firm j, the deterrence condition depends on its delay cost,
. A sufficiently small
makes a firm indifferent to the inspection rate. Here, the only relevant incentive is the security enhancement benefit where firm j invests f to harvest the security enhancement benefit
. Next, the government must assign security assistance
to ensure adversary deterrence for this firm. Yet, when
is sufficiently high, firm j invests f to benefit from both operational and security enhancement benefits. When the government assigns
to securely defend this firm, we have
.
Next considering other members, that is, firm i,
, the deterrence condition depends mainly on the loss incurred due to successful infiltration. These firms are offered an inspection rate lower than that for nonmembers only when this loss is sufficiently low and the delay cost is sufficiently high. When the loss is sufficiently low, the merit of security enhancement benefit for the firm decreases. Under sufficiently high delay cost, the firm would prefer to benefit from a reduced inspection rate.
Further results can be drawn from Proposition 3. First of all, when the level of SB exceeds the cost of compliance, the firm collaborates and the government need not offer any OB:
. Note that providing OB here (i.e.,
) may lower
, making it costly for the state to incentivize nonmember firms to collaborate. Per Proposition 2, lower
curtails f. Consequently, additional security assistance
is required to make member firms safe. This same argument applies to inspection capacity r: elevated r reduces
, and the consequent value of OBs accrued by member firms also fades. To counter, the government must increase the level of security assistance to incentivize firms to collaborate on making the maritime supply chain more secure. Therefore, as long as the SB covers the cost of compliance, the state is better off not offering the OB, that is,
. However, if the amount of SB due to collaboration is less than the cost of compliance, then the firm would collaborate only when the unit delay cost
is relatively high. Here, the state may provide OB to make the collaboration break‐even for the participant. This latter observation helps characterize the required conditions to implement the inspection‐free lane where the member can ship with no inspection, that is,
. We detail such conditions in the next corollary:
A firm would qualify for inspection‐free lane if it is
firm j, with the highest adversary preference score, and
;
firm
with
and
.
Clearly, there are two types of members who may qualify to ship using the inspection‐free lane. The first is the firm with the highest adversary preference score (i.e., firm j in Proposition 3) having sufficiently high delay cost. Note that inducing collaboration with firm j having high delay cost lets the government also set a high value of f (according to Proposition 3 where
). Not only does this yield a higher contribution of firm j in its security investment, it also reduces the government's total contribution to membership security investment because f is a common cost that every participant incurs. Hence, astutely offering the inspection‐free lane to firm j curbs the government's total investment in security
. The second member type is firm i who sees a low level of security enhancement benefit from collaboration when
is sufficiently low. To convince such a firm to collaborate and invest f in costly security compliance, the government must therefore offer a significant amount of OB by setting
.
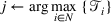
Optimal clustering algorithm
For members clustered in set
per Proposition 3, the government must allocate security assistance resources S to ensure that the adversary is deterred. This means that the adversary would launch its container attack on a nonmember firm belonging to
. To further reduce loss due to adversary infiltration, the state should next induce collaboration on the adversary's most preferred firm among nonmembers, namely
. This requires adjusting cost of compliance f to make collaboration beneficial for firm
. Similar to our earlier discussion, the level of new security compliance f that satisfies firm
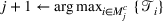
's enrollment may incentivize other firms to join; this specifically includes firm j with its higher adversary preference score based on the original cluster roster. Considering the limit of available security assistance resources S, one can further adjust the security compliance f to lure a larger cluster of firms finding it beneficial to collaborate. Repeating the same process until all firms are induced for collaboration yields Algorithm 1.
Clustering Algorithm for Collaboration
1.
(Initiation) Let . Find
from Proposition 3.
2.
(Prioritization) Let
,
.
3.
(Clustering) Find the security compliance f, the list of participants
and the inspection rate
from proposition 3. Let
.
–
If
then Let
and stop. The clusters are
.
else Let
,
, and go to Clustering step.
Algorithm 1 helps significantly trim the number of potential clusters that can be induced for collaboration in equilibrium. Accordingly, one must rank all firms with respect to
, induce them one‐by‐one for collaboration in decreasing order, and identify others prone to collaborate. Once we identify all the clusters, we can then find the government's total damage as the summation of loss due to adversary infiltration
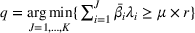
, plus that due to congestion
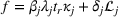
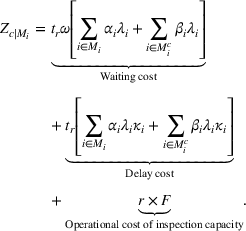
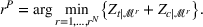
. Given inspection capacity r, the optimal cluster is thus the one that minimizes total cost:
can be found by solving the following minimization problem:
where
and
, and
Note that Proposition 4 characterizes the optimal cluster of firms to be induced for collaboration for a given inspection capacity r. Here, an upper bound for the optimal inspection capacity in the partnership model echoes the optimal inspection capacity in the nonpartner benchmark model, that is,
characterized in Proposition 1. As the inspection rate for all firms in the partnership model is less than that without partnership (
). We can now find the optimal inspection capacity in a partnership model:
In the partnership model, the optimal level of inspection capacity is
Before characterizing the value of a security partnership, we next apply our clustering algorithm to an instance constructed based on container transport data for a number of firms entering the United States.
An illustrative numerical example
In this section, we apply Algorithm 1 to the data for the top 20 US importers that transport via ocean container (The Journal of Commerce, 2022). For the sake of brevity, we present the details of the data and how they are calculated in Appendix C in the Supporting Information. We operated Algorithm 1 for two values of inspection capacity r, where r is set low
and high
, to generate potential clusters. We present results in Table 2 where we identify cluster firms, as well as which receive security enhancement benefits (denoted in column SB) and/or OBs (denoted in column OB). The following observations emerge:
Regardless of inspection capacity, the firm joining a security partnership is always entitled to receive the SB. Note that a compliance decision requires the firm to invest f in its supply chain security. This investment, along with the security enhancement assistance allocated by the government, plus inspection rate
make the member's containerized supply chain a tough target for adversary infiltration. This aligns with our earlier discussion indicating that compliance enrollment yields an immediate SB for the member firm.
Beyond the SB offered to every participant, the decision to provide the OB may vary depending on: (i) cluster size and (ii) firm's market value, and (iii) firm's delay cost. First, firms with a high expected SB (whose market value may significantly drops due to a successful infiltration) may collaborate even when not offered OBs. This corresponds to Walmart, Home Depot, Samsung, and Nike with high
. Second, the number of participants who enjoy OB drops when clusters grow in size, that is, from cluster 1 to cluster 4 (respectively, cluster 3) when
(respectively,
).
The rationale behind this observation is as follows. To induce other compliant firms, the state must provide: (i) SB by increasing security assistance resources allocated to members, and/or (ii) OB by reducing wait time via lower inspection rate. Each member firm receives the SB itself, thus not impacting a nonmember firm's partnership decision. However, a reduced inspection rate for a member firm curtails wait time
to benefit both members and nonmembers. This implies that larger cluster size may favor nonmembers more, thus making participation less attractive. Hence, the government may stop offering OB to members in order to indirectly make the noncompliance decision more costly for nonmembers. That said, when the size of the cluster is small, reducing the inspection rate becomes more effective and acts as a screening tool to differentiate firms especially under a high delay cost. Thiscorresponds to the last part of Proposition 3 where the potential member demands a reduced inspection rate (Dole Food, Dollar Tree, Sumitomo, and Fresh Del Monte in clusters 1 and 2).
The government may fare better offering the OB to participants of large clusters (e.g., cluster 5) only when inspection capacity is low
. Note that, high inspection capacity makes OB less attractive for firms because the wait time of containers at the inspection facility,
, is already shortened. However, in the case of low inspection capacity
, a limited incentive generated via OB assures firm's collaboration while retaining the firm's contribution to security investment, that is, keeping f as high as possible. Note the firm's participation condition in Proposition 2 capping such cost (i.e., f) at
. This cap is decreasing in r while increasing in
. Therefore, when r is low, in order to retain the firm's contribution to security investment (i.e., keeping f as high as possible when r is high), the government may offer a reduced inspection rate.
Finally, the government offers inspection‐free lane only when inspection capacity is low. Also, when the inspection‐free lane policy is offered, it is offered for the relatively small clusters. Note that the inspection‐free lane policy is an extreme version of OB. Therefore, it is most effectiveness when there are fewer number of member firms in the cluster and the inspection capacity is relatively low (i.e., clusters 1 and 2 with
).
Clustering top 20 US importers for different values of inspection capacity.
Cluster 1
Cluster 2
Cluster 3
Cluster 4
Firm
SB
OB
Firm
SB
OB
Firm
SB
OB
Firm
SB
OB
Walmart*
+
Walmart
Walmart
−
Walmart
−
Dole Food
Dole Food
Dole Food
Dole Food
−
Dollar Tree
Dollar Tree
Dollar Tree
Dollar Tree
−
Sumitomo
+
Sumitomo
Sumitomo
Sumitomo
−
Target*
+
Target
Target
−
Fresh Del Monte
Fresh Del Monte
Fresh Del Monte
−
Home Depot*
−
Home Depot
−
Lowe's*
−
Samsung
−
LG Group
−
IKEA
−
Nike
−
Williams
−
Ross stores
−
GE Appliances
−
Newell Brands
−
MS Int.
Dollar General
Heineken
−
Electrolux
Cluster 1
Cluster 2
Cluster 3
Firm
SB
OB
Firm
SB
OB
Firm
SB
OB
Walmart*
−
Walmart
−
Walmart
−
Home Depot
Home Depot
−
Home Depot
−
Dole Food
Dole Food
Dole Food
−
Dollar Tree
Dollar Tree
Dollar Tree
−
Target*
−
Target
−
Lowe's
Lowe's
−
Sumitomo
Sumitomo
−
Fresh Del Monte
Fresh Del Monte
−
Heineken
Heineken
−
Samsung*
−
LG Group
−
IKEA
−
Nike
−
Williams
−
Ross Stores
−
GE Appliances
−
Newell Brands
−
MS Int.
−
Dollar General
−
Electolux
−
In the above table, “SB” and “OB” indicate security enhancement benefit and operational benefit, and whether the firm receives any benefit “
” or not “−”, respectively. The sign “*” in each cluster indicates firm “j” in algorithm 1; firm with the highest adversary preference score. The sign “+” indicates firm who would be qualified to ship under inspection‐free lane. System parameters:
;
;
;
.
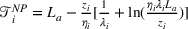
VALUE OF SECURITY PARTNERSHIP
In Sections 5 and 6, respectively, we characterized equilibria both without and with security partnership. To understand the value of partnership for the government, we need to compare the government's total loss under each scenario. We use the superscripts “P” and “N” to define equilibrium outcomes with and without security partnership, respectively. As discussed in Section 5, absent security partnership, there is no opportunity for collaboration as the government thus sets the inspection rate for all firms to minimize expected loss due to adversary infiltration (indicated by
). The government next finds the optimal inspection facility capacity (indicated by
) to minimize the total cost of congestion (indicated by
). With security partnership, however, the government can reduce expected losses from adversary infiltration and congestion to
and
, respectively, by inducing collaboration with an optimal cluster of firms per Proposition 4. The next proposition characterizes the value of security partnership for the government, member, and nonmember firms.
Let
denote the optimal inspection capacity without security partnership. Given
, let M denote the optimal cluster of firms induced for collaboration in Proposition 4. Then,
the value of security partnership for government is
let
. The value of security partnership for member
is
the value of security partnership for nonmember
is
We next discuss how the security partnership yields value for the government and for the firms, starting with each firm type.
Value of security partnership for member firms: The government can induce collaboration with firms by offering security (through lowered risk of adversary infiltration) and/or operational (through lower inspection rate) incentives. The former is always offered to the members (incurring investment cost f for the firm). However, the latter would be offered only where the SB alone fails to compensate the cost of compliance f for the member firms (refer to Proposition 3). Now if the firm induced for collaboration is the most preferred target for the adversary (i.e.,
in Equation 17), then the government, depending on delay cost
(see Proposition 3), may offer just security or both security and OBs. Irrespective of the benefit composition, the government always satisfies the participation constraint of member firm j and sets the compliance cost f equal to the total incentives. Therefore, the value of security partnership for member firm j is the expected waiting cost difference with versus without the security partnership.
This can be positive or negative because inspection capacity (i.e.,
and
) can differ at optimality. That said, for the same level of inspection capacity, that is,
, the value of security partnership is always positive because some members may ship under lower inspection rates when the security partnership is implemented, thus curtailing total congestion, that is,
. For all other firms in the cluster (
), the value of security partnership depends on whether the cost of compliance f exceeds the SB
. If the cost of compliance is less than the SB, then firm i in the cluster enjoys a positive value of security partnership as long as the positive portion (i.e.,
) is not consumed by the difference in expected waiting cost
. Otherwise, where the cost of compliance is not covered by the SB, the government provides just enough OB to make the firm's participation constraint binding, and the value of security partnership for the member thus arises from the difference in expected waiting cost with versus without the security partnership.
Value of security partnership for nonmember firms: The value of security partnership for a nonmember is simply the difference in expected waiting cost with versus without the partnership. Note that the optimal capacity of inspection facility may differ with versus without the partnership; therefore, the value of security partnership is positive for the nonmember firm when
. Otherwise, that is,
, it would be positive only if the reduced inspection rate for members under the security partnership results in a lower wait time at the inspection facility (i.e.,
).
Value of security partnership for the government: Note from Equation (16) that the value of security partnership for the government consists of three terms. The first is the congestion term capturing its impact on the total congestion cost. As the optimal number of inspection facilities with security partnership differs from that without security partnership, the congestion term is not necessarily positive for the government. That said, for identical inspection capacity (i.e.,
) we can verify the congestion term to be nonnegative, that is,
. The rationale is as follows. With the help of security partnership, some cluster firms may receive the OB that reduces the total expected wait time. Here, the total waiting cost with security partnership is less than or equal to that in its absence.
The second component is the security term arising from the partnership helping the government deter adversary infiltration for cluster firms but at the expense of security enhancement assistance (i.e., the third component). Recall that the total security allocated to the members' supply chain (which is
), together with the inspection rate (
), suffices to deter adversary infiltration of member containers. This implies that under security partnership, the government can expect an adversary attack only for a nonmember container that is less likely to occur versus no collaboration. Therefore, the security term is always nonnegative for the government, that is,
.
Sensitivity analyses
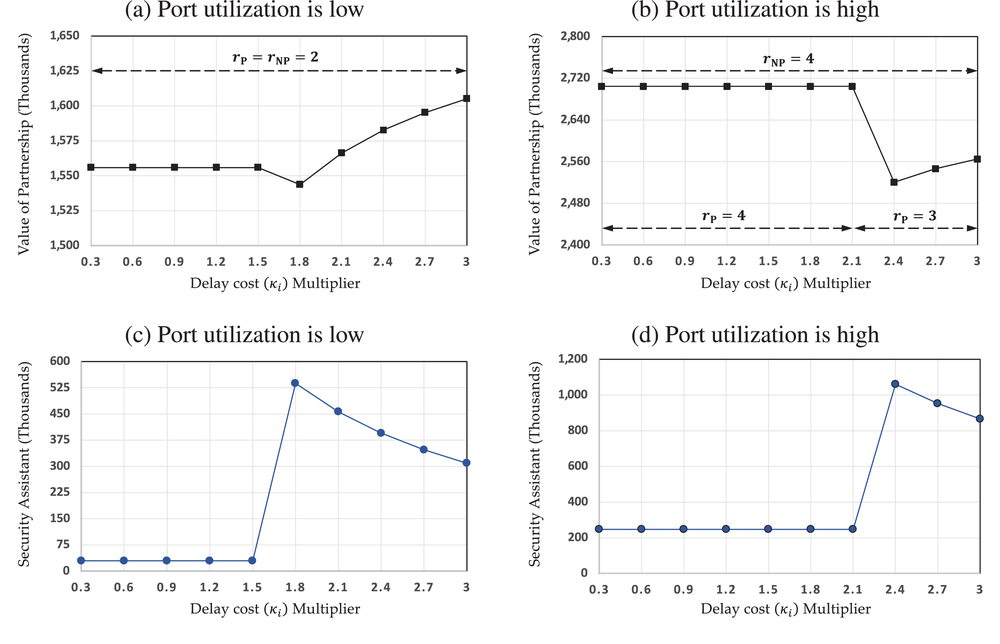
In what follows, we use the data presented in Table 1 in Appendix B in the Supporting Information (Top 20 US Importers, 2022) to study the value of security partnerships from the government perspective. We conduct a numerical experiment by changing the port utilization rate, delay cost to the firms, and expected loss due to adversary attacks. With varying delay cost, we study the impact of OBs. Then, changing the expected loss due to adversary attack generates insights on the impact of SBs.
Value of Public‐Private Partnership (PPP) with respect to firms' delay cost
Figure 3 shows how the value of security partnership may change when the port utilization rate (i.e.,
) changes and the firms delay cost,
, increases. To explore the impact of delay cost, we multiply the initial delay cost (see Table 1 in Appendix B in the Supporting Information) by some factors k,
. First of all, the value of security partnership is positive for the government for both low and high port utilization rates (refer to Figure 3a,b). This implies that the total benefit of partnership always offsets the total allocated security assistance that may be used to induce collaboration. Second, the value of security partnership may increase or decrease when the firms' delay costs increase. Note that the delay cost affects the amount of operational incentives that a firm may need in order to collaborate. As the firms' delay costs increase, offering OBs becomes a more effective tool for the government to differentiate the firms and offer a reduced inspection rate only when needed. This is true as long as the cluster of firms who collaborate in equilibrium is fixed. However, with the higher delay costs, the government may induce collaboration on a larger cluster of firms in equilibrium. This requires spending more security assistance that, in turn, decreases the value of security partnership; refer to the value of security partnership for government in Proposition 5, Equation (16). This can be verified in Figure 3c (respectively, Figure 3d) moving from multiplier 1.5 to 1.8 (respectively, from 2.1 to 2.4).
Value of security partnership for the government with respect to firms' varying delay cost. (a) Port utilization is low. (b) Port utilization is high. (c) Port utilization is low. (d) Port utilization is high.
Finally, a security partnership is more valuable for the government when the port utilization is high compared to when it is low. Given the same level of delay cost this can be observed by comparing the value of security partnership in Figures 3a,b. This is because as the utilization becomes higher, the government can leverage both OBs and strategic capacity decision to induce larger clusters. We observe that with the increase in utilization rate, the government strategically reduces the inspection capacity to create an operational incentive for firms, should they comply (refer to Figure 3b where
and
=4). The reduction in inspection capacity allows the government to increase waiting time, hence offering a reduced inspection rate becomes an attractive incentive for the firms.
Value of PPP with respect to firms' expected loss due to adversary attack.
may affect the value of security partnership. First of all, one can observe that the value of security partnership remains unchanged as the multiplier increases (for multiplier ≥0.9 when utilization is low, and for multiplier ≥1.5 when utilization is high). This is because, for high values of
, all firms find the security assistant benefit of the partnership sufficiently high to collaborate. Second, a security partnership is more valuable for the government when the port utilization is high compared to when it is low. The rationale behind this observation is related to the impact of higher inspection capacity on decreasing the cost of congestion. Particularly, as all firms already found collaboration an attractive option to deter the threat from adversary, the government, as a social planner, would increase the inspection capacity (not to incentivize firms to comply but) to decrease the cost of congestion. This motive is different from the previous case when firms' multiplier over delay cost increases, in which the government strategically reduces the inspection capacity to foster collaboration.
Value of security partnership for the government with respect to varying firms'
. (a) Port utilization is low. (b) Port utilization is high.
OTHER CASES
Impact of firm's insurance
In the baseline model, we assume that the firm incurs a loss of
in case of the adversary's successful infiltration. In practice, businesses can buy insurance to get covered for the physical loss or damage to their shipments. In this section, we study how the existence of cargo insurance may affect the government incentives and firm's collaboration decision.
We assume that the firm, no matter whether it collaborates (i.e.,
) or not (i.e.,
), has paid the insurance premium to get covered in the case of the adversary's successful infiltration. We now define
as the insurance coverage amount receivable by the firm if the adversary successfully infiltrated into the firm's containers. Therefore, the firm's decision is to solve the following optimization problem:
Accordingly, the firm's optimal collaborative level is:
From the above equation, one can verify that the existence of insurance coverage reduces the impact of security enhancement benefits on the firm's decision to collaborate. Note that, different from the OB that is readily available if the firm opts to collaborate, the expected security enhancement benefit is an expected one. Specifically, when the firm becomes a member and invests in security compliance, it can benefit from not being infiltrated, hence not incurring the net loss of
, by reducing the likelihood of the adversary's infiltration into firm i's containers (i.e.,
). Therefore, the higher the insurance coverage amount is (i.e.,
), the lower the net saving would be (i.e., (
), making the security enhancement benefit a less attractive incentive, and, consequently, hinders the collaboration.
Cost of failure to the adversary
Customs enforces the law by targeting and penalizing adversaries through monetary policies and legal actions. When the adversary is caught and fails to escape inspection, we here assume it to incur cost Γ. In our baseline model, we excluded Γ to simplify exposition and interpretation using a streamlined number of variables and parameters. In this extension, we investigate the impact of considering this cost to the adversary on our results and analysis. Given inspection rate
, one can verify that Equation (2) would be written as follows:
By optimizing the adversary's payoff function with respect to
, the adversary's best response to the government's inspection rate is expressed in Lemma 4.
Let
if
and
otherwise. The adversary's best response function
is
Lemma 4 indicates that considering the cost of failure in the adversary's payoff function affects the inspection rate required to deter its infiltration threat. We can then verify all the theoretical results with this new characterization of
.
Value of security enhancement assistance
In this section, we analyze a partnership model without any security enhancement assistance. This means the government may only offer operational incentives, hence firms can benefit from shipping under a reduced inspection rate (i.e.,
) when they become a partner by complying with security standards outlined in the program. Details of this model can be found in Appendix C in the Supporting Information. This serves as a benchmark to compare with our partnership model presented in Section 6, allowing us to generate insights on the value of the government's offering security enhancement assistance S. Let superscript “O” denote a partnership model under only operational incentives.
Let
. Given the inspection capacity r, in equilibrium,
the government security policy that induces firm j for collaboration requires
,
,
;
if
then firm i opts for collaboration, that is,
, and ships under inspection rate
.
The first part of Proposition 6 characterizes the deterrence condition for the adversary's most preferred target j. This implies that the security compliance level
invested by firm j is enough to secure its cargo and thus ship via the inspection‐free lane (
). This differs from prior results in Proposition 3 where the government offers security enhancement assistance. Proposition 3 showed that the most preferred target j may or may not be qualified for the inspection‐free lane depending on delay cost
(first part of Proposition 3). When delay cost is sufficiently low, in lieu of offering a reduced inspection rate (i.e., operational incentives), the government uses security enhancement assistance S to fortify the security of firm j. This readily means that the: (i) OB for firm j (the adversary's most preferred target) is higher in the model with only operational incentives (i.e.,
The second part of Proposition 6 characterizes the optimal cluster of firms for whom investing in security compliance is economically beneficial. Given here inspection capacity r, Proposition 6 indicates only one cluster of firms,
, enrolling to collaborate. This markedly differs from the partnership model in Section 6, where, under security enhancement assistance, the government may form various clusters (see Algorithm 1) to then choose the optimal one per Proposition 4. To summarize, the availability of security enhancement assistance S helps the state contribute toward a firm's total security level (i.e.,
) that, in turn, reduces the firm's own security contribution (i.e.,
). This fosters a firm's collaboration level, thus luring more firms to collaborate. This also equips the government more options in offering a tailored mix of operational‐security incentives depending on a firm's specific parameters. As a result, the expected wait time at an inspection facility may drop (i.e.,
) to benefit both members and nonmembers.
CONCLUDING REMARKS
Summary and discussion
In view of the burgeoning volume of containerized transport facing imminent risk of infiltration, port security emerges as the Achilles' heel in many national economies. This paper examines the value of a public–private partnership in elevating the security of containerized supply chains to minimize the risk of adversary infiltration. We have developed a game‐theoretical model featuring three strategic players: government, firms, and adversary. The government first selects inspection capacity to next offer the firms incentives to form a public–private partnership. Firms respond to these incentives by determining their levels of collaboration. Finally, the overall level of collaboration induced by the incentives determines the level of threat from a strategic adversary that ultimately decides on its attack level.
By comparing equilibrium characterizations with versus without security partnership, we extract the value of partnership for the state, as well as for members and nonmembers. In general, a security partnership yields SBs and OBs exerting different cost–benefit implications for these stakeholders. In terms of security, the partnership offers benefits mainly for member firms as it helps curb the risk of attack from an adversarial infiltrator. On the other hand, security partnership operationally reduces congestion for the whole inspection facility. This means shorter wait times for port operations. Although this benefits all firms—members and nonmembers—our analyses show the government needs to account for the cost of providing SBs and OBs when maximizing security partnership value. Specifically, OBs merged with SBs become more cost‐effective for the government when inducing smaller clusters as the screening power of the former is amplified when used selectively. That said, a smaller cluster size may degrade the value of a security partnership. Indeed, according to a recent article posted on The Journal of Commerce (2017), firms react to SBs and OBs differently depending on program size. Therefore, the government must find a way to sustain a large security partnership such as C‐PTAT without incurring excessive costs. Equilibrium characterization under security partnership enables us to distill the required conditions for exploiting an inspection‐free lane where a member can ship with no inspection. Here, offering the inspection‐free lane to a most preferred firm for the adversary helps the government reduce its total cost of security investment incurred in all member supply chains.
Recommendations for policymakers
Based on our analysis, the following recommendations can be made for policymakers:
Align capacity decision and security programs. The endgame in developing and implementing security programs is to deter adversaries from abusing the flow of maritime container transport while ensuring the security, health and safety of people, firms, and infrastructures without imposing a barrier to oceanic trade. However, as our analysis shows, the effectiveness of such programs deteriorates where inspection capacity is scarce. In other words, if state supervision and inspection capabilities toward container flow proves lacking, then it becomes impossible to deter adversaries from infiltration. Hence, it is of utmost importance to align inspection capacity decisions with security standards and incentives.
Diligently set the inspection rates for members and nonmembers. As mentioned earlier, available inspection capacity plays a salient role in ensuring the effectiveness of security programs. Still, this is a double‐edged sword and must be handled very carefully for the following reasons. Inadequate capacity harms the effectiveness of security programs, while overcapacity dissuades firm membership because the availability of ample inspection capacity reduces everyone's inspection processing time. Thus, firms may not see operational value in becoming a member by investing to enhance their security level. Here, Customs must strategically tailor inspection rates for members and nonmembers. This becomes especially relevant with modernized inspection tools and the availability of fast, effective technologies.
When advertising security programs, emphasize the security enhancement benefits. Membership lets firms enjoy security enhancement benefits and (perhaps) OBs. Security enhancement benefits are hidden and intangible while OBs are overt for instant realization by member firms. As our analysis shows, all member firms individually enjoy security enhancement benefits while OBs supplement to incentivize firms where security enhancement benefits do not suffice to induce collaboration. This could impede inducing firms to invest in security standards and measures when they may not realize OBs at all, or when these benefits alone may not cover the cost of program compliance. Thus, greater emphasis should feature security enhancement benefits when communicating to firms the advantage of complying with security programs.
Make SBs (partially) tangible by offering security enhancement assistance or security subsidies. As our results show, deterring adversaries with inspection—even under a 100% inspection rate—may not suffice. Developing partnership mechanisms may raise effectiveness, but firms may not readily experience tangible benefits. Governments can address this by offering overt, tangible benefits such as subsidizing investment cost or offering security assistance to members. These can better incentivize firms to join these programs. By offering security assistance, part of the security investment costs is borne by the government, making it more attractive for firms, particularly ones not highly appreciating the OBs.
Future research
The model presented in this paper can extend in multiple directions. As our work assumes that the adversary is strategic and responds optimally to the government and to firms' decisions, such behavior does not represent all adversarial activities in recent history. Indeed, the container selection criteria of a nonstrategic adversary may be influenced by factors not readily available or measurable government‐wise. Therefore, one possibility could develop a model that considers two different types of adversary: strategic and nonstrategic. A strategic adversary chooses a container by accounting for the total security assigned during the collaboration stage, while a nonstrategic adversary of preference unknown by the government and firms may select a container irrespective of its assigned security level. This may result in a model featuring information asymmetry where the type of adversary (strategic, nonstrategic) goes undetected by the government. Another extension may analyze a model under information asymmetry where the government's security assistance level assigned to a member's supply chain is not observable by the adversary.
Second, for the sake of analytical tractability, we have considered only a single inspection stage. This might deviate from the inspection process in reality. For example, under C‐TPAT membership compliance, all containers undergo a primary inspection stage demanding nonintrusive inspection that may include neutron and gamma‐ray radiation monitoring. Furthermore, based on the results of this primary inspection, a fraction of these containers may be tagged for secondary inspection, corresponding to our single‐stage inspection. This second inspection may include tests such as gamma and x‐ray radiography, as well as a comprehensive manual inspection. Although we have not analyzed a two‐stage inspection model, we expect that considering two stages of inspection in our model may foster collaboration because this may increase wait times at the inspection facility where firms have more incentives to collaborate in order to benefit from inspection‐free shipping.
Footnotes
1
Suppose firm i's revenue from container transportation business is
Ri$\mathcal {R}_i$
. We assume that the container transportation business is profitable for the firm even if the firm (i) ships under 100% inspection rate no matter whether it opts for collaboration or not, (ii) is vulnerable to infiltration threat; that is,
For expositional purpose, we detail the relationship among
tr$t_r$
,
αi$\alpha _i$
,
βi$\beta _i$
, and the firms' collaboration decisions in the Appendix in the Supporting Information.
ORCID
Mohammad Ebrahim Nikoofal
Morteza Pourakbar
Mehmet Gumus
References
1.
Apple. (2022). Apple supplier code of conduct. https://www.apple.com/supplier‐responsibility/pdf/Apple‐Supplier‐Code‐of‐Conduct‐and‐Supplier‐Responsibility‐Standards.pdf
2.
ArinK. P.LorzO.ReichO. F.SpagnoloN. (2011). Exploring the dynamics between terrorism and anti‐terror spending: Theory and uk‐evidence. Journal of Economic Behavior & Organization, 77(2), 189–202.
3.
BagchiA.PaulJ. A. (2017). Espionage and the optimal standard of the Customs‐Trade Partnership Against Terrorism (C‐TPAT) program in maritime security. European Journal of Operational Research, 262(1), 89–107.
4.
BakirN. O. (2011). A Stackelberg game model for resource allocation in cargo container security. Annals of Operations Research, 187(1), 5–22.
5.
BakshiN.GansN. (2010). Securing the containerized supply chain: Analysis of government incentives for private investment. Management Science, 56(2), 219–233.
6.
BaronO.BermanO.GaviousA. (2018). A game between a terrorist and a passive defender. Production and Operations Management, 27(3), 433–457.
7.
BierV. M.HaphuriwatN. (2011). Analytical method to identify the number of containers to inspect at US ports to deter terrorist attacks. Annals of Operations Research, 187(1), 137–158.
8.
BierV. M.HaphuriwatN.MenoyoJ.ZimmermanR.CulpenA. M. (2008). Optimal resource allocation for defense of targets based on differing measures of attractiveness. Risk Analysis, 28(3), 763–770.
9.
BierV. M.OliverosS.SamuelsonL. (2007). Choosing what to protect: Strategic defensive allocation against an unknown attacker. Journal of Public Economic Theory, 9(4), 563–587.
10.
Customs and Border Protection. (2019). Minimum security criteria: U.S. Importers. https://www.cbp.gov/sites/default/files/assets/documents/2019‐Dec/CTPAT%20U.S.%20Importers%20MSC%202019.pdf
11.
Department of Homeland Security. (2005). Maritime commerce security plan for the national strategy for maritime security. (Technical report). Department of Homeland Security. https://www.dhs.gov/sites/default/files/publications/HSPD_MCSPlan_0.pdf
12.
European Commission. (2016). Authorised economic operators guidelines. (Technical report). European Commission.
13.
European Committee Taxation and Customs Union. (2015). Authorised Economic Operators (AEO). (Technical report). European Commission. http://ec.europa.eu/taxation_customs/dds2/eos/aeo_consultation.jsp?Lang=en
14.
GerchakY.SafayeniF. (1996). Perfect information with potentially negative value: An intriguing war story and a possible explanation. Journal of the Operational Research Society, 47, 710–714.
15.
GettingerM. (2021). Everything you need to know about C‐TPAT and total landed cost. (Technical report). Thomas Publishing Company. https://www.thomasnet.com/insights/c‐tpat‐and‐total‐landed‐cost/
16.
GolanyB.KaplanE. H.MarmurA.RothblumU. G. (2009). Nature plays with dice–terrorists do not: Allocating resources to counter strategic versus probabilistic risks. European Journal of Operational Research, 192(1), 198–208.
17.
GuanP.ZhuangJ. (2015). Modeling public–private partnerships in disaster management via centralized and decentralized models. Decision Analysis, 12(4), 173–189.
18.
GuptaS.StarrM. K.Zanjirani FarahaniR.GhodsiM. M. (2020). Prevention of terrorism—An assessment of prior POM work and future potentials. Production and Operations Management, 29(7), 1789–1815.
19.
HaphuriwatN.BierV. M.WillisH. H. (2011). Deterring the smuggling of nuclear weapons in container freight through detection and retaliation. Decision Analysis, 8(2), 88–102.
20.
HauskenK.BierV. M.ZhuangJ. (2009). Defending against terrorism, natural disaster, and all hazards. In: Bier, V. M., Azaiez, M. N. (eds). Game theoretic risk analysis of security threats (pp. 65–97). Springer.
21.
HauskenK.ZhuangJ. (2016). The strategic interaction between a company and the government surrounding disasters. Annals of Operations Research, 237(1–2), 27–40.
22.
JaspersenJ. G.MontibellerG. (2020). On the learning patterns and adaptive behavior of terrorist organizations. European Journal of Operational Research, 282(1), 221–234.
23.
LeeH. L.WhangS. (2005). Higher supply chain security with lower cost: Lessons from total quality management. International Journal of Production Economics, 96(3), 289–300.
24.
McLayL. A.DreidingR. (2012). Multilevel, threshold‐based policies for cargo container security screening systems. European Journal of Operational Research, 220(2), 522–529.
25.
NikoofalM. E.GümüsM. (2015). On the value of terrorist's private information in a government's defensive resource allocation problem. IIE Transactions, 47(6), 533–555.
26.
NikoofalM. E.ZhuangJ. (2012). Robust allocation of a defensive budget considering an attacker's private information. Risk Analysis: An International Journal, 32(5), 930–943.
27.
NikoofalM. E.ZhuangJ. (2015). On the value of exposure and secrecy of defense system: First‐mover advantage vs. robustness. European Journal of Operational Research, 246(1), 320–330.
28.
PowellR. (2007a). Allocating defensive resources with private information about vulnerability. American Political Science Review, 101(4), 799–809.
29.
PowellR. (2007b). Defending against terrorist attacks with limited resources. The American Political Science Review, 101(3), 527–541.
30.
ShanX. G.ZhuangJ. (2020). A game‐theoretic approach to modeling attacks and defenses of smart grids at three levels. Reliability Engineering & System Safety, 195, 106683.
31.
The Journal of Commerce. (2005). C‐TPAT importers get ‘green lane’ clearance. (Technical report). JOC.com. https://www.joc.com/maritime‐news/c‐tpat‐importers‐get‐green‐lane‐clearance_20051006.html
32.
The Journal of Commerce. (2016). Lack of US customs funding endangers timely cargo clearance. (Technical report). JOC.com. http://www.joc.com/regulation‐policy/customs‐regulations/us‐customs‐regulations/lack‐resources‐endangers‐customs‐efficiency‐report‐says_20160711.html
33.
The Journal of Commerce. (2017). US watchdog: No way to tell if importers gain from C‐TPAT. (Technical report). JOC.com. https://www.joc.com/regulation‐policy/customs‐regulations/us‐customs‐regulations/us‐watchdog‐no‐way‐tell‐if‐importers‐gain‐c‐tpat_20170214.html
34.
The Journal of Commerce. (2022). JOC top 100 US importer and exporter rankings 2021. (Technical report). JOC.com. https://www.joc.com/maritime‐news/trade‐lanes/joc‐top‐100‐us‐importer‐and‐exporter‐rankings‐2021_20220523.html?destination=node/3683636
35.
US Congress. (2019). H.R.3719: CTPAT Reauthorization Act of 2019. https://www.congress.gov/bill/116th‐congress/house‐bill/3719/text?r=5&s=1
36.
U.S. Customs and Border Protection. (2021). C‐TPAT: Customs Trade Partnership Against Terrorism. https://www.cbp.gov/border‐security/ports‐entry/cargo‐security/ctpat
37.
WillisH. H.OrtizD. S. (2004). Evaluating the security of the global containerized supply chain. (Technical report). Rand Corporation.
38.
World Customs Organization. (2021). AEO implementation and validation guidance. (Technical report). wcoomd.org.
39.
ZhangC.Ramirez‐MarquezJ. E. (2013). Protecting critical infrastructures against intentional attacks: A two‐stage game with incomplete information. IIE Transactions, 45(3), 244–258.
40.
ZhuangJ.BierV. M. (2007). Balancing terrorism and natural disasters: Defensive strategy with endogenous attacker effort. Operations Research, 55(5), 976–991.
Supplementary Material
Please find the following supplemental material available below.
For Open Access articles published under a Creative Commons License, all supplemental material carries the same license as the article it is associated with.
For non-Open Access articles published, all supplemental material carries a non-exclusive license, and permission requests for re-use of supplemental material or any part of supplemental material shall be sent directly to the copyright owner as specified in the copyright notice associated with the article.