
Abstract
We theorize that employees use the performance feedback they receive to reassess their beliefs about the marginal benefit of their effort, which may lead them to increase or reduce their effort. To test our model, we conduct a field experiment at the distribution center of a Fortune 500 firm where employees receive individual performance pay, and we study two types of feedback, individual and relative. The results show that employees react to feedback content in a way that is consistent with the model: They increase their effort if the information provided implies that the marginal benefit of increasing effort is high and decrease it if they learn that it is low. Moreover, performance feedback has a greater impact on the lower quantiles of the distribution of productivity.
Keywords
INTRODUCTION
Organizations are increasing the amount and frequency of the performance feedback they provide to their employees (Cappelli & Tavis, 2016, 2018; Ewenstein et al., 2016). This surge is based on the generalized belief that supplying workers with ongoing feedback can boost their performance. Accordingly, companies are replacing their traditional performance appraisal practices, in which they give performance feedback once per year, with ongoing feedback systems as exemplified by the touchpoint or check‐in systems used by GE, Deloitte, or Adobe 1 (Baldassarre & Finken, 2015; Buckingham & Goodall, 2015). These changes have been facilitated by developments in information technology systems that have reduced the costs of tracking individual performance, comparing the performance of different workers, and sharing this information with employees (Aral et al., 2012).
The information that employees receive about their own performance can motivate them to work better through different mechanisms. When individuals are paid according to their performance, feedback may tell them where they stand within the incentive scheme of the organization, and they may use this information to improve their individual performance. Thus, feedback can work as a complement to incentive pay (Lourenço, 2016). In addition, receiving relative performance feedback can affect employees’ self‐esteem 2 (Kuhnen & Tymula, 2012), which can also lead to a change in performance: As self‐esteem is determined by relative standing among peers, employees who learn that they are doing poorly relative to others may want to increase their performance to improve their self‐esteem. It is also possible that, when it is difficult for employees to tell whether a given level of performance is high or low, relative performance feedback may help them assess their own performance level (Kolstad, 2013). This may also lead employees to change their behavior if they realize, for instance, that their performance was low.
However, although performance feedback could theoretically lead to an improvement in performance, empirical research has found mixed effects. This has led scholars across different disciplines to develop new research perspectives to understand the theoretical explanations behind the heterogeneous effects of performance feedback (Kluger & DeNisi, 1996; Sprinkle, 2000; 2003). For example, in the psychology literature, Kluger and DeNisi (1996) provide a comprehensive theory that explains variation in the performance consequences of feedback as a function of how a given feedback intervention shifts attention between the task and the self. Feedback interventions that shift the locus of attention toward the task should have stronger effects than those that shift attention away from it and toward the self. More recently, accounting scholars have theorized and found that the performance consequences of feedback vary with the characteristics of the feedback (e.g., Casas‐Arce et al., 2017; Hannan et al., 2008), the context in which it is given (e.g., Hannan et al., 2013; Tafkov, 2013) and the characteristics of the receiver (e.g., Lourenço et al., 2018). Most closely related to our paper, researchers have also explored the role played by the “content” of the information (e.g., Casas‐Arce & Martinez‐Jerez, 2009, Kolstad, 2013, Lourenço et al., 2018), that is, the specific information received by each employee. 3
In this study, we contribute to the research on the role of the content of feedback. We propose a formal moral hazard model in which employees choose the amount of effort based on their beliefs about their marginal product of effort, which is not completely known to them. Employees’ beliefs are based on their own information and on the information provided by the firm. Thus, when the firm provides feedback, employees’ beliefs may change, leading to a change in effort. The model provides two results. First, we show that feedback may increase or reduce worker effort. Second, we show that the size of the change in effort depends on the content of the feedback. Specifically, a content that indicates that the marginal benefit of effort is more likely to be high will lead to a greater increase in effort. Quite importantly, this prediction does not rely on workers’ prefeedback beliefs and therefore its empirical test requires knowing which information was told to the workers but not what workers initially believed.
Our model complements other formal models of feedback, which have also analyzed how workers’ responses to feedback vary according to its content, based on the idea that workers learn from the feedback and change their behavior according to the new information. Such models have been proposed in contexts like tournaments (Casas‐Arce & Martínez‐Jerez, 2009) and settings in which conformity to social norms is important (Chen et al., 2010). Our model instead analyzes responses to feedback when employees receive individual performance pay and social norms are not important. There are also models that have analyzed how much information is worth revealing, that is, what the optimal amount of feedback is (Azmat & Iriberri, 2010; Ertac, 2005) and the effects of the quality of the information (Kolstad, 2013) and the detail and frequency of the feedback (Casas‐Arce et al., 2017) on workers’ reactions. However, these models do not address the question of why responses to feedback are heterogeneous across employees who are subject to the same feedback policy. Our model instead provides predictions on how effort will vary according to the content of the feedback, thus providing an explanation for the heterogeneous effects of feedback. Our model is most closely related to Kuhnen and Tymula (2012), whose model also considers how effort changes as workers’ beliefs change. The main difference with respect to their model is that in Kuhnen and Tymula (2012), the learning process itself is not modeled, while in our case, learning is endogenous and constitutes the central part of the model.
To test the predictions of the model we conducted a field experiment 4 at a warehouse distribution center of a Fortune 500 company. In the experiment we manipulated the type of feedback given to employees. The feedback could be individual (i.e., about the worker's own performance) or relative (i.e., including information on performance relative to coworkers). We used a 2×2 design and randomly assigned each of the four sections of the facility to one of the following treatments: individual feedback, relative feedback, both, and a control group. Because our purpose was to investigate employees’ reactions to different pieces of information, each type of feedback treatment was designed in such a way that employees would receive information that was relevant to learning about the benefits of increasing performance. The feedback that each employee received referred to their performance in the previous week, and the feedback was given privately.
The rest of the paper is organized as follows. In Section 2, we review the current literature on the heterogeneous effects of feedback, and in Section 3, we develop our formal model. In the following two sections, we describe the warehouse in which we conducted the experiment (Section 4) and the experiment itself (Section 5). In Section 6, we describe the data and variables, in Section 7 we describe the econometric results, and in Section 8, we discuss our findings.
RELATED LITERATURE
In recent years scholars have made some progress to understand why the effects of feedback on performance are heterogeneous, focusing on aspects such as the characteristics of the feedback, the context in which feedback is given, the receiver of the feedback, and the information content of the feedback. In this section, we summarize the main empirical findings of this literature (see Table 1 in the Supporting Information for a summary of the relevant empirical literature).
Summary statistics
Regarding the characteristics of the feedback, researchers have considered how the effects of feedback vary depending on its level of detail (Casas‐Arce et al., 2017; Hannan et al., 2008), the frequency with which it is given (Casas‐Arce et al., 2017) and whether it is provided in a private or public way (Casas‐Arce et al. forthcoming; Hannan et al., 2013; Tafkov, 2013). Scholars have also explored how the effects of feedback vary with the context in which it is given. For example, the type of pay scheme (Hannan et al., 2008; Tafkov, 2013) and a tournament's prize structure (Newman & Tafkov, 2014) have been found to be important factors in determining the effectiveness of feedback. Another contextual factor that matters is the ability of workers to choose where to allocate effort in a multitask environment (Hannan et al., 2013). Some studies have also found that individuals react differently to feedback because they have unique characteristics, such as distinct attitudes toward feedback (Lourenço et al., 2018), varying levels of experience in the organization (Blanes i Vidal & Nossol, 2011), or different levels of ability and education (Casas‐Arce et al. forthcoming).
Of particular relevance for our study is the growing research that has tried to explain the heterogeneous effects of feedback as a function of its content, that is, the information received by each individual with the feedback intervention. How much employees learn from the feedback may vary across individuals if their prefeedback beliefs about their performance are to some extent biased and these biases vary across individuals: Those with more biased beliefs should react more to feedback. In particular, individuals may react differently depending on whether they learn that they were overestimating or underestimating their performance (Azmat et al., 2019; Chen et al., 2010; Jung et al., 2021; Kuhnen & Tymula, 2012; Lourenço et al., 2018).
Learning is also heterogeneous across individuals because feedback provides personalized information, which varies across employees. When they receive feedback employees may update their beliefs about their marginal benefit of exerting more effort, and those who learn that the marginal benefit of effort is smaller than they believed may react by reducing performance, while those who learn that the marginal benefit is higher may react by increasing performance. An important determinant of the marginal benefit of effort is where the individual stands in terms of performance prior to receiving feedback (Casas‐Arce & Martinez‐Jerez, 2009; Eyring & Narayanan, 2018). This has been explored in the context of relative feedback and of individual performance feedback. For example, Casas‐Arce and Martinez‐Jerez (2009) found that providing sales agents with interim feedback about how they stand with respect to others led to decreased effort for those who were ahead of their peers and for those trailing behind who determined that they had a very large performance gap. In an experiment with a sample of students, Eyring and Narayanan (2018) also found that higher reference points that are farther away from an individual's performance (i.e., top quartile for low performers) may lead to lower performance because they offer a lower marginal utility of effort. In other words, when learning about their performance relative to the top quartile, poor performers may have low expectations of reaching such high standards, which may discourage them from trying harder. In contrast, using a quantile regression approach, Azmat and Iriberri (2010), in a high‐school context, found that informing students about their relative performance (above or below average) as well as the distance from this average resulted in an increase in performance throughout the whole performance distribution. Lourenço et al. (2018) explored the performance effects of giving individual feedback to physicians in the context of negative incentives (i.e., termination threshold) and found that feedback improved effort both less and later for poor performers (i.e., those under termination threat). However, the effects were not observed for high performers. In a related study, not considering performance but the revision of their goals, Ilies and Judge (2005) found that those who were performing above their goals reacted to positive feedback by engaging in upward goal revision and those who were performing below their goals reacted to negative feedback by lowering their goals—a finding suggesting that individuals who see themselves far from their goals may stop trying. The conclusion of these studies is that personalized messages that inform individuals about the marginal benefits of increasing effort may lead to heterogeneous behavioral responses. Our study extends this literature and proposes a model to explain the heterogeneous impact of feedback depending on the information provided about the marginal benefits of effort.
While the idea that the content of feedback affects performance has appealed to several researchers, only a few studies have provided empirical estimates of the content per se, that is, have included in their estimations the actual content of the information given (i.e., the
Our paper contributes to this literature on feedback content. In our study, we hypothesize that a possible reason why feedback content matters is that employees may use the information that they receive to update their beliefs about the marginal benefit of exerting effort. Thus, we propose a specific mechanism to explain why employees who receive different information may react differently to the feedback. From a theoretical standpoint, our main contribution is to provide a formal model of how changes in content influence changes in beliefs, which in turn influence worker effort. Our model extends the work of Kuhnen and Tymula (2012), whose model considers changes in workers’ beliefs as exogenous. Our model instead considers how changes in beliefs are driven by changes in feedback content. Another important contribution of our model is to provide a testable implication that does not require knowing workers’ beliefs, which makes empirical testing easier. Our empirical analyses are based on a field experiment conducted in an e‐commerce warehouse in which we gave employees explicit feedback about the marginal benefit of exerting more effort. As shown in Table 1 in the Supporting Information to the paper, few studies have estimated the effect of feedback content (see column 2), and none of these studies has specifically looked at how feedback receivers react to information about marginal benefits (see column 3). The idea that reactions to feedback are heterogeneous also suggests that feedback may change the distribution of performance within a firm. Such distributional effects have been studied by a number of papers (see column 4), and our main contribution is to relate these distributional effects to the content of the feedback and to provide quantile estimates, which have been relatively rare in the literature (see column 5).
ANALYTICAL MODEL
Suppose 
Suppose employee beliefs are given by a joint density
Assume that the utility of the worker is given by
We will use
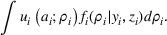
The main question we are interested in is how worker effort 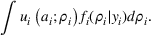
Let
To further analyze the effect of feedback, we make more specific assumptions about workers’ utility functions. We allow for two types of worker preferences, one in which workers respond to monetary incentives and another one, which has also been considered in the literature on feedback (e.g. Azmat & Iriberri, 2010; Casas‐Arce & Martinez‐Jerez, 2009; Eyring & Narayanan, 2018; Gill et al., 2019; Kuhnen & Tymula, 2012; Tafkov, 2013), in which employees care about their performance relative to coworkers.
For expositional purposes, we will first separate the two types of preferences. Beginning with the preferences based on monetary incentives, we assume that the firm pays a fixed hourly wage and an hourly bonus based on the worker's productivity. In many firms, such as the one we analyze in this paper, it is common for hourly bonuses to increase with worker productivity. In other words, workers’ hourly pay increases with performance. To model this, we assume that the worker's gross benefit is given by:
Given these worker preferences, the following result can be derived:
Proof. To prove this result, we use supermodularity theory (Topkis, 1978). As shown in Athey (2002, Theorem 1), if 
This result implies that while the difference
Let us now turn to the case in which the worker's utility depends on his or her productivity relative to the other workers in the firm. Let 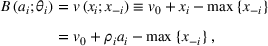
When worker preferences depend on relative productivity, the following result can be found:
Proof. The proof is similar to that of Proposition 1. Since the density is log‐supermodular, it suffices to show that 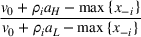
Although for expositional purposes we have considered the two utility functions separately, we may also assume that the worker's preferences include both features, that is, that he or she cares about his or her monetary compensation and about his or her relative standing in terms of productivity. Thus, suppose the gross benefit function is given by
In summary, the model provides the following insights. First, feedback may have a positive or negative effect on effort because the effect will depend on how feedback changes workers’ beliefs about their marginal performance. Second, the model underscores the importance of the
We think this model provides a useful theoretical framework to understand the heterogeneous effects of feedback, but it relies on several simplifying assumptions that are worth highlighting. We shall focus on three of them that are particularly relevant to the setting in which we conduct our empirical study and to the interpretation of our empirical results. The first one has to do with the information structure of the model. We assume that workers know the effort they choose but have incorrect information about how such effort translates into performance and pay. This is consistent with our empirical setting, where employees choose effort but do not directly observe performance. In other empirical settings, this assumption may be unrealistic: For instance, salespersons may have more accurate information about their sales (performance) than about the amount of effort that they dedicated to each client.
The second assumption is related to workers’ preferences. We assume that employees care about their relative performance and this preference is “behavioral” in the sense that relative performance enters the utility function directly. However, their reactions to feedback are driven by how they learn from the feedback they receive, that is, they react to relative performance feedback “rationally” in the sense that they use this information to update their beliefs about the marginal benefit of effort.
The third assumption is the linearity of the bonus with respect to productivity. In our empirical setting the bonus also increases with productivity, but it follows a step function, with discrete jumps at six different productivity levels. These jumps can give rise to interesting effects that are not considered in the model. In particular, workers may choose to exert a particular effort to reach the following bonus step but also to avoid falling back to the previous step. This would have implications for their reactions to feedback, which we discuss in the empirical part of our study. Specifically, an employee who is further away from the following bonus step would have a lower incentive to increase effort because the cost of reaching the higher bonus is greater, but being further away from the following step implies being closer to the previous step, which may create an incentive to avoid falling back to the lower bonus level.
INSTITUTIONAL SETTING
We conducted the experiment at the warehouse distribution center of a Fortune 500 company located in the U.S. Midwest. 6 We refer to the site as Midwestern Warehouse (MWW). MWW had over 1,000,000 square feet of space and was responsible for handling 80,000 different stock‐keeping units (SKUs). There were approximately 130 hourly employees who worked at the site over three shifts. On a daily basis, MWW shipped an average of 8000 orders comprising approximately 100,000 total items. The facility was divided into four sections that were physically separated from one another. The sections handled different SKUs and were separated for product grouping purposes, but the tasks of the workers were identical in all sections. Each employee was hired for a specific section when the section needed a worker and remained in the same section thereafter. Each section was divided into approximately 40 work areas referred to as stations. The technology used at MWW was industry standard, that is, what is typically present in warehouses that pick, pack, and ship products to customers. Facilities of this type have become increasingly common with the growth of e‐commerce, as firms stock products centrally and then ship them across a region, country, or globally. According to the Bureau of Labor Statistics, this industry employs over 1.8 million people in the United States (Bureau of Labor Statistics, 2022).
Once an order came into the warehouse, a specialized Warehouse Management System (WMS) routed plastic tote bins via a conveyer belt to the appropriate stations so that employees could select the items needed for the order. Employees would move to the stations where there were bins to fill the orders from those stations and would know which stations to go to since that information was displayed on large screens. At each station, the employee would scan the bin and an electronic board would indicate the items that he or she should pick from the station and place in the bin. The employee would then walk within the station, select the correct items and quantities, scan them, and place them in the plastic bin. The employee carried out the entire order from the station. After all the items from the station had been selected, the bin would then move to either another station or to the packing area via the conveyer belt, where items were placed into a box, and the box was labeled for shipping. In the picking stations of the facility, the workload of each worker was independent of the work done by others, and there were no spillover effects from the work of one worker to another.
The WMS also collected performance data. When the system was installed, engineers calculated how long it should take to prepare each order, taking into account the number of items required and their location. These standard times were used thereafter to calculate individual performance: Every day, the WMS collected data on the total time each worker actually took to prepare each order, and the ratio of standard time to actual time was then used as a measure of performance. 7 Typically, a job task lasted between 20 s and 3 min, depending on the number of items in the order and the location of the items within the station. The WMS calculated a rolling performance metric for every employee.
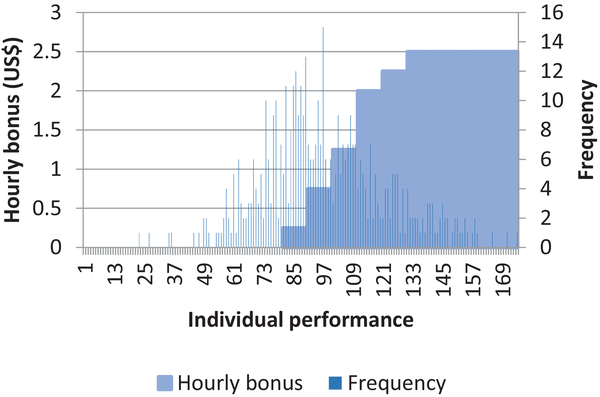
Weekly pay was equal to hourly pay times the number of hours worked during the week, and hourly pay was equal to base pay plus an hourly bonus based on weekly performance. The hourly bonus increased with performance, as shown in Figure 1, and incentive pay could account for over 30% of compensation. At the beginning of the week, employees received a payroll slip that indicated how much would be deposited into their account for the hours worked the previous Monday through Sunday. The payroll slip displayed the gross pay, taxes and other deductions, net pay, and total hours worked, but did not contain explicit information about their performance or about the split between fixed and variable pay.
Sample distribution of individual performance
During the shift, employees could find their performance displayed at special monitors throughout the warehouse. Monitors displayed the employee's name, current station, and individual performance on the shift in real time. However, it was costly for employees to correctly estimate the benefit of working harder for two reasons. First, some information was not available to them. This was the case for relative performance, which was not displayed on the monitors. Second, the information shown on the screens was offered in real time but only for that day. At the end of the shift, that information was changed for the people in the next shift. If an employee wanted to use the available information to estimate the benefits of his or her effort, substantial costs would be involved: He or she would have to record this information every day at the end of the shift, compute the weekly weighted average of performance, introduce this information into the nonlinear bonus formula given by the company, and analyze the potential benefits of working harder.
Most workers entered the facility as temporary workers (hired through a temporary help agency), and after a 3‐month probation period became permanent employees. Workers could also enter directly as permanent employees, but this required a longer waiting period due to administrative paperwork. MWW defined poor‐performing employees as those who consistently performed below 70% relative to the standard time throughout the week. Poor‐performing employees had to go through training for a week. If they continued to perform poorly, they were offered coaching and job shadowing for a second week, 8 and if that did not result in improved performance, they were dismissed.
EXPERIMENTAL DESIGN
At the beginning of each shift on Mondays, managers met with all the employees in a given section. Two weeks prior to the experiment, an overview of the project was presented to all the employees of the shift and section during that meeting. The site manager introduced one of the researchers, who explained that the team was independent of senior management and that it comprised business school professors who wanted to better understand the facility's operations. 9 The researcher informed them that each employee would receive a sheet of paper every Monday at their weekly meeting. He asked that all employees read this piece of paper before beginning their work for the week. We used that meeting to ask them to sign a form giving us consent to receive the sheet of paper every Monday (as required by the institutional review board [IRB]).
We also made it very clear to them that the standards to which they were subject would not be changed and that there would be no reprogramming of the way work was done in the unit. We did this with the aim of avoiding the so‐called ratchet effect (Freixas et al., 1985; Leone & Rock, 2002; Weitzman, 1980), that is, quota restriction behaviors that occur when workers are afraid of being subjected to tougher goals if they improve productivity. This also means that relative concerns, if found, were less likely to be caused by the fear of being ostracized by other workers. In this warehouse, workers’ tasks were independent from one another, the layout was fixed by management and the process was highly systematized. Thus, there was a small risk that workers would take actions to undermine others’ performance (e.g., by leaving things in the wrong place or giving other workers wrong instructions) in order to improve their own relative standing.
We applied two feedback treatments—individual and relative feedback—that were designed to appeal to each type of preferences considered in the model and we also applied a third feedback treatment—“full feedback”—which provided all pieces of information at the same time. We employed a 2×2 design, assigning these three treatments of feedback and the control across the four different sections of the factory. Each of the four sections was initially randomly assigned to one of the four different options: individual feedback, relative feedback, full feedback, or control. After 2 weeks, each group was then rotated. The experiment was run for a total of 8 weeks, and every section of the facility spent 2 weeks in each of the four different options. Thus, all the sections in our unit were subject to all the conditions at some point during the exercise.
For the individual feedback treatment, we told employees how close they were to the next level of performance (i.e., the level that would entitle them to earn the next higher bonus) 10 and how much additional income they would have earned at the next bonus level. We also informed them about their previous week's performance. For the relative feedback treatment, employees were told about their own level of performance, their performance ranking relative to everyone working in their section of the factory (i.e., the percentage of employees with lower performance), and the level of performance of the top performer. The full feedback treatment included both the individual and the relative feedback messages. Giving all the information together allowed us to explore the effect of each type of feedback while controlling for the other type and thus to control for the extent to which the effects of giving individual (relative) information could be driven in part by guesses about their relative standing (monetary gains). In all cases, the measure of performance that we used was weekly performance as defined by the firm. Employees in the control group received a standard message about safety that was written throughout the facility and always discussed at every weekly meeting. The standard templates that were used to create the messages given to each individual employee, as well as the description of the order of the treatments are shown in the Supporting Information of the paper. On Sunday nights, we downloaded the data from the WMS, made the calculations to produce feedback to deliver, and printed the message on a piece of paper. This was then distributed to each employee on Monday before they began their shift. After the 8‐week experimental period, workers stopped receiving feedback through weekly pieces of paper.
The layout of the four sections reduced the risk of contamination across the different treatments because workers assigned to a section did not see or interact with workers in other sections while working. Each of the four sections had different parking lots, lunch locations, break areas, and bathroom areas, as well as different lunch break schedules. In our field observation and qualitative interviews with the management of the warehouse, we realized that nobody was going from one area to another to see friends. Before running the experiment, we tested for differences among the four sections, and although we found no significant difference in terms of average performance, we did find some differences regarding other relevant characteristics (please see the Supporting Information for a full description of these tests).
Rotating the treatments across sections allowed us to observe every individual under the different treatments, which given the evidence of some heterogeneity across sections would help us ensure that results are not driven by differences between sections. This enabled us to control for extraneous unobserved characteristics of participants and sections that could be influencing the results (Charness et al., 2012; List et al., 2011). Furthermore, given the relatively small number of employees per section, the within‐individual design allowed us to have more statistical power as more people were exposed to each treatment. However, the experiment could lead to the wrong conclusions if there were reasons to suspect that the order of the treatments could affect the results (i.e., if there is no independence of the multiple exposures). To address these concerns, we designed the rotation of the treatments to ensure that different individuals received different types of feedback in different orders (as shown in the Supporting Information of the paper). 11 We also explore the potential existence of order effects in the analyses section.
DATA AND VARIABLES
We focus on permanent workers to obtain a more homogenous sample since these workers have already passed the screening process. Permanent workers also provide a more comparable sample since many of the temporary workers did not intend to stay there for a long time. 12 The number of permanent workers varied per section (see Table 2A for the number of permanent employees in the week immediately before the experiment). 13 The final data set includes 1105 employee–week observations. In addition to the 8 weeks of the experiment, we collected data in the six consecutive weeks that immediately preceded the experiment and in the eight consecutive weeks that immediately followed it. (See the Supporting Information for a full description of the variables per section as well as for the final composition of the sample.)
The left‐hand side variable in all the regressions is the logarithm of individual performance, as defined by the company. In Figure 1, we plotted a histogram of performance (for the 6 weeks prior to the experiment) and the step function that represents the incentive scheme, that is, the hourly bonus that an employee is entitled to as a function of performance. Performance is concentrated in the interval for which the bonus function is increasing, which suggests that earning the bonus was neither too “easy” (in which case most observations would cluster around the flat portion of the bonus scheme corresponding to above 130% performance) nor too “difficult” (in which case performance would cluster below 80%).
Since we are interested in the performance effect of feedback content, the main right‐hand side variables are measures of the information given to the workers. To operationalize the feedback information given to each employee, we construct several variables, hereby referred to as “information variables,” that take the value of the specific information provided and zero if that information was not provided. We use two alternative approaches to define the information variables.
In the first approach, we define four information variables that do not treat information differently depending on whether it was given independently or together with the other type of feedback. For individual feedback, we construct two information variables: “distance to next level” and “bonus increase,” which take the value of the specific information given regarding distance and bonus when individual feedback was given and zero when it was not given. We use these two variables as proxies for the marginal monetary benefit of effort. A greater value of Distance to next level indicates that a given amount of additional effort will yield less benefits, since the next level of bonus is more distant. Therefore, an increase in this variable is a proxy for a reduction in the marginal benefit of effort. 14 For Bonus increase, a greater value of this variable indicates that a given increase in work effort yields a greater monetary payoff. Hence, an increase in this variable is a proxy for an increase in the marginal benefit of effort. Consequently, a lower Distance to next level and a higher Bonus increase should be associated with greater effort.
Similarly, we construct two information variables for relative feedback that take the value of the relative feedback when it was given and zero when it was not given. These variables are “Performance quantile” (percentage of employees in his or her group that the focal employee has outperformed) and “Distance to maximum performance” (difference between the performance of the best performer and the focal employee's performance). Given the effort that the employee has made in the previous week, a higher Performance quantile should lead the worker to believe that their marginal product of effort is higher than it would be if this variable were lower. Likewise, a smaller Distance to maximum performance must lead to the belief that the marginal product is higher than it would be if the distance was greater. Consequently, a higher Performance quantile and a lower Distance to maximum performance should be associated with greater effort.
As an alternative, we use a second approach, which is to construct the information variables in a way that allows the information to have a different effect depending on whether it was given separately or together with the other type of feedback. For example, for individual feedback, we create two “distance to next level” variables, one that takes the value of the distance information given if it was communicated independently and zero otherwise (Distance to next level [IF]) and another that takes the value of the distance information given if it was communicated together with relative feedback and zero otherwise (Distance to next level [FF]). We apply the same procedure for the other information variables and obtained eight alternative information variables (Distance to next level [IF], Bonus increase [IF], Performance quartile [RF], Distance to max performance [RF], Distance to next level [FF], Bonus increase [FF], Performance quantile [FF], and Distance to max performance [FF]).
Finally, we include a set of control variables. First, we control for the performance of individuals before and after the experiment week, including two indicator variables:
We estimate all our regressions using employee fixed effects to control for any unobserved fixed worker characteristics. We cluster the standard errors by worker to take autocorrelation into account. Table 1 shows summary statistics for the main dependent variable and the information variables.
RESULTS
Feedback effects on performance in the workplace: Descriptive results
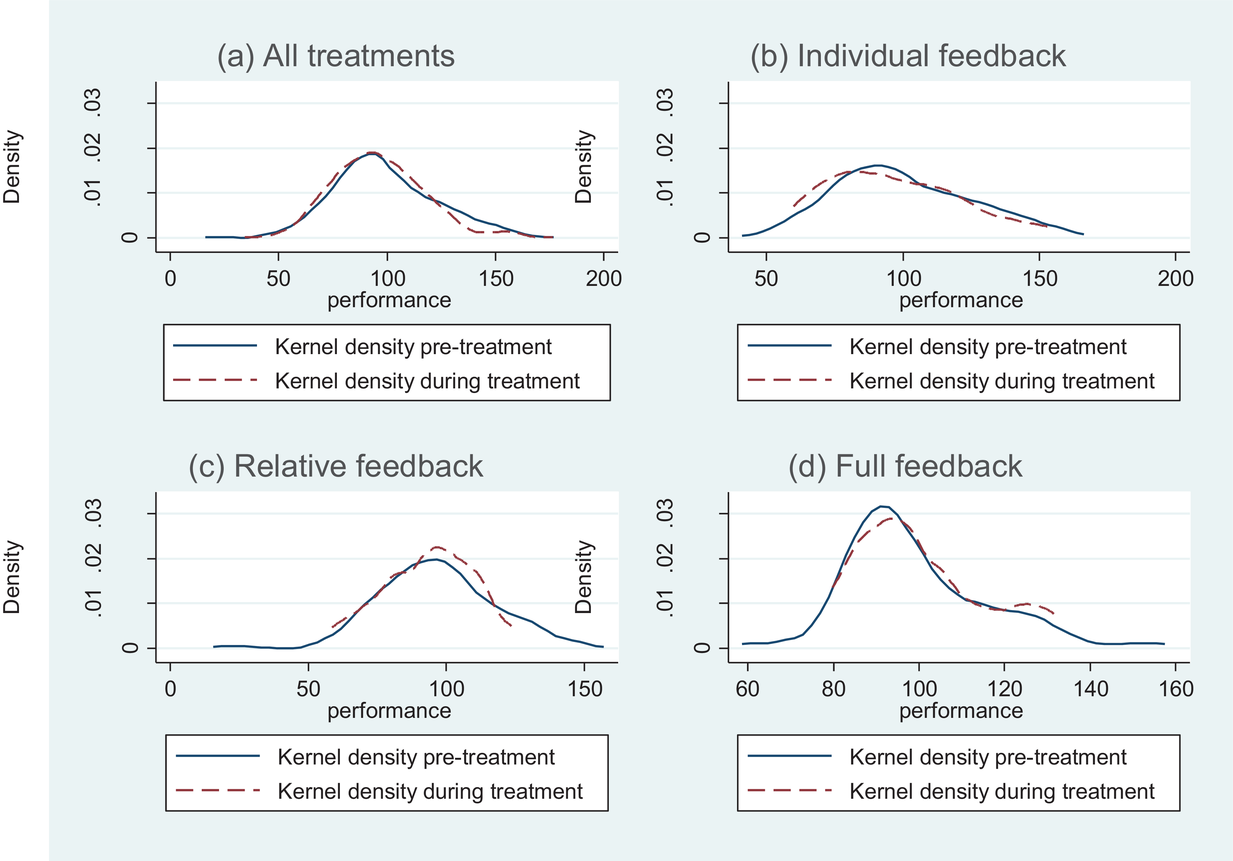
We first plot the kernel distribution of performance for the workers before the treatment (the 6 weeks prior to the treatment) and during the 8 weeks of the treatment: See Figure 2, which shows four graphs. Figure 2a shows the distribution of performance for all the sections before the treatment, as well as the performance for all the sections that were affected by a feedback treatment during the weeks of the treatment (i.e., excluding the performance of the sections that received only the safety message). We observe that the performance distribution does not seem to move to the right or left, but that the treatments seem to compress the performance distribution. Figure 2b–d show the performance distribution for each treatment separately. For comparison purposes, we plot only performance for the first 2 weeks of each treatment, which, because of the way we conducted our experiment, corresponds to performance in only one section, together with the performance distribution in that particular section pretreatment. We do not observe an overall effect on the average performance, but we see that the treatments affect the shape of the distribution; particularly when we provide individual feedback and relative feedback separately, the distribution seems to become more concentrated.
Performance distribution pretreatment and during treatment
We also explore whether there is an average treatment effect of each of the three treatment conditions (IF, RF, and FF) in a more systematic way. To do this, we use ordinary least squares (OLS) regression with worker fixed effects including three dichotomous variables, one for each treatment. Estimates, displayed in Model 1 of Table 2, show that none of the treatment variables has a significant effect on performance. This is also consistent with what we observed in the performance distribution figures and in the descriptive statistics: The feedback policy does not seem to matter for changing average performance. We next turn to explore our main hypothesized effects, those regarding the provision of information about the marginal benefits of effort. (Additional analyses comparing the average performance effects of the treatments are presented in the Supporting Information of the paper.)
Content feedback effects on average performance in the workplace: Linear estimation results
Table 2 shows the results of our model estimations, using the four information variables (Model 2, Table 2), or allowing the effect to be different in each case, using the eight information variables (Model 3, Table 2). The individual feedback information variables show a significant effect on performance. Specifically, the performance distance to the next level has a negative effect in both Models 2 and 3 (albeit only when given together with relative feedback). Using the coefficient estimated in Model 3 (Distance to next level FF), we find that informing individuals that they are 9 points away from the next level versus informing them that they are 1 point away from the next level leads to a reduction in performance of 1.54%. The bonus difference, on the other hand, has a positive effect on performance in both specifications, albeit only at a 10% level in Model 3. Using the estimates from Model 3 (Bonus increase IF), we find that telling individuals that they could make $0.75 more in bonus (the maximum increase) versus $0.25 more in bonus (the minimum increase) leads to a performance increase of approximately 1%.
Both effects have the predicted sign. First, if distance to the next level is greater, this means that the marginal benefit of effort is lower: For employees who are very close to the next level, a small increase in performance suffices to increase the bonus, but for employees who are far from the next level, a small increase in performance may not be enough to earn a larger bonus, so that the marginal benefit would be zero. Since a greater distance implies a lower marginal benefit, we expect a negative effect of distance on worker performance. Second, if the bonus difference is greater, then the marginal benefit of effort is greater, which implies that the bonus difference should have a positive effect on individual performance. With regard to the relative feedback information, the effects also have the predicted sign, but the levels of significance are lower: We find that the performance quantile has a significant, positive effect in Model 2 and in Model 3 (albeit only in the treatment group that receives both types of feedback), but Distance to maximum performance does not have a significant effect in either model. Finding that the performance quantile has a significant effect under the full feedback condition suggests that individuals have behavioral preferences for a higher standing position. Using the estimates from Model 3 (Performance quantile RF), we find that telling individuals that their performance was in the 75th percentile in their section versus the 25th percentile results in a performance increase of approximately 0.88%.
Another relevant finding from Model 3 of Table 2 is that the coefficients of the information variables in the individual or relative feedback cases are not significantly different from their full feedback counterparts. This suggests that employees do not use the information we give them relative to the marginal benefit in terms of monetary gains to make guesses about the marginal benefit in terms of relative standing gains and
Because we are conducting hypothesis testing for multiple treatment groups, we need to account for the fact that we may reject more null hypotheses than we should (Floyd & List, 2016; Young, 2019). To address this potential concern, we follow previous work (Casas‐Arce et al., 2017) and first test the joint significance of the three treatment coefficients using an
Content feedback effects addressing potential order effects
As mentioned before, the design of the experiment could lead to the wrong conclusions if order effects are present: for example, if individuals react to the information variables that provide individual feedback differently depending on whether they had received relative feedback versus the control information message before. We conduct a series of additional regression analyses to explore potential order effects.
First, we perform an analysis using only information from the first 2 weeks of the experimental period. This is equivalent to a between‐individual design, as during this first 2‐week period individuals in each section were only receiving one type of treatment (individual, relative, full, or control) without a different preceding treatment. Thus, order effects should not be an issue in this case. Looking only at the first 2 weeks also controls for potential “experimenter demands” that could happen if participants realized that the goal of the study was the feedback system and manipulated their performance to be best during the feedback system they preferred. These results are shown in Table 3 (Models 1 and 2) and reveal some similarities and some differences with respect to the analyses that use the sample from all the experimental weeks. In terms of similarities, Bonus increase and Performance quantile show a positive and significant coefficient. In terms of differences, the variables related to distance do not show a negative or significant effect, and indeed, Distance to maximum performance shows a positive and significant effect. Section 2 (the section that received relative information feedback independently in the first 2 weeks) shows a significantly smaller average distance with respect to the maximum performance in the weeks prior to the experiment compared to the rest of the sections (41.12 vs. 54.61,
Treatment effects
Levels of significance: *10%, **5%, ***1%.
Treatment effects addressing order effects
Levels of significance: *10%, **5%, ***1%.
Next, we control in the models for the order in which the different pieces of information were given. For each information message given (i.e., IF, RF, FF, Control), we construct a count variable that takes the value of 1 if the information was given in the first 2 weeks, 2 if it was given in weeks 3 and 4, 3 if it was given in weeks 5 and 6, and 4 if it was given in weeks 7 and 8. These four ordinal variables (Order IF, Order RF, Order FF, Order control) are intended to capture an aspect of learning effects: If individuals have received other information before, for example, those who received IF after having received all other types of treatments, may learn less about their marginal benefit of effort and therefore react less to the new information provided. Thus, if order effects are present, we should expect a negative coefficient of these order variables when including them in the model. When we introduce these four variables as controls in the model, we find some evidence of order effects (Models 3 and 4, Table 3). Specifically, the coefficient of Order FF is negative and significant in both models, which suggests that the effect of the feedback given under the FF condition is larger the first time individuals receive the feedback (the effect of the FF information variables decreases when feedback is provided in later weeks). The results regarding the information variables continue to be consistent with the model's predictions, although we lose significance in some of the coefficients.
As a final test, we also estimate a model allowing for the effects of each of the pieces of information feedback, including the control information, to vary depending on the week period in which the information was provided (analyses available upon request). Thus, for each information variable we construct four variables. For example, for Bonus Increase (IF) the four variables are called Bonus Increase (IF) weeks 1&2, Bonus Increase (IF) weeks 3&4, Bonus Increase (IF) weeks 5&6, and Bonus Increase (IF) weeks 7&8, and are defined as follows. Bonus Increase (IF) weeks
Feedback effects on the distribution of performance in the workplace: Quantile regressions
We next turn to investigate the distributional effects of feedback by estimating quantile regressions to explore which part of the distribution is more affected by the treatments. For simplification purposes, in what follows we focus on the Model 2 specification. 17 As suggested in Table 2, individual feedback may increase or reduce performance, depending on employees’ learning about the marginal benefit of effort. Such effects might lead to changes in the distribution of performance in the workplace, which may become more dispersed or more concentrated around the median. The distribution of performance shown in Figure 2 suggests that such distributional effects took place, at least for some of the treatments.
Distributional effects can take place because differences in performance can be partly due to differences in employees’ beliefs about the marginal benefit of effort. Hence, if feedback changes workers’ beliefs, it will also change the distribution of performance. As an example of why feedback may have distributional effects, suppose that all employees have the same cost function for effort, suppose the function is convex, and assume differences in performance are solely due to beliefs, that is, low performers are employees who believe that the marginal benefit of effort is low and high performers are those who believe that it is high. If all receive the same piece of information on the marginal benefit, the effect will be different in each group: Low performers will learn that the marginal benefit is greater than they thought and will increase their effort, while high performers will determine if they were overestimating the marginal benefit and will reduce their effort. We consequently expect a similar piece of information to have a different effect on performance in different parts of the distribution.
To test for distributional effects, we estimate quantile regressions using the “quantile regression for panel data” model proposed by Powell (forthcoming). This approach allows us to estimate treatment effects on the quantiles allowing for unobserved employee fixed effects and, to our knowledge, has not been used in the earlier literature on feedback. 18 The results, shown in Table 4 (Models 1 to 3) indicate that almost all the information variables have significant effects on some of the quantiles, which is consistent with the idea that employees take into account all the information disclosed. In addition, the signs of the effects that are statistically significant are the same for the different quantiles. The models also show that the effects tend to be stronger and more significant for the 25th and 50th quantiles, suggesting that top performers tend to react less to feedback information. 19
Quantile regressions of treatment effects
Levels of significance: *10%, **5%, ***1%.
Additional analyses
We perform a series of additional analyses (shown in the Supporting Information) to provide suggestive evidence of our main mechanism as well as to explore the robustness of our results to alternative specifications. Specifically, we show that the relationship between prior performance and performance became weaker during the experiment period, which is consistent with the hypothesized learning mechanism. We also rule out that our results are only driven by a Hawthorne effect, as we continue to find similar effects when we remove data from the last 2 weeks immediately before the experiment started, when participants learned that the study was going to take place and could have already reacted to the experimenter introduction.
In addition, we find that our results are robust to alternative specifications, including the use of an alternative operationalization of the information variables (i.e., taking into account whether the worker was in the individual performance incentive zone or not), excluding the postexperiment performance, allowing for two‐way clustering (worker and section) of standard errors, and removing data from workers who joined or left our sample during the experiment period.
DISCUSSION
On the whole, our analyses give strong support to the theoretical predictions. With regard to
Regarding
Our study has important implications for both theory and practice. Theoretically, we provide a model of how employees use feedback to update their beliefs and reoptimize their choice of effort. The model provides testable implications of how feedback content should influence performance. Such predictions do not require knowledge of employees’ prior beliefs and do not rely on assuming that beliefs follow a specific statistical distribution.
From a practical standpoint, our study has important implications for the design of information systems in organizations. Our findings suggest that the same feedback policy will have different effects depending on the content of the feedback. For instance, if the policy is to tell employees information about their previous week performance, the effect will differ cross‐sectionally (across employees) and longitudinally because performance varies both cross‐sectionally and longitudinally. Our study also suggests that a feedback policy may have very different effects depending on employees’ beliefs about how beneficial it is to exert an additional unit of effort.
Our results are of particular relevance to operations managers who need to provide feedback in a warehouse setting, which is different from a typical assembly line process. In an assembly line, employees have defined tasks and roles and these tasks rarely change, employees can be taught how to perform all the tasks for their station, and evaluating performance can be straightforward. However, warehouse operations, and the autonomy they provide the employee to complete the task, are inherently different from a typical assembly line facility (Sun et al., 2021): The task itself must be accomplished, but how each employee goes about accomplishing it is not predefined. This adds complexity to the training, compliance, and improvement process, especially when employees are physically dispersed (Staats et al., 2016).
Our study suggests that feedback changes employee performance as long as employees learn from feedback, and this has practical consequences for firms providing feedback on a regular basis. When feedback is frequent and the work environment is relatively stable, employees may eventually reach a level of knowledge of the relevant parameters (in our case, the marginal benefit of effort) such that further feedback will have little impact on performance. When feedback is less frequent or the work environment is more complex or changing, the information that employees receive with the feedback will have a greater learning effect and a greater effect on performance is to be expected.
Our study is also suggestive of the complementarities that exist between operations management, information sharing, and incentive design. The technology that the firm uses for the efficiency of its operations generates the data that allow it to implement its incentive system and to provide detailed feedback. Although the establishment uses state‐of‐the‐art technology to manage its operations and the incentive system is also quite sophisticated, information sharing matters, suggesting that productivity is not fully driven by technology or by the incentive system.
Given the effects of feedback on productivity, an interesting question is whether these effects translate into profits. Employees who learn that their productivities are high may seek outside job opportunities, which may lead to turnover or to wage renegotiation and a subsequent increase in costs. If the firm faces competition from a dominant rival who is able to pay higher wages, giving employees feedback may have negative consequences on profits. We would expect this negative effect to be larger when the feedback is relative, since information on relative productivity is more valuable for employees to successfully move to a better paying job. When feedback is individual, employees learn about their productivity but they do not know how many coworkers have similar productivities, which makes it harder for them to evaluate their outside job opportunities. This suggests that firms with less market power would rely more on individual feedback than firms with more market power. In this study we have not analyzed the link between market power and the type of feedback but we think that this is an interesting question for future research.
Another question that is worthwhile addressing is whether there are benefits to disclosing feedback on employee performance to third parties like clients or suppliers. If a client firm has access to feedback about the employee who is mostly dealing with it, it may use the information to make inferences about the value of the service that the employee provides. Such learning may have greater consequences when the feedback is relative than when it is individual. Under relative feedback, if a client learns that the employee it deals with is a relatively low performer, the client may infer that the firm is not doing enough to provide a good service. However, when the feedback is individual making this type of inference will be more difficult, since the client may not have an accurate idea as to whether a given score can be considered high or low. There may also be differences across clients, as more experienced ones may have the capacity to extract information on relative performance out of individual performance feedback. We think that these questions are indicative of the potential for future research of our learning‐based model.
Our study has a number of limitations. First, to avoid contamination issues we decided to apply the same treatment to all the employees within the same section and we used a predefined order of treatments. This limited our ability to explore potential sequencing effects, that is, effects of the order in which employees receive feedback. Second, we found that individual and relative performance feedback changed the distribution of performance but we were limited in our ability to investigate the mechanisms that drive these effects. We observed that the performance of the bottom performers improved after the receipt of individual and relative feedback but we do not know whether these effects were due to greater effort being exerted or effort being exerted in a smarter way.
Another important question is whether our findings are generalizable to other settings, in other words, the external validity of our experiment. In our setting, tasks were simple and productivity was easy to measure. We believe that our results may apply to settings with similar characteristics, in particular, to those in which time is a key performance indicator. We think that when performance is difficult to measure and includes a subjective judgment from the evaluator, such as with more complex tasks, the provision of individual and relative performance feedback may actually have a greater impact, since workers’ prior beliefs are likely to be less precise.
Another feature of our experiment is that employees received nonlinear incentive pay. In this context, feedback about the marginal benefit of exerting effort may be particularly valuable, but in cases where there is a linear‐pay formula, workers may already have a better sense of the marginal benefits of exerting effort. Moreover, we were not able to change the incentive structure offered to employees. Being able to manipulate both feedback and the type of incentives at the same time would be useful to better understand the boundary conditions of our findings. Moreover, how feedback is provided may also affect the results. In our context, feedback was given in a private way, so the effects of relative feedback should be due to self‐esteem rather than to other relative concern mechanisms, and in contexts in which information about relative standing is given in a public way, we may expect even stronger effects of giving relative feedback (see, e.g., Hannan et al., 2013; Tafkov, 2013).
Footnotes
ACKNOWLEDGMENTS
We thank Anil Arya, the senior editor, and two anonymous reviewers for their comments and suggestions. Earlier versions of this paper were presented at the Strategic Management Society annual meeting (Berlin, September 2016), Madrid Work and Organizations Workshop (May 2017), and Wharton People and Organizations conference (Philadelphia, PA, October 2017), and at seminars at CUNEF and Indiana University. We are grateful to participants at these conferences and to Benjamin Barber for their comments and suggestions. All remaining errors are our own. Jaime Ortega acknowledges partial financial support from grant PGC2018‐098767‐B‐C21 (MCI/AEI/FEDER, UE) and from the Madrid Government (Comunidad de Madrid‐Spain) under the Multiannual Agreement with UC3M in the line of Excellence of University Professors (EPUC3M12), and in the context of the V PRICIT (Regional Programme of Research and Technological Innovation). Rocio Bonet acknowledges partial financial support from the Spanish Ministry of Economy and Competitiveness (MCIU), State Research Agency (AEI), and European Regional Development Fund (ERDF) Grant No. PGC2018‐098767‐B‐C22.
1
2
Self‐esteem has been defined as an individual's evaluation of him or herself (see, e.g., Coopersmith, 1967, pp. 4–5). According to the self‐evaluation maintenance (SEM) model (Tesser, ![]() ), individuals behave in order to maintain or improve their self‐evaluations, which are influenced by the performance of “close others.” A more positive self‐evaluation has a positive effect on affect, which is consistent with the utility function assumed here.
), individuals behave in order to maintain or improve their self‐evaluations, which are influenced by the performance of “close others.” A more positive self‐evaluation has a positive effect on affect, which is consistent with the utility function assumed here.
3
We use the term “content” to refer to the information received by each individual. Thus, consider a feedback policy in which employees are told their previous week performance. The “content” would be the specific value of performance that each employee is told. Although the feedback policy is the same for all employees, the content of the feedback varies across employees because their performance also varies.
4
The field experiment was approved by the institutional review board of the institution of the coauthor who conducted it.
5
In the feedback literature the papers that use formal models have assumed different reference points, including the maximum, average, or median performance. Casas‐Arce and Martinez‐Jerez (2019) use a tournament model and therefore the benchmark is the maximum performance. Azmat and Iriberri (2010) assume that utility depends on the difference between own performance and average performance, Chen et al. (2010) assume that it depends on the difference with respect to median performance, and Kolstad (2013) uses a more general model in which the reference point is not restricted to being the maximum, average, or median. The model by Kuhnen and Tymula (![]() ) has only two workers and the reference point is the performance of the other worker.
) has only two workers and the reference point is the performance of the other worker.
6
The company has many distribution in the United States and throughout the world, but we were given access only to this one.
7
For instance, if a bin arrived at Station 25 and the order called for three units of Item A and two units of Item B, the WMS would know that the order should take 50 s to complete. If an employee completed the task in 60 s, the performance score would be 83.3% (50/60). Similarly, if an employee took 43 s to complete the task, the performance was 116.2% (50/43).
8
We also examined whether our results held when controlling for the fact that some workers whose performance was under 70% might have received more feedback than the rest. Our results remained unchanged.
9
A meeting was conducted for each of the four sections, since these sections were separated and distant from each other. This was then repeated for each of the three daily shifts.
10
The information we gave was framed as potential gains. Alternatively, we could have framed it highlighting both potential gains and losses, but because each frame could lead to different behaviors (Kahneman & Tversky, ![]() ) this could add noise to the question. Therefore, for simplicity and to stick to a more realistic setting (highlighting gains is the message the company gave workers when hiring them) we chose to focus on gains.
) this could add noise to the question. Therefore, for simplicity and to stick to a more realistic setting (highlighting gains is the message the company gave workers when hiring them) we chose to focus on gains.
11
We could not design our experiment to control for all possible order effects without avoiding potential contamination, as this would have required at least 16 different sections.
12
Approximately 80% of temporary workers quit after 2 weeks and many quit after 1 week. Managers told us it was expected that 15–20% of temporary workers would not return for the second day of work.
13
The number of permanent workers per session was not constant throughout the whole period but there was very little variation. Workers did not move across sections during our study period.
14
Since the bonus scheme is a step function, a greater distance to the next level also implies a smaller distance to the previous level. If employees understand that being close to the next level also implies being far from the previous level, an increase in Distance to the next level would have two effects: a reduction in effort because it is more difficult to reach the next level of bonus and an increase in effort because it is easier to fall to the previous level of bonus. If these two effects are taking place, then our empirical analyses underestimate the effect that feedback would have in the case of a linear bonus scheme. In our empirical analyses we consistently find a negative effect of Distance to next level on performance, indicating that the effort reduction effect exceeds the “fall‐down” effect.
15
After deleting the temporary workers in our sample, there were no individuals for whom the information variable Performance quantile took a value of zero.
16
17
We performed all the other analyses of these paper using also the specification presented in Model 3 and reached the same conclusions presented here.
18
An alternative fixed‐effect estimation approach is Canay's (![]() ) two‐step procedure. The main advantage of Powell (forthcoming) is that it does not constrain unobserved heterogeneity to be additive and therefore allows such heterogeneity to have different effects on different parts of the distribution.
) two‐step procedure. The main advantage of Powell (forthcoming) is that it does not constrain unobserved heterogeneity to be additive and therefore allows such heterogeneity to have different effects on different parts of the distribution.
19
To further explore whether some of the effects could be driven by extremely low performers who are very far from receiving a bonus, we remove the lowest performing employees and limit the sample to employees with performance above 70%. When we do so we continue to find a negative coefficient for the distance variable, although it is no longer significant, suggesting that the effect of distance is stronger for these low performers.
References
Supplementary Material
Please find the following supplemental material available below.
For Open Access articles published under a Creative Commons License, all supplemental material carries the same license as the article it is associated with.
For non-Open Access articles published, all supplemental material carries a non-exclusive license, and permission requests for re-use of supplemental material or any part of supplemental material shall be sent directly to the copyright owner as specified in the copyright notice associated with the article.