
Abstract
We address an assortment‐and‐cutting problem arising in the glass industry. The objective is to provide minimum waste solutions that are robust against such raw material imperfections as those possibly occurring with float glass production technology. The stochastic realization of defects is modeled as a spatial Poisson point process. A mixed integer program in the classical vein of robust optimization is presented and tested on data taken from a real plant application. Defective final products must in any case be discarded as waste but, if a recourse strategy is adopted, faults in glass sheets can sometimes be recovered. Closed forms for the computation of faulty item probabilities are provided in simple cases, and obtained via Monte Carlo simulation in more complex ones. The computational results demonstrate the benefits of the robust approach in terms of the reduction of back‐orders and overproduction, thereby showing that recourse strategies can enable nonnegligible improvements. Encouraged by this result, the management is presently evaluating the possibility of adopting the proposed model in plant operation.
INTRODUCTION
In this paper, we deal with the problem of simultaneously (i) finding a limited assortment of stock items and (ii) cutting them with minimum trim loss to fulfill a known demand of different parts. We develop a formally rigorous framework to address the problem when stock sheets can be affected by faults, providing and testing mathematical models for both defect occurrence and robust optimization of the production process. In this way, we show how one can fulfill the requirements with virtually no overproduction, or pending back‐orders due to defective items, and with the same (or even less) scrap as a faultless process.
Scope of the paper
Our methodology is inspired by a mathematical model, assessed in practice, to optimize stock assortment and cut in a real production plant. The industrial process in the title, in fact a standard in the production of automotive glass parts, makes use of so‐called float technology, which consists of two main phases (see Figure 1). In the first phase, large rectangular glass sheets of various sizes and types are manufactured by widening/narrowing and, after cooling, cutting a ribbon of molten glass; the sheets produced are then sent to a warehouse: We will refer to them as the large items, with heights (lengths) roughly ranging between 2 and 3 m (4–6 m). In a second phase, small rectangular sheets (the small items) are cut from large ones taken from the warehouse, and sent to downstream departments for bending and refinishing.
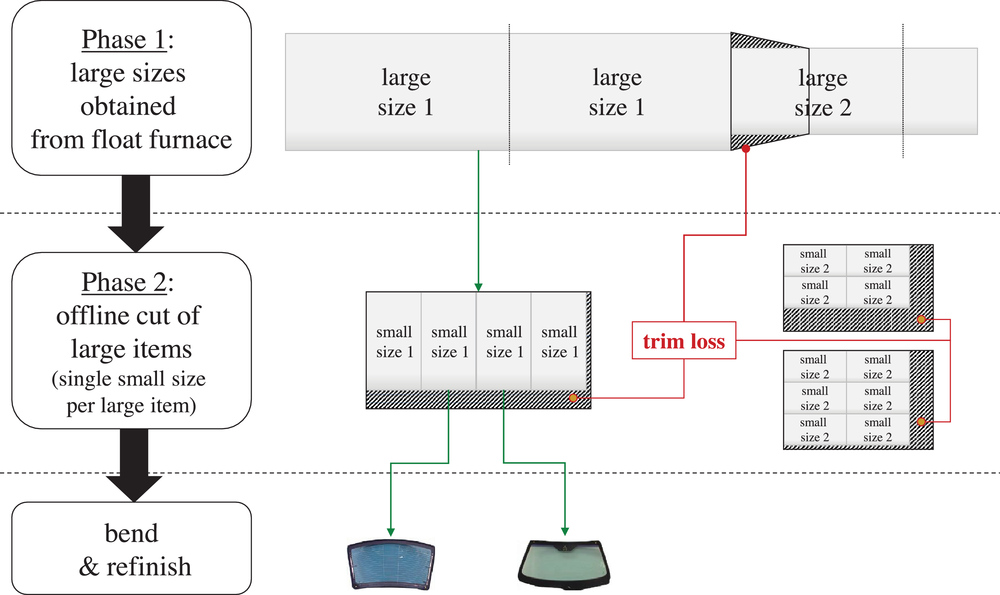
Scheme of an automotive glass production process
An example of the optimization of such a process, reported by Arbib and Marinelli (2007, 2009), refers to a plant operated by Pilkington Italia and now owned by Nippon Sheet Glass Co. Ltd. The purpose is the simultaneous control of the assortment of large items produced in the first phase and of the trim loss generated in the second. The word assortment refers to the number of distinct large sizes that are stored in the warehouse at any time: this number must be limited to a certain amount p to reduce holding cost and setups, and to ease handling operations. To give an idea of the problem scale, the production data set includes about 50 distinct small sizes and over 6500 distinct large sizes varying in the min–max height and length ranges with 1 cm pitch: As the desired assortment level p ranges around 20, over 1057 different assortment combinations can in principle be considered.
In Arbib and Marinelli (2009), the described stock assortment‐and‐cutting problem is formulated as a 0–1 linear program and solved by column generation or by an asymptotically exact heuristic. In this model, perfect knowledge of data is assumed. However, the glass ribbon may now and then come out from the furnace with defects (e.g., bubbles). The defective area of a large item cannot be recovered and is instead recycled, with a resulting reduction in yield: The quoted research, however, did not tackle this issue.
Handling defect occurrence
Different reactions to the presence of defects (or, more generally, of forbidden areas) can be implemented depending on available technology, production line equipment, and work organization. In the literature, see Section 2 below, most papers on cutting optimization assume that defects are known in advance and given as input data. Consequently, the main focus is on the design of defect‐free cutting patterns in a deterministic setting. In this paper, instead, we regard defect occurrence as a random process and approach uncertainty by using a robust optimization model. The model aims at fulfilling a given small item demand with a minimum volume of large items, and defect occurrence is modeled via a suitable uncertainty set, which impacts the solution by reducing the yield of the cutting phase.
Uncertainty is managed by mixing worst‐case analysis typical of adversarial models with some stochasticity assumptions: The total number of defects in the planning horizon is a model parameter, and how many defects are placed in each large item is an adversarial decision; however, the adversary does not control where to place defects in each large item. Yield reduction is therefore modeled, as an expected value, via the probability that the defects present in a large item cannot be recovered.
This setting finds its justification in both problem‐specific and practical reasons. On the one hand, uncertainty management is required because large sizes are not given beforehand, being part of the assortment decision: The optimal cutting patterns are in fact defined before the production of large items and hence before defects are detected. On the other hand, online reaction to defects, once these are spotted in a large item, is not practical either: In fact, although defect‐free cutting patterns can in principle be computed just before loading large items into the cutting machines, the yield gain achieved would be completely absorbed by the additional costs of material handling, machine setups, and downstream departments operation scheduling.
To date, the plant management ignores any potential and even simple reaction, such as putting the defective large items aside and treating them separately, or changing the cutting patterns to reduce defect incidence: Although defects are detected already at the end of phase 1, they are not considered before the cutting stage, and small items affected by faults are simply discarded before the bending and refinishing stage. However, production numbers would definitely justify a policy against defectiveness. Glass imperfections cause in fact a loss of material, currently estimated around 8%–9%, a considerable magnitude given that the management deemed worth of optimization a trim loss estimated around 4%–5%. It is important to stress that discarded items have an impact not only on the efficiency with which raw material is used but also, and more importantly, on the completion of order batches.
A question then arises whether an optimization model that is able to handle this type of uncertainty, perhaps coupled with a suitable recourse strategy, can reduce back‐orders effectively while preserving efficiency in raw material usage. The result we obtained on a set of real‐world instances provided by the plant shows that (i) by protecting against defects, robust optimization substantially reduces back‐orders; and (ii) to be achieved, this result does not need the implementation of any particular (and possibly expensive) recourse strategy.
Justification of the approach
In this section, we briefly discuss the advantages and costs of possible alternatives to our approach. Indeed, the problem we address is operational and does not consider investments in hardware. However, the specific plant operation should not limit the set of options one can consider. Hence, an analysis of technological and/or operational alternatives is necessary to demonstrate our methodological contribution. This analysis is to be carried out while recognizing that the productivity potentially achievable via technological updates (e.g., defect detection systems, new cutting machines) must, on one hand, justify important strategic investments and, on the other hand, provide a broad assessment of the impact on the whole organization. The main technological, but also operational, specificity of the plant considered in this work is that the production process is organized in two phases that are physically separate and time decoupled. In some plants, see, for example Durak and Tüzün (2017), the float line is equipped with defect sensors and bridges, perpendicular to the direction of the glass flow, which can perform cuts directly on the glass ribbon. Defect‐free cutting patterns can therefore be designed and applied on‐line, avoiding in this way assortment and overproduction issues on the large sizes. However, being integrated with the float line, the cutting system has only a few cutting wheels (⩽5 in the cited work) that must be positioned at fixed coordinates during the whole production run. The result is a very limited number of feasible cutting patterns and, consequently, potentially high waste levels. A technological update of this type, then, would not imply a reduction of process costs. Another specificity of the plant is the way small items are cut from large ones. Downstream cutting machines allow only one size per large sheet. This configuration features a very short operation time and a single out‐buffer, meaning high speed, elementary management of the output, and thereby a large plant throughput. Nevertheless, more complex cutting patterns could in principle reduce trim loss. However, complex patterns would make recourse strategies very hard to be computed (and even implemented), and the robust model would become very complex and certainly impractical to solve. Moreover, should one attempt to address this complexity, the trim loss reduction would most likely be negligible. In fact, we find that the solutions obtained with the actual configuration are clearly feasible for machines able to perform more complex cuts, and that they represent a very good benchmark (trim loss below 1%). Checking ex post the demand not met because of defects, and recovering the requirements with an adequate extra‐production, on‐the‐fly, of the necessary large items, is not viable in float glass production plants. The float production campaign is long, has a costly setup, and is not synchronized with the cut of small sizes. In other words, the small items cut at a given time are obtained from large sheets of a glass type (i.e., color and other technical features), which generally differs from the type the furnace produces at that time, and a float switch to that glass type is materially impossible. This is why any solution approach should take into account the uncertainty of defects realization. Finally, any operational reorganization of a plant like the one here considered cannot neglect set‐up issues both at the furnace and in the cutting stage.
Content
The paper is organized as follows. The literature on cutting problems with defects is briefly discussed in Section 2. Then, for convenience of the reader, the assortment‐and‐cutting problem described in Arbib and Marinelli (2009) is reported in Section 3 along with the relevant integer program. In Section 4, we introduce the uncertainty model that, in Section 5, is implemented in terms of robust optimization. Section 6 refines the description of the robust model, and an extensive computational experience performed on real‐world instances is described in Section 7. The paper is completed with Supporting Information EC.2, where we describe the linearization of the robust model used in numerical tests, and the closed formulas devised to compute fault probabilities for large items with ⩽2 defects.
LITERATURE REVIEW
Due to both combinatorial richness and relevance in a variety of industrial contexts, a very large amount of theoretical and application‐oriented papers addressing cutting optimization problems appeared in the scientific literature during the last six decades, that is, since the seminal papers by Gilmore and Gomory (1961), see, for example, the surveys by Wäscher et al. (2007) and Delorme et al. (2016).
Generally speaking, raw material is always potentially affected by imperfections: knotholes in wooden trunks and boards; bubbles in glass; contaminated areas in steel coils; holes, stains, or streaks in paper and leather sheets. This means we find the topic addressed in such industrial processes as lumber and furniture, see Ghodsi and Sassani (2005) and Wenshu et al. (2015); shoes and textile, see Özdamar (2000) and Sarker (1988); and paper, see Aboudi and Barcia (1998). However, relatively few contributions in the cutting and packing literature focus on the problems that arise when cutting defective items.
One of the earliest publications on cutting problems with defects dates back to 1968 (Hahn, 1968). Several variants concerning the presence of one (Carnieri et al., 1993; Neidlein et al., 2009) or more (Afsharian et al., 2014; Wenshu et al., 2015) defects per stock item have been studied since then, both in one and two dimensions. Defect kinds range from simple points to rectangular or convex areas, and from faults causing immediate scrap of the items, to defects which only reduce (at various grades) production quality. A related issue, defect handling, is addressed in several ways: from the optimal use of clear zones (i.e., areas unaffected by faults) to cut optimization that assumes product values varying with fault content and/or placement in the stock items (see Sarker, 1988). Those problems are almost always modeled as mixed integer linear programs and solved by dynamic programming (Durak & Tüzün, 2017; Rönnqvist & Åstrand, 1998), Lagrangean relaxation and subgradient optimization (Rönnqvist, 1995).
In most contributions we are aware of, including those referenced above, the defect list, size, and location are given and known in advance. In some cases, the cutting pattern is also known, and the problem calls for finding a new layout that avoids as many defects as possible. This problem is hard even in the one‐dimensional case, which is known as the Minimum Defective Subset Sum, see Aboudi and Barcia (1998). To our knowledge, only the relatively old paper by Sculli (1981) handles defects with a stochastic approach: Here, the size of a one‐dimensional roll with fringe defects caused by winding is treated as a normal random variable. Expected waste is expressed as a given cumulative density function of the unusable parts at the edges of the roll, and then the optimal position of the knives is obtained analytically. An online optimization setting in glass manufacturing was introduced by Durak and Tüzün (2017); here, cutting bridges directly operate on the glass ribbon, and cuts are performed a few seconds after defects are detected. Therefore, at any given time, defect size and positions are known only for a limited number of stock items, precisely those between the sensor detectors and the cutting bridge. Nevertheless, that partial information allows the authors to address glass defectiveness by solving a sequence of deterministic cutting problems over a rolling horizon. In summary, Sculli (1981) assumes random defectiveness that only affects the edges of one‐dimensional roll items, while the application described in Durak and Tüzün (2017) is very similar to our setting, but the authors treat defect positions as known data.
Rather than defect handling, papers on cutting problems deal with uncertainty especially to address the stochastic behavior of costs and demand. For example, robust optimization is adopted in Alem and Morabito (2012) to address a combined lot‐sizing and cutting‐stock problem, and in Ide et al. (2015) with application in the wood cutting industry. Uncertainty in customer demand is addressed by two‐stage stochastic optimization in Alem et al. (2010) and Beraldi et al. (2009). A cutting stock problem with random customer demand and random cutting times is investigated in Krichagina et al. (1998) and approximated by linear programming and a dynamic control problem involving Brownian motion. Finally, a branch‐and‐price method for robust optimization is proposed in Schepler et al. (2022) to address one‐dimensional bin packing with items of uncertain sizes.
THE STOCK ASSORTMENT‐AND‐CUTTING PROBLEM
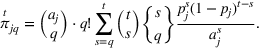
The glass cut process described in Arbib and Marinelli (2007, 2009) involves a first phase that produces large rectangular items, which are to be cut, during a second phase, into desired amounts of small rectangular items of given sizes. The 0–1 linear programming model proposed in Arbib and Marinelli (2009) to optimize the cut process can be summarized in the following way.
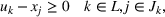
Let a set of no more than p large sizes that, among all the possible choices, allow the cut of all the demanded small items with a minimum trim loss.


The rules adopted in the plant and the technological constraints of the downstream cutting machines greatly simplify the cutting patterns, that are limited to those obtaining small items of the same size from each single large item. In particular, the small items of a pattern have all the same orientation and, of the two possible orientations, we always select the most productive one; the first guillotine cut is always performed horizontally, that is, along the width of the large item, and trim loss is always located on the bottom right side of the large item.
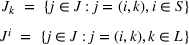
Therefore, referring to a subset


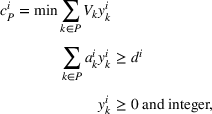


Once the


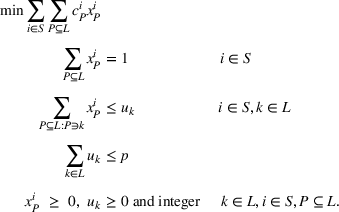
In problem (2), variables are implicitly bound to get values in


Since the number of


In practice, the p‐median heuristic is very effective and permitted a reduction of the plant trim loss to one third of the initial amount. In the sequel, we will then refer to this simplified model, that is, to program (2) written with


UNCERTAINTY MODEL AND RECOURSE STRATEGIES
Problem (1), and indirectly problem (2), assumes parameters

The most widely known approaches to deal with uncertain data are stochastic and robust optimization, see Ben‐Tal et al. (2009) and Birge and Louveaux (2011).
The former requires that the probability distributions and possible scenarios are known in order to describe the random variables, and can lead to very large models that are hard to solve. For this reason, it will not be considered here. In the latter, the range of uncertainty can be derived from historical realizations of the random variables. Robustness can be addressed in various ways. The strict concept early proposed by Soyster (1973), where an optimal solution is always feasible for every realization of the random parameters, was later mitigated by Bertsimas and Brown (2009) and Bertsimas and Sim (2004), who proposed an approach where optimal solutions are protected against the change of a given number of uncertain coefficients, generally related to each other in some mathematical way. Compared to other proposals in the literature, and according to Bertsimas and Sim (2004), one of the benefits of a robust approach is that the robust counterpart remains computationally practical independently of the number of uncertainty parameters, meaning that at least it remains in the realm of integer linear programming. This is the main reason that led us to adopt this approach.
Let


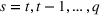
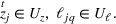
More precisely, let for each large item of size k,


Due the conditional property of a Poisson point process, the distribution of


The random variable

Concerning the third issue, depending on cut feasibility, we consider three degrees of pattern reconfigurability (see Figure 2): No reconfiguration, NR. Patterns remain unchanged: A defect always causes a yield loss, unless it falls into the scrap area. This is the policy presently adopted in the plant. Constrained reconfiguration, CR. Patterns can be reconfigured provided that no more cuts are employed than the minimum used in normal operation: That is, strips of scrap can be moved from the bottom or right edge of the large item, but cannot be split up. At present, the plant management is evaluating this option. Unconstrained reconfiguration, UR. Patterns can be reconfigured also by splitting scrap strips with additional cuts. This recourse strategy is more general and effective (but more complex).
(a) No reconfiguration, (b) constrained, and (c) unconstrained reconfiguration
A maximum of 187 small items (laid out on 17 strips with 11 items each) can be obtained from a large item in the instances provided by the plant. A CR that avoids as many faults as possible can easily be obtained by checking all the possible positions of the horizontal and vertical scrap strips. If the cutting pattern consists of n horizontal and m vertical strips of small items, the horizontal and vertical scrap strips can be placed in


By contrast, computing the best UR requires a tailored approach, which is beyond the scope of this work.
A defect still causing a yield loss after reconfiguration is called critical. Let Q denote a random variable giving the number of critical defects in a large item. For any production lot


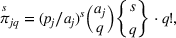


For positive trim loss, we use formula (9) for

For more sophisticated recourse strategies the expression of


ROBUST MODEL
Formulation (2) with separate pricing (1) is not suitable for modeling uncertainty in the vein of robust optimization, because delayed column generation cannot manage the bundle of uncertain coefficients that goes across the pricing problems. However, the good features of the p‐median heuristic described in Arbib and Marinelli (2009) can help in two ways. On one hand, we can directly modify it to try and address the losses due to defects. On the other hand, we can use it as a starting point to define the (more sophisticated) robust counterpart.
Let us first focus on the first approach. According to the notation in Section 3, for any lot


Generally speaking, the extra small items required to compensate those lost by defects can be produced by keeping a pool of additional large items of a generic size. Observe however that such a simple strategy is largely dominated, in terms of loss minimization, by the solutions of [P] that already provide a suitable amount of large items of a specific size for each small size. As a reference figure, the trim loss of instance I15 obtained by [P] is 1.09% (see column


Details of instance I2, and the solutions obtained by [P0] and [R]. In bold are the different large sizes chosen by [R].


Solutions with no reconfiguration strategy. In bold are the averages over instances I1 ‐ I11.


With the second, robust approach, let 


Let now 


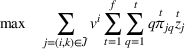
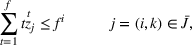
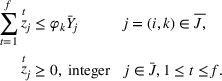
The goal is to minimize the total glass volume used for production. For any given lot 


Unlike Bertsimas‐Sim's, the uncertainty sets 


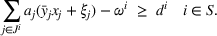

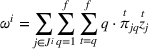

Maximizing (26) subject to (27) gives, for each 


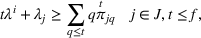


The resulting model has bilinear terms 

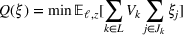
While it is not among the purposes of this paper to undertake a stochastic programming approach, a two‐stage SP formulation is sketched below in the interest of discussion. This is stated as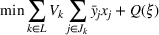


TECHNICAL DETAILS OF THE ROBUST FORMULATION
The complexity of model [R] rapidly grows with the number 


Although the probability of a faulty item decreases when a maximal pattern is turned into a nonmaximal one by removing one or more items, the adoption of maximal patterns is justified by the following result. If an NR or CR strategy is implemented, see Section 4, model [R] always has an optimal solution that consists of maximal patterns only.
Let us focus on a pair 


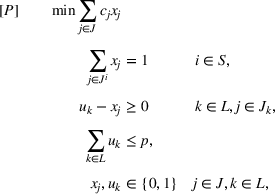
As for the set L used in the formulations, in the original problem by Arbib and Marinelli (2007), candidate large sizes are preprocessed, for each instance, according to the following procedure. First, define the set L0 of ideal large sizes for which there exists at least a small item i that can be cut without trim loss. Formally, For any 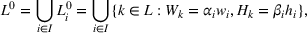

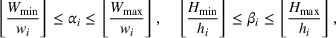


In our data set, 
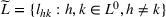
However, once the aleatory presence of defects is introduced, it is possible that 
Consider the simple case of 


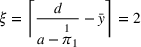


Although in the example a minimum is achieved by a large size not in 


COMPUTATIONAL EXPERIENCE
The models discussed above were tested on real data provided by the plant. Besides a comparison of CPU time, the test aims to evaluate the benefits, in terms of expected reduced loss and under/overproduction, obtained with random defects when the solutions of the robust model are implemented with different recourse strategies (see Section 4): NR, that is the action currently adopted in the plant, and CR. Because UR is quite far from the current practice and since, as noted in Section 4, computing the best UR is not straightforward, we left the UR strategy out from our numerical test.
The test compares four approaches: the deterministic p‐median model [P0] obtained by setting the p‐median models the linearized version (described in Section EC.2.3, see the Supporting Information) of robust model [R].
Solutions were tested by means of (i) a Monte Carlo simulation that generates defects according to a spatial Poisson process and (ii) an adversarial deterministic model that generates the maximum expected number of critical defects.


Setting
The test was carried out on 15 problem instances, each one representing a production campaign: 10 instances are those used in Arbib and Marinelli (2007); the remaining five, namely, I2, I3, I7, I8, and I14 in Table EC.1 in the Supporting Information, were newly provided by the plant. The details of test instances are reported in the Supporting Information Section EC.1. All the integer programs were solved using Gurobi 9.1.1 with default setting on a QUEMU virtual CPU 1.5.3 machine (8 cores) at 2.26 MHz with 8 GB of RAM. Gurobi precision parameter
Since, according to (6), seven or more defects in the same large item are relatively rare (a priori assumptions attribute to this event a probability of 


Analysis of results
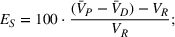
Let 


The solution quality of 


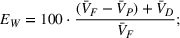
The impact of defects on the solutions is taken into account by evaluating, for the percent deviation the percent expected waste the percent expected number 


We computed 
Monte Carlo simulation
Computing 


The number of defects 


In particular, the large item 


Worst‐case simulation
Given a solution 


As in [R], 


Solution analysis for a small instance
Before giving the aggregate experimental results, let us compare two solutions of instance I2, computed via [P0] and [R], to illustrate the improvement obtained by the robust model. The demand of this problem, one of the smallest of our benchmark set, must be manufactured using no more than 


The large sizes selected by model [R] partly differ from those chosen by model [P0]: In detail, to produce small size 76 × 122, [P0] uses the ideal large size 304 × 610 and so there is no trim loss in this case; [R] uses instead the smaller (but not ideal) size 304 × 496. Also, [P0] produces small size 46 × 24 by the same large size used for the former, whereas [R] chooses 304 × 496.
We launched a Monte Carlo simulation on both solutions, obtaining, for [P0], an expected waste For [R],


In conclusion, the main result obtained with [R] is that a high back‐order level is reduced to zero with no increase (actually, with a slight reduction) of total waste and trim loss.
Results for NR strategy
For each instance, Table 2 describes the solution, respectively, computed by the deterministic p‐median model [P0], by the probabilistic p‐median models 


Tables 3 and 4 describe the protection that solutions offer against defects. This feature is evaluated by the expected values 


Results of Monte Carlo simulation. In bold are the averages over instances I1 ‐ I11.


Results of worst‐case scenario. In bold are the averages over instances I1 ‐ I11.


Performance of Monte Carlo simulation with NR strategy. In bold are the averages over instances I1 ‐ I11.


The p‐median models (both deterministic and probabilistic) are much easier to solve than the robust counterpart of [P0]: all the [P] instances were solved in less than 4 s (0.36 on average), whereas only 10 [R] instances were solved to optimality within the time limit. For the remaining instances, we obtained solutions with optimality gap of 3.18% on average. In the tables, we reported the values averaged on I1–I11 only, that is, on instances for which we could find optimal or near‐optimal solutions with both models.
The probabilistic and robust solutions exhibit, as expected, a better global behavior. Being unaware of defects occurrence, model [P0] provides for a quite small overproduction (0.12% on average) essentially due to the leftovers produced by the last large item of each lots. By contrast, models 
It is interesting to observe that the models behave very similarly in terms of trim loss (precisely, that of 
We also observe that [R] almost fully balances the negative and positive net productions of the probabilistic p‐median models. The overproduction 


A direct consequence, very detrimental for production costs, is that in all instances but I2 model [P0] does not allow the completion of any order batch (


About the Monte Carlo simulation, Table 5 shows, for each model, the number of iterations of the simulation, the CPU time, the average number 


We finally observe that the sample means are almost always slightly lower than the corresponding analytical values (with a maximum difference of 0.012%). However, the values of all the analytical means fall in the 95% confidence intervals of the statistical parameters obtained by Monte Carlo simulation. The small bias is probably due to the fact that, for the sake of numerical precision, we approximated 

Results for CR strategy
Tables 6, 7, and 8 give the results obtained with CR strategy. Table 6 has no [P0] section since it is the same as Table 2: in fact, [P0] solutions are not based on probabilities and therefore are identical. The other models behave very similarly with CR and NR strategy, with a slight general reduction, in the former case, of both trim loss and overproduction. With model [R], trim loss reduces to 1.18% (vs. 1.19%) and overproduction to 8.53% (vs. 8.89%).
Solutions with constrained reconfiguration strategy. In bold are the averages over instances I1 ‐ I11.


Results of Monte Carlo simulation


Results of worst‐case scenario


If one reads the outcome of the Monte Carlo simulation, [P0] turns out to produce the same percentage of back‐orders as with NR. On the other hand, the mean percent underproduction and the mean total waste 
We observed similar variations in [R], 


Overall, the implementation of CR strategy keeps the percent deviation 

A final note on the performance of the simulations: Table 9 shows the details of Monte Carlo simulation for CR strategy. Our considerations are similar to those done for Table 5, but some differences appear when comparing simulation performance of CR and NR. With the former strategy, the CPU time required for instances I1–I11 is generally larger than with the latter, reaching 89.19 s with model 


Performance of Monte Carlo simulation with CR strategy


CONCLUSIONS AND FUTURE RESEARCH
We addressed a stock assortment‐and‐cutting problem with the goal of constructing optimal solutions that are robust against imperfections of raw material. The problem and the computational results presented here refer to a real application in the glass industry. Defect occurrence was modeled as a Poisson point process. On that basis, we developed approaches that protect solutions against the worst possible distribution of f defects over the glass sheets to be cut.
Depending on the recourse strategy used, a defect on a glass sheet may or may not be avoided. With the simplest reaction considered in the present case, that is, NR, the recourse simply consists in doing nothing. The small items hit are just discarded with no attempt to reconfigure the patterns. In more general and effective (but also complex) reactions, patterns can be reconfigured by moving the strips of scrap (CR), or even by splitting them with additional cuts (UR) in order to let defects fall in the trim loss.
Within each glass sheet, we then evaluate the expected loss of produced items via the conditioned probability of finding a defect unrecoverable with the recourse strategy adopted. Closed forms for the computation of such probabilities were provided in simple cases, and obtained via Monte Carlo simulation in more complex ones.
Starting from a deterministic p‐median model that minimizes the total glass area used, two alternative approaches were presented. In the first one (models both approaches mitigate the pronounced net production deficit and back‐order volumes found by deterministic solutions, while keeping trim loss pretty much at the same (low) level. Nonetheless, Conversely, the robust model [R] halves the amount of back‐orders with a net production that deviates from requirements by only 0.06%. The price of robustness, consisting in the initial overproduction, is then completely absorbed. Finally, a redesigned easy‐to‐implement recourse strategy, CR, achieves a nonnegligible 3.5% reduction of total waste, mainly attributed to a mean 4% reduction of the defective area. This is a valuable figure in case defective items are not treated as waste but as lower value products.


In our opinion, the results open interesting perspectives and research challenges in the field of stock cutting. In fact, despite the recognized importance of defect handling in industrial applications, very few studies can be found on this subject. To the best of our knowledge, none of them address the problem of finding robust solutions. Among the questions left open we can list the following: How should robustness against defects be dealt with in standard cutting stock, or in general one‐ and two‐dimensional knapsack/bin packing problems? Clearly, the possibility of solving model [R] algorithmically (by, e.g., column generation and/or branch‐and‐price) is both interesting and relevant. It is not clear whether a stochastic programming formulation would lead to a better performance in both computational and economical terms. This topic is worth a separate investigation and left as a potential future project. What is the complexity of fault recovery with UR recourse strategy or more complex ones?
Finally, in our case study, trim loss and defective items are not distinguished but altogether treated as waste. This is not the case for industrial production in general. For example, some defect types are tolerated in wood‐board cutting and the items affected are not treated as waste but as lower value production. In such cases, it would be interesting to understand how robust solutions would change, and in particular whether they would or would not make a larger use of trim loss as a means to increase protection against value loss.
Footnotes
ACKNOWLEDGMENTS
We gratefully acknowledge the technical support of the R&D department of Nippon Sheet Glass Co. Ltd., with special thanks to Dr. Eng. Alessandro Consorte and Marcello Romano for the help given in the analysis of defect generation. We are also very grateful to the AE and the anonymous reviewers for the in‐depth reading and stimulating comments, which helped us improve the quality of this contribution. Finally, we would like to thank Prof. Simon Wigley for the kind editorial support.