
Abstract
The shipping industry touches approximately 90% of all international trade, producing roughly one billion tons of greenhouse gases each year. Changes in the operations and coordination of global‐shipping vessels can have a substantial impact on vessel's carbon emissions, but these efforts need to fulfill the service expectation of individual firms receiving consignments. We examine the associated gains (or losses) in operational efficiencies and environmental benefits (if there are any) from vessel sharing. We do so by analyzing a dataset that merges multiple years of U.S. port records and maritime emissions data. Using simultaneous regression equation models, our results indicate that the maritime emissions (attributable to receiving firms) drop by 5%, on average, for each additional carrier sharing a vessel. We confirm several operational efficiencies emerging from vessel sharing, such as increased average utilization and reductions in “route redundancy.” These operational changes mediate the total effect of vessel sharing on emissions. However, we do find that vessel sharing is associated with a slight increase in lead time, measured as the number of days it took to deliver the goods. Although our empirical setting is in the global shipping industry, asset sharing is a mechanism that can be adopted by any industry. Our findings show the importance of exploring the conditions and settings where sharing may or may not have operational and/or environmental trade‐offs.
INTRODUCTION
Firms around the world are showing increased interest in carbon footprint reduction, seeking to lower emissions not only at their own facilities but across their connected supply chains (Blanco et al., 2016; CDP, 2017; Linton et al. 2007). This heightened interest is notably relevant in global shipping. The market for global shipping has increased from $4.6 billion in 2016 (Persistence Market Research, 2018) to $8 billion in 2020 (Globe Newswire, 2021), and this market growth is anticipated to contribute to higher carbon emissions output. In association, the total carbon emissions from global shipping rose from 962 million tons in 2012 to 1056 million tons in 2018 (Saul, 2020). While attention is often drawn to the carriers and owners of vessels generating these emissions, few studies have empirically examined the experience of firms receiving goods via such maritime transport. As a result, it is unclear how distinctions in the manner in which goods are shipped to receiving firms might account for differences in the maritime component of their own carbon footprints.
In this paper, we focus on one of these distinctions in particular: Vessel sharing and its impacts on maritime operations and carbon emissions outcomes. Vessel sharing is an agreement between two or more carriers to allocate space in order to better fulfill demand or improve maritime operations (Qiu et al., 2018). Carriers that compete largely in the same markets and for the same customers can purchase large vessels to potentially reduce their shipping costs and carbon emissions (Lindstad et al., 2012), but these large investments can come with substantial risks of underutilization (or excess capacity) that undermine cost and emission benefits. Vessel sharing provides a means by which to rationalize large‐scale investments, reduce underutilization risk, as well as distribute management tasks (Ghorbani et al., 2022; Qiu et al., 2018). In other words, at a basic level, it suggests a means of doing more at a lower cost. Engaging in such sharing represents a shift from a strictly competitive stance to one that involves syncretic 1 rent seeking 2 (or cooperation to collectively increase potential revenues or decrease costs) to occur (Lado et al., 1997), yielding both private and common benefits through strategic collaborations. In this cooperative stance, carriers benefit from a greater variety of resource utilization opportunities. Associated mutuality 3 (or shared benefits) also inspires higher levels of coordination which can in turn yield benefits across multiple operational dimensions.
Although there are potential benefits in sharing vessels, more carriers involved in joint operational decision‐making can create challenges. Vessel sharing requires multiple carriers to coordinate, and this can contribute to the complicatedness (in the terminology of Vachon & Klassen, 2002) of the management system overseeing vessel‐voyage planning. The result can yield suboptimal or only locally optimal solutions in vessel loading or route design. Accordingly, even in the presence of common interests in increased operational performance, benefits achieved along one operational outcome may come at the cost of another (Ghorbani et al., 2022). Diminishing returns to sharing may also become evident, as the impact of complexity in coordination may become increasingly evident as a greater number of carriers become involved.
With such arguments and counterarguments in mind, we examine the following research questions. Do firms which receive consignments of goods by way of highly carrier‐shared vessels also see relative reductions in their Scope 3 emissions attributed to maritime transport? Are these benefits tied to changes in the operations of shared vessels? These questions implicitly highlight two objectives. The first is a desire to understand how decisions by carriers translate into environmental outcomes for receiving firms. The second is the importance of dissecting the operational paths through which that translation occurs.
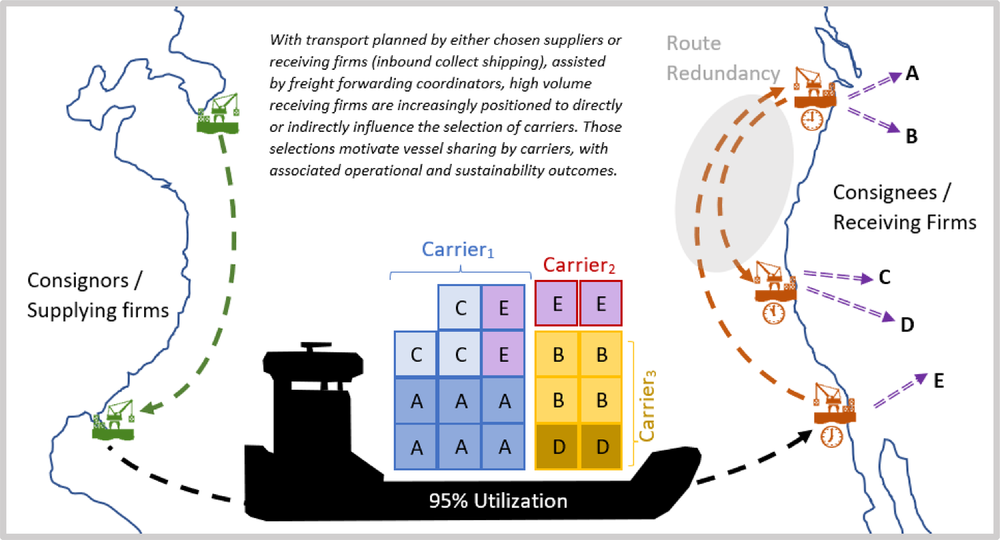
To examine these questions, we make use of several complementary data sources. The first is a sample of import and export bills of lading (BoL) from the Port Import/Export Reporting Service (PIERS). After screening cases for which data are insufficiently complete, this sample provides details on maritime deliveries of goods to more than 9000 firms. These data specify carrier information per entry, voyage routes, and durations, permitting the identification of vessel sharing across carriers and an examination of efficiencies in transport operations associated with such sharing. We merge these data with individual vessel capacity records and corporate sustainability reports issued by carriers, outlining annual carbon emission estimates in all maritime shipping activity (Scope 1 carrier emission data, which inform the maritime component of Scope 3 emissions for receiving firms). The combination of these data allows for an objective estimate of maritime emissions attributable to individual firm fulfillment. This in turn allows for an examination of the impact of vessel sharing on these estimated emission levels. Figure 1 illustrates some of the potential operational details associated with vessel voyages that we consider in our analysis of the impact of sharing.
Common sources of Scope 3 emissions in international sourcing
Vessel sharing, if coordinated thoughtfully, can positively impact maritime operations. That is, with reference to Figure 1, the opportunities to increase utilization will include options that also reduce the total number of ports visited, the prospect of overlap in a voyage, and the number of days in transit. Other options will also exist, of course, where gains in one outcome (e.g., utilization) may come at the expense of others (e.g., days in transit). Nevertheless, based on our arguments, we anticipate that increased sharing has a greater tendency to yield multiple operational benefits, along with environmental ones, with trade‐offs due to higher coordination complications occurring only in extreme cases.
Overall, our estimates suggest that receiving firms see a 5% reduction in attributable maritime emissions for each additional carrier active in vessel voyages delivering their goods. This is due, in part, to increased vessel utilization. Specifically, the utilization of capacity on vessels transporting goods to recipient firms increases by 0.182 percentage points on average for each additional carrier active on those vessel voyages. Vessel sharing also appears to yield improvements in voyage efficiencies by reducing route redundancy by 1.92 percentage points. Yet trade‐offs exist, with vessel sharing increasing the total days in transit. Our results show that one additional day in transit is associated with about 3% higher emissions, but the impact of vessel sharing on the length of days, although statistically significant, is economically small at roughly 1%. Further, our post hoc analysis of the decreasing marginal benefits of vessel sharing reveals that the remaining direct effect of vessel sharing exhibits a strong curvilinear relationship. Specifically, after accounting for mediating paths through route redundancy and vessel utilization, very high levels of vessel sharing are associated with smaller contributions to emission reductions.
The structure of our main discussion proceeds as follows. The next section provides an overview of the related literature and presents our theoretical arguments. In formulating our hypotheses, we discuss the nature of rent sharing and coordination complicatedness generated through vessel sharing as well as a pragmatic view of carrier incentives. Our arguments consider combinatorial options available through the increased sharing. We outline implications for firms receiving consignments from carriers, as key stakeholders impacted by and potentially influencing vessel sharing decisions. Section 3 describes our data and methods applied in examining our hypotheses, with the specification of analytical results presented in Section 4. Additional analysis and robustness tests are detailed in Section 5, followed by a discussion of conclusions, limitations, and future work in Section 6.
THEORY AND HYPOTHESES
Global shipping is a process network where many actors play a role to fulfill a service (Gualandris et al. 2015). The nature of the process network, its operations, and how actors interact with each other can influence the network's aggregate greenhouse gas emissions (Dooley et al. 2019). Prospective economic and environmental benefits of vessel sharing have been analytically identified by authors such as Qiu et al. (2018), however, to date, empirical evidence in support of these benefits has been lacking. While carbon reporting of direct and supply chain emissions has expanded in the past decade (Blanco et al., 2016; Jira & Toffel, 2013), challenges associated with self‐reporting by firms receiving maritime shipments and the merger of data available from carriers, regarding their operations and vessels, has been a barrier to inquiry. In this work, we attempt to overcome these challenges by manually collecting and compiling data from numerous sources, allowing us to empirically examine the potential link between sharing, operational changes in maritime shipping and emissions.
The critical role that ocean shipping plays in global logistics (Ferretti et al., 2016), and greenhouse gasses has motivated research to delve into assorted challenges the industry faces, in particular (cf. Corbett et al., 2009; Eide et al., 2009; Haehl & Spinler, 2020; Wang, 2020). The research that focused on outcomes for carriers and vessel owners has considered complications in scheduling (Du et al., 2011), vessel fleet portfolio maintenance (Lu et al., 2017), network design (Agarwal & Ergun, ), pricing (C. Y. Lee et al., 2015), and profit allocation (Chun et al., 2017). Empirical findings emerging from this body of work suggest that the relationships between operational choices and outcomes can be nuanced.
Some of this nuance emerges from coordination challenges. Ferretti et al. (2016), for example, examined the investments of four large carriers in cold ironing (or onshore power) and other broad operational choices, such as the use of slow steaming (operating below maximum speed). The authors suggested that some of these investments could involve the acquisition of larger vessels but that this requires coordinating with port managers to accommodate large ships (i.e., “cospecialized assets”). In a horizontal sharing context, Du et al. (2011) studied the impact of berth scheduling, the management of space allocation in carrier‐shared vessels, and its impact on vessel emissions. Their findings suggested trade‐offs between efforts to improve carrier‐shared vessel operations, optimize shipment scheduling, and reduce emissions. The ability of carriers to coordinate with other entities, in short, fundamentally impacts the ability to realize a range of benefits.
In most of these instances, the focus has been on carrier and vessel‐owner outcomes, however. Unexplored is the impact that horizontal coordinated activity by carriers can have on downstream stakeholders such as receiving firms (consignees). What can individual firms expect from the potential operational gains of such sharing? Can operational gains, made possible through an increase in planning options, cut through the challenges that greater complications in planning can create? Are these gains sizeable enough to translate into reductions in the carbon footprints of individual receiving firms?
Fransoo and Lee (2013) draw attention to the importance of closing gaps such as this in the literature. In our work, we leverage some of the metric vantage points they describe, utilizing variables that may partly explain routing and travel time variation, with implications for emissions. In this respect, our paper also reflects the perspectives taken by Jabali et al. (2012) and Choi et al. (2012) with several exceptions. Jabali et al. (2012) look at the carbon emissions outcome associated with vehicle routing. Choi et al. (2012) look at the operational complexity of container scheduling. Although vehicle and vessel routing share similar features, and complexity broadly encompasses multiple issues, our work focuses on the expansion of options and complicatedness, in the terminology of Vachon and Klassen (2002), that comes with horizontal vessel sharing. Our empirical examination analyzes objective measurements of the extent to which receiving firms receive consignments of goods by way of carrier‐shared vessels. In this section, we will outline theoretical arguments that lend themselves to an empirical exploration of the operational and environmental implications of vessel sharing.
Vessel sharing and Scope 3 emissions of receiving firms
Schwartz et al. (2020) identified three operational levers that are both profitable and sustainable. These include internal changes (voyage optimization), bilateral agreements (a contract between the ship operator and the cargo owner), and network‐based contracts (or cargo coordination platforms). Network‐based contracts and bilateral contracts that enable better coordination, cross‐consignment, and which alter the scheduling and utilization of vessels can lead not only to cost savings but also to lower overall carbon emissions (Schwartz et al., 2020).
Specifically, network‐based contracts are conducted through considerable information sharing aimed to enhance the matching of available spaces to a wider number of receiving firms. This in turn enhances the scheduling and effectiveness of vessel voyages, given a time window of operations. Such improved scheduling can reduce the number of visited ports, time spent in ports, and generally improve the use of vessels and specific routes designs, with associated reductions in an array of costs including, ostensibly, environmental ones (Ng, 2017). We expect these benefits to be observable at the level of the receiving firm as well, provided consideration of the various vessel voyages that deliver consignments to them in the course of a year. The more a firm receives shipments through highly shared vessels, the lower the level of maritime emissions attributable to that firm.
As will be discussed explicitly in the following sections, the attribution of maritime emissions to individual firms requires the consideration of both the emissions observed by carriers as well as the fraction of total tonnage shipped to a receiving firm. This particular lens allows a more specific focus on maritime Scope 3 for receiving firms, which alternative Scope 3 reports (e.g., CDP data) are unable to provide.
It is worth noting, however, that the assumption that maritime emissions can be easily attributed to receiving firms, for empirical analysis, is not a trivial one. To begin with, downstream recipients of goods have little direct transparency into such issues as ocean conditions and trading routes contribute to maritime emissions (Yuan et al., 2018). Further, as the number of carriers sharing a vessel increases, per unit ownership of emissions among carriers, for example, grows increasingly complicated (cf. Caro et al., 2013; WRI, 2004). This gives rise to several concerns for downstream receiving firms, chiefly the fear of double counting the carbon emissions associated with sharing a vessel, common in joint production systems (Caro et al., 2013), and differential cost allocations across carriers implying distinctions in carbon emission reporting (Rehmatulla & Smith, 2015). Concerns over how best to account for emissions often result in under‐reporting (Blanco et al., 2016).
Vessel sharing and transport operation efficiency
Vessel sharing involves subdividing the cargo capacity of an ocean vessel among two or more carriers for a given voyage with the main interest of reducing costs per unit tonnage borne by each carrier involved (cf. Guo & Wu, 2018; Yu et al., 2015). The prospective ability of carrier–vessel sharing to yield operational benefits, in common across otherwise competing entities, can be rationalized by coordinating with other carriers (Lado et al., 1997; Rumelt, 1984) and mutuality (Granovetter, 1985; Poppo & Zenger, 2002) perspectives. Vessel sharing can be viewed as a strategic interdependence of entities (carriers, in this case) to both compete and cooperate in using resources to create value beyond expected economic returns. It promotes reciprocity and coordination, particularly in complex transactional settings. This is critical, since, as Williamson (1983) argues, under bounded rationality, complexity in transactions has a tendency to foster suboptimal outcomes in the absence of effective reciprocity in coordination.
In the context of shipping, an increase in horizontal coordination (more carriers sharing a vessel) increases the variety of options available for filling the capacity of a given vessel. Assuming carriers are interested in coordinating with each other to reduce costs, it permits a broader consideration of the content that might fill that space, and a rationalized consideration of the total number of ports to be visited (for both loading and delivery). This is because a greater variety of port, volume, and timing combinations exist across the combined consignees as the number of carriers sharing a vessel grows. Supporting Information Appendix A provides a simple illustration of how multiple operational benefits can emerge when options are thoughtfully deliberated upon. Motivation to pursue these objectives is natural to most carriers, though the implied interdependence among carriers sharing a vessel can also advance accountability and deliberation towards their accomplishment (Parola et al., 2014). The result is that carrier–vessel sharing can yield a greater chance of maximal capacity use, and a greater likelihood of simpler, more cost‐effective ocean routes. In association, the total per tonnage emissions of such shared vessels can also be reduced.
There are some caveats, most notable of which is the negative role of increased coordination complexity that accompanies this growth in options. In an alternate resource sharing context, Van Dijk and Van der Sluis (2008) show that the operational benefits of call center pooling may be highly contingent on the level of complexity associated with that pooling. The more complex, the less benefit to reaped from sharing. An analogy may exist in the context of vessel sharing. With more carriers, and a wider variety of receiving firms to pool and manage, coordination and scheduling challenges can arise. This is especially true when receiving firms have unique goals and priorities that do not align with those of other firms or carriers. The specific type of complexity this gives rise to is most closely aligned with the “management system complicatedness” quadrant of Vachon and Klassen (2002); in contrast to the “process/product complicatedness” quadrant, emblematic of the Van Dijk and Van der Sluis (2008) research context.
In the vessel sharing context, as related coordination challenges arise, they may result in delays in the execution of bay planning and scheduling decisions, and ultimately suboptimal allocations as complex coordination efforts deplete available time and options. Dynamics of this kind call into question whether benefits or costs will dominate; or whether benefits in one dimension will trade off for losses in another. Echoed in our discussions with industry representatives, this specter of having “too many cooks in the kitchen” has traditionally deterred the prospect of sharing for some carriers and continues to some extent today. It is worth noting, however, that this is despite evidence of the deleterious effects of management system complicatedness being limited and mixed (Bozarth et al., 2009; Vachon & Klassen, 2002; Wiengarten et al., 2017); and lacking any clear evidence that such complicatedness would outweigh associated net benefits from this form of sharing. Nevertheless, it is plausible that in the interest to advance certain operational outcomes, others might be traded off.
The existence of carrier alliances can also broadly deter carriers from fully capitalizing on sharing opportunities with those not involved in such standing agreements, thus further constraining opportunities. However, these self‐imposed constraints do offer value empirically. That is, the existence of carrier–vessel sharing scenarios as well as scenarios where vessels are largely unshared provides critical variance across the experiences of firms receiving consignments from voyages. This variation in turn permits the examination of whether different levels of exposure to vessel‐sharing relate to more or less operationally efficient maritime transport. Accordingly, assuming cooperative dynamics inspire the seeking of common benefits, and thus motivate thoughtful coordination that takes advantage of options, rather than suffering from additional management complicatedness, we pose the following generalized hypothesis: The more a firm receives shipments through highly shared vessels, the more likely that was achieved by way of an operationally efficient voyage.
In our discussion of methods, we will provide additional illumination and rationale for specific forms of operational efficiency to be considered in analysis: vessel utilization, route redundancy, and days in transit.
These issues could skew an empirical examination, muddying or amplifying the relationship described in H2. Therefore, to close the loop, it is critical to position these voyage efficiencies as intermediate outcomes in the relationship between receiving firm experiences with carrier‐shared vessels and the Scope 3 emissions attributed to those receiving firms. This positioning is logical, with authors such as Schwartz et al. (2020) emphasizing that voyage optimization is highly reliant on contract and agreement decisions, in that the latter can enhance the ability to optimize voyages. Further, previous work such as that of Qi and Song (2012) has specifically shown, through simulation, that more operationally efficient vessels and routes can lead to a reduction in total emissions for each voyage. These authors use their analysis to describe how, despite facing market uncertainty for the demand for cargo space, scheduling can be optimized to improve routing decisions, leading to fuel efficiencies and lower carbon emissions.
In short, if emission reporting accuracy is not substantially and distinctly hindered through the complications of sharing, then one should expect to be able to observe the connection between high transport efficiency and reductions in the levels of emissions attributed to receiving firms. The more a firm receives shipments through highly transport‐efficient voyages, the lower the level of maritime emissions attributable to that firm.
Figure 2 provides a box‐arrow diagram summarizing the hypotheses formulated in this section. The focused empirical consideration of these theoretical linkages motivates the structure of our data methods and analysis that follow.
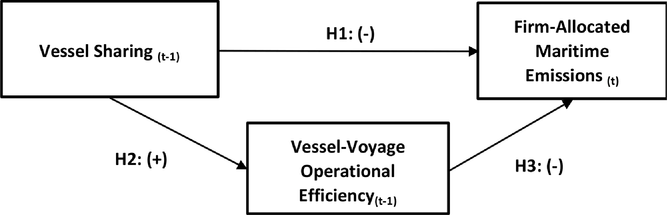
Main hypotheses and structure of analysis
DATA AND METHODS
Data sources
The data for our investigation come from an array of sources (see Supporting Information Appendix C). Integral to our study is the PIERS U.S. Import/Export Bill of Lading database collected by IHS Markit. This database is formed of U.S. Customs and Border Protection documentation. PIERS compiles these documents on a daily basis, amounting to almost 60,000 BoLs per day. Each BoL document contains a list of import items consigned to each vessel shipment destined to a receiving firm, with details on specific vessel information such as vessel name and International Maritime Organization (IMO) code, the number of twenty‐foot unit (TEU)‐equivalent goods delivered for each company, departure and arrival ports, and departure and arrival dates. We sample 1,707,341 BoL records between 2013 and 2015 from this dataset, aggregating the BoL vessel‐voyage data to each firm‐year observation. Prior to merging with other sources, the raw data at the receiving firm level contain 20,965 firm‐year observations. As will be discussed in the next section, these observations allow us to derive measures of vessel sharing (i.e., independent variable) and operational measures of transportation efficiency (i.e., mediator variables) on which our hypotheses focus.
In order to develop our primary dependent variable measures, we supplemented the PIERS data with manually collected information on annual maritime emission levels in corporate sustainability reports of the carriers. Annual maritime emission levels are reported as Scope 1 emissions by corporate carriers (e.g., CO2 directly generated and reported by China Ocean Shipping or by Maersk as part of their primary operations). This data source is based on the tonnage and reported emissions by carriers. We explain later in this section specifically how we calculate firm‐level emissions based on carrier‐level data.
One of the important measures in our analysis is the distance between ports. PIERS BoL data record only the last departure port of a vessel arriving at U.S. ports, prior to ocean crossing, while it records all the ports to which a vessel travels in the maritime territory of the United States. The latter is critical to assessing one of our measures of operational efficiency, route redundancy. However, because the biggest portion of the total travel distance of a vessel voyage is the transoceanic portion of the route, it was also necessary to account for that distance in our analysis of environmental implications. To prepare these data, we first extracted all 117 pairs of origin ports and first arrival U.S. ports. We then looked up the distance between the two ports in a pair from searoutes.com, which provides the distance between two seaports in nautical miles. Moreover, we are also cognizant that some port authorities around the world are interested in sustainable operations, which may have an influence on the environmental footprint of vessels that visit these ports in their voyage. The environmental ship index (ESI) is an initiative established and introduced by the International Association of Ports and Harbors, which is designed to incentivize vessel operators to meet the IMO emissions standards. We collected the list of ports participating in this voluntary program to account for its potential impact on the emissions of vessels visiting these ports.
Lastly, physical and operational characteristics of vessels have direct implications on emissions attributable to maritime operations. To collect this information, we first extracted 378 unique vessel names from the PIERS BoL data. We then collected additional vessel characteristics from two sources. Capacity information was collected through the use of containership‐info.com 4 and validated through inspection with BoL data from PIERS, confirming maximum TEU capacity levels. Such information was critical to computing vessel utilization, another measure of operations efficiency. Year built, average travel speed, and weight collected through fleetmon.com. The year built may impact the environmental performance of the vessel due to changes in engine technology, fuel efficiency, and natural aging of mechanical parts over years. The average travel speed also has direct implications on the environmental performance of the vessel, as fuel efficiency depends on the speed. The deadweight of a vessel affects the total TEUs a vessel can ship at once and thus has implications for per‐TEU emissions.
We curated these data sources to construct a sample of firm‐year level observations for the empirical investigation of our hypotheses. Our primary analysis focuses on the firm‐level specifically because our interest is in illuminating the impact that carrier decisions have on such firms, rather than their own operations. Our aim is, essentially, to draw individual receiving firms into the conversation regarding carrier planning. This level of analysis also permits some level of corresponding consideration of firm‐reported Scope 3 emission performance (CDP data), which does not exist, for example, at the vessel level. To this end, as we will describe in the following sections, BoL and other data are aggregated for each receiving firm in a given year, across multiple voyages through which it received goods, using TEUs per vessel, voyage, and carrier as the weighing scheme (as will be described in detail in Section 3.2). Our final sample contains 20,937 firm‐year observations spanning the time frame of 2013 to 2015.
Main variables
Primary dependent variables
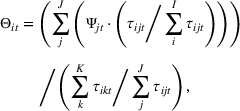
In our consideration of emissions attributable to receiving firms, we derived two primary outcome variables. The first outcome variable used in the analysis is the ln(total allocated emissions) measure. This measure is derived based on Scope 1 emission data compiled from corporate sustainability reports of key carriers, which describe emissions associated with the maritime transport of goods by these carriers.
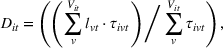
Total annual emissions by carrier are allocated to individual firms, based on the percentage of tonnage (TEUs) handled by each carrier that is bound for each firm. Since not all carriers disclose unambiguous annual emission data, we only include firms in our analysis for which at least 60% of TEUs could be tied to carrier‐reported data over the periods examined. While this contributed to some loss in data, it was important in reducing the risk of misrepresentation in extrapolation. With this exclusion rule in place, 83.8% of all tonnage transported in our dataset could be associated with available reports. In order to fill in the remaining gaps, firm‐level estimates are rescaled accordingly (e.g., a firm with only 80% of its transported goods using carriers that provide annual data will have its estimated maritime Scope 3 level scaled by a factor of 1.25). Formally, we compute the total allocated emissions (


The second outcome variable that we consider is the rate of maritime emissions, computed as a log ratio of maritime emissions to the total TEUs of the receiving firm per year. This per‐TEU measure is intended to capture the intensity of maritime emissions from the receiving firm's perspective:

Primary independent variable
The PIERS BoL dataset contains information on the number of carriers involved in each voyage over the period of examination. We define vessel sharing as the average number of carriers responsible for managing all voyages across all goods transported for a company in a given year. For a given firm‐year, we calculate typical vessel‐sharing conditions (vessel sharing scores) using weighted averages based on total TEUs. We also consider similar unweighted average calculations for robustness. In the models presented here, we use weighted vessel sharing averages, but our results also hold for unweighted averages. While our measure of vessel sharing and vessel utilization still requires the consideration of NVOCC (non‐vessel‐operating common carrier) associated freight, tonnage associated with parties other than major carriers is a fairly insubstantial portion of the total. Specifically, 90% of tonnage carried is accounted for by 16 carriers alone, with the remaining almost entirely associated with 14 other carriers.
Mediator variables
In quantifying operational efficiency (H2), we focus on two measures in particular. Our first main operational efficiency measure involves the consideration of route redundancy among U.S. ports, per voyage (per Figure 1). As an example, suppose that a vessel is delivering goods to the ports of Seattle, Oakland, Long Beach. A strictly northbound route would begin in Long Beach, proceed to Oakland, then end at the port of Seattle, while one alternative route would begin in Oakland, proceed to Long Beach, then end at Seattle. We distinguish this second route sequence as “redundant” because the distance between Long Beach and Oakland is traversed twice. Our calculation of route redundancy is conceived as the effective ratio of the estimated excess travel distance to the shortest theoretical distance possible. We can compute this for each vessel‐voyage and average it across all BoLs by firm‐year (or, alternately, by TEU).
Route redundancy (


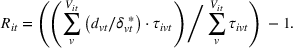
Here,


Associated is our second measure of operational efficiency, days in transit (


It is worth noting that the number of ports involved in a voyage has an intuitive relationship with route redundancy, as well as, potentially, days in transit. That is, for a set of destination ports arranged sequentially along a coastline (e.g., north to south), it can be shown that the average number of overlaps in routing derived through pure chance is a linear function of the total number of ports involved (see Supporting Information Appendix B). Therefore, if routes for unloading vessels were determined entirely at random, the number of ports involved could be a sufficient predictor of route redundancy. However, if the increase in options provided by vessel sharing is likely to not only reduce the total number of ports in a voyage but also reduce the likelihood of overlap, this impact should be observable even in the presence of controls for the number of ports involved.
Through interviews with representatives of the shipping industry, it is evident that carriers broadly view route redundancy as an inefficiency that planners tend to avoid when designing voyages. However, it is important to note that planners may opt for overlapping (back‐and‐forth) routes for a number of reasons. Among them are interested in reducing port time by unloading cargo in a first‐in‐last‐out sequence, the avoidance of port congestion, and efforts to select departure ports based on total tonnage off‐loaded to minimize ship draught and subsequent fuel cost. Thus, a reduction in ocean route redundancy ultimately may lead to more time in port, during which costly vessel powering may take place (Bakshi et al., 2011; Vaishnav et al., 2016). These changes in total emissions may lead to higher levels of emissions attributed to receiving firms. However, these associated impacts would have to be consistent and sizeable in order to dominate prospective benefits from other efficiencies gained from vessel sharing.
Our second operational efficiency lens is that of vessel utilization. On an annual basis, all other things held constant, higher vessel utilizations permit reductions in the total number of vessels required for transit per TEU (Karvonen & Harju, 2020), with associated reductions in emissions attributed to TEUs and their recipients. Incremental fuel consumption due to additional weight is limited in its ability to counter this holistic benefit. Specifically, while heavier vessels displace more water, less utilized vessels of equal size will tend to take on additional weight through ballast (raising separate environmental concerns). Further, with weight greater above the hull (and less ballast lower in the vessel), vessel stability may require somewhat less fuel‐consumptive slower running for highly utilized vessels of the same size, all other things being constant (Aro et al., 2020; Faber et al., 2012; Notteboom & Carriou, 2009).
Regardless of potential financial and environmental benefits, the development of an ideal stowage plan for the various contents that a vessel can carry, within an intended time frame, and with the intention of maximizing cost‐effectiveness, is no trivial task. In the logistics and operations literature on computational optimization, this is often referred to as the master bay planning problem (MBPP) (Ambrosino et al., 2004), with challenges including but not limited to scheduling, dynamic weight distribution, visibility, and clearance (Avriel, 1998; Avriel et al., 2000). To develop plans in practice, heuristics are commonly used by planners and planning systems, although multiagent approaches have also been proposed for MBPP contexts (J. Lee & Kim, 2008; Parthibaraj et al., 2017), demonstrating how shared involvement, combined information, and expanded options can advance cost‐effective solutions to stowage. The inclusion of increased options available by multiple interested agents (i.e., increased variety in the need for port use, timing, groupings of cargo, etc.) entails constraint relaxation, which increases proximity to theoretical lower bounds in cost and upper bounds in utilization (Cruz‐Reyes et al., 2015). These findings, thus, justify the consideration of utilization as an additional operational efficiency gained through coordinated vessel sharing.
In our study, for a given vessel, utilization is defined as the ratio of total TEUs, after disembarking from the last departure port (i.e., peak load), divided by vessel capacity. In our analysis, the firm‐year level values of vessel utilization are calculated as average peak utilizations across all voyages a receiving firm leverages in a given year, weighted by the fraction of a firm's total annual TEUs carried by each voyage. This weighting mimics that used in our calculation of total allocated emissions and route redundancy (Equations 1 and 2).
Control variables
We leverage sets of control variables to account for other factors that may have influence on maritime emissions attributed to receiving firms. Specifically, we consider the number of departure ports and the number of arrival ports and include them in our analysis, as they potentially capture the diversity of goods a vessel carries per voyage. We also control for the transoceanic distance between the last origin port and the first destination port in a voyage because this distance accounts for the largest portion of the voyage which will be directly related to the environmental footprint of vessel operations.
Using vessel‐specific data, we control for the built year, the average speed, and the deadweight of the vessels as these factors may influence the environmental impact of vessel operations. As with all other calculations, we aggregate these vessel characteristics at the receiving firm‐year level using total TEUs as the weight, in a similar fashion to factors described in Section 3.2. We also control for the total TEUs the firm received in a given year when the dependent variable is ln(total allocated emissions) because the more a firm receives, the greater the environmental footprint vessel operations leave. When the dependent variable is the rate of emissions, we exclude this control because it is part of the dependent variable.
In addition to these control variables, we include several sets of variables emblematic of fixed effects to control for idiosyncratic heterogeneities across the reliance on specific departure ports and arrival ports, as well as ports in either group participating in ESI incentive programs. Since we cannot control for such heterogeneities via direct fixed effects, as a receiving firm may receive shipments from multiple vessels originating from different departure ports in a given year, fractional indicators demonstrating tendencies of involvement with such ports are derived at the firm‐year level. Much as in our other weighted calculations, if a firm received only three TEUs of goods in a given year, with two TEUs from departure port A and one TEU from departure port B, we would characterize this reliance in two departure port tendency variables, where A = 0.667 and B = 0.333.
Summary statistics
Table 1 shows the summary statistics of our final sample. The first two rows describe our dependent variables, and the subsequent two capture operational efficiency measured as route redundancy and vessel utilization. On average, 17% of the domestic travel route is redundant requiring a change in direction. Some receiving firms do not have any redundant paths at all, shown by the minimum of 0. The maximum is at 297% of route redundancy, meaning that a vessel covered three times more than the minimum route in its movement back and forth between ports. Vessels are utilized at around 94% of maximum capacity, ranging from 80% to 99%.
Summary statistics (N = 20,937)
Note: The original data contained a number of BoL entries that showed zero or close to zero TEUs. To avoid the risk of rounding errors impacting our results, we only include firm‐years for which TEU totals are greater than 10.
Abbreviations: BoL, bills of lading; TEU, twenty‐foot unit.
Our primary independent variable, vessel sharing, also demonstrates considerable variation. The practice of vessel sharing is broadly prevalent at an average of 4.76 carriers per vessel to the receiving firm. At the minimum, firms receive shipments from vessels occupied by only one carrier. The maximal sharing in our dataset involved 18 carriers. Based on the summary statistics of the control variables, vessels depart from 7.75 different global ports and visit 2.59 U.S. ports. On average, the transoceanic distance vessels travel is 5570 km. The average build year for vessels is 2007 and the average speed was 13.20 knots. The average vessel weight was 94,000 tons. On average, the firm received a total shipment of 28.79 TEUs in a given year.
Table 2 shows the correlation matrix among these key variables. with low‐to‐moderate correlations between operational efficiency measures (route redundancy and vessel utilization) and control variables in many cases, confirming the importance of including these control variables in our regression analyses.
Correlations between main variables
Note: All correlations are significant at 1% except for those in italics.
Abbreviation: TEU, twenty‐foot unit.
In particular, route redundancy and arrival ports are positively correlated (r = 0.63), indicating, as intuited, that route redundancy is more likely to occur with a higher number of arrival ports (Supporting Information Appendix B). Total allocated emissions are positively correlated with arrival ports and total TEUs and negatively correlated with vessel utilization and vessel sharing. While this observation comes from the raw pairwise correlations, it suggests that the more ports a vessel visits and the more goods a vessel ships, the higher the maritime emissions attributable to the receiving firms. It also suggests that the more utilized and shared a vessel is, the lower the maritime emissions attributable to the receiving firms.
Model estimation
To test our hypotheses, we use the causal mediation model in Hicks and Tingley (2011) and estimate the following three equations simultaneously, where the estimation procedure is an application of the seemingly unrelated regression (SUR) model (Hicks &and Tingley, 2011, p. 610).


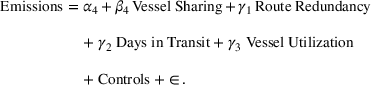
Our model for the rate of emissions contains the same independent variables used in the emissions model estimation. To estimate the system of equations, we use the SUR approach. The SUR approach accounts for covariance among the estimates across different equations, which is required for estimating coefficients in the system of equations. We perform inferences based on the normal distribution, but our inferences are robust when we compute the bootstrapped standard errors without relying on a particular distributional assumption. In this estimation, the direct effect of vessel sharing on emissions is captured by 


ANALYSIS AND RESULTS
We begin by examining H1, the relationship between vessel sharing and carbon emissions. Table 3 shows the results from estimating the models referred to in Equations (4)–(7). Note that these equations are estimated together using the SUR estimation. Models [1] and [5] confirm our first hypothesis. Model [1] shows that the direct effect of vessel sharing on ln(total allocated emissions) is negative and significant (


Main effects of vessel sharing on operations transport efficiencies
Note: Standard errors are in parentheses. Year Vessel Built was centered around 2000 in regression.
Abbreviations: DAYS, days in transit; EMI, (log) total allocated emissions; ESI, Environmental ship index; per‐TEU EMI, (log) Allocated emissions per TEU; RED, route redundancy (%); TEU, twenty‐foot unit; UTIL, vessel utilization (%).
+p < 0.1, *p < 0.05, **p < 0.01.
In Table 3, we also highlight in bold the specific effect estimates used in assessing H2 and H3, with the additional notation “a,” “b,” and “c” referencing the alternative operational efficiency measures (route redundancy (RED), utilization (UTIL), and days in transit (DAYS)). That is, H2a is the examination of H2 with respect to route redundancy. H2b and H2c refer to examinations regarding measures of utilization and days, respectively. Models [2]–[4], specifically, focus on the role of vessel sharing and other controls in impacting these potential mediators (of vessel sharing impacts on environmental outcomes). Models [6]–[8] are identical to models [2]–[4] but without controlling for the natural log of TEU. We omit this term since, in model [4], we use allocated emissions per TEU (RATE) as our dependent variable. This is to test whether the results are consistent if we normalize the emissions per TEU.
Models [2] and [6] confirm that vessel sharing is negatively associated with route redundancy (


We examine the impact of efficiency on emissions by returning to models [1] and [5] to test H3. Route redundancy's impact is found to be nonsignificant at the 5% level in both Models [4] (


Figure 3 summarizes our main results.
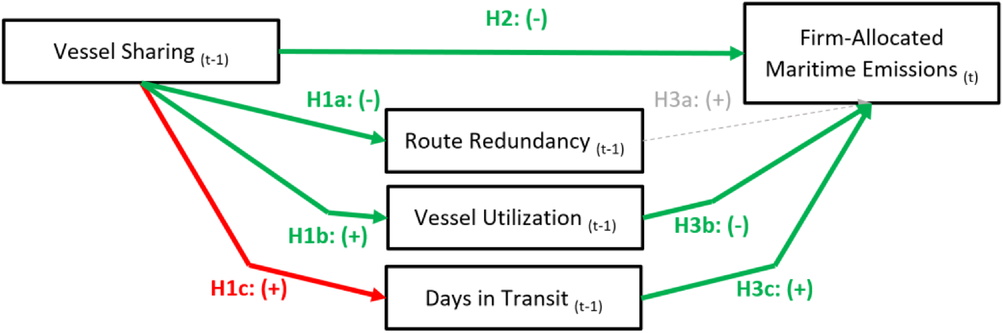
Hypotheses and mediation pathways (green = support)
Most control variables are strongly significant in their explanatory power for route redundancy (Models [2] and [1]) and vessel utilization (Models [3] and [6]) except for the number of arrival ports and ln(total TEUs) in the case of vessel utilization modeling.
Table 4 shows the total effect, direct effect, and indirect (mediated) effects from vessel sharing to emissions by combining estimated coefficients from Table 3. The total effect is significant and negative at the 1% level for total emissions (


Total, direct, and indirect effect estimates
Abbreviations: DAYS, days in transit; EMI, "(log) total allocated emissions; Per‐TEU EMI, (log) total allocated emissions per twenty‐foot unit; RED, route redundancy (in %); UTIL, vessel utilization (in %); VS, vessel sharing.
+p < 0.1, *p < 0.05, **p < 0.01.
To summarize our main findings, we find a significant negative effect of vessel sharing on emissions. A one‐unit increase in vessel sharing is associated with 5% lower emissions. We also find a strongly significant mediation pathway from vessel sharing to allocated emissions from carriers’ emissions, which accounts for 8% of the total effect of vessel sharing on emissions. In sum, we find support for H1, and partial support for H2 and H3, along the vessel utilization path.
ROBUSTNESS OF MAIN FINDINGS
Distinctions in the role of vessel sharing on the operational outcomes highlight the potential for trade‐offs as opportunities in sharing are taken advantage of. These distinctions beg the question of whether additional nuances in the role of vessel sharing might be observed with the data available. In this section, we consider additional examinations that may shed further light on the manner in which increases in vessel sharing relate to outcomes. We also consider the extent to which our general results are robust to alternate data and model forms.
Variable returns to sharing
Given that vessel sharing coordination may give rise to operational trade‐offs in vessel utilization and days in transit, it is also plausible to anticipate the potential negative role of complicatedness to grow as sharing increases. That is, while we see an overall benefit to increased sharing on emission reduction, it is not immediately clear that the rate of growth in those benefits is constant as vessel sharing increases. To examine whether a particularly high or low level of vessel sharing is a chief contributor to the empirically identified emission reduction effects (e.g., if nonlinear impacts exist), we convert the vessel sharing variable into five quintile‐based indicator variables. We include all five indicator variables except for the third quintile. Thus, the middle or third quintile serves as the reference category for our interpretation of the coefficients of other indicator variables.
Models [1] and [5] in Table 5 indicate that the direct effect of vessel sharing on emissions is curvilinear because only the fourth and fifth quintiles have a significant and negative coefficient but the magnitude of the impact is very different. The fifth quintile of vessel sharing (i.e., top 20% vessel sharing level) has 28.4% less total emissions and 25.7% less per‐TEU emission rates compared to the third quintile (i.e., middle 20% vessel sharing level). This finding suggests that the direct effect of vessel sharing on emissions is strongly driven by particularly high levels of vessel sharing. In other words, after accounting for the mediating pathways, only high levels of vessel sharing benefit emissions directly.
Nonlinear effects of vessel sharing on efficiencies and environmental performance
Note: Standard errors are in parentheses. Year Vessel Built was centered around 2000 in regression.
Abbreviations: DAYS, days in transit; EMI, (log) total allocated emissions; per‐TEU EMI, (log) allocated emissions per TEU; RED, route redundancy (%); UTIL, vessel utilization (%); VS, vessel sharing.
+p < 0.1, *p < 0.05, **p < 0.01.
Robustness of model results
In Table 5, Models [2] and [3] and [6] and [7] show that vessel sharing holds a generally monotonic relationship with route redundancy and vessel utilization. Models [4] and [8] show that the association of vessel sharing and length of days is not monotonic, but that lower quintiles of vessel sharing have, on average, shorter days of travel. The coefficients of the included indicator variables show that high vessel sharing improves operational efficiencies by reducing route redundancy and increasing vessel utilization across the range of the vessel sharing variable.
Several additional robustness examinations were also conducted to assess the sensitivity of our results to data and model structure. Specifically, our main SUR estimation relies on the normal distribution in computing standard errors for making inferences on the estimated coefficients. To relax this assumption, we compute distribution‐free bootstrapped standard errors for our coefficients with 10,000 replications. For brevity, in Table 6, column [1] corresponds to Models [1]–[4] in Table 3 and column [2] corresponds to Models [5]–[8] in Table 3. The level of statistical significance for all coefficients remains unchanged.
Robustness of Main Findings
Note: Standard errors are in parentheses.
Abbreviations: DAYS, days in transit; EMI, (log) total allocated emissions; Per‐TEU EMI, (log) total allocated emissions per twenty‐foot unit; RED, route redundancy (in %); UTIL, vessel utilization (in %); VS, vessel sharing.
+p < 0.1, *p < 0.05, **p < 0.01.
Second, when we aggregated BoLs to the receiving‐firm‐year level to compute the variables for our main analysis, we used TEUs as weights for the aggregation (see Section 3.2). To show that the specific TEU‐based weighting process does not bias our findings, we recomputed all variables with equal weights instead of TEU‐based weights and reran the same analysis as in the main analysis. Column [3] corresponds to Models [1]–[4] in Table 3 and column [4] corresponds to Models [5]–[8] in Table 3. The magnitude of some coefficients changes, but the direction and statistical significance levels remain unchanged.
Additional robustness analysis reconsiders the cutoff made in excluding firms from analysis for which insufficient carrier‐provided emission data was absent. To examine whether a stricter cutoff could impact our results, we returned our original model, excluding any firm with less than 70% of their tonnage associated with unambiguous carrier emission reports. The sign and significance of our vessel sharing and operational mediator variables remain unaffected in our main models ([1]–[8] in Table 3). We also find that while our models lose considerable power, aggregation, and analysis at the vessel level provide similar estimates of effect direction (i.e., vessels that are more highly shared are associated with lower emissions).
CONCLUSIONS, LIMITATIONS, AND FUTURE DIRECTIONS
In this paper, we shed light on the impact of carrier vessel sharing on the maritime emissions performance of receiving firms. We leverage the literature on sustainable operations and arguments regarding cost reduction motivation, coordination options, and complicatedness in coordinating with other carriers, to consider empirically how the extent of that sharing translates into operational efficiencies and emission levels. In this vein, our discussion and primary findings help to highlight the importance of capacity‐sharing opportunities, decisions, and outcomes that span carriers and receiving firms. Our analysis further highlights the complicated nature of operational outcomes linked to vessel sharing with regard to their ties to environmental performance, and notably indicates the potential for operational trade‐offs when joint opportunities are pursued among carriers.
We utilize BoL data, maritime emissions data from vessel carriers’ annual reports attributable to receiving firms, and data specific to vessels and ports in our empirical investigation. Our examination shows that the number of carriers sharing a vessel can not only reduce the degree of route redundancy (overlaps in coastal transit within a voyage) but also increase vessel utilization. In contrast, we see the number of days in transit increase with sharing. On the whole, however, we observe net benefits to emission reduction with increased vessel sharing. Specifically, we see that a one‐unit increase in the average number of carriers sharing vessels is associated with a 5% decrease in emissions to the receiving firms. This is a sizeable impact, especially when one considers the range of vessel sharing levels observed (from 1 to 18 carriers per vessel in our dataset). In short, the managerial implication is that receiving firms, conscious of environmental performance, could benefit substantially from additional maritime shipping experiences involving greater levels of vessel sharing.
To further appreciate this impact in relative terms for individual firms, it is valuable to consider how attributed emission levels in our analysis compared to their overall Scope 3 levels (including such things as trucking). In a post hoc analysis, we find that the median ratio of maritime to total CDP Scope 3, for those firms providing such CDP reports, is 4% across all firm‐years. The upper quartile of firm‐years analyzed shows ratios of 25% or higher. The immediate suggestion is twofold. First, the use of CDP Scope 3 data simply is not granular enough for the analysis of direct maritime impacts. Second, maritime contributions to Scope 3 are rather significant for many firms (36% of the firm‐years have maritime contributions of 10% or higher). Using additional merged CSRP‐Compustat data, we observed differences by the industry as well. While firms focused on discretionary consumer goods have the same median as the overall set (4%), firms in the information technology industry sector (e.g., technology hardware and equipment, semiconductors) see particularly high levels of maritime contributions. The median ratio for that subset of firms is approximately 9% rather than 4% (40% of these firms have a quarter or more of their reported CDP emissions accounted for maritime emissions). Firms operating in materials industries (chemicals, metals, etc.) see a somewhat lower median level of maritime contributions (2%). The implication is that firms in technology sectors, in particular, have the most to gain through applying pressure on carriers to increase vessel sharing activity.
Our investigation is not without limitations. First, while supporting our first set of hypotheses, and a partial mediation of vessel sharing by vessel utilization on the path to emission reduction (H1, H2b, H3b), we fail to find evidence for such a path through route redundancy (see Figure 3). This is not so much a limitation as much as it is a signal that a richer examination of other operational factors might be useful in future analysis. As noted, we also find sharing to increase rather than decrease the number of days in transit, with associated, albeit relatively limited, upticks in emissions. Furthermore, our post hoc analyses suggest that the remaining direct effects of increased vessel sharing, after our operational efficiency measures are included in the estimation, may involve more complicated (specifically nonlinear) benefits than anticipated. Hence, we see both trade‐offs and diminishing returns to vessel sharing for receiving firms. In addition, while our focus has been on U.S. port activity, given our primary interest in receiving firms based in the United States, consideration of non‐U.S. ports may prove useful in understanding these particularly notable benefits of very high levels of vessel sharing. We encourage future research to explore such activity to further enrich our understanding of these impacts.
Regarding our managerial implications, one potential question is whether receiving firms have the opportunity to influence carrier vessel sharing. Clearly, the management of vessels and engagement in vessel sharing is not equal across all carriers, with vessel owners and alliances in particularly influential positions. Yet, given the differences in emission performance associated with the extent to which vessels are shared, some large receiving firms may in fact be well‐positioned to advocate for or against certain carrier choices (Chanamé, 2018). Such firms may determine carrier selection either directly (e.g., by way of inbound collect shipping), or indirectly by folding carrier reliance into supplier selection decisions. These same firms, by virtue of their size and market footprint, are also often in the spotlight with regard to environmental outcomes. Hence, they may possess both the motivation and means to move the needle on carrier engagement in sharing, with potential benefits derived by smaller receiving firms as well.
Finally, while we draw on multiple sources of data in our examinations, missing data over the timeframe examined poses a substantial challenge in this work. While data exclusion and interpolation tactics were applied in efforts to leverage the data available, these tactics are imperfect substitutes for a more complete dataset. Further of concern, our emission calculations rely on data reporting by carriers. Carriers are of course often in the best position to observe emissions, reducing the issue of Scope 3 overaggregation in data available from other sources (CDP data, e.g., do not distinguish between maritime and nonmaritime Scope 3). Nonetheless, there may be biases and flaws in these data that we cannot account for. While we have no reason to believe that any one carrier is likely to misrepresent emissions in a manner markedly different from other sources (e.g., greatly underreporting), however, we are also not in the position to definitively say otherwise.
In short, it is clear that the process of allocating emissions accurately to individual firms remains a challenging task given issues that we simply do not have visibility into (e.g., emission reports for smaller carriers, variability in ship speed across the length of each voyage, etc.). As a result, our findings must be viewed as limited in generalizability. Further, and perhaps critically, it is unclear whether pivotal events such as recent supply chain impacts of the COVID epidemic have fundamentally changed the focus of operational objectives in maritime shipping, along with associated environmental benefits that we have observed to be linked to vessel sharing. What is needed, moving forward, is a more expansive consideration of unambiguous maritime data, across the majority of ocean carriers, as these accounts develop. Such an approach should consider the potential for additional explanations for benefits and costs of vessel sharing.
Footnotes
ACKNOWLEDGMENT
This work was supported by the National Research Foundation of Korea (NRF) grant funded by the Korean government. (MSIT) (NRF‐2022R1C1C1011888)
1
2
3
4
We collected the data in July 2017, but the website had gone offline when we checked in March 2021. There are other data providers that maintain a database containing similar information about vessels.