
Abstract
Ending the HIV/AIDS epidemic is an important target of the United Nations Sustainable Development Goals (SDGs). To achieve it, countries worldwide donate large amounts of development aid (USD 15.18 billion annually). However, current practice in allocating development aid is largely based on decision heuristics and thus subject to inefficiencies. To address this problem, we aim to support managers of funding bodies in identifying cost‐effective allocations of development aid and thus develop a new decision model. We combine data analytics with mathematical optimization, whereby the former estimates the country‐specific effectiveness of aid, and the latter suggests an allocation under budget constraints. We evaluate our decision model using aid data obtained from the SDG Financing Lab of the OECD, demonstrating that our decision model could reduce the infection rate over current practice. Our work directly benefits managers of funding bodies tasked with financing development activities and helps them achieve cost‐effective progress toward ending the HIV/AIDS epidemic.
INTRODUCTION
The United Nations Sustainable Development Goals (SDGs) have been put forward as a set of global objectives aimed at achieving “a better and more sustainable future for all” (United Nations, 2015). The SDGs comprise 17 goals to be met by the year 2030 concerning better health, well‐being, and the elimination of poverty. However, more effort is needed in order to reach the SDGs by 2030 (Espey, 2019; Friedman et al., 2020; Nature, 2020).
An important target in the SDG framework is to end the HIV epidemic. Infections with HIV (human immunodeficiency virus) can result in AIDS (acquired immune deficiency syndrome), a leading cause of death worldwide (World Health Organization, 2018b). To date, more than 75 million people have been infected, and more than 32 million people have died of HIV (World Health Organization, 2018a). HIV is further the fourth likeliest cause of death in low‐income countries (World Health Organization, 2018b). In 2017, HIV led to 88,000 deaths in South Africa, 69,000 in India, and 44,000 in Mozambique (UNAIDS, 2019). As a result, development organizations (e.g., the Joint United Nations Program on HIV and AIDS [UNAIDS] and the Global Fund) have called for greater efforts to end the epidemic (The Lancet HIV, 2021).
Progress depends largely on development aid (United Nations, 2018b). Development aid refers to financial assistance from private (e.g., Bill & Melinda Gates Foundation) and public (e.g., UNAIDS, the Global Fund) organizations, which is used to support development activities in recipient countries. Currently, official development aid earmarked for ending the HIV epidemic amounts to USD 15.18 billion annually, representing one of the largest aid activities worldwide (OECD, 2018b). Hence, managers of funding bodies are tasked with finding a cost‐effective way of distributing development aid across countries in need (cf. de Vries & Van Wassenhove, 2020; Toetzke et al., 2022). However, current practice in aid allocation is largely based on human judgment and heuristics (OECD, 2009, 2020b), where, as a result, aid disbursements are often not aligned with the actual needs of countries and thus inefficient (Global Burden of Disease Health Financing Collaborator Network, 2020).
Operations management (OM) has a long tradition of studying decision‐making in a humanitarian context (Besiou & Van Wassenhove, 2020; Starr & Van Wassenhove, 2014). The literature has contributed, for instance, to the design of supply chains (e.g., Behl & Dutta, 2019; Berenguer et al., 2016; Jahre et al., 2016; Natarajan & Swaminathan, 2014), drug stockouts risks (Gallien et al., 2017), and the coordination of humanitarian operations (e.g., Ergun et al., 2014). Other works have examined fundraising effectiveness (Turrini et al., 2020), the effect of transparency on donation behavior (Mejia et al., 2019), and budgeting in humanitarian organizations (Keshvari Fard et al., 2021). In contrast, this paper studies the allocation of financial aid toward ending the HIV epidemic.
We aim at finding a cost‐effective, cross‐country allocation of development aid to end the HIV epidemic. For this, we develop a two‐stage decision model. In the first stage, we use data analytics to model the between‐country heterogeneity of aid effectiveness. Specifically, we estimate the conditional expectation of how the rate of new HIV infections will change depending on a given aid volume while accounting for between‐country heterogeneity. In the second stage, we solve a mathematical optimization problem of identifying a cost‐effective allocation under budget constraints. Our decision model follows a data‐driven approach that leverages historical information on HIV infection rates, development aid, and socioeconomic predictors to account for variations in aid effectiveness across countries.
Our evaluation is based on unique data from the SDG Financing Lab of the Organization for Economic Co‐operation and Development (OECD). We feed our model with large‐scale data on HIV infection rates and global development aid. Through a series of computational experiments, we obtain the following findings. While maintaining existing budgets for development aid earmarked for ending HIV, our decision model suggests an allocation that can reduce the expected rate of new HIV cases per 1000 uninfected individuals per country and year over the current practice by 2.72 %. We observe that this suggested reduction is particularly pronounced for, for example, South America, Latin America and the Caribbean, and Northern Africa. We further use our decision model to analyze the cost‐effectiveness and the role of other determinants (e.g., economic strength).
Our work has direct implications for OM. First, our paper relates to research on humanitarian operations (Besiou & Van Wassenhove, 2020; de Vries & Van Wassenhove, 2020; Gallien et al., 2017; Van Wassenhove, 2019; Zobel et al., 2016). Previously, the focus has been primarily placed on fund acquisition (Turrini et al., 2020), whereas we are concerned with cost‐effective disbursements. Second, we contribute to OM research on data analytics (Mišić & Perakis, 2020) and, specifically, predictive modeling in a humanitarian context (Altay & Narayanan, 2021). We add an impactful case to the literature in which we study the operational value of predictive modeling. Third, we address an important practical need of managers from funding bodies in their task of distributing aid to countries in need (OECD, 2020b; Toetzke et al., 2022). Currently, decision‐making is largely based on decision heuristics (OECD, 2009, 2020b), whereas we provide data‐driven decision support with the aim of ending the HIV epidemic and thus achieving the SDGs.
The rest of this paper is structured as follows. Section 2 reviews the current practice of development aid allocation. To arrive at a cost‐effective allocation, we introduce a data‐driven decision model in Section 3 and describe our empirical setting based on the HIV epidemic in Section 4. We then present empirical findings in Section 5. In Section 6, we discuss implications for management.
BACKGROUND
This work is related to three streams of research, which we review in the following: (1) OM for humanitarian purposes, (2) the characteristics of development aid, and (3) aligning aid with countries in need.
Humanitarian OM
OM as a field has a long tradition of conducting research on humanitarian operations (Besiou & Van Wassenhove, 2020; Van Wassenhove, 2019; Zobel et al., 2016). To support management decision‐makers, both the demand and supply sides must be considered to answer how much supplies or aid are needed and how they should be allocated. However, several challenges arise due to the complexity of humanitarian crises, scarcity of resources, large caseloads, and limited funds. This has spurred discussions (de Vries & Van Wassenhove, 2020), suggesting that humanitarian OM should focus increasingly on cost‐effectiveness.
Prior literature has made multiple contributions to more effective decision‐making in humanitarian operations (Altay & Green, 2006). Examples include decision models for logistics (e.g., Gralla et al., 2016; Wex et al., 2014), supply chains (e.g., Behl & Dutta, 2019; Ergun et al., 2014; Jahre et al., 2016; Natarajan & Swaminathan, 2014), resource allocation (e.g., Keshvari Fard et al., 2019; Long et al., 2018), capacity planning (e.g., Acimovic & Goentzel, 2016; Holguín‐Veras et al., 2013; Morrice et al., 2016), and staffing (e.g., Urrea et al., 2019). Berenguer et al. (2016) examined managerial efficiency in global health supply chains with a focus on decision models for supporting operations during epidemics. For HIV/AIDS, operational problems are related to the allocation of diagnostic devices (Deo & Sohoni, 2015). Another work developed policies for allocating HIV treatments and then studied the associated opportunity costs (Khademi et al., 2015). However, the previous works focused on the allocation of goods and not on development financing.
In terms of development financing, empirical works have extensively examined fund acquisition. For example, Turrini et al. (2020) analyzed determinants behind donation behavior. The authors argued for increasing the effectiveness of fundraising activities. Aflaki and Pedraza‐Martinez (2016) studied the trade‐off between operational effectiveness and funding strategies, finding that increased public awareness after disasters helps humanitarian organizations get more nonearmarked funding. Research has further identified transparency as an important determinant of donation behavior (Mejia et al., 2019). Similarly, Gallien et al. (2017) evaluated operational approaches for performance‐based funding in relation to national drug stockout risks. Keshvari Fard et al. (2021) studied optimal budgeting in international humanitarian organizations. Furthermore, Chakravarty (2021) studied the decisions of parties involved in funding humanitarian disaster responses using a game‐theoretical approach. Our work is related to the above studies, but we focus on an important yet previously overlooked decision task, namely the cost‐effective allocation of development aid across countries with the objective of reducing new HIV infections.
To allocate aid, we later make use of predictive modeling. The literature on predictive modeling in humanitarian operations is increasing (Altay & Narayanan, 2021). For example, in the context of epidemics, de Vries et al. (2016) proposed a predictive model for forecasting disease spread. However, a recent survey conducted by Altay and Narayanan (2021) shows that predictive modeling is mostly used in the context of natural disasters. We instead adapt predictive modeling for development financing.
Disbursement of development aid
Development aid, also known as official development assistance, refers to financial support that is given to recipient countries to promote advances in areas such as economic growth, sustainability, education, and health (OECD, 2020a). Recipients are typically countries with low development status (e.g., Zimbabwe, Kenya, and South Africa) and thus lack the financial means to fund development activities such as ending the HIV epidemic. Formally, development aid is defined as the flows of official financing administered with the promotion of the economic development and welfare of developing countries as the main objective, and which are concessional in character with a grant element of at least 25 percent (using a fixed 10 percent rate of discount) (OECD 2003).
Development aid is provided via different financial instruments: grants and loans. Grants provide support through monetary assistance (or, sometimes, also through physical supplies and training) but with no obligation of repayment. Loans, on the other hand, are temporarily lent (often interest‐free) for specific activities (United Nations, 2020a). Different from humanitarian aid, which focuses on short‐term responses, development aid is concerned with long‐term goals (OECD, 2020a).
Development aid is provided by a vast number of donors comprising both public (e.g., UNAIDS, UNICEF, the Global Fund, and the United Nations Development Programme) and private bodies (e.g., Bill & Melinda Gates Foundation). As such, one distinguishes between bilateral activities, whereby aid is given by one country to a recipient, and multilateral activities, whereby aid is given by a donor country to an international organization that distributes it among countries in need. To support managers from donors and other public bodies, the Development Assistance Committee of the OECD maintains a monitoring database of all global development activities (the Creditor Reporting Standard [CRS]).
Aligning global aid disbursements with the SDGs
The SDGs, adopted in 2015, set new objectives for nations and decision‐makers aimed at bringing about a better future for all (United Nations, 2015). Each goal has a subset of targets. For example, ending the HIV epidemic is a specific target within Goal 3 (“Good health and well‐being”) besides other targets such as, for instance, ending tuberculosis, malaria, and neglected tropical diseases as well as combating hepatitis and other communicable diseases. The SDG framework further defines specific indicators for each target through which progress can be measured. In this paper, the focus is on ending the HIV epidemic.
A particular mandate of the SDG is “leaving no one behind.” To achieve this, the SDGs explicitly request the international community to finance development activities through aid (United Nations, 2018b) and thus facilitate improvements in countries most in need (OECD, 2019). In 2017, global disbursements amounted to USD 146.6 billion (OECD, 2018a). However, the sheer amount of money and a vast number of funding bodies involved pose practical challenges in aligning global aid flows with the SDGs (OECD, 2019). Upon this realization, the OECD, as the stakeholder in development aid that monitors and assesses global aid flows to inform disbursements, sees deficits in the ways that “connect the supply and demand for financing for sustainable development in developing countries” (OECD, 2019). In line with this, Toetzke et al. (2022) propose a machine‐learning‐based approach to monitor global development aid to provide decision‐makers with evidence for financing the SDGs.
One challenge for decision‐making is that the effectiveness of development aid varies depending on the objective, the type of aid, and the recipient country (e.g., Doucouliagos & Paldam, 2009; Hansen & Tarp, 2000; Lensink & Morrissey, 2000; Minoiu & Reddy, 2010). Hence, studies usually control for variables at the country level that capture the general economic conditions, such as population size, annual gross domestic product per capita, and school enrollment (Birchler & Michaelowa, 2016). For HIV, for example, aid disbursements have had a negative effect on next‐year infection rates when controlling for income and education (Munyanyi et al., 2020). However, heterogeneity in terms of aid effectiveness besides the heterogeneity in HIV prevalence and aid flows across countries makes it challenging for managers of funding bodies to find a cost‐effective aid allocation.
Allocation of development aid among recipients is based on different dimensions, namely qualitative considerations and, to some extent, quantitative ones (Keshvari Fard et al., 2021; Neumayer, 2003). Qualitative considerations involve, for instance, the overall relationships between donors and recipients, respect for political freedom, and the extent to which country is already assisted by donor agencies (i.e., filling geographic blind spots) (Koch, 2009; Neumayer, 2003). Quantitative analyses relate aid flows and development indices (e.g., the SDGs) as proxies for needs via visualizations and summary statistics (e.g., H.‐H. Lee & Ries, 2016; Michaud, 2003).
Currently, funding bodies receive little support in managing their financing activities. Thus, allocation decisions rely on human judgment and decision heuristics (OECD, 2009, 2020b). For the HIV elimination goal, this has resulted in inefficient allocations (Global Burden of Disease Health Financing Collaborator Network, 2020). To overcome this, decision‐makers require better tools to help them align their financial flows with the SDGs (OECD, 2020b): “trillions [of development aid] exist in the global system, but how to ensure they are aligned for maximum SDG impactf” Motivated by this practical problem from the SDG Financing Lab of the OECD, we develop a decision model for allocating aid with the objective of reducing HIV infections.
MODEL DEVELOPMENT
Problem statement
Our aim is to reduce new HIV infections through development aid. Specifically, we seek to identify a cost‐effective allocation of development aid across countries, so that the expected overall rate of new HIV infections per 1000 uninfected individuals is minimized. Thereby, we address an important problem from practice. Currently, managers of funding bodies receive little guidance about how to allocate aid. Hence, in response to requests from the SDG Financing Lab (OECD, 2020b), we aim to support managers in this task by developing a data‐driven decision model.
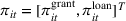
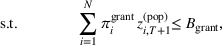
To be of practical relevance, our decision model is carefully designed for the underlying operational setting. First, the effectiveness of aid is subject to between‐country heterogeneity (Jones, 2015). For example, some countries can fund portions of their development activities by virtue of their prosperous economic conditions, whereas for others, a larger volume of foreign aid is needed to produce the same relative effect. Second, the overall available aid is limited by budget constraints (United Nations, 2020a). The budgets for aid earmarked for ending HIV are typically set ex ante, owing to long‐term contracts between donor countries and development agencies (e.g., the 2017 budget of UNAIDS was set at USD 176 million). Third, development aid is disbursed through two financial instruments, namely grants and loans. Grants provide physical or monetary support directly and without the obligation of repayment, whereas loans are lent on a temporary basis, albeit often without interest (United Nations, 2020a). Both are subject to separate budget constraints, and their effectiveness varies across countries. Here, prior studies have observed that grants are most common to the least‐developed countries that lack the financial means for repayment; loans are primarily utilized in developed countries.
Our decision model is data driven: it leverages historical data concerning HIV infections and aid disbursements earmarked for ending the HIV epidemic to estimate the effectiveness of aid at the country level. We incorporate further predictors at the country level that, for instance, account for the macroeconomic environment. Informed by prior literature (Birchler & Michaelowa, 2016; Munyanyi et al., 2020), we use the following country covariates as predictors: annual gross domestic product (GDP) per capita, population, school enrollment, and maternal mortality. This allows us to account for variation in infection dynamics and aid effectiveness across countries (H. ‐Y. Lee et al., 2016).
Decision model
Overview
Our proposed decision model follows a predict‐then‐optimize approach, organized into two stages. Stage 1 estimates the expected rate of new HIV infections conditional on a given aid allocation. Here, we also use the country covariates, which help us to account for variation in aid effectiveness across countries. This involves historical data from time periods


Our decision model follows a predict‐then‐optimize approach (e.g., Elmachtoub & Grigas, 2022) due to three benefits for practice: First, managers can evaluate the fit of the predictions in stage 1 to ensure sufficient accuracy. Second, arbitrary predictive models can be chosen, allowing for great flexibility. This allows us later to perform robustness checks using epidemiological models and machine learning. Third, one can use established procedures for hyperparameter tuning (e.g., time‐series cross‐validation).
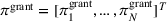
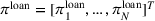
We introduce the following notation for historical data. Let


For planning the next time period


Our decision model operates in a data‐driven manner. It uses the following information from countries historical observations of HIV infection rates historical observations of aid allocations historical observation of country covariates
Overall, Figure 1 summarizes our two‐staged decision model. Both stages are detailed in the following.


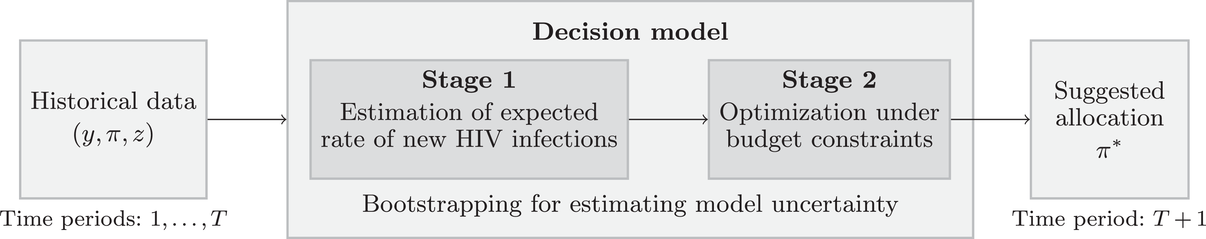
Decision model for data‐driven allocations of development aid to reduce the new rate of HIV infections
Stage 1: Estimation of the expected rate of new HIV infections
In stage 1, we estimate a predictive model that forecasts the rate of new HIV infections for some time period


Estimation using historical data (from time periods
)

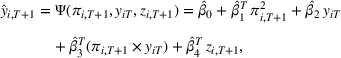
Next, we formalize

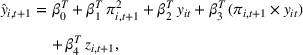


The specification in Equation 3 is informed by theory. Thus, we model the direct effect of aid on the target variable (i.e., the ) to occur in the same year, which follows evidence from Munyanyi et al. (2020). We experimented with a delayed impact by controlling for


The coefficients


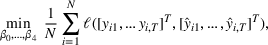

In our decision model, we estimate Equation 3 using the least absolute shrinkage and selection operator (Lasso). Lasso extends ordinary least squares by an additional L1 regularization, which may shrink some coefficients to zero (Hastie et al., 2009). This thus performs an implicit variable selection and reduces the risk of overfitting. We then yield


Prediction for time period

By solving Equation 5, we obtain the estimated parameters


Stage 2: Optimization under budget constraints
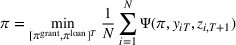
Stage 2 determines a cost‐effective allocation of development aid. That is, it optimizes the aid allocation so that the expected rate of new HIV infections is minimized. We formalize this as a mathematical optimization


For notation, we write
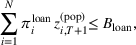


The above optimization problem is solved as follows. Owing to the convex nature of the Lasso from Stage 1, the problem involves a differentiable quadratic objective with linear constraints. Because of this, a solution can be obtained through the primal‐dual logarithmic barrier algorithm of the decision optimization (docplex) package from CPLEX.
Implementation details
Our implementation follows the common practice in predictive modeling (Hastie et al., 2009). To this end, we split the data into a training set and a holdout set. The former is given by years 2011–2016 representing historical data


From a humanitarian context, decision‐making should also consider uncertainty (de Vries & Van Wassenhove, 2020). We thus account for the operational uncertainty of our decision model and determine confidence intervals through bootstrapping (Efron, 1992). Specifically, both stages of the decision model are reestimated on two‐thirds of the data across several reruns. For each rerun, a new aid allocation and a new expected value for the rate of new HIV infections are obtained. Narrow confidence intervals should coincide with precise estimates.
Hyperparameter tuning is applied in accordance with best practices (Hastie et al., 2009). In our case, we use a time‐series cross‐validation together with a grid search. For the regularization strength


Later, our decision model is evaluated against aid allocation from current practice in two ways. (1) We used the observed rate of new HIV infections


For later time periods

EMPIRICAL SETTING
Ending the HIV epidemic
In this work, we focus on ending the HIV epidemic for three reasons. First, HIV is a prevalent cause of death. According to the World Health Organization (2018b), HIV is the fourth most frequent cause of death in least‐developed countries and is ranked among the top 10 causes worldwide. Second, HIV often affects patients in additional negative ways besides health, such as the increasing risk of poverty, hunger, and inequality (e.g., Pascoe et al., 2015). Third, ending the spread of HIV by 2030 is an objective of the SDGs, which highlights its importance to development financing institutions.
The fight against HIV is supported by an extensive amount of development aid. Currently, the annual volume of aid dedicated to reducing the spread of HIV amounts to USD 15.18 billion. This corresponds to 10.42 % of the overall annual volume of aid. These funds not only originate from a dedicated agency (i.e., UNAIDS), but they also come from other donors (e.g., the Global Fund, the World Health Organization, and the Bill & Melinda Gates Foundation).
Our evaluation is based on a longitudinal sample of

Model variables
We next introduce our model variables (see Table 1).
Model variables
Data on HIV infections were obtained from the Global SDG Indicators Database of the United Nations (United Nations, 2018a), which collects data on the annual number of new HIV cases per 1000 uninfected citizens (i.e., SDG indicator 3.3.1). The rate of new HIV infections is the target variable (
We received data on aid disbursements from the SDG Financing Lab, which allowed us to access the CRS. The CRS is maintained by the Development Assistance Committee of the OECD. It is the universal reporting system for funding agencies worldwide and is the designated database for monitoring aid activities (OECD, 2018b). The CRS classifies aid into grants and loans. Grants have no obligation of repayment and are thus widespread when supporting least‐developed countries (United Nations, 2018a), whereas the opposite is true for loans. For this study, we filtered the CRS for all aid activities related to HIV (i.e., via CRS Purpose Code 13040). Historical data on aid disbursements (


We considered the following country covariates that act as predictors (
Descriptive statistics
The rate of new HIV infections is right‐skewed (see Table 2). There are several countries, such as South Africa and other sub‐Saharan countries, which are severely affected by HIV, whereas the prevalence in other parts of the world is considerably lower. In 2017, the countries with the highest infection rates were Lesotho (9.07 per 1000), followed by Eswatini (8.02 per 1000), and Botswana (7.47 per 1000).
Summary statistics
Note: Unit of analysis: per country and year (for years 2011–2017; that is, 656 observations).
Abbreviation: SD: standard deviation
As shown in Table 2, most aid (98.95%) was provided through grants, while loans accounted for 1.05%. This can be explained by the fact that the least‐developed countries primarily received financial aid through grants and only rarely took out loans (as the least‐developed countries often lack the financial means for repayment). In 2017, the main recipient of aid earmarked for HIV was South Africa (14.83% of all HIV‐related aid in 2017), followed by Kenya (12.73%). However, South Africa ranks only eighth, and Kenya ranks ninth in terms of aid per capita due to the large population sizes of both countries. In contrast, Eswatini was the recipient with the largest annual per‐capita aid volume (USD 224.03 per citizen), followed by Namibia (USD 144.51 per citizen), and Lesotho (USD 101.11 per citizen).
RESULTS
We now identify a cost‐effective allocation of development aid with the aim of reducing the rate of new HIV infections. Specifically, we compare the observed aid allocation from current practice against the suggested aid allocation generated by our decision model. As our main finding, we first report the estimated reduction in the rate of new HIV infections, thereby presenting a path toward more effective aid allocation. We then provide additional results to better understand the allocation suggested by our decision model and offer interpretations.
Reduction of HIV infection rates
In the following, we analyze the expected reduction in HIV infections as suggested by our decision model (see Table 3). For this, we report the estimated rate of new HIV infections (in new cases per 1000), which defines the target for ending the HIV epidemic in the SDG framework. We further account for uncertainty using bootstrapping and, based on it, report 2.5% and 97.5% confidence intervals of the expected rate of new HIV infections.
HIV infection rate under different aid allocations
Note: Expected HIV infection rate (in new cases per 1000) averaged over country sample. Confidence intervals from bootstrapping based on 40 reruns.
We assess our decision model through two comparisons. First, it is compared to the observed rate of new HIV infections on the holdout set (i.e., which is available to us for evaluation purposes but not during estimation). Second, we compute the expected rate of new HIV infections given the observed aid allocation. That is, the observed aid allocation from the holdout set is entered into our decision model, and we compute the expected rate of new HIV infections. The latter comparison has the benefit of allowing us to make inferences without post hoc knowledge and further obtain uncertainty estimates. Furthermore, both comparisons reflect current practice in aid‐related decision‐making; hence, improvements are the result of a more effective aid allocation.
Table 3 presents the estimation results. First, we find that the observed rate of new HIV infections on the holdout set (1.074 per 1000) and the expected HIV infection rate with the actual aid allocation under the Lasso (1.101 per 1000) are largely on par. This validates the overall accuracy of the Lasso and thus of Stage 1 in our decision model. Second, we obtain fairly narrow uncertainty regions for the outcomes, which points toward the overall reliability of the estimates. Third, for our decision model, the expected rate of new HIV infections is 1.071 per 1000. This is lower than the expected rate of new HIV infections (1.101 per 1000) from current practice in aid allocation. Thus, our decision model promises a reduction in the infection rate of 2.72%.
To illustrate the variation across countries, we provide a few examples with particularly large/small reductions. For instance, the reduction in the HIV infection rate is estimated to be 


Overview of suggested aid allocation across countries
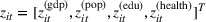
In the following, we compare the aid allocation suggested by our decision model across countries. Figure 2 depicts the grant volume across all recipient countries. For reasons of space, we focus on grants, whereas loans are presented in Supporting Information Supplement G. Countries with a high HIV infection rate often belong to the group of least‐developed countries and thus receive aid almost exclusively through grants.
Allocation of development aid from the decision model (here: grant volume per country)
As can be seen in Figure 2, large numbers of grants are allocated to countries on the African continent, specifically those in Eastern and Southern Africa (e.g., Mozambique, Zimbabwe, South Africa). This observation is expected, as Eastern and Southern Africa are characterized by a high prevalence of HIV infections. As a direct implication, our model recommends that managers from funding bodies allocate a large share of development aid to Eastern and Southern Africa.
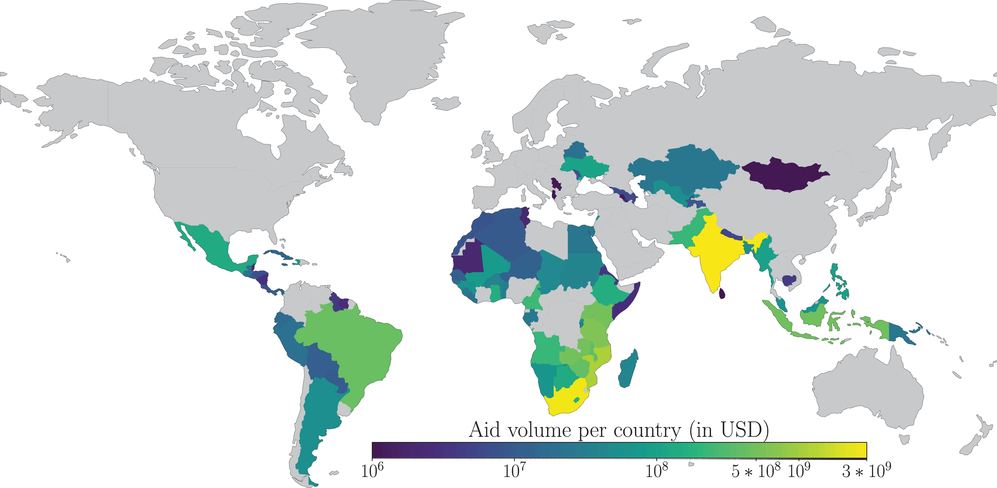
The aid allocation per capita is presented in Figure 3. Again, the highest aid volume per capita is allocated to African countries (e.g., Lesotho and Botswana). However, a high aid volume per capita is also sent to countries in Asia (e.g., India and Indonesia), Latin America (e.g., Brazil, Guyana, and Suriname), and Europe (e.g., Ukraine and Moldova). Overall, when comparing the major recipient countries to the actual prevalence of HIV, we see that the decision model allocates large volumes of aid to countries that are severely affected by HIV.
Allocation of development aid from the decision model (here: grant volume per capita)
Comparison of suggested versus observed aid allocation
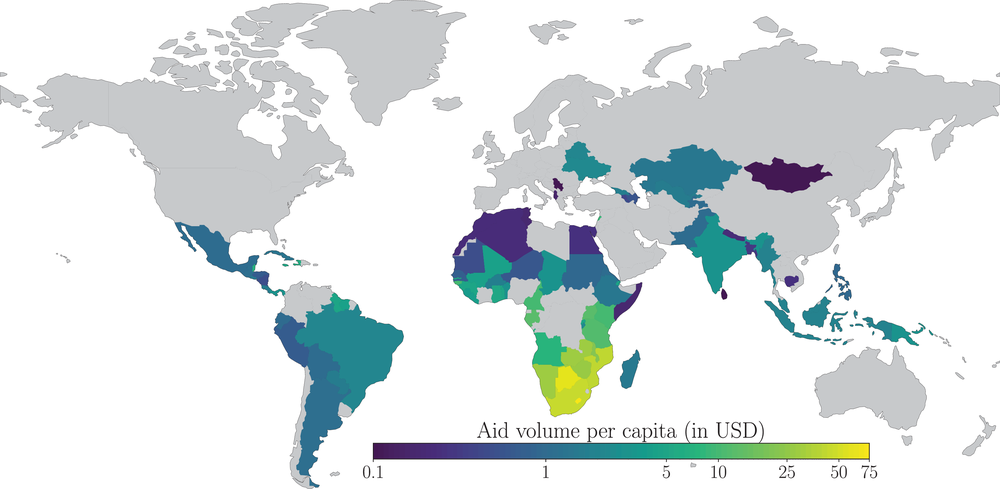
We next compare (i) the suggested aid allocation from our decision model against (ii) the observed allocation from current practice (as given by the holdout set). Again, we focus on grants due to their large financial volume compared to loans (see Supporting Information Supplement G for loans). Figure 4 shows the difference between the suggested and observed aid disbursements for grants across different recipient countries. The suggested disbursement is higher than the observed disbursement for many countries in South America or Northern Africa. An interesting pattern is seen in the case of Argentina, where the decision model suggests a change to the current funding mix, allocating considerably more funds via grants while reducing funding through loans. This matches expectations when considering the recent economic history of Argentina (e.g., the country defaulted in 2014 and 2020), which is proactively addressed by our model by recommending grants over loans. The opposite is the case for Namibia where the funding mix should be changed more toward loans, reflecting trends of increasing GDP per capita.
Difference between suggested and observed disbursement of development aid (here: grant volume per capita)
In summary, our model suggests that, for some countries, the funding mix across grants versus loans should be revisited. To this end, our model informs managers of funding bodies on how to achieve operational outcomes in terms of which countries should receive more (or less) development aid versus the status quo. Here, our model suggests that more attention should be placed on Northern Africa and Latin America. To achieve a cost‐effective allocation, our model recommends that managers from funding bodies partly redirect aid from Southern and Eastern Africa toward Northern Africa and Latin America.
We further report summary statistics for the suggested and observed allocations. Table 4 provides summary statistics at the country level and Table 5 additionally in per‐capita units. Importantly, the overall volume of development aid is determined by the budget constraints and is therefore identical in both the suggested and observed aid allocations. As given by the budget constraints, development aid is largely disbursed through grants (i.e., 99.42% of the overall volume) and only to a small extent through loans (i.e., 0.58% of the overall volume). The aid volume per capita is characterized by a lower standard deviation in our decision model (SD 

Summary statistics of suggested versus observed allocations of development aid per country (in million USD)
Note: Unit of analysis, expected/observed values based on holdout set (
Abbreviation: SD, standard deviation.
Summary statistics of suggested versus observed allocations of development aid in per‐capita units (in USD per person)
Note: Unit of analysis, expected/observed values based on the holdout set (
Abbreviation: SD, standard deviation.
Figure 5 shows the suggested versus observed distributions of development aid across countries. The plot provides evidence that our decision model results in a similar yet more uniform distribution of aid across countries. This is confirmed by a considerably lower Theil index for the suggested volume of aid grants (Theil index of 1.05) compared with the observed volume (1.40). Such findings can be directly attributed to large variations in aid effectiveness across countries. In this regard, considerably higher aid volumes per capita are needed for many countries in order to reduce HIV infection rates by the same amount.
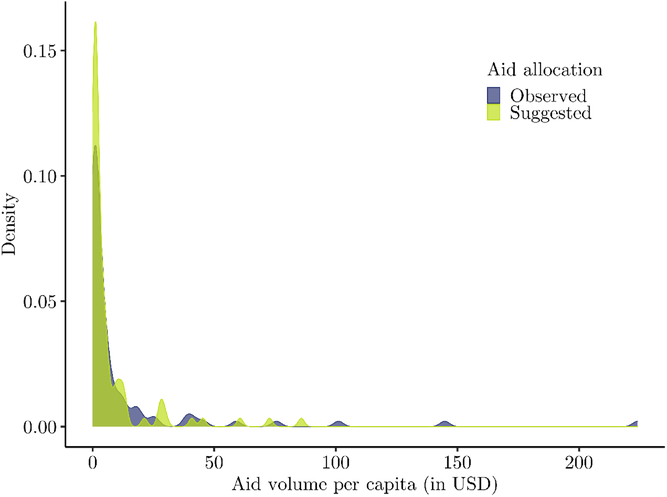
Distribution of financial volume in the suggested versus observed aid allocations (here: grants)
Figure 6 compares the suggested and observed aid allocations at the country level. Evidently, a considerable amount of development aid would be allocated differently under our model. Our model suggests a larger aid volume than the observed value for 44 of 94 countries, of which 11 belong to the group of least‐developed countries, and 20 are upper‐middle‐income countries. The Pearson's correlation coefficient between suggested and observed grants amounts to 0.79. Hence, our model suggests that managers from public bodies should generally assign more aid to both least‐developed and upper‐middle‐income countries. A detailed comparison across income groups is presented in Supporting Information Supplement A.
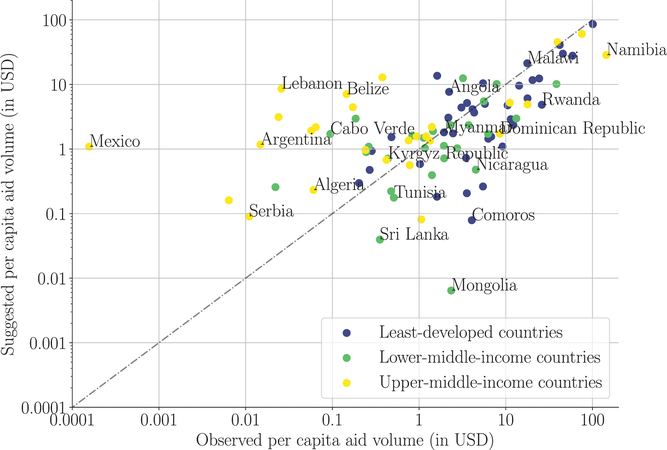
Comparison of financial volume in the suggested versus observed aid allocations (here: grants)
Qualitative explanations of findings
In Table 6, we report the suggested and the observed volume of aid for countries with the overall largest increases in aid per capita. We now offer insights into why our decision model has suggested large increases for these countries and draw connections to socioeconomic developments in these countries as a qualitative explanation.
Countries with the overall largest changes in aid volumes between the suggested versus observed allocations (in USD per person)
Note: Unit of analysis, expected/observed based on holdout set (
First, we find that most of listed countries exhibit double‐digit growth in the number of HIV incident cases in the last decade (GBD HIV Collaborators, 2021). For example, between the year 2010 and 2017, the number of HIV cases increased in Mexico by 11.76%, in Panama by 5.88%, and in Lebanon by 28.57% (UNAIDS, 2019). As a result, these countries also face a higher need for development aid in order to strengthen their fight against HIV. However, the funding remained fairly similar or even decreased. For example, for 2010–2017, the funding of Mexico, Panama, and Lebanon decreased by over 40%. Evidently, and in line with previous discussions (Global Burden of Disease Health Financing Collaborator Network, 2020), donors have not caught up with the trend and have thus not adapted their aid disbursements to the growing HIV prevalence.
Second, the increases in allocated aid can often also be explained by the macroeconomic downturns due to which countries have less ability to contribute to development activities themselves but, instead, are more dependent on external funding. For example, our model suggests allocating more grant volume to Argentina together with a reduction in the loan volume. This aligns with the fact that Argentina has been affected by a severe economic crisis.
Third, our model allocates larger amounts of funding to countries where the quality of healthcare and educational systems decreased such as, for example, due to humanitarian crisis. One example is Lebanon, which hosts an estimated 1.5 million refugees from Syria, the highest per capita number of refugees in the world (United Nations, 2020b). This has led to poverty, unemployment, and an economic downturn (United Nations, 2020b).
Operational effectiveness under varying budgets
Figure 7 presents the estimated effectiveness of aid disbursement given different budgets of development aid. As expected, we see that the HIV infection rate falls when the volume of aid increases. Thus, given a larger volume of aid, operational effectiveness becomes larger. An increase in the overall grant volume of 10% over current practice suggests an expected reduction in the change in the HIV rate by 0.2 percentage points. For public sector operations, this allows decision‐makers to make inferences about how much is needed to achieve a specific reduction in HIV infections and then to align funding. Altogether, this provides evidence that, compared with the status quo, there are overlooked potential for improving the operational effectiveness behind aid allocations and, therefore, that managers of funding bodies can allocate development aid more effectively.
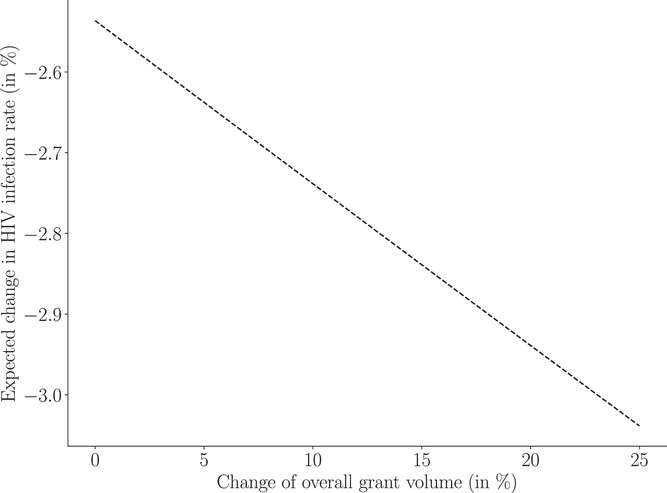
Operational effectiveness under varying volumes of aid grants
Sensitivity analysis
We perform a sensitivity analysis in order to understand how changes in the economic strength of a country influence the need for development aid. Such insights are especially crucial for public decision‐makers in light of the COVID‐19 pandemic. The pandemic has put additional strain on many poor countries due to which many development activities were subject to setbacks (Nature, 2020). Specifically, we seek to understand to what extent the suggested aid allocation is influenced by the country covariate denoting GDP per capita. For this, we compute how much more (or less) aid volume is needed to keep the expected rate of new HIV infections equal when changing the GDP per capita. For example, our decision model suggests that Argentina should receive grants of 1.1707 USD per person given the current GDP per capita of USD 20,843.16 to reduce the rate of new HIV infections by 
Figure 8 shows the results. Overall, we observe that, given a constant rate of expected new HIV infections, the required aid volume declines when economic strength increase. This is in line with the theory (Birchler & Michaelowa, 2016) that larger economic strength allows countries to finance development activities toward ending HIV. Furthermore, we observe that the required aid volume varies across countries. For example, we find that many countries in sub‐Saharan Africa are still dependent on large funding amounts even when the economic strength increases. In contrast, other countries in, for example, South America show more pronounced responsiveness to increases in economic strength.
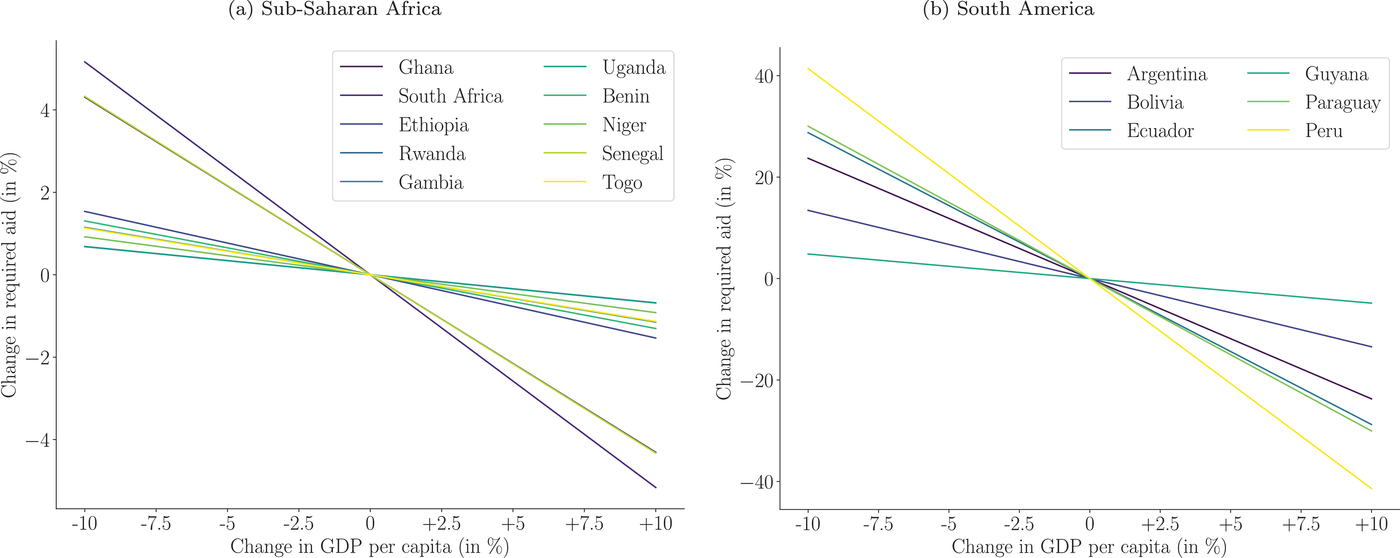
Required aid volume (here: grants per capita) to maintain the reduction in the new HIV infection rate while varying the economic strength of different countries (i.e., GDP per capita)
In Figure 9, we investigate the impact of varying aid volumes on health outcomes on a country level. For this, we compute the treatment effect (Chernozhukov et al., 2017) of grants on the rate of new HIV infections. We observe that the effect of aid on the rate of new HIV infections is negative. With increasing aid, the effect on the rate of new HIV infections becomes larger. Furthermore, the effectiveness of aid varies across countries. Generally, the same relative increase in aid leads to a larger reduction for countries in South America than in sub‐Saharan Africa. This is supported by the literature arguing that countries in sub‐Saharan are highly dependent on aid due to their low development status (Global Burden of Disease Health Financing Collaborator Network, 2020). In summary, our analysis informs managers of funding bodies on how country‐specific HIV infection rates respond to funding.
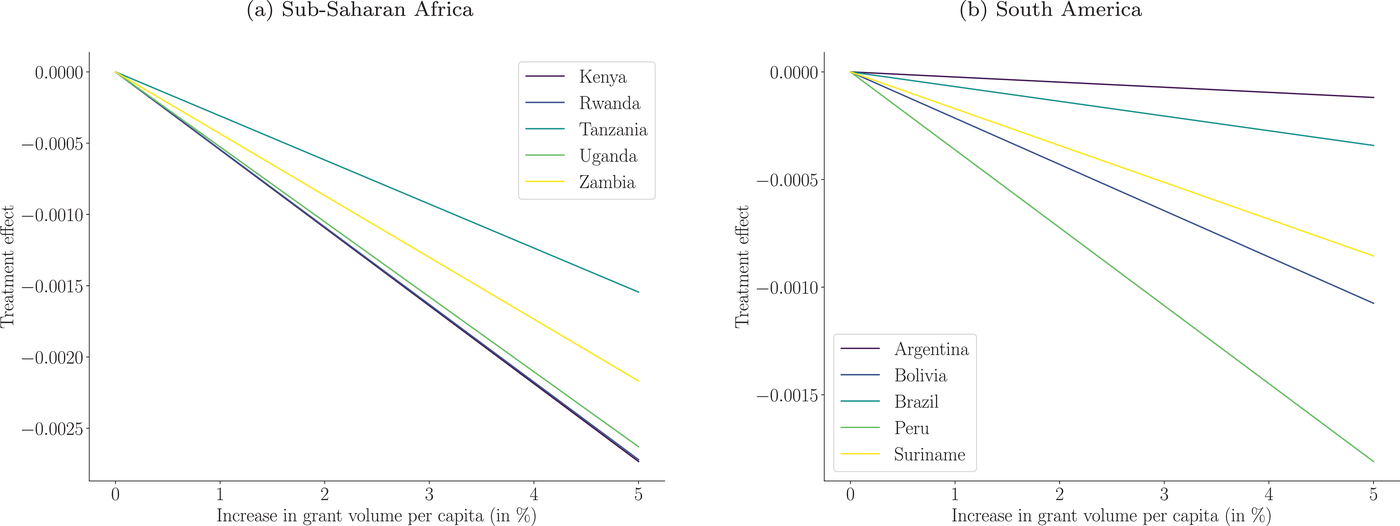
Reduction in the new HIV infection rate while varying the aid volume of different countries (i.e., grants per capita)
Robustness checks
We perform a series of additional analyses to confirm the robustness of our results. First, we rule out the possibility of a potential ripple effect, whereby errors in the estimation of the HIV infection rate in Stage 1 translate into downstream errors in the allocation from Stage 2. We thus perform a computational analysis as follows (Supporting Information Supplement B). We use the predictions from Stage 1 and add different degrees of prediction errors (“noise”). We then compare the effect on the expected HIV infection for the optimal allocation as suggested in Stage 2. If, hypothetically, there was a ripple effect, we would expect systematically larger HIV infection rates in Stage 2, which would indicate a suboptimal allocation and thus an inferior overall solution quality. However, we do not find such evidence. Despite varying prediction errors, the solution quality remains robust.
Our model follows a predict‐then‐optimize paradigm, which is widely used in OM (e.g., Elmachtoub & Grigas, 2022; Senoner et al., 2021). Nevertheless, we also experiment with an alternative formulation where the objective functions from both Stage 1 (i.e., the loss function of the Lasso) and Stage 2 (i.e., the reduction in HIV infections) are combined and then optimized jointly (Supporting Information Supplement H)). This leads to consistent findings. In practice, we expect several advantages from using a predict‐then‐optimize approach. First, it allows practitioners to assess the prediction performance in Stage 1 and ensures explainability and sufficient model fit. Second, it uses established procedures for hyperparameter tuning (e.g., time‐series cross‐validation). This contrasts with joint optimization, where hyperparameters must be set a priori based on expert knowledge. Third, it is flexible in that it supports arbitrary prediction approaches (e.g., machine learning or epidemiological modeling, as used below for benchmarking).
Finally, we use an epidemiological model as a benchmark. In epidemiology, the transmission dynamics of infectious diseases are described using compartmental models that reflect different subgroups (so‐called compartments) of the population between which individuals transition (Elliot et al., 2000; Hethcote, 2000). A well‐known compartmental model is the susceptible‐infected‐recovered (SIR) model (Elliot et al., 2000; Hethcote, 2000). For this, we adapt the standard SIR model to our setting of HIV and development financing. Specifically, we model the transition from the compartment of susceptible to infected individuals as a function of development aid. Further, we model the transmission rate of HIV as country‐specific. Following Becker and Grenfell (2017), we then use the resulting epidemiological model to estimate the rate of new HIV infections and thus use it as a replacement for the Lasso in Stage 1 of our decision model, so that the same optimization objective is used for aid allocation. In Stage 1, the epidemiological model predicts the rate of new HIV infections with an out‐of‐sample explained variance of 78.3%. However, this deviates from the predictions from our Lasso (out‐of‐sample 
DISCUSSION
Implications of findings
Ending the HIV epidemic is an important target of the United Nations SDGs, and, to achieve this, poor countries require large amounts of development aid. However, current practice in aid allocation is known to be inefficient (Global Burden of Disease Health Financing Collaborator Network, 2020), because of which aid disbursements are often not aligned with the actual needs of countries. To address this, we developed a data‐driven decision model for managers from funding bodies that supports them in identifying cost‐effective allocations.
The findings generated by our decision model have several important implications for managers in development finance: First, there is a large potential for a more effective allocation of development aid. Based on our model, funding bodies can identify countries in need and target them more effectively. This is expected as current practice is based largely on heuristics or subjective assessments (OECD, 2009, 2020b). Here, a data‐driven approach may be helpful to overcome existing inefficiencies. Our model captures various trends and may thus be more responsive to changes in economic strength or setbacks in HIV reductions. Moreover, funding bodies must account for the fact that aid effectiveness varies across countries, which is especially relevant when searching for a cost‐effective allocation of development aid at a global level. As such, our work addresses an important operational problem from practice (OECD, 2020b).
Second, there are some general recommendations for how managers of funding bodies should revise disbursement policies. Our model supports the current practice that allocates large volumes of aid to countries severely affected by HIV. However, the model also suggests increasing aid volumes over current practice for countries in South America and Northern Africa. Moreover, we find that larger volumes of aid should be redirected to lower‐middle‐income countries and upper‐middle‐income countries (e.g., Mexico, Argentina, Ukraine, and Brazil). By contrasting our model against current practice, managers of funding bodies can better understand where inefficiencies are currently located and how a cost‐effective allocations should look like.
Third, current practice in allocating grants and loans should be revised. As expected, there is a trade‐off between the different financial instruments. In our model, grants are primarily designated for least‐developed countries, which coincides with the fact that they are free of repayment obligations. An example is Argentina, which, different from current practice, would benefit from more grants over loans (reflecting the uncertain economic climate with frequent bankruptcies in the past). Therefore, managers need should make more careful choices in the future to align grants versus loans with country‐specific needs.
Fourth, operational effectiveness is linked to the available budget. This is relevant for funding bodies that manage aid allocations. Based on our model, one can estimate how increases in the global budget for the fight against HIV translate into reduced infections. Simply put, this allows one to determine how much aid is needed to reach a specific objective. In this regard, we found that a 10% increase in global development for the fight against HIV is expected to reduce the global HIV infection rate by 0.2 percentage points. This is especially relevant as the COVID‐19 pandemic has put additional strain on the economy of poor countries due to which many development activities were put on hold (Nature, 2020). Here, our analysis offers insights for public decision‐making on how much additional funding would be required to end the HIV epidemic.
Implications for research
Our work contributes to the literature in two ways. On the one hand, we add to a growing stream of literature in OM that aims to support humanitarian operations (e.g., Berenguer et al., 2016; Besiou & Van Wassenhove, 2020; de Vries & Van Wassenhove, 2020; Gallien et al., 2017; Keshvari Fard et al., 2021; Van Wassenhove, 2019; Zobel et al., 2016). While previous works have extensively studied funding acquisitions or budgeting, we focused on cost‐effective disbursement. Thereby, we respond to previous calls to “use new technologies (artificial intelligence, data mining, hackathons, etc.) to develop capacities to map flows to the SDGs and assess SDG financing needs and gaps” (OECD, 2019; Toetzke et al., 2022).
Our work contributes also to OM research on predictive modeling, which has proven valuable for decision‐makers in several areas, such as supply chain and health management (e.g., Mišić & Perakis, 2020). To support humanitarian operations, predictive models may, for example, be used by decision‐makers to forecasting disease spreading (de Vries et al., 2016). A recent survey conducted by Altay and Narayanan (2021) has identified several impactful applications in disaster preparedness and response. Here, we add to the literature by showing the operational value of predictive modeling in the context of development finance.
Future research may apply our decision model to other SDGs beyond ending the HIV epidemic. We see several promising examples. For instance, SDG 2 states the aim of “zero hunger.” Toward this goal, public decision‐makers currently invest more than USD 4.8 billion for development aid annually. Another example is climate change mitigation, which requires large‐scale investments in the developing world to lower greenhouse gas emissions and achieve the goal of limiting global warming to 1.5
Practical considerations
The performance of our decision model is determined by several factors. First, it is governed by access to suitable predictors (data availability). Nowadays, such data are made readily available for development activities worldwide due to extensive monitoring (e.g., by the CRS of the OECD) (Toetzke et al., 2022). Second, our decision model relies upon accurate predictions in Stage 1, which are then fed into Stage 2. Our results show that a favorable accuracy can be achieved. In our analysis, we found that our choice of predictors explains around 95% of the variance in the rate of new HIV infections. Third, the parameterization of our decision model can be adapted to needs in practice. Informed by the literature, we considered a variety of predictors. Nonetheless, future research may choose to include a different set of predictors.
We emphasize that our objective is not to coordinate aid disbursements at the level of individual funding bodies. Based on our discussion with OECD stakeholders, developing a model that accommodates the various operational constraints is likely to be of little value in practice. It would likely demand that coordination among public bodies, including their operational expertise, their competitive advantages, and their synergies, be modeled accurately. Thus, it would require more detailed data than are available in the development aid sector. More importantly, such a detailed tactical model would need to accommodate many idiosyncratic aspects of individual aid activities (cf. Berenguer et al., 2016). Thus, it is likely to fail in providing meaningful recommendations in practice. Instead, the model presented here attempts to make recommendations about countries in need and thus models the allocation of development aid on a global scale, thereby fulfilling a direct need from practice (OECD, 2020b).
We further acknowledge that aid disbursements are not only driven by needs but also by political considerations. One example is that aid may be subject to sanctions (e.g., a 2021 resolution by the United Nations Security Council suspended aid temporarily for Afghanistan after the Taliban took over power). In other cases, development aid may be linked to certain strategic aims of politics (e.g., the Unites States fund particularly activities in neighboring countries, activities in countries that promote human rights, or activities that align with the local economy). Here, our decision model and the proposed sensitivity analyses can support decision‐makers in better estimating the possible loss in health outcomes due to a reduction of aid disbursement. Hence, our decision model could be consulted when negotiating funding volumes.
An important purpose of our decision model is transparency. Transparency is seen as a cornerstone of the effective coordination of development activities (OECD, 2019). In particular, transparency is needed to better coordinate between the vast number of funding bodies and funding instruments and reduce the risk of potential blind spots. Third, it is nowadays common that development finance is organized through negotiations between poor countries and donors, for which our analysis reveals needs and gaps.
Concluding remarks
A leading cause of death around the globe is HIV. To date, more than 75 million people have been infected, and more than 32 million have died as a result. To end the HIV epidemic, countries in need receive more than USD 15.18 billion annually in official development aid. However, the current practice of allocating aid is largely based on decision heuristics and is thus known to have inherent inefficiencies. In this paper, we developed and validated a data‐driven decision model that determines an optimal allocation of development aid across countries so that the expected rate of new HIV infections is minimized. This ensures cost‐effective aid disbursements to achieve progress toward the SDGs. In sum, our decision model fulfills an important demand from practice, which calls for better tools for development aid allocations. It thus supports managers from funding bodies tasked with financing development activities and thus helps them achieve cost‐effective progress toward ending the HIV epidemic.