
Abstract
Meeting the United Nations Sustainable Development Goals (SDGs) will require adapting or redirecting a variety of very complex global and local human systems. It is essential that development scholars and practitioners have tools to understand the dynamics of these systems and the key drivers of their behavior, such as barriers to progress and leverage points for driving sustainable change. System dynamics tools are well suited to address this challenge, but they must first be adapted for the data‐poor and fragmented environment of development work. Our key contribution is to extend the causal loop diagram (CLD) with a data layer that describes the status of and change in each variable based on available data. By testing dynamic hypotheses against the system's actual behavior, it enables analysis of a system's dynamics and behavioral drivers without simulation. The data‐layered CLD was developed through a 4‐year engagement with USAID/Uganda. Its contributions are illustrated through an application to agricultural financing in Uganda. Our analysis identified a lack of demand for agricultural loans as a major barrier to broadening agricultural financing, partially refuting an existing hypothesis that access to credit was the main constraint. Our work extends system dynamics theory to meet the challenges of this practice environment, enabling analysis of the complex dynamics that are crucial to achieving the SDGs.
Keywords
Introduction
The United Nations (UN) Sustainable Development Goals (SDGs) are a “call to action” to end poverty, eliminate hunger, enhance equality, widen access to water, energy, and education, and achieve many other important milestones for humanity (The UN General Assembly 2015). Meeting the SDGs will require coordinated action and investment by national governments, non‐governmental organizations (NGOs), the private sector, and civil society (United Nations 2020). This is a massive challenge, not least because these goals seek to address a set of intractable problems with multidimensional causes that intersect and influence one another (Lim et al. 2018, Nilsson et al. 2016). Achieving the SDGs will require adapting or redirecting a variety of very complex global and local human systems. As such, it is essential that development scholars and practitioners have a basic set of tools to understand the dynamics of these systems: how a system behaves over time, what drives its performance, and where interventions could create positive change (Elliott et al. 2008, Lim et al. 2018, USAID 2014).
Despite wide recognition of the need for a systems perspective (Hummelbrunner 2011, Ramalingam et al. 2008, Ulrich 2010, USAID 2014), there are few tools available to development practitioners that can analyze a system's dynamic behavior and its drivers. System dynamics tools could meet this need (Hjorth and Bagheri 2006, Shi and Gill 2005, USAID SPACES MERL 2016, Zomorodian et al. 2018). Causal loop diagrams (CLDs) provide a broad picture of the system's causal structure, while simulation models reveal how key elements of the structure drive system behavior (Homer and Oliva 2001, Sterman 2000).
However, system dynamics tools must first be adapted for use in fragmented and data‐poor environments. Many development problems are data‐poor, with limited quantitative and even qualitative data available for the numerous factors that determine development outcomes (Fowler and Dunn 2014, Osorio‐Cortes and Jenal 2013). Development contexts are also fragmented, in that knowledge of the relevant system(s) is spread across a large number of low‐scale actors who each have only a narrow view of part of the system (Campbell 2014, Elliott et al. 2008, USAID 2014). As a result, the system's overall structure and behavior are hard to characterize in sufficient detail for simulation. Without simulation, a CLD alone is ill‐suited for testing hypothesized explanations of problematic system behavior (Homer and Oliva 2001) and thereby inferring its drivers. There is a need for system dynamics tools that can analyze dynamics effectively in such an environment without requiring prohibitively extensive data collection or potentially misleading assumptions.
This study's key contribution is an adaptation of the system dynamics approach to the analysis of dynamics in fragmented and data‐poor development contexts, by enabling limited inference of behavioral drivers without simulation. Specifically, we extend the CLD with a data layer: data are added to each variable in the diagram to describe its status, such as the extent to which behaviors are adopted or conditions are true, and its change over time. This data‐layered CLD enables, without simulation, a characterization of a system's dynamic behavior and a limited “test” of hypothesized explanations for its behavior by comparing actual behavior against expectations. Thus, it mitigates some of the drawbacks of relying on CLDs alone and avoids simulating based on broad assumptions in a fragmented and data‐poor environment.
The data‐layered CLD also represents a practical contribution to international development. It was developed through a 4‐year engagement with the United States Agency for International Development (USAID) in Uganda, in which our research team worked with practitioners who are at the forefront of adapting systems approaches for market facilitation interventions (USAID/Uganda 2016). 1 Through several studies, we evolved the data‐layered CLD to meet their need for a practical and useable framework to (1) monitor a system's dynamic behavior; (2) identify barriers to change; and (3) identify leverage points for change. This analysis of the system's behavioral drivers is intended to enable the adaptation of USAID's interventions to the system's emerging dynamics. Developing the framework through extensive practitioner engagement enabled us to extend SD tools for practical application to development policy guidance.
We illustrate the practical and theoretical contributions of our framework through one of our studies in Uganda. Access to financing for improved agricultural inputs, such as higher quality seeds, is widely considered a potential enabler of increased agricultural production and therefore food security (SDG 2) and economic growth (SDG 8) in sub‐Saharan Africa (Adjognon et al. 2017, Asfaw et al. 2012, Awotide et al. 2015, Kinuthia and Mabaya 2017). To support USAID's goal of broadening access to agricultural financing, we developed a data‐layered CLD through extensive stakeholder engagement, assembled and analyzed different data sources to assess the status of the system, and analyzed the resulting data‐layered CLD to understand the dynamics over time. We found that one of the main barriers to broader agricultural financing is a lack of demand for loans among rural Ugandans—an insight that seems to have been under‐emphasized or missed by the practice and scholarly communities.
The paper is organized as follows: Section 2 describes the need for the framework and reviews related literature. Section 3 explains how to build and interpret a data‐layered CLD. Section 4 describes the application of the framework to analyzing agricultural financing in Uganda. Section 5 discusses our contributions and opportunities for future work, and Section 6 concludes the paper.
Motivation and Related Literature
The Need for System Tools in Development
The practice of international development has begun to look toward systems approaches over the past two decades, based on the recognition that addressing the symptoms of poverty is not sufficient, and that achieving the SDGs will require an understanding of its root causes in complex systems (Arkesteijn et al. 2015, Jones 2011, Ramalingam et al. 2008, Ulrich 2010). Systems approaches have been used in a wide variety of geographies (such as Ghana, Rwanda, Ethiopia, and Uganda) and development sectors (including health, agriculture, and democracy and governance) (Turner 2020, USAID 2014, USAID 2019, USAID SPACES MERL 2019). To implement a systems approach, development practitioners must design an intervention that can change the system, then monitor its implementation and adapt the intervention to the system's emerging dynamics (Campbell 2014, Elliott et al. 2008, USAID 2014, USAID SPACES MERL 2016, 2019). To support this work, international development practitioners began adapting systems concepts for development and recognized the need for a new set of tools (Bakewell and Garbutt 2005, Bowman et al. 2015, Fujita 2010, Williams and Hummelbrunner 2010).
An example illustrates what is meant by a systems approach to development and why new tools are needed. One of its more common and prominent applications is in markets and economic growth, where the approach is termed “market facilitation” or “market system development.” Unlike traditional development, which focuses on removing a particular constraint or providing something the market has failed to provide, market system development attempts to influence existing supply chains and market actors to ensure that the market meets beneficiaries’ needs (Campbell 2014, Elliott et al. 2008, Turner 2020, USAID 2014, 2019). For example, in order to broaden farmer access to high‐quality seed, a traditional intervention might provide seed directly to farmers. In contrast, a recent market system intervention in Uganda worked with agrodealers to help them see the value in selling higher quality seed and worked with farmers to help them see the value in paying a higher price for it (USAID 2011). Designing this intervention required understanding first, why farmers do not seek high‐quality seeds and agrodealers do not sell them, and second, how to remove all these interrelated barriers at once.
This example illustrates the necessity of understanding the dynamics that drive system performance in order to properly design, monitor, and adapt system interventions (Arkesteijn et al. 2015, Hummelbrunner 2011, Jones 2011, USAID SPACES MERL 2019). Practitioners must first diagnose “the symptoms and causes of underperformance” (Elliott et al. 2008) before they can identify a set of interventions that can nudge a complex system toward fundamental change (Campbell 2014, Elliott et al. 2008, USAID 2014, USAID SPACES MERL 2016, 2019). Understanding dynamics is particularly challenging because there are multiple interacting rules, institutions, actors, relationships, time delays, and feedback loops (Campbell 2014, Lim et al. 2018, Nilsson et al. 2016, Nippard et al. 2014, Reinker and Gralla 2018, USAID 2016), which lead to high levels of dynamic complexity: counterintuitive behavior due to the interaction over time of many interdependent influences (Forrester 1971, Sterman 2000).
Most of the existing tools for designing, monitoring, and evaluating development interventions are inadequate for analyzing the dynamics of such systems. The most commonly used tools for planning and evaluation, logframes and results chains, successfully represent causal chains from interventions to outcomes, but they are too linear and narrow to capture all the varied influences on system behavior (Bakewell and Garbutt 2005, BEAM Exchange 2020, DCED 2020, Dunn et al. 2016, Eyben et al. 2008, Fowler and Dunn 2014, Hieronymi 2013, McEvoy et al. 2016, Simister and Garbutt 2015, Tanburn and Sen 2011). A few specialized tools for systems thinking in development have improved upon these practices by providing conceptual frameworks that promote broader measurement and analysis of important system features (e.g., Campbell 2014, The Springfield Centre 2015, USAID 2014). However, they are not designed to enable a systematic analysis of the interacting structures of cause and effect that drive system behavior (USAID SPACES MERL 2016). Indeed, our research team was contracted by USAID/Uganda to support an ongoing market system development project after they recognized the need for additional tools to understand the system's evolving dynamics.
There is, therefore, a need for a new set of tools that can analyze a broad and complex development system's dynamic behavior (Bakewell and Garbutt 2005, Bowman et al. 2015, Fujita 2010, Williams and Hummelbrunner 2010). A small but growing collection of such tools are being piloted in many places and contexts (FHI360 2019, USAID AMAP 2011, USAID SPACES MERL 2016, 2019). One of the most promising tools in this category is system dynamics (SD). System dynamics has been recognized as being suitable for development work; it has been applied in humanitarian supply chains (Besiou et al. 2011, Gonçalves 2011, Kunz et al. 2014), global health (Lin et al. 2020, USAID SPACES 2018), water and environmental systems (Zomorodian et al. 2018), and our focus area, agricultural development (Derwisch et al. 2016, McRoberts et al. 2013, Muflikh et al. 2021, Parsons and Nicholson 2017, Reinker and Gralla 2018, Shi and Gill 2005, USAID CITE 2016). However, there remain strong barriers to using SD and similar approaches in the development context, including resource constraints, perceived complexity, and time and data requirements (USAID SPACES MERL 2016, Walton 2016). Perhaps as a result, very few of the SD models in agricultural development were built with the involvement of development practitioners (Muflikh et al. 2021). There is a clear need to further characterize these barriers and to adapt and operationalize SD for wider use in development practice; we address this gap in this study.
Challenges in Using System Dynamics for Development: The Fragmented and Data‐Poor Environment
System dynamics refers to a suite of tools that include, primarily, two distinct approaches: causal loop diagramming, in which a visual map is developed to show concepts and their causal relationships; and system dynamics simulation models, in which a system of stocks and flows is mathematically simulated to predict system behavior under various conditions (see, e.g., Lane 2008, Sterman 2000). In combination, these tools can meet the abovementioned need to analyze a system's dynamics. A CLD is useful for “understand[ing] long chains of consequence” (Lane 2016) and supports “focused speculation of how to intervene” (Wolstenholme 1999). Critically, however, a CLD should be combined with a simulation model to infer the system's dynamic behavior and its drivers. The CLD represents “dynamic hypotheses” that explain the system's behavior as a result of its causal and feedback structure; then, a simulation model enables testing these hypotheses to infer the causes of system behavior and derive policy insights (e.g., Homer and Oliva 2001, Sterman 2000).
In our work in Uganda, however, we encountered a fundamental barrier: the fragmented and data‐poor context made it challenging to develop simulation models that could usefully test dynamic hypotheses. The agricultural market system spans the entire country and involves a wide array of actors, including major importers and exporters, individual smallholder farmers, small agribusinesses, government regulators, and many others. The available data were often specific to particular donor interventions in one part of the system or came from national‐level surveys that are conducted infrequently and do not capture all the relevant aspects of the system. Similar issues arise in other development problems, including markets, governance, and healthcare (Campbell 2014, Elliott et al. 2008, USAID 2014). Given the breadth of these systems, limited record‐keeping by system actors, and constrained data collection resources of development actors and governments, there are limited quantitative data available (Fowler and Dunn 2014, Osorio‐Cortes and Jenal 2013).
This lack of data presents problems for system dynamics simulations. They function well when quantitative data are limited by relying on qualitative data to characterize system behavior and relationships (Homer and Oliva 2001, Sterman 2000). However, the qualitative data are often acquired by mining the “mental databases” of stakeholders who understand the system (Forrester 1980, Homer and Oliva 2001, Sterman 2000). This is manageable when the focus is a single organization or a single village. However, when the system is broad and fragmented, there is no small set of stakeholders whose mental databases can be mined to parameterize the relationships in the entire system. This challenge is reflected in a recent review of system dynamics applications in agricultural development, which found hardly any models that considered system performance as a whole and only 11% that involved stakeholders in some part of the modeling process (Muflikh et al. 2021). Sufficiently parameterizing a broad development system for simulation could require hundreds of interviews with many different system actors (Steel 2008). Such an effort could be prohibitively slow or expensive. Indeed, data scarcity and perceived complexity were cited by practitioners as key barriers to employing complex systems approaches (Walton 2016).
Under these circumstances, a CLD might be more appropriate as a basis for reasoning. Stakeholders may be able to identify the structure and direction of relationships between variables, even when they do not know the details well enough for simulation. The CLD‐only approach has been used repeatedly in environmental development applications (Inam et al. 2015, Kotir et al. 2017, Purwanto et al. 2019). The literature supports the view that CLDs are useful when data are scarce: some authors argue that without sufficient data, any simulation model could be speculative or even misleading, and a CLD can still provide significant insight without simulation (Coyle 2000, Wolstenholme 1999).
Others, however, argue that CLDs without simulation may also be misleading because humans are poor at inferring the behavior of feedback systems from diagrams alone. Simulation is essential for testing these inferences (Coyle 2000, Homer and Oliva 2001, Lane 2008, Wolstenholme 1999). This is particularly important in the development sector, where there is a need to “check” the intuitive assumptions practitioners make from the limited, linear conceptual models they currently rely on.
In the fragmented and data‐poor development context, therefore, there is a need to develop approaches that mitigate the disadvantages of relying on CLDs alone, without requiring the data, time, and resources to build a full‐fledged simulation model.
Approach: The Data‐Layered Causal Loop Diagram
Overview, Purpose, and Origin
The data‐layered CLD is the result of a 4‐year engagement with USAID/Uganda and other expert development practitioners. The goal was to support the design, monitoring, and adaptation of market facilitation projects. As described in Section 1, this required practitioners to understand the market system's dynamics, and more specifically, to (1) understand the system's dynamic behavior; (2) infer the drivers of system behavior, such as barriers to or enablers of change; and (3) identify leverage points for further change. Over the 4‐year project, tools and concepts from system dynamics literature were adapted and “operationalized” through repeated “pilot tests” to study various development problems. In the process, our attempts to use CLDs and simulations met with challenges (see Section 2.2), and we evolved a data‐layered CLD to meet those challenges. This study distills the core methodology and approach around the data‐layered CLD. (Other publications have also resulted from this effort, including technical reports that document insights specific to agricultural markets in Uganda (see USAID MSM 2020b) and a set of practitioner‐oriented toolkits for applying this approach (USAID MSM 2020c,d).)
The approach has two main steps. The first step, like classic system dynamics, relies on a CLD to describe a system's causal structure and generate or capture dynamic hypotheses that explain its behavior. CLDs resonated with practitioners because they were familiar with results chains, a linear analog to the CLD that is widely used in development. The broader CLD enabled us to represent multiple interacting results chains and feedback loops, and to capture diverse hypotheses about the drivers of system behavior from multiple stakeholders. We made minor adaptations to CLD terminology and conventions to suit the development audience (detailed in USAID MSM (2020c)).
The second step is where our approach differs from classic system dynamics. Rather than developing a model to simulate behavior over time and test dynamic hypotheses, our approach layers data onto the CLD to describe the actual behavior of the system over time. The data layer helped practitioners to trust the diagram and to break out of their more narrow understanding of the system to see its broader dynamic behavior. As we discuss later, it also enabled “tests” of hypothesized explanations for system behavior by comparing actual behavior to expectations, without requiring broad assumptions or extensive data for simulation.
The remainder of this section describes the steps in applying the approach: drawing a CLD; layering data onto the diagram; validating the diagram with practitioners; and interpreting the diagram. The approach is then demonstrated in Section 4 through an application to the agricultural finance sector in Uganda.
Drawing a Causal Loop Diagram
The first step is to draw a CLD, which we often call a “system map” for easier interpretation by the development community. A CLD depicts important variables and the causal links between them (Sterman 2000). For our purposes, the variables should include actor behaviors, relationships between actors, conditions or states of the system, and interventions that can change the system. These are some of the main features of a market system, according to USAID (2014). Any of these variables may be designated as key outcomes—the desired states of the system toward which development activities are working. These are designated in bold red font. The variables are connected by arrows. A solid arrow indicates an enabling relationship, and a dashed arrow indicates a dis‐enabling relationship. Practitioners preferred to use enabling arrows rather than dis‐enabling arrows whenever possible (e.g., “few free seeds distributed” enables demand instead of “free seeds distributed” dis‐enables demand).
The process for building the CLD follows guidance from the literature on group model building, which is not repeated here (see, e.g., Inam et al. 2015, Rouwette and Vennix 2006, Vennix 1996). Instead, we briefly summarize the process: CLDs are built by a group of stakeholders with a facilitator, or by the research team through a series of stakeholder interviews. When building a CLD “from scratch,” mappers write down the key outcome, then work backwards, adding enabling or dis‐enabling variables, until they reach potential interventions or the limits of the system of interest. They next consider both consequences and additional causal influences for each variable, and finally connect variables in any relevant loops. The process is iterative; draft CLDs are shown to the same or new stakeholders, edited, and refined. (A more detailed process is documented elsewhere (USAID MSM 2020c,d).)
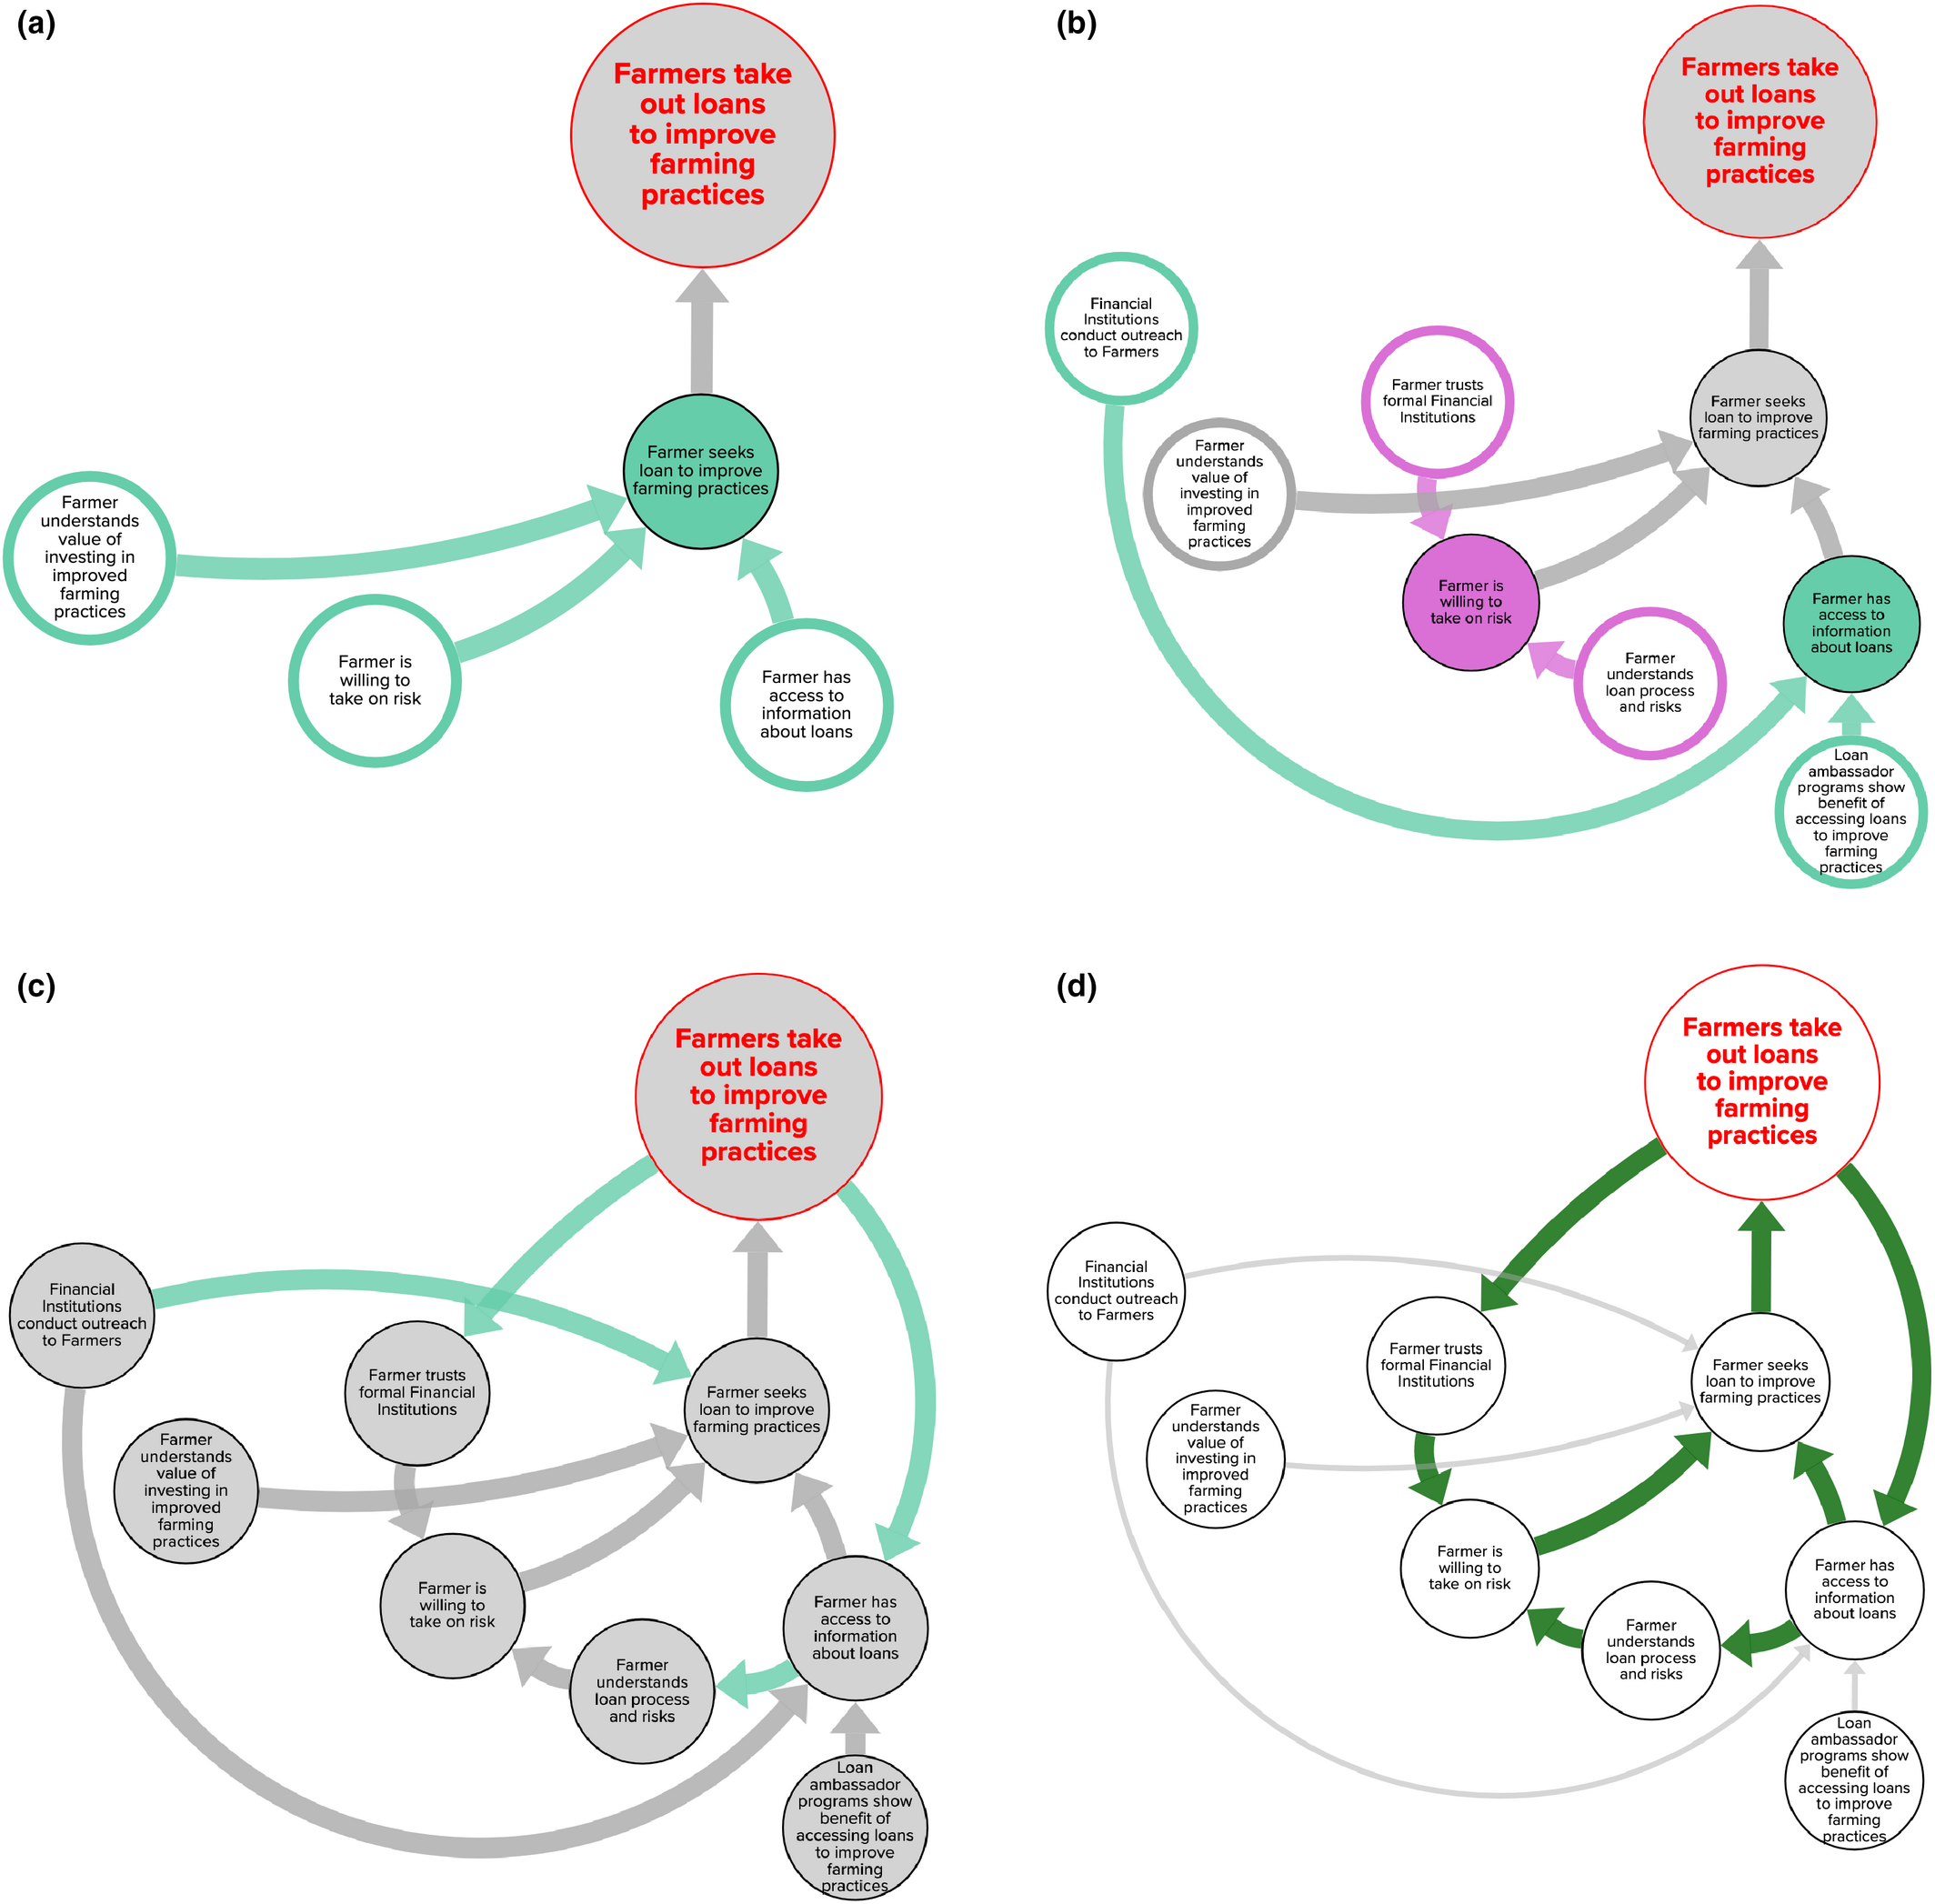
An example is given in Figure 1, which shows a small portion of a larger CLD. First, the key outcome is drawn: Farmers take out loans to improve farming practices. Working backwards, a key enabling variable is added: a farmer has to seek the loan. Working backwards again, three more enabling variables are added: to seek a loan, a farmer must be willing to take on risk, understand the value of investing in farming, and have access to information about loans (Figure 1a). Next, antecedents are found for two of these variables (Figure 1b): willingness to take on risk is enabled by trust in financial institutions and by understanding the loan process and risks; and access to information about loans is enabled by outreach and “loan ambassador” programs. Finally, consequences and loops are identified (Figure 1c): trust and information access are enabled by previous loan experiences, and information access enables understanding the loan process and risks.
Drawing a Causal Loop Diagram [Color figure can be viewed at
Based on this new CLD, key feedback loops are identified by examining the CLD in discussions with stakeholders. Feedback loops may be reinforcing, in which change begets further change in the same direction, or balancing, in which change in one direction is balanced by change in another (Sterman 2000). For example, Figure 1d shows the reinforcing Demand Loop, where farmers taking out loans not only sparks greater trust and willingness to take on risk among other farmers but also widens access to information, enabling still more farmers to take out loans.
In addition to feedback loops, linear (branched) “pathways” may also be labeled with colored arrows. Pathways are an organizing device that is helpful for development practitioners because they align with the results chains already used in their work (see Section 2.1). They are distinct from loops in that they represent linear causal paths from potential interventions to the key outcome. Practitioners often first drew or identified results chains, then added variables that influenced them, and finally labeled the result as a pathway. For example, in Figure 1b, the pink‐bordered variables begin a Demand Pathway that ends at the key outcome; it groups variables that drive farmers to seek loans. Seeing the pathways and how they relate to the loops helped practitioners to connect feedback structure to their existing linear frameworks.
When the system is fragmented, stakeholders may have incomplete knowledge of all parts of the system. We recommend recruiting stakeholders with broad knowledge of different parts of the system—such as industry representatives or cooperative leaders—and supplementing where needed with stakeholders who have more detailed knowledge of specific areas. Additionally, the CLD should be considered a “living document” that can be updated over time, and areas where little is understood can be highlighted to guide future data collection. A second consequence of a fragmented system is that it may be difficult to draw a concise CLD from the outset of the project, since the dynamics are not well understood. We found it useful to draw a broad CLD, akin to a system map, to gather input from a variety of stakeholders. Its key loops can then be distilled into a more concise CLD for analysis purposes (see Section 4).
Layering Data onto the Diagram
The second step is to layer data onto the CLD by measuring each variable and visually representing its status with colors. Two different color codes are needed: one to show the most recent status of each variable and one to show its change over time (which we label “delta”). Figure 2 provides an example for the demand loop drawn in the previous section. The following paragraphs describe how to measure each variable, how to select data, and how to determine the colors.
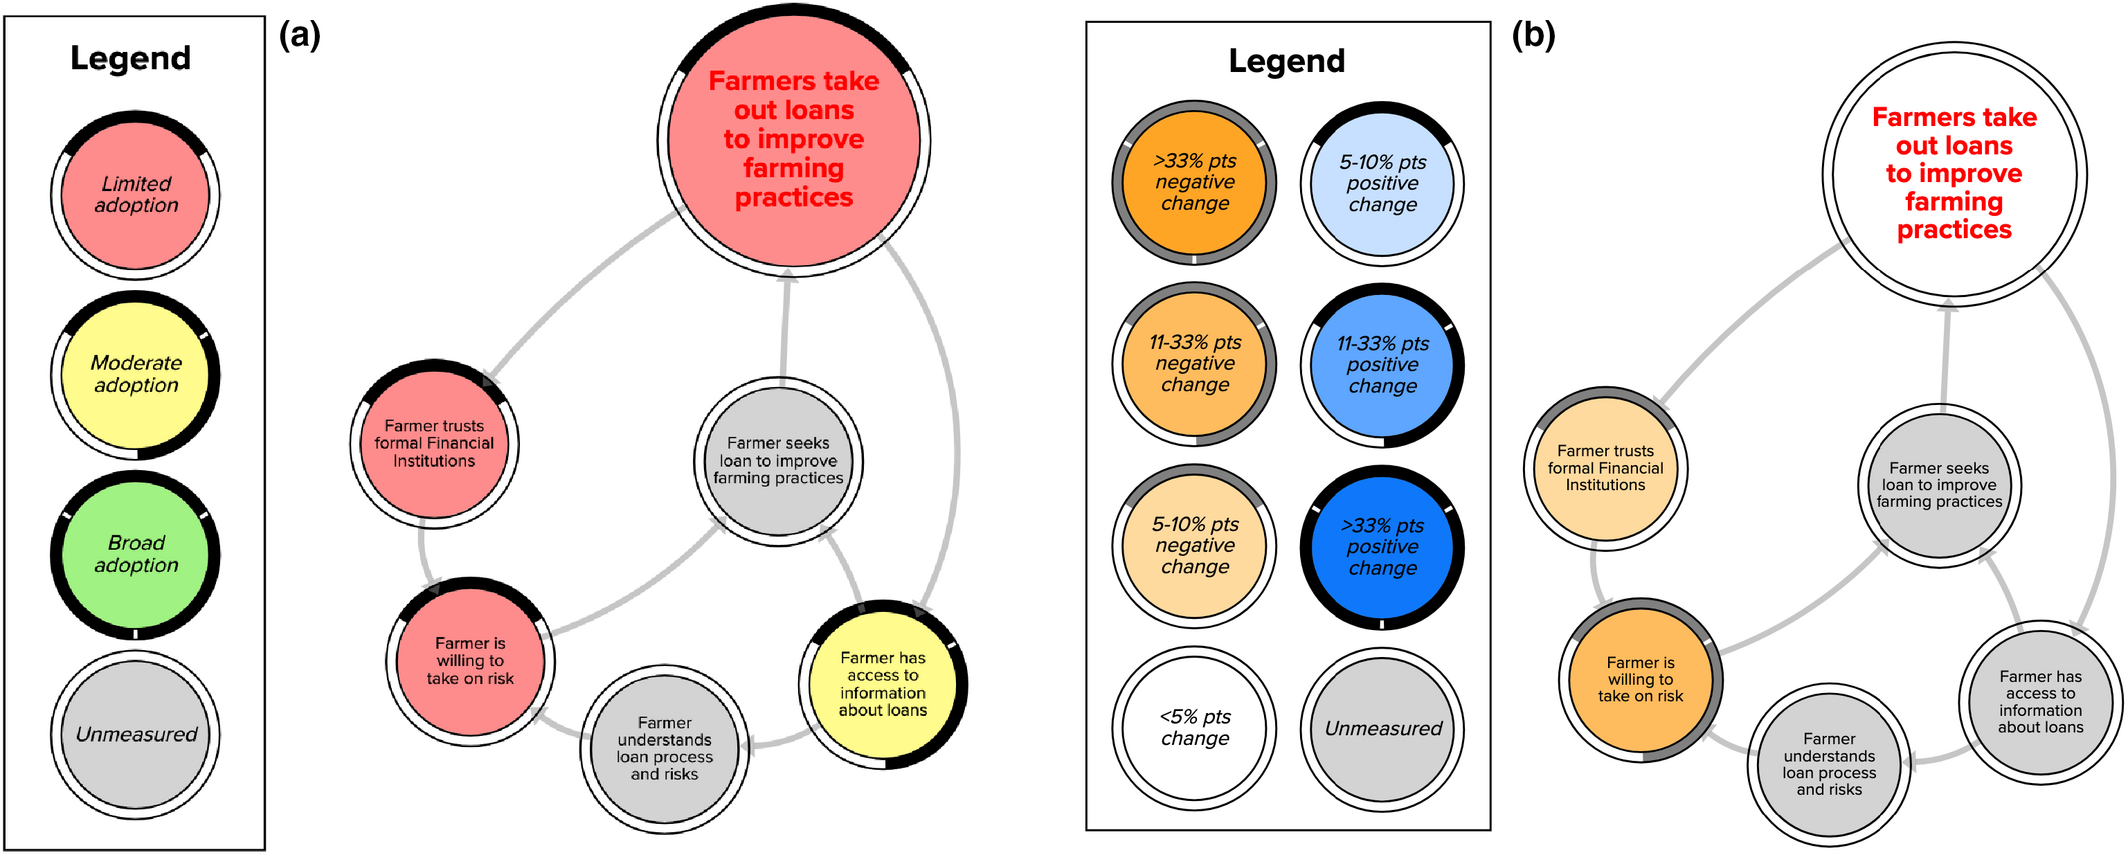
The Demand Loop Color Coded for Status (left) and Delta (right) [Color figure can be viewed at
First, each variable must be measured by selecting an “indicator” to represent it. The indicators for all the variables should be on a roughly similar scale, so that they can be easily visualized and compared. This simplifies the interpretation of a diagram that includes diverse concepts and relies on diverse data sources. To achieve a similar scale, we measure the extent of adoption, saturation, or strength of each variable: specifically, the percentage of actors who have adopted a behavior change or a relationship, or for whom a condition is true. For example, the variable Farmers take out loans to improve farming practices is measured by the indicator “percent of rural Ugandans who took out a loan for farming/fishing purposes.”
The choice of indicator is constrained by the pool of available data. Data may be found from public sources, such as surveys, or collected directly. However, in practice, development activities’ budgets often do not allow for collection of new data. Data sources should be sought that are high quality, are available for multiple points in time (so that changes in system behavior may be assessed), and are available for multiple variables in the diagram (to maximize comparability). Given the wide scope of a development system, it is unlikely that a single data source will provide sufficiently specific information on a broad range of topics, so data may need to be drawn from multiple sources, with necessarily different samples and methodologies (Campbell 2014, Fowler and Dunn 2014, Osorio‐Cortes and Jenal 2013, USAID 2014). It is therefore crucial to maintain metadata that describes the data source for each variable and how the variable was measured. It is also important to keep the same population as the “denominator” throughout the diagram, regardless of the population surveyed in each data source. For example, the extent of adoption of mobile phone usage among rural Ugandans is different from the adoption of mobile phone usage among all Ugandans. Therefore, it is best to seek data that can be disaggregated into relevant populations.
In some cases, it is not possible to find data that are an exact match with the variable or with the relevant population. In these cases, a suitable proxy should be identified. For example, if trust itself is not measured, perhaps there is a proxy measure such as frequency of contact. Care is needed, however, because a naive application of available data may be misleading. It is tricky, for instance, to measure whether farmers have access to information about loans, since the question is typically asked only of farmers who actually took out a loan, and thus gives no information about those who did not. If an appropriate proxy cannot be found in the available data, the variable should not be measured and should instead be flagged as a data gap.
As an example of the indicator selection process, consider the variable Farmers take out loans to improve farming practices. We found eight possible data sources. We selected the FSDU (2018a) survey because it was high quality, it was used for other variables on the diagram, its responses were collected at two points in time, and it offered a reasonable proxy: a question about the purpose of loans taken out in the past year, with an option to choose “farming/fishing.” Another source, FII (2017), shared many of the same characteristics but had a less useful proxy, since it did not separate investments in farming from investments in business. The remaining sources were either summary reports where the data could not be disaggregated into rural and urban populations, only asked about loans without specifying their purpose, or were not available at multiple points in time. Another very similar variable, Farmer seeks loan to improve farming practices, could not be measured because there were no data in any identified source that asked about seeking—but not necessarily receiving—a loan for farming.
Once an indicator of “adoption or saturation” has been selected for each variable, the variables must be colored on both the “status” and “delta” versions of the diagram. Any unmeasured variable is colored gray. For the “status” diagram, the green, yellow, and red colors correspond to “broad,” “moderate,” and “limited” adoption, respectively. The bounds for each category should be determined by setting optimistic and pessimistic adoption targets for each variable, or by choosing arbitrary and consistent bounds for the entire diagram. In Figure 2a, the bounds are set consistently at 33% and 66%. The colors show that few farmers take out loans (red), and that, while a moderate number of farmers have access to information about loans (yellow), few trust financial institutions (red), and few are willing to take on the risk of a loan (red). For the “delta” diagram (Figure 2b in our example), blue and orange represent increasing and decreasing trends, respectively, with darker colors corresponding to larger changes. The colors reflect the number of percentage points of change between two measured time periods. (If more than two points in time are available and relevant, the analyst must select which two to include, or make multiple diagrams.) In Figure 2b, the colors show that farmers’ loan usage is stagnant (white), trust in formal financial institutions has decreased slightly (light orange), and farmers’ willingness to take on risk has decreased significantly (dark orange) in the 5‐year time period we studied.
Validating the CLD with Practitioners
The analytical value of these CLDs depends on their accuracy; it is vital to validate the diagrams to ensure that they reflect the best available understanding of the real‐world system. Two methods have proven useful in our work. Facilitators can host a workshop where system experts and stakeholders are brought together to provide feedback on the diagram, or they can conduct individual interviews where stakeholders can examine the diagram and comment. These approaches are based on the literature on group model building, described in Section 3.2. Details and examples of our validation process are given elsewhere (USAID MSM 2020c,d).
Interpreting the CLD
The completed, validated diagram can now be interpreted to achieve the purposes outlined in Section 3.1. To do so, we focus first on the key outcome(s) and then on each major pathway and/or major loop separately, and finally consider how they interact to determine the behavior of the system as a whole.
The first purpose is to understand the system's structure and behavior. We evaluate whether a key outcome, loop, or pathway is changing in the desired or expected directions. Which variables are stagnant, and which show (un)desirable or (un)expected changes or status? If interventions have sought to encourage a particular behavior, is it already widespread (status diagram) or becoming more widespread (delta diagram)? This analysis should help analysts to see the overall behavior of the system and to focus on potentially problematic areas.
For example, consider the Demand Loop shown in Figure 2. The key outcome, Farmers take out loans to improve farming practices, is red on the status diagram (Figure 2a), indicating that the practice is not widely adopted; the delta diagram (Figure 2b) shows that it is also stagnant (white). This is undesirable given the expected benefits of farmers using loans (see Section 4.1). Looking at the broader demand loop, farmers’ trust in formal financial institutions and willingness to take on risk are both low (red status) and shrinking (orange delta); this is another area of the system with undesirable behavior.
It is also useful to identify important gaps in knowledge; that is, where data are not available to characterize the system's behavior. In our example, little is known about farmers’ understanding of the loan process and how it has changed over time (gray on both diagrams).
The second purpose is to infer the drivers of system behavior, such as barriers to or enablers of change. When undesirable or unexpected behavior is identified, it is often possible to infer the causes by examining the status of variables in or near the problematic loop or pathway. Poor or decreasing adoption of an antecedent behavior can explain why a reinforcing loop is not generating adoption as expected, or why a pathway from an intervention to an outcome is not creating the expected change. Therefore, the causes of a variable's problematic behavior can often be identified by tracing backward through the variables that point to it.
Continuing with the Demand Loop example from Figure 2, we have already identified the low and stagnant status of farmers’ loan usage as a problem. Tracing backward from this variable, farmers’ choices to seek loans are influenced by two variables: their access to information about loans, and their willingness to take on risk. The former is yellow, and therefore not likely a key barrier (yet), but the latter is red and has already been identified as a problematic area; it is likely acting as a significant barrier to broader loan usage.
The third purpose is to identify leverage points for further change. We focus on the set of barriers and enablers just discovered, since removing a barrier or reinforcing an enabler is likely to spark the desired change. Tracing back from a barrier to its causes (if any) can reveal places where intervention may help to remove the barrier. Returning to the Demand Loop example from Figure 2, and tracing back from the barrier of farmers’ unwillingness to take on risk, it appears that farmers’ knowledge about loans could enable better understanding of risk, a key point of leverage for removing this barrier.
The same three analysis steps should be repeated for each of the other key loops or pathways in the CLD. Finally, the entire system should be considered by focusing on the interaction among the analyzed loops or pathways. Examining the various barriers’ positions in key loops can help to prioritize those most likely to have the largest impact on system behavior. In many cases, multiple barriers may need to be removed at once, such as when they affect complementary reinforcing loops, and all the loops must work together to create change. The power of this system‐wide analysis is illustrated in Section 4.5, where we find that the barriers just identified in the Demand Loop override enablers from other loops to limit the desired change in the key outcome. Overall, this analysis results in an understanding of the most important barriers and enablers system wide and a small set of potential leverage points that are likely to nudge system behavior in desired directions.
The Framework in Action: Access to Finance in Uganda
Introduction and Context
As part of our work in Uganda, our team conducted an analysis on access to finance by smallholder farmers. Specifically, USAID wanted to understand why few smallholder farmers were accessing loans for agricultural investment, and how it could address any barriers through a market system development intervention. This study demonstrates how the data‐layered CLD enabled useful insights into the system's dynamics and its drivers.
One of USAID's main objectives in Uganda is to support enhanced agricultural productivity, which is in line with SDG 2 to “End hunger [and] achieve food security.” The majority of farm households are smallholders engaging in subsistence agriculture, with low levels of agricultural productivity (The World Bank 2020). Thus, market system development interventions in Uganda (and across sub‐Saharan Africa) have been focused on Target 2.3, doubling the agricultural productivity of smallholder farmers (United Nations 2020).
USAID was interested in better understanding one crucial enabler of increased agricultural productivity: access to financial services. One way to increase productivity is through the purchase and use of inputs such as improved seed or agricultural chemicals (Adjognon et al. 2017, Asfaw et al. 2012, Awotide et al. 2015, Kinuthia and Mabaya 2017). For many smallholder farmers, this represents a large investment that requires a loan or some other type of production credit. For that reason, access to financial services is seen as essential to enabling greater agricultural productivity. We recommended testing one of the key dynamic hypotheses in practice and in the literature: that credit constraints are one of the main barriers to the adoption of improved technologies and therefore to improved agricultural productivity, both across the continent (Abraham 2018, Awunyo‐Vitor et al. 2014, Mukasa et al. 2017, Simtowe et al. 2019) and in Uganda in particular (Kinuthia and Mabaya 2017, Okoboi and Barungi 2012, Shiferaw et al. 2015, World Bank Group 2020a). In other words, does a lack of access to loans prevent smallholder farmers from investing in agricultural inputs and thus improving their productivity? As we will show in the following analysis, our data‐layered CLD partially refutes this hypothesis by demonstrating that access is not the main constraint on smallholder farmers’ usage of agricultural loans; rather, there is a dynamic interplay between this and other constraints on their credit usage.
Sections 4.2 through 4.5 illustrate how we developed and interpreted the data‐layered CLD for this purpose, following the process laid out in Section 3.
Developing a CLD for Agricultural Financing
The CLD for agricultural financing grew out of a larger system map of the broader agricultural market system. This larger map was developed over 4 years of extensive stakeholder engagement, including a series of interviews and workshops from 2016 to 2019 (for more information, see Goentzel et al. 2016, USAID MSM 2017, 2019). It was used as a starting point for a more in‐depth CLD focused on access to finance for smallholder farmers—our focus in this study. The boundary or scope for this new CLD included variables that influenced farmer use of loans for agricultural investment (aligned with the purpose stated in Section 4.1). It excluded areas that are not directly related to financing, such as regulations, farming practices, supply of inputs, and access to markets, except where variables directly influenced or were influenced by financing (e.g., where loans enabled investment in better farming practices, or where regulations influenced loan interest rates).
The agricultural financing CLD was built by first determining the key outcome to focus on: Farmers take out loans to improve farming practices. Working backward, as described in Section 3.2, enabling variables were added, then consequences and loops that were inspired by the larger system map. Pathways that were relevant to practitioners’ results chains were labeled and feedback loops were identified. To capture sufficient knowledge of this fragmented system, we consulted multiple stakeholders with broad knowledge of different parts of the agricultural and financial sectors in Uganda, such as representatives of agriculture insurance companies, microfinance institutions, formal financial institutions, and NGOs, local academic experts, and experts at USAID. We also consulted a few stakeholders with detailed knowledge about narrower parts of the system, including finance providers and smallholder farmers in the Mbale district in eastern Uganda. We typically used draft versions of the diagram to structure these conversations and asked stakeholders to work through the diagram from the key outcome backward through its enablers, consequences, and loops, in the same way the diagram was built. Stakeholders also identified pathways and key feedback loops. We also consulted published literature and white papers, to ensure that our diagram was grounded in evidence as well as in experience.
The completed CLD (with the data layer) is shown in Figure 3 and described in Section 4.5. It is worth noting that our CLD includes a fairly large number of exogenous variables, which (as depicted) influence the system but are not influenced by it. This was necessary because USAID saw them as potential or actual leverage points for investment in the system and wanted to ensure that they remained in the analysis.
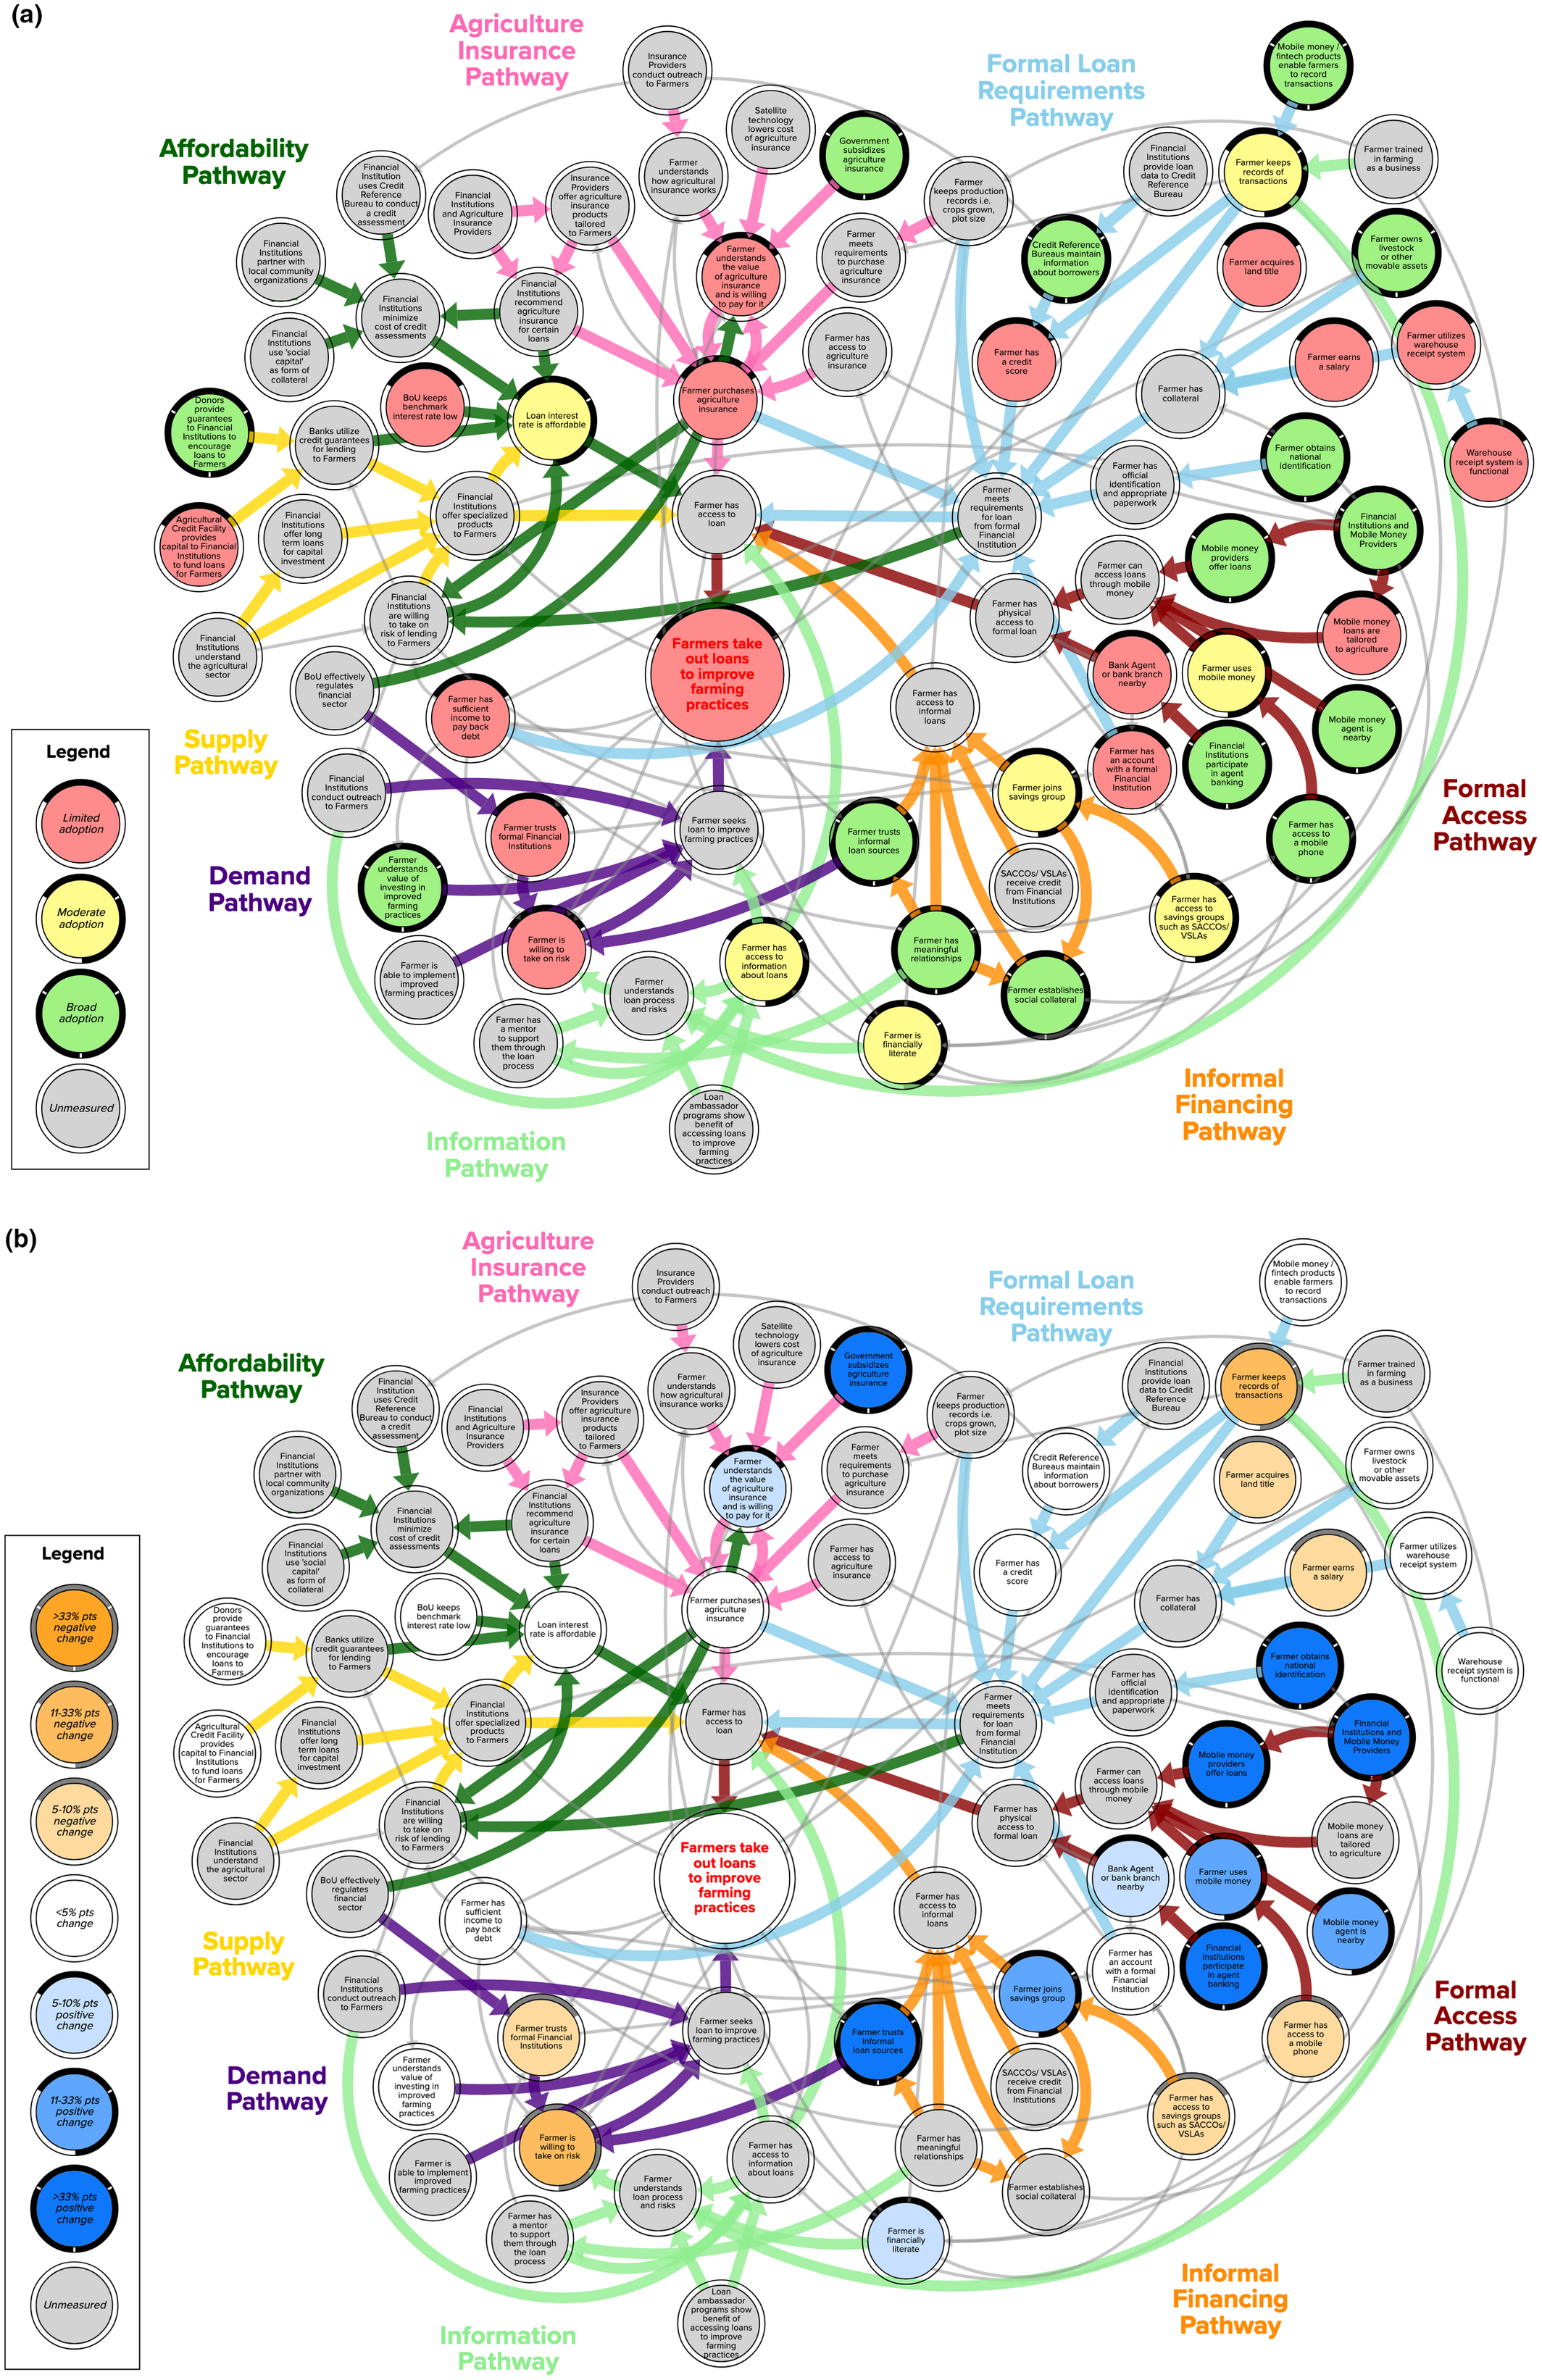
The Agricultural Financing Causal Loop Diagram with a Data Layer Showing Status in 2017–18 (3a) and Change from 2013–14 to 2017–18 (3b)
Layering Data onto the Diagram
The next step is to add a data layer to the diagram, as described in Section 3.3. In accordance with the scope of this study, we did not collect any new data. Our team canvassed the publicly available information for Uganda and identified 107 sources that contained relevant information (listed in Appendix B). These included large panel datasets, such as the Global Findex Database, FinScope, and the World Development Indicators (Demirguc‐Kunt et al. 2018, FSDU 2013, 2018a, World Bank Group 2020b), as well as journal articles, technical reports, and news articles.
We then assembled data points (potential indicators) that corresponded to the variables in the diagram. As described in Section 3.3, in developing the indicators, we sought to measure the extent of adoption, saturation, or strength of a particular variable. For some variables, multiple data sources were available. A single source was then chosen based on the set of criteria described in Section 3.3. We also sought to minimize the number of different data sources on the diagram. Given the limited scope of the available data sources, however, our final set of indicators represents a variety of sources, which are clearly described in the metadata.
Overall, our team was able to create a series of indicators for two time periods, 2017–18 and 2013–14. The majority of the data were drawn from the 2013 and 2018 FinScope surveys and the 2013 and 2017 Digital Pathways to Financial Inclusion Surveys (FII 2017, FSDU 2013, 2018a, The Bill & Melinda Gates Foundation, 2013). Both surveys were administered to approximately 3000 respondents and are weighted to represent the entire adult population of Uganda. Both datasets also specified whether respondents lived in rural or urban areas, allowing our team to calculate statistics specifically for the rural population. Of the 72 variables in the diagram, 37 for the 2017–18 snapshot 34 for the 2013–14 snapshot were measured with publicly available data.
We were unable to create indicators for 35 variables for 2017–18 and for 38 variables for 2013–14. These primarily included the behaviors or practices of formal financial institutions and insurance companies, which do not make information publicly available. This speaks to the limitations inherent in this approach and is precisely the reason why simulation models are often challenging in development. However, our analysis still enabled conclusions about the pathways and loops that did have available data, and we were able to narrow down the information that would be necessary to analyze the remaining portions of the diagram, as described in Section 4.5.
To assign the colors for the “status” and “delta” diagrams, shown in Figure 3, we chose consistent cutoffs across the entire map. Red indicates 0%–32% adoption, yellow indicates 33%–66% adoption, and green indicates 67%–100% adoption. On the ‘delta’ diagram, the cutoffs are shown in the figure's legend. Variables that could not be measured are shown in gray. The precise measured values for each variable, along with their sources, are provided in Appendix A.
Validating the Data‐Layered CLD for Agricultural Financing
As discussed in Section 3.2, our agricultural financing CLD was based on a portion of a larger market system map, which had been extensively validated with stakeholders through workshops and interviews. The validation process was repeated for the agricultural financing CLD specifically. Feedback was solicited through interviews with system stakeholders, both before and after the data layer was added, and a version was presented at a workshop in June 2019, where additional stakeholders were asked for commentary and feedback. (The characteristics of these stakeholders were described in Section 4.2). In initial validation discussions, extensive feedback was provided, but in later discussions, minimal changes were suggested. Therefore, we conclude that the diagram adequately captures stakeholders’ knowledge of the system.
We also validated our data‐layered CLD against the existing evidence about smallholder access to credit in Uganda, from both published articles and white papers. This was important as a check against a possible “echo chamber” among the stakeholders; that is, to ensure we were capturing the “true” system as closely as possible and not merely the stakeholders’ perceptions of it. Each of the factors mentioned in the literature as increasing or hindering the uptake of formal financial services in Uganda is reflected in our CLD, with the exception of gender, as our study did not look at demographic variables (Heikkila et al. 2016, Johnson and Nino‐Zarazua 2011, Kiiza and Pederson 2001, 2003, Ssonko and Nakayaga 2015). This further validates the diagram, as it is representative of both practitioner and academic knowledge.
Interpreting the Data‐Layered CLD for Agricultural Financing
The complete data‐layered CLD is shown in Figure 3, with variables colored for the status of variables in 2017–18 (Figure 3a) and the change from 2013–14 to 2017–18 (Figure 3b). The arrow colors in Figure 3 indicate pathways—linear causal paths from potential interventions to the key outcome (see Section 3.2). The key feedback loops are shown separately in Figure 4, which highlights the dynamics that likely govern the system's behavior. It is much easier to view and interact with these diagrams online, given their scale. Please visit the URLs provided in the footnote. 2
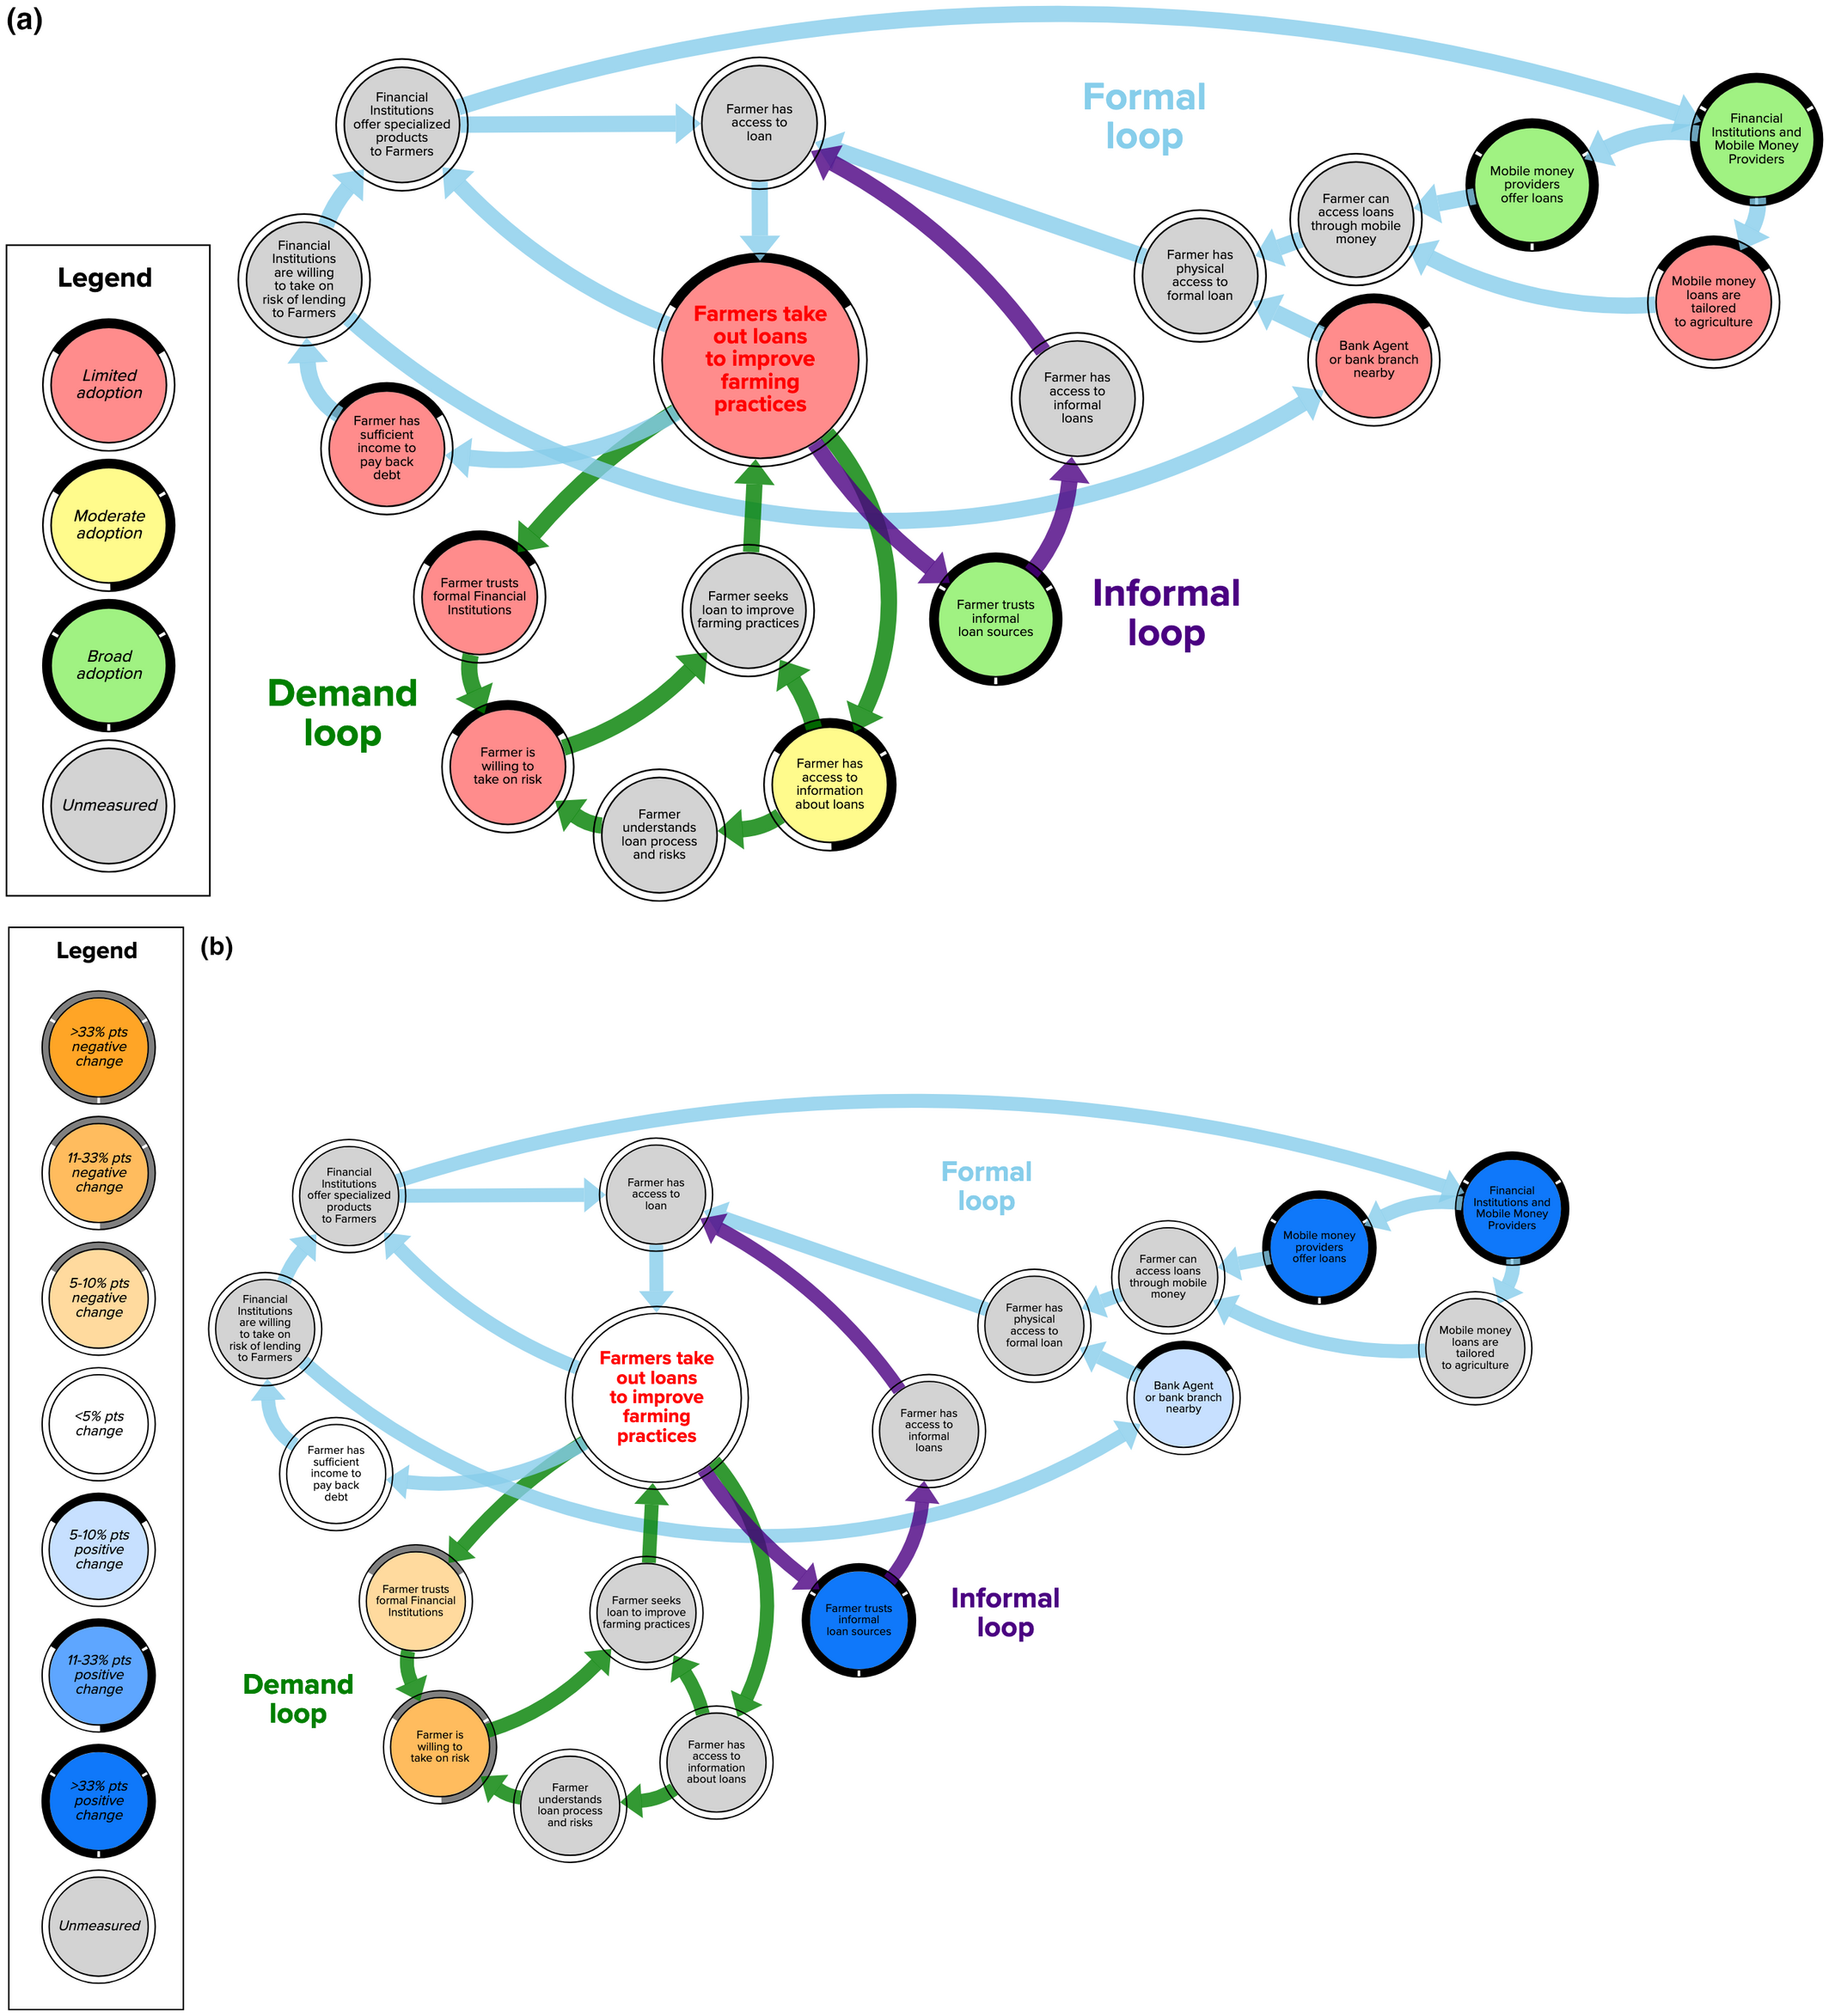
Three Central Reinforcing Feedback Loops Driving Change in the Agricultural Finance System CLD
To summarize the CLD in Figure 3, we begin with the key outcome at the center of the diagram, Farmers take out loans to improve farming practices, which is the behavior that USAID was most interested in understanding. Above and below it are the two key variables that enable farmers to take out loans for agriculture: farmers need access to loans and they need to seek the loan. The pathways (colored arrows in the CLD) collect the variables governing each of the influences on these two variables. Starting from the left, the Supply Pathway shows how government policies and bank choices affect the availability of loans with appropriate terms for farmers; the Affordability Pathway shows how interest rates are determined and affect loan affordability; the Agriculture Insurance Pathway shows how insurance purchases are influenced by government policies, farmers’ knowledge, and insurance availability and affordability; the Formal Loan Requirements Pathway shows how farmers’ access to loans is constrained by farmers’ records, paperwork, and collateral; the Formal Access and Informal Financing Pathways show how physical proximity to institutions, digital financing, and/or community relationships enable access to loans 3 ; the Information Pathway shows how farmers gain knowledge of loans; and the Demand Pathway shows how trust and risk attitudes influence farmers’ decisions to seek loans.
Figure 4 shows three key reinforcing loops, distilled from this larger diagram, that likely govern the system's behavior. These are analyzed in the following paragraphs. Analysis of the entire diagram is outside the scope of this study. As discussed in Section 3.5, we interpreted the CLD to (1) understand the system's structure and behavior; (2) infer the drivers of system behavior, such as barriers to or enablers of change; and (3) identify leverage points for further change.
Consider the key outcome: Farmers take out loans to improve farming practices. Adoption of this practice is quite low (red status in Figure 4a) and has not changed in 5 years (white delta in Figure 4b). While a 2018 survey reported that 48% of rural adults had accessed credit in the previous 12 months (FSDU 2018b), very few of those loans—fewer than 5% in both 2013–14 and 2017–18—were for agricultural purposes. The following analysis attempts to understand the reasons for this outcome and suggest ways to influence it.
First, consider the Formal loop. The first step in analyzing the CLD is to (1) understand the system's behavior. The delta diagram (Figure 4b) shows large changes (dark blue) between 2013–14 and 2017–18, particularly in expanded access to loans through mobile money. These changes meet expectations, since recent development interventions have focused on enabling access to formal loans through digital financing (Gates Foundation 2017). However, this has not translated into an increase in farmers taking out loans to improve farming practices, nor has it led to sufficient income to pay back debt, both of which show no change in our 5‐year timeframe (white delta) and very low adoption (red status). We have limited knowledge (gray on both diagrams) of the third area of the loop, which describes financial institutions’ behavior. The loop structure suggests that the expanded access to loans through mobile money should lead to broader access to loans, but it has not done so.
Therefore, we proceed to the second analysis step and (2) infer the drivers of system behavior. Tracing back from Farmer has physical access to formal loan shows two potential barriers that could block the desired expansion of loan access. First, few farmers have bank agents or bank branches nearby (red status) and this is expanding very slowly (light blue delta, up just 5 percentage points in 5 years). Second, the loan products offered by mobile money providers are not tailored to agriculture because the loan terms are too short (red status). This has not changed in 5 years (white delta); until it does, few farmers will be able to use mobile money loans for investments in agriculture. These two barriers offer a partial explanation for the low number of farmers taking out agricultural loans, but as we will see later, the other loops intersecting this variable offer additional explanations.
The third step in our analysis is to (3) identify leverage points for further change. Focusing on the behaviors and barriers just identified, a promising leverage point is to encourage financial institutions to specifically offer agricultural loan products, both through the recently expanded mobile money channel and through the growing but limited the presence of bank agents and branches. The CLD also points to an important data gap: there are little data on financial institutions’ behavior (gray on both diagrams). This could be a crucial point to understand when designing interventions to encourage financial institutions to offer new products.
The same analysis approach can be followed for each of the remaining loops. Consider the Informal loop next. (1) Trust in informal loan sources has broadened significantly since 2013–14 (dark blue delta), and is currently widespread (green status), driven by widely held relationships and the physical presence of informal institutions (the latter variables are shown in the Informal pathway in Figure 3). This trust should enable more farmers to take out agricultural loans, but it has not done so. (2) There are no apparent barriers in the informal loop, so we conclude that the barriers lie elsewhere.
Next, consider the Demand loop. This was analyzed in Section 3.5, where we concluded that (1) the widespread and growing lack of trust in formal financial institutions and reluctance to borrow (2) are barriers to farmers seeking loans. The CLD suggests (3) that increasing access to information is a potential leverage point for increasing demand for loans. Although there are a number of data gaps around information availability and channels, there is one clear opportunity. The informal financing pathway shows that most rural Ugandans have meaningful relationships in their communities (green in Figure 3a); these could be leveraged to expand trust by encouraging information sharing about experiences with formal financial institutions. USAID could also encourage or subsidize financial institutions to conduct broader outreach through farmer cooperatives, loan ambassador programs, and other initiatives.
Finally, consider the entire diagram, focusing on the three loops in Figure 4. In order to prioritize investments, it is important to know which of these are the most crucial barriers to change in the key outcome (farmers taking out agricultural loans). Our analysis so far has turned up two sets of barriers: difficulty with physical access to appropriate loan products (Formal loop) and the lack of trust in financial institutions and willingness to risk loans (Demand loop). An analysis of the broader CLD (Figure 3) suggests other possibilities, including high interest rates, lack of required documentation or collateral, and lack of knowledge as to how or where to obtain a loan. A question on the 2018 Finscope survey (FSDU 2018a) can shed some light on which of these are the most influential barriers. Rural households that had not borrowed in the previous 12 months were asked why they had not sought a loan. 4 More than 83% of respondents reported that they did not need a loan, did not want a loan, or were not interested in taking the risk. This implies that the low number of agricultural loans in Uganda is at least partly attributable to a lack of demand—investment in inputs is not seen as a “need," and/or interest in borrowing for inputs does not outweigh farmers’ risk tolerance.
This conclusion partially refutes the dynamic hypothesis we were “testing”—that access to credit is the main barrier to adoption of improved agricultural inputs. Therefore, if USAID is interested in promoting greater use of agricultural inputs, which for most farmers will require accessing credit, then expanded loan access is not sufficient. Rather, more dialogue with farmers is required to understand why demand for loans is so low, despite widespread acceptance of the value of investing in agriculture. As discussed in Section 5, this conclusion was directly enabled by the data layer, which gave USAID better insight into the dynamics of the system over time.
Discussion
The data‐layered CLD makes both practical and theoretical contributions; these are summarized in the sections below, followed by a discussion of the generalizability of the approach and limitations and future work.
A Practical Contribution to Systems Approaches for Development
The data‐layered CLD represents a practical contribution to systems approaches for development by enabling detailed analysis of a system's dynamic behavior. Section 4.5 demonstrated how our framework does so. The paragraphs below highlight several ways in which this analysis represents an important advance for development practice.
First, the data‐layered CLD helped USAID/Uganda to expand its original, narrow views of the system to a more dynamic and holistic perspective. For example, the existing evidence base is narrowly focused on constraints to credit supply and accessibility rather than on demand, which we found to be the more important barrier (see Section 4.1). The data‐layered CLD was key to expanding beyond this narrow perspective. Practitioners were able to collect and visualize disparate data from multiple parts of the system, which had never been put together before, to gather a more complete understanding of system behavior and dynamics. Previously, similar analyses helped practitioners to acknowledge the broader system and its dynamics in all of their work: the language of systems and pathways was integrated into USAID/Uganda's activity design process, resulting in, for example, a $23.7 million‐dollar activity that acknowledges the possibility of “several viable results pathways” and calls for showing “progress along the pathway[s]” and “learning if the pathway[s are] viable” (USAID 2018).
Second, the data‐layered CLD helped USAID to understand the causes of problematic behavior and to identify pre‐existing assumptions about these causes that were incorrect or outdated. For example, practitioners knew that the use of loans for agriculture was limited, but our CLD helped them to understand why this was the case: the low demand for loans (see Section 4.5). This finding demonstrated the inadequacy of a pre‐existing assumption that the key barrier to loan usage was access, rather than demand. Indeed, donor efforts have focused on digital financing as a way to broaden financial inclusion (BFA Global 2020, Gates Foundation 2017). A CLD without data might support the assumption that broadening digital financing will encourage loan usage, since access to mobile money is a key enabler of formal loan access in the Formal loop. However, the data layer makes clear that access is not the most critical barrier anymore, since rising access did not lead to rising loan usage (Figure 4b). With this understanding, donor investments can be adapted to address the evolving causes of problematic system behavior. The data layer was key to building trust in the visualization, because it helped stakeholders avoid defaulting to outdated assumptions about the system's behavioral drivers.
Third, the data‐layered CLD suggested new leverage points (see Section 4.5) that can form a basis for the design of USAID development interventions. For example, the larger system map mentioned in Section 4.2 was used at two workshops (2017, 168 participants; 2019, 48 participants) to identify and prioritize system barriers and leverage points, directly influencing USAID/Uganda's next generation of market facilitation activities (USAID MSM 2017, 2019).
Fourth, the data‐layered CLD supports monitoring system change for rapid learning and adaptation, which is an increasingly important and challenging requirement for USAID partners (Fowler and Dunn 2014, Osorio‐Cortes and Jenal 2013, USAID Learning Lab 2017). Periodic measurement as conditions evolve enables more rapid diagnosis of barriers to change, and thus more rapid adaptation of intervention designs.
These examples demonstrate how our framework makes a contribution to the practice of systems approaches to development by enabling a detailed analysis of system dynamics, and by providing insights that help USAID to target both its efforts and its budget in a way that maximizes its ability to create positive change in the system.
A Theoretical Contribution to System Dynamics in Data‐Poor and Fragmented Contexts
This study also makes a two‐part contribution to system dynamics theory. The first part of the contribution is a characterization of the gap between system dynamics theory and the needs of practitioners in a fragmented and data‐poor environment. By working closely with USAID/Uganda over an extended period on a difficult practical problem, we found that the lack of data and knowledge was a key barrier to the effective use of SD simulation in this environment. SD theory required extension to work effectively in such cases, as discussed in Section 2.2. Identifying theoretical areas that require further development is an important contribution that can be made through “management engineering” (Corbett and Van Wassenhove 1993). This approach remains essential in humanitarian aid and development, where messy problems challenge existing operations research techniques (Besiou and Van Wassenhove 2015, 2020, Galindo and Batta 2013, Starr and Van Wassenhove 2014).
The second part of our theoretical contribution is a methodological innovation, the data‐layered CLD, that meets some of the challenges of using system dynamics in data‐poor and fragmented environments. Specifically, it extends the CLD to enable limited inference of behavioral drivers without requiring simulation. The following paragraphs explain in more detail how the data‐layered CLD mitigates some key disadvantages of simulation models and CLDs, respectively, in data‐poor and fragmented environments.
First, compared with a simulation model, the data‐layered CLD requires fewer assumptions when data are missing and earns stakeholder trust with its transparency. With a data‐layered CLD, there is no need to make assumptions when data are inadequate (as a simulation model would require, leading to potentially misleading results (Coyle 2000)). The findings are more straightforward to interpret because they do not require understanding or accepting the details of simulation models and sensitivity analysis. Stakeholders are often reluctant to engage with models that are both unfamiliar and complicated (this has been the case in our 4‐year experience with USAID, in a related field (Gralla and Goentzel 2018), and in evaluation generally (Walton 2016)). In the data‐layered CLD, the evidence is laid out visually, with clear traceability to data sources that are already widely accepted. In fragmented environments, this is a particular advantage, since the data layer can more quickly earn trust from the many diverse stakeholders involved in the system. To be clear, we are not arguing that a simulation model is inferior, but rather that a data‐layered CLD is a useful substitute (or addition) when simulation is impractical for reasons of data, resources, and stakeholder interest.
Second, the data‐layered CLD mitigates two key disadvantages of a CLD without simulation: difficulty testing dynamic hypotheses, and difficulty identifying missing information (Homer and Oliva 2001). Regarding the former, the data layer enables a limited “test” of hypothesized explanations for system behavior by comparing expectations to the actual behavior captured in the data. For example, as described in Section 5.1, the assumption that physical access was the primary barrier to farmers taking out loans was supported by the CLD, but then was refuted when the data layer showed increasing access but stagnant loan usage. Testing hypothesized explanations for system behavior is particularly critical in data‐poor and fragmented environments, where stakeholders developing interventions and policies are often forced to rely on assumptions to fill gaps in their knowledge.
Regarding the latter disadvantage of a CLD alone, the data layer demonstrates visually which areas of the system are missing data (discussed briefly in Section 4.5, and shown in gray in Figures 3 and 4). Moreover, it suggests which missing data are most important—those that inhibit the “testing” of hypotheses explaining system behavior—and focuses a fragmented constituency on finding these data. For example, our analysis showed a key data gap in the behavior of financial institutions, which inhibited our ability to assess whether encouraging them to offer more agricultural loan products could broaden access to finance.
Of course, there are also disadvantages to a data‐layered CLD. Primarily, it can only “test” hypotheses against what has actually happened in the real system. A simulation would enable much broader exploration, including what‐if scenarios and evaluation of new hypothesized leverage points for change (Homer and Oliva 2001). It could also identify those missing data to which the system behavior is most sensitive. Our approach is better suited to debunking flawed hypotheses and generating new, improved dynamic hypotheses than for testing newly proposed dynamic hypotheses.
The data‐layered CLD offers a strong foundation for further analysis, particularly for testing dynamic hypotheses through other means. First, the data‐layered CLD provides a basis for creating a simulation model, which will likely gain easier acceptance once the CLD and its value are widely understood. Alternatively, it offers a path for “system‐in‐the‐loop” hypothesis testing. For example, a common approach in development practice is to “test” newly proposed leverage points by actually intervening in the system, then monitoring the results to see if they achieve the expected changes (USAID 2019). Testing hypotheses by monitoring the results of real interventions is not new (e.g., Homer and Oliva 2001), but it appears to be particularly important in data‐poor and fragmented systems, where there is less certainty that the original CLD captures all the relevant causal influences.
Generalizability and Reproducibility
Regarding generalizability, our data‐layered CLD is likely applicable throughout the development sector and beyond. It was designed for the fragmented and data‐poor environment of market system development, but this paucity of data and focus on behavior change are not exclusive to market system development nor to agriculture nor even to development (Fox and Obregón 2014, Williams and Hummelbrunner 2010). Systems approaches are needed and used in a wide variety of development sectors, including health, agriculture, and democracy and governance (Korteweg et al. 2010, USAID SPACES 2018, USAID SPACES MERL 2019), and our approach rests on the foundation of CLDs, which have proven useful in a very wide variety of systems (e.g., see Sterman 2000). Our team has used various versions of this framework to study Ugandan agricultural market subsystems beyond finance, such as seed regulation and verification, input distribution (Reinker and Gralla 2018), quality‐differentiated pricing for maize and coffee, and the impact of COVID‐19 (USAID MSM 2020a); we have also created system maps for USAID/Uganda in non‐agricultural sectors, such as household resilience, health systems, and regulatory processes. 5 Beyond Uganda, the framework has been used to study agricultural markets in conflict settings through collaboration with the International Committee of the Red Cross (ICRC) in Nigeria (Qi Hao and Srinath 2020). Further work with this framework will reveal whether and to what extent its concepts and principles are useful in these areas, but our experience suggests generalizability to many other development sectors.
Regarding reproducibility, our framework involves a series of steps that are illustrated in this study and documented in further detail elsewhere (USAID MSM 2020c,d). Like most implementations of group model building and system dynamics, it also depends on the skills of experts (Rouwette and Vennix 2006)—the facilitating researchers and the stakeholders whose “mental databases” (Forrester 1961, Rouwette and Vennix 2006) are being mined for their understanding of the system. Involving an appropriate set of stakeholders is essential, and it requires special care in a fragmented environment, but expert knowledge is a well‐established basis for CLDs and system dynamics (Homer and Oliva 2001). Our process has been replicated by many different people on our team, with different sets of stakeholders, to build many different system maps in Uganda (described in the preceding paragraph). This record suggests the process is sufficiently systematic to be reproduced by similarly skilled researchers and practitioners. Therefore, while the specific details of any given diagram may not be exactly reproducible by different teams, they should be able to utilize this approach to identify the major governing loops, find similar status from available data, and uncover similar insights.
Limitations and Future Work
There are, of course, limitations to the data‐layered CLD approach. First, the disadvantages compared to a simulation model were discussed in Section 5.2. Second, data gaps may mask important barriers to system success, but these gaps do remain transparent to the user. Third, given the limited availability of data to characterize change over time and the need for a straightforward visualization, the data‐layered CLD provides a simple view of the system's dynamics compared to simulation models that can show more complex trajectories. Future work should address these limitations and refine the approach through additional applications while probing generalizability and reproducibility.
Future work should also further explore the practical and theoretical value of the data‐layered CLD approach compared with alternatives, including simulation and a CLD alone. A formal assessment could compare their respective impact on the practice of monitoring, evaluating, and adapting development interventions (in the style of Rouwette and Vennix (2006)). To distinguish the theoretical limitations, a stylized problem could be investigated with all three approaches, under different conditions of data/knowledge scarcity, to compare the results and to assess what is learned and what is “missed” in each case: for example, what inferences can (or cannot) be drawn, how much data are sufficient to learn from each approach, and where lies the potential for obtaining misleading results, missing important dynamics, or failing to debunk flawed hypotheses. Such an investigation could shed light on when and how each approach should be deployed and on the tradeoffs between them.
Finally, the data‐layered CLD is just one solution for using system dynamics in data‐poor and fragmented environments. Researchers could build from our characterization of the challenges of this environment to develop additional solutions for use in development and beyond.
Conclusions
This study has proposed the data‐layered CLD as an extension of system dynamics approaches for use in data‐poor and fragmented environments. A data layer describes the status of or change in the variables of the CLD, and thereby enables an analysis of the system's dynamic behavior and limited inference of its behavioral drivers without simulation. This is a non‐traditional adaptation of SD principles for a specialized situation in which SD methods are appropriate for the problem but infeasible or difficult to apply.
The data‐layered CLD represents a practical contribution to system tools for development. As described in Section 2.1, the tools that are widely used in development practice do not support a detailed analysis of the system's dynamics. The data‐layered CLD helped USAID/Uganda to expand its original narrow views of the system to include important and overlooked influences; to understand the causes of problematic behavior; to debunk outdated assumptions; and to identify key data gaps and new leverage points for change. Thus, our approach enables the “blocking and tackling” required to design, monitor, and adapt interventions in a complex development system, which is critical to meeting the UNSDGs.
This study also makes a two‐part theoretical contribution, as described in Section 5.2. The first part is a characterization of the gap between system dynamics theory and the needs of practitioners in a data‐poor and fragmented environment. The second part is a methodological innovation, the data‐layered CLD, that meets some of the challenges of using system dynamics in data‐poor and fragmented environments. It strikes a balance between simulation and CLDs by using available data to infer behavioral drivers while avoiding the dangers of simulating with potentially misleading assumptions. Future work could refine this balance, explore when a data‐layered CLD is more useful than other approaches, and characterize the kinds of insights that can be gained from each.
These advances are urgently needed if we are to achieve the SDGs. On the practice side, there is a growing recognition of the importance of understanding complex systems (Campbell 2014, Elliott et al. 2008, Lim et al. 2018, USAID 2014), but nascent applications of systems approaches to the SDGs have not led to concrete actionable recommendations (Lim et al. 2018). On the theory side, system dynamics is one of several promising tools that face challenges when they are applied in development practice, such as the data‐poor and fragmented environment described in this study. Achieving the SDGs will require not only that system tools exist in the academic literature but also that they are extended to function effectively in the relevant practice environments. Our characterization of data‐poor and fragmented environments and our data‐layered CLD are, we believe, steps toward enabling this vision. We hope that by extending the tools of system dynamics, we can support both scholars and practitioners in gaining traction on the enormously complex task of achieving the SDGs.
Footnotes
Acknowledgments
This work was funded by USAID contract number AID‐OAA‐A‐12‐00095, the USAID/Uganda buy‐in to the Higher Education Solutions Network (HESN) Cooperative Agreement between the USAID Global Development Lab and the Massachusetts Institute of Technology, with George Washington University as a subawardee to MIT. The authors’ views expressed in this publication do not necessarily reflect the view of USAID or the United States Government. This study describes an approach developed by a larger research team, many of whom made major contributions. We acknowledge Tim Russell, Tristan Downing, Jillian Miles, Katie Picchione, Madison Reinker, Sophie Steinberg, and Micaela Wiseman. We also benefited from in‐depth discussions with a number of people at USAID, including Martin Fowler, Laura Gonzalez, Patricia Habu, Gaudensia Kenyangi, Maggie Linak, Regina Mackenzie, Andrew McCown, Avery Oullette, and Tatiana Pulido, along with many others at our workshops and at several conferences focused on systems thinking in development. We also wish to acknowledge all of the people we have interviewed about financial services in Uganda, too numerous to name. Thank you.
See the Acknowledgments for details on the engagement with USAID/Uganda and the larger research team.
The CLDs discussed in this study were built using Kumu, an online, open‐source system mapping platform. It enables the creation of public maps that can be explored dynamically by highlighting pathways, examining metadata, and changing views. We highly recommend visiting our online Kumu diagram rather than referring to the printed figures in this study. The status diagram for 2017–18:
In this study, formal financial institutions include commercial banks, mobile money services, microfinance institutions, and insurance companies. Informal financial institutions include savings and credit cooperatives (SACCOs), village savings and loan associations (VSLAs), and other savings groups and community lending mechanisms.
This question asked for the main reason they did not borrow, which limits our insight into the full set of influencing factors.