
Abstract
To propose minimal important differences (MID) for the Migraine-Specific Quality of Life Questionnaire version 2.1 (MSQ v2.1). To our knowledge (to date), no published MID values exist for the MSQ v2.1 in any population. Analyses were performed on data from two pivotal clinical trials of topiramate for migraine prevention (n = 916), as well as from the QualityMetric National Headache Survey (n = 1016). Analyses included both distribution- and anchor- based MID techniques as well as group- and individual-level MID values. Group-level anchor-based MID values ranged from 3.2 [Role Restrictive domain (RR)] to 7.5 [Emotional Functioning domain (EF)], setting the minimum level of appropriate MID (which can also aid with power analysis). Individual-level distribution-based MID values resulted in highly similar estimates from two large databases: median MID of 8.5 for RR, 9.2 for Role Preventive (RP) and 12.0 for EF. Finally, individual-level anchor-based MID values ranged from 5.0 (RR and RP domains) to 10.6 (EF). For group-level purposes of calculating power for future studies, an MID of 3.2, 4.6 and 7.5 for RR, RP and EF is recommended. For within-group analyses for analysing clinical trial efficacy of each patient's change with responder analyses, 5 points is necessary for RR. For RP and EF, ranges are recommended: 5.0 to 7.9 for RP and 8.0 to 10.6 for EF. These latter two domains tend to have more error in the MID, and thus a sensitivity analysis with both ends of the range should be used to confirm significant differences in responder analyses.
Keywords
Introduction
The concept of minimal important difference (MID) has received increasing attention in clinical trials research. A popular definition of MID is ‘the smallest difference in score in the domain of interest which patients perceive as beneficial and which would mandate, in the absence of troublesome side effects and excessive cost, a change in the patient's (health care) management’(1). Other investigators have modified this definition to include deterioration in quality of life (2).
MID provides interpretability in the evaluation of treatment effectiveness, linking clinical indicators with patient-reported outcomes (PROs) in health-related quality of life (HRQoL) measures. The draft Food and Drug Administration (FDA) guidance on PROs (3) has an entire section dedicated to the use of MID for PRO instruments in clinical trials. Indeed, the draft guidance proposed that responsiveness and interpretation guidelines (i.e. MID) must be demonstrated and documented for particular PRO instruments and study populations (3).
Given the importance of MID as a meaningful interpretation guideline, we have undertaken the current task of examining the MID of the Migraine-Specific Quality of Life Questionnaire (MSQ). The MSQ has been the most frequently used migraine-specific instrument in existing research on HRQoL. It has been demonstrated to have good psychometric properties in specific patient populations (4), including migraine prophylaxis patients (5).
Despite the MSQ's wide use in migraine studies, we were not able to find any research on its MID assessment. Our search yielded only one study that estimated MID for any patient-reported measure of migraine impact. The Headache Impact Test, another frequently used instrument in headache and migraine studies, was examined by Coeytaux et al. (6). According to Coeytaux, a change score of 2.3 units in Headache Impact Test reflected meaningful clinical change over time among patients with chronic daily headache.
The primary goal of the MID examination is to have clear guidelines for interpreting the meaning of differences and changes in MSQ scores. As differences of a certain magnitude may be clinically meaningless if observed for a single patient but statistically significant if observed as a mean group difference (2), we followed draft guidelines by the FDA by examining MID in the context of both mean group differences and individual change differences (i.e. responder criteria).
MID can be established with distributional and anchor-based techniques. Distribution-based methods examine the underlying distribution of results in order to garner understanding of the minimal effect needed for change. Investigators may infer effects in terms of between-person standard deviation (
The purpose of the present study was to provide estimates of MID, with the goal of facilitating the interpretability of commonly used HRQoL indicators in migraine treatment and prevention, the three domains of the MSQ v2.1: Role Restriction (RR), Role Prevention (RP) and Emotional Function (EF). Both distribution- and anchor-based techniques were employed in order to provide breadth and robustness to the MID results. Additionally, two different datasets were employed to capture both clinical trial participants (who forego medication prior to trial commencement—wash-out—and thereby have more migraine-related impairment) and participants from a longitudinal national survey on migraines (for whom no wash-out period was undertaken given that no intervention was conducted as part of the trial).
Methods
Population characteristics
The analyses were performed on two datasets: one database was the pooled data from two topiramate clinical trials (7, 8), and another database was the QualityMetric National Headache Survey (NHS) (9). The two trials of topiramate for migraine prevention were randomized, double-blind, placebo-controlled clinical trials of identical design, one conducted in the USA and Canada (7) and the other in the US only (8). This combined sample of 916 patients were aged 12–65 years, had a minimum 6-month history of migraine (International Headache Society criteria) and experienced 3–12 migraines per month but no more than 15 headache days a month during the 28-day prospective baseline period. Patients were randomized to placebo or topiramate 50, 100 or 200 mg/day, and titrated over 8 weeks. The maintenance therapy continued for 18 weeks.
The QualityMetric NHS data comprised responses from 1016 adults residing in the contiguous 48 states of the USA (9). Participants were required to: be 18–65 years old, inclusive; reside permanently in the household called; have had a headache at least once in the past 4 weeks (prior to interview); be able to converse in English; and be physically and mentally competent to participate in the interview. Phone interviews were conducted by an independent research organization with trained telephone operators. It should be noted that these participants were not subjected to any particular intervention as a part of the QualityMetric NHS study.
Statistical analyses
Missing data handling
To minimize the impact of missing data on results and power, a Bayesian multivariate imputation method was used to impute values for any missing value (10, 11). Proper handling of missing data in MID studies can provide greater accuracy in distributional-based MID analyses (as Bayesian multivariate imputation will provide efficient and accurate standard errors compared with techniques such as casewise deletion or mean replacement) and allows for analysis of all observed data without overinflating significance in relationship for anchor-based analyses (given proper controls of significance calculations with Bayesian multivariate imputation) (10).
MID calculations: distribution techniques
Three analyses were used to examine the distribution-based MID of the MSQ. First, between-patient variability was assessed on each of the MSQ domains at baseline, based on
MID calculations: anchor-based techniques
Unlike many medical conditions, migraine has no gold standard for objective and observable clinical measures. Nevertheless, the anchors used in this study are similar to those that have been accepted in many clinical trials as criteria in determining MID (1, 6, 15, 17–23)—these anchors represent the decrease in frequency of an undesirable event (i.e. migraine attack) or the patient's perception that change has occurred, as measured by another scale.
Examination of MID for a migraine instrument should involve the examination of various anchors in order to determine (i) which anchors are related to changes in the MSQ scale, and (ii) the range of plausible MID values from the various related anchors. Ideally, correlations should be both significant and have an effect size near the medium range (which is at r = 0.3) (13). The within-group analyses involved examination between which MSQ change scores were related to no change on the anchor and which were related to minimal change, similar to the process used by Juniper and colleagues (21). To conduct these analyses, we used logistic regression to examine the relationship between each of the three MSQ subscales and the anchors. Regression coefficients were used to derive odds ratios (ORs) of each anchor as a function of 1-, 2-, 5- and 10-point baseline MSQ scale score differences (24). The critical assumption of linearity for such an analysis was evaluated by inspecting separate regression coefficients for each 5-point increment of the MSQ scale scores and by performing the linear-by-linear association test for linearity (25). The key for interpreting MID with the ORs is how many points the MSQ subscales need to change to move a minimal but important difference away from an OR of 1.0. Moving about 25% above the OR (or an OR of 1.25) is often considered to be a meaningful minimal movement (26).
Average monthly migraine rate
This anchor came from the topiramate clinical trials data (7, 8). The average monthly migraine rate was calculated by dividing the total number of migraine periods for each phase (e.g. baseline, or double-blind phase) by the total duration (in days) for that particular phase, times 28 days. The mean average monthly migraine rate was 4.3 (ranging from 0 to 15.4) for the baseline, and 2.8 (ranging from 0 to 21.5) for the double-blind phase. For the anchors in the topiramate databases, no universally agreed upon cut-off for minimally important reduction in frequency exists in the change in monthly migraine rate or number of severe migraines per month. Some have argued that a 30% reduction is sufficient, whereas others have suggested that no less than 50% reduction should be obtained. Therefore, we examined patient-level MID analysis with 30, 40 and 50% reduction on each of these scales.
Migraine status
Also based on the QualityMetric data, this dichotomous variable asked participants to indicate if they had ever been told by a doctor that the participant suffers from migraine headaches. A score of 1 was given for those answering yes, whereas a score of 0 was given for those answering no.
Four-grade migraine disability
The four-stage migraine disability anchor came from the QualityMetric data. This disability score was developed by Stewart et al. (27) and is a four-grade severity scale from the Migraine Disability Assessment (MIDAS) questionnaire. Based on the MIDAS score, patients were categorized into one of the following four categories: MIDAS 0–5 was minimal or infrequent disability, MIDAS 6–10 was mild or infrequent disability, MIDAS 11–20 was moderate disability, and MIDAS 21 or more was severe disability. Because 80% of the respondents in the QualityMetric data were categorized as a disability of 1 (minimal or infrequent disability), we combined the other three disability categories (2, 3 and 4) in our analysis, yielding a dichotomous variable.
Migraine frequency improvement
Also based on the QualityMetric data, this dichotomous variable asked participants to indicate if they were having more or less headaches compared with 3 months ago. A score of 1 was given for those having about the same or fewer headaches, whereas a score of 0 was given if they reported having more headaches compared with 3 months ago.
Migraine intensity improvement
Based on the QualityMetric data, this dichotomous variable asked participants if their headaches bothered them more now compared with 3 months ago. A score of 1 was given for those with the same or less bother currently, whereas a score of 0 was given if they were more bothered compared with 3 months ago.
Migraine impact improvement
A few different indicators were used to measure how reductions in migraine impact one's life. Specifically, we looked at response differences on the following questions: limited in everyday physical activities, feeling frustrated or irritable because of headaches, or limited in daily activities (including housework, work and/or social activities). Participants were also asked to assess their overall quality of life (single item). All questions were asked based on their current state. However, scores for the current study were calculated as a 1 for those with the same or less negative impact and a score of 0 was given if they had greater negative impact compared with their scores 3 months ago.
Results
Distribution-based analyses
For group-level data in the topiramate clinical trial datasets, the
Next, we examined the
Finally, within-patient differences were examined. The effect sizes for change score differences by treatment group are presented in Table 1. For RR, effect sizes ranged from 0.19 (for 50 mg) to 0.44 (for 100 mg). For RP, effect sizes ranged from 0.23 (for 50 mg) to 0.35 (for 100 mg). Finally, for EF effect sizes ranged from 0.05 (for 50 mg) to 0.30 (for 100 mg). These resulted in between-group MIDs of 3.2, 4.6 and 7.5 for RR, RP and EF, respectively.
Between-group difference in mean Migraine-Specific Quality of Life Questionnaire (MSQ) change scores from baseline to end-point (day 183) by pair-wise comparison between treatment groups
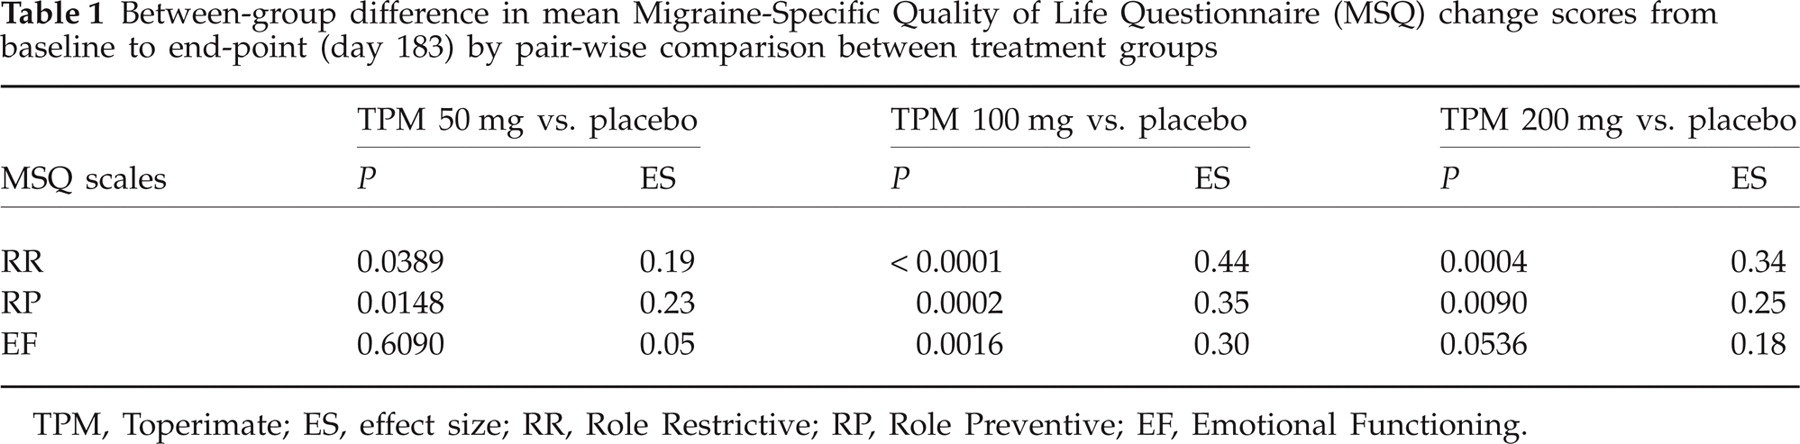
TPM, Toperimate; ES, effect size; RR, Role Restrictive; RP, Role Preventive; EF, Emotional Functioning.
Anchor-based approach
Table 2 provides correlations between the RR, RP and EF scales of the MSQ. Correlations with the anchors range from small to medium effects, with most correlations achieving significance (partially because of the large power from the topiramate trials).
Pearson correlations and descriptive statistics for all anchors
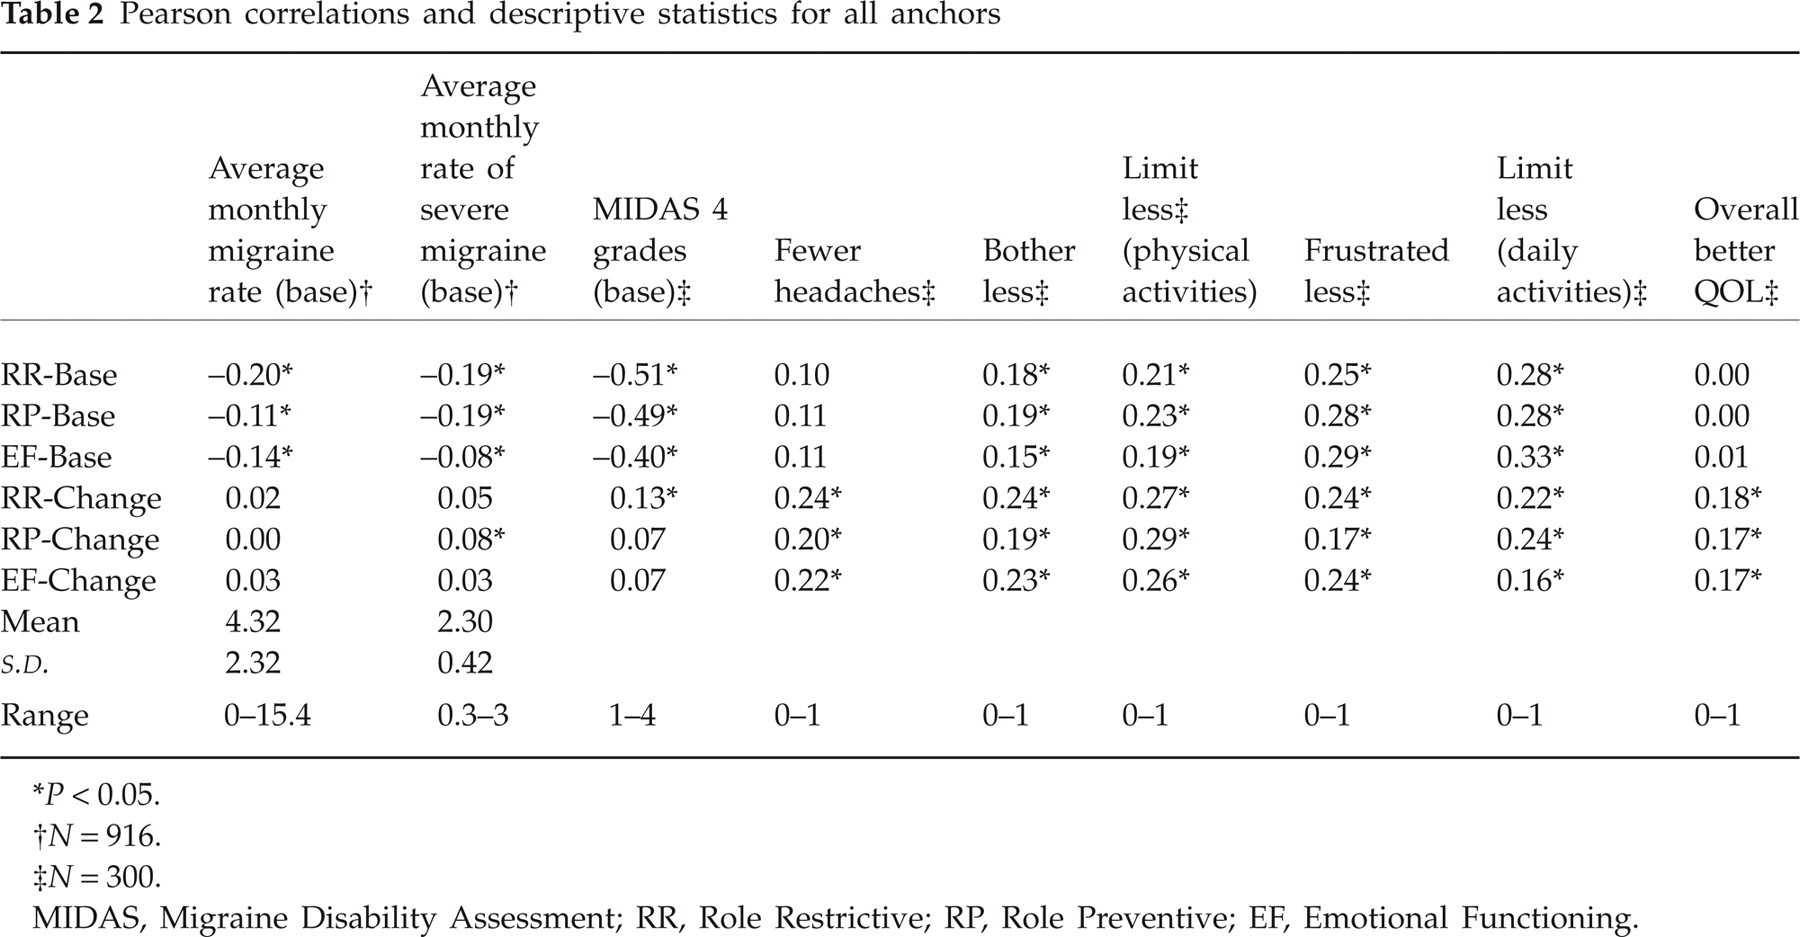
P < 0.05.
N = 916.
N = 300.
MIDAS, Migraine Disability Assessment; RR, Role Restrictive; RP, Role Preventive; EF, Emotional Functioning.
Because the MSQ used in the QualityMetric data was based on a truncated 5-point MSQ ordinal scale for each item (29), we examined how truncating the MSQ data from the topiramate trials to a 5-point scale would influence the anchor-based interpretations in order to give and adjustment for the use of the QualityMetric MSQ data. Results of these comparisons showed negligible differences.
Analysis of the relationships between the nine migraine frequency, intensity and impact improvement anchors and change scores with the MSQ subscales indicated that all three of the MSQ subscale change scores were significantly associated with two of the anchors: having fewer headaches compared with 3 months ago, and less bothered by headaches compared with 3 months ago. On the other four anchors, changes in EF were significantly related to less limitation in everyday physical activities, and RR and RP changes were significantly related to changes in overall QoL improvement.
Table 3 presents the ORs for migraine status and migraine disability based on different change scores on MSQ, controlling for age and gender. Compared with our criterion of an OR of at least 1.25, a 5-point difference on RR and RP and an 8-point difference on EF are recommended.
ORs for anchors based on different change scores for Migraine-Specific Quality of Life Questionnaire subscales

An odds ratio (OR) of 1.25 was used to delineated the minimum value for a meaningful OR.
RR, Role Restrictive; RP, Role Preventive; EF, Emotional Functioning.
Finally, for changes on the anchors from the topiramate clinical trial databases, between- and within-group MIDs were used to examine the amount of change associated with a single
Discussion
Results from the current study are summarized in Table 4. Between-group MIDs ranged from 3.2 (RR) to 7.5 (EF)—lower than the within-group MIDs, as is typically the case (6). Distribution-based within-group MIDs were larger for the ½
MID summary of results, segregated by distribution- and anchor-based approaches, as well as by group and individual approaches

MID, minimal important difference; RR, Role Restrictive; RP, Role Preventive; EF, Emotional Functioning; BSW, Better–Same–Worse analysis.
Anchor-based approaches for the within-group designs were rather consistent between the two techniques employed. For RR, a 5-point difference is suggested by both logistic regression and BSW analyses. RP obtained MIDs of 5 and 8 for logistic and BSW analyses, respectively. Although there is no compelling rationale to select one analysis over the other, the difference is expected: clinical trial data tend to show larger necessary MIDs than general population data given the large gains frequently experienced during a clinical trial because of careful inclusion and exclusion criteria. For now, it may be best to examine both of these values with clinical trial data, and some research in this area suggests that very little difference should be found when examining the efficacy of clinical trial data using small differences on the MID. Finally, EF was found to have an 8- and 10-point MID using logistic regression and BSW analyses, respectively. Again, these differences are in the expected direction, and examining both values may be prudent for the time being.
No prior studies have examined the MID for the MSQ in any migraine population, either undergoing acute treatment or treated with prophylaxis. Therefore, the results of this study are novel. Although MIDs have been derived for another migraine instrument (6) and for other pain instruments (e.g. (31, 32)), MIDs are quite specific to the measure for which they were derived (2) and comparisons across instruments are not advised. Results from this study will be helpful in guiding future studies: the within-group MIDs can be used to examine a significant treatment effect by conducting a responder analysis (33), and between-group differences can help guide power analyses for future studies (6).
Conclusions
The results of various distribution- and anchor-based approaches suggest the following MIDs are appropriate. For group-level purposes of calculating power for future studies, an MID of 3.2, 4.6 and 7.5 for RR, RP and EF, respectively, is recommended. For within-group responder analyses, MID should be 5 points for RR, between 5 and 8 points for RP, and between 8 and 10 points for EF.
Acknowledgement
This work was supported by Ortho-McNeil Janssen Scientific Affairs, LLC.