
Abstract
Migraine pathophysiology possibly involves deficient mitochondrial energy reserve and diminished cortical habituation. Using functional magnetic resonance spectroscopic imaging (fMRSI), we studied cortical lactate changes during prolonged visual stimulation to search for different pathophysiological mechanisms in clinically distinct subgroups of migraine with aura. Eleven healthy volunteers (HV) and 10 migraine patients were investigated interictally: five with visual aura (MA) and five with visual symptoms and at least one of the following: paraesthe-sia, paresis or dysphasia (MAplus). Using MRSI (Philips, 1.5 T) 1H-spectra were repeatedly obtained from a 25 mm-thick slice covering visual and non-visual cortex, with the first and fifth measurements in darkness and the second to fourth with 8-Hz checkerboard stimulation. In MAplus lactate increased only during stimulation, only in visual cortex; in MA resting lactate was high in visual cortex, without further increase during stimulation. This is compatible with an abnormal metabolic strain during stimulation in MAplus, possibly due to dishabituation, and a predominant mitochondrial dysfunction in MA.
Introduction
Interictal pathophysiological studies in migraine have disclosed two principal functional brain abnormalities: abnormal cortical information processing and decreased mitochondrial energy reserve. Sensory information processing in the cerebral cortex as studied in migraineurs between attacks by evoked potentials is characterized by a decreased habituation and a strong intensity dependence (1–3). Studies on metabolic aspects of migraine included 31P-magnetic resonance (MR) spectroscopy (4–6) and 1H-MR spectroscopy without visual stimulation (7).
According to the hypothesis of Schoenen (8, 9), migraine is a disorder characterized by episodic occurrence of attacks, and might be caused by the concurrence of two pathophysiological components: excessive cortical activation due to lack of habituation during repetitive stimulation as well as decreased brain mitochondrial energy reserve. These mechanisms may induce biochemical shifts, leading, possibly via cortical spreading depression (10), to migraine attacks by means of activation of the trigeminovascular system (11).
This hypothesis was based on results from two different methodologies: abnormal cortical information processing was studied with electrophysiology, and metabolic studies were done with MR spectroscopy using single voxel techniques without sensory stimulation.
Most of the above-mentioned electrophysiological studies found small differences between migraine without and with aura (1, 2), i.e. the subgroups of migraine that are traditionally differentiated from each other. Only recently, subgroups of common forms of migraine with aura have been studied pathophysiologically. Ambrosini et al. (12) described more pronounced subclinical abnormalities in neuromuscular transmission in migraine patients with complex auras compared with patients with visual auras only. Furthermore, such abnormalities were found to be positively correlated with subclinical cerebellar abnormalities (cf (13)) in different subgroups of migraineurs, supporting the notion of a more pronounced shared pathophysiology in patients experiencing complex auras (14). In the present study we used for the first time functional magnetic resonance spectroscopic imaging (fMRSI) in migraine, to study with one method and in one measurement a possible link between sustained visual stimulation and metabolism. Similarly to previous studies (15, 16) we obtained metabolic information simultaneously in multiple voxels and therefore with increased spatial resolution as well as before, during and after stimulation, thus obtaining additionally dynamic (temporal) information. We investigated two subgroups of migraine with aura: patients experiencing pure visual symptoms, and a second group suffering from complex auras, i.e. from visual symptoms and at least one of the following: sensory disturbances, dysphasia and/or paresis. The aim of this study was to search for metabolic consequences of prolonged visual stimulation and for pathophysiological differences in the above-described clinically distinct subgroups of migraine with aura.
Methods
Participants
Eleven healthy volunteers (HV) without any personal or family history of migraine and 10 migraine patients, all of whom were diagnosed according to the criteria of the International Headache Society (17) as migraine with typical aura (code 1.2.1), participated in this study. Five patients had migraine with pure visual aura (MA) and two of these MA patients experienced on rare occasions an aura exceeding 1 h, therefore fulfilling the criteria for migraine with prolonged aura. Five other patients had visual aura associated with at least one of the following: paraesthesia, dysphasia or paresis (MAplus). The characteristics of all participants are summarized in Table 1.
Characteristics of participants
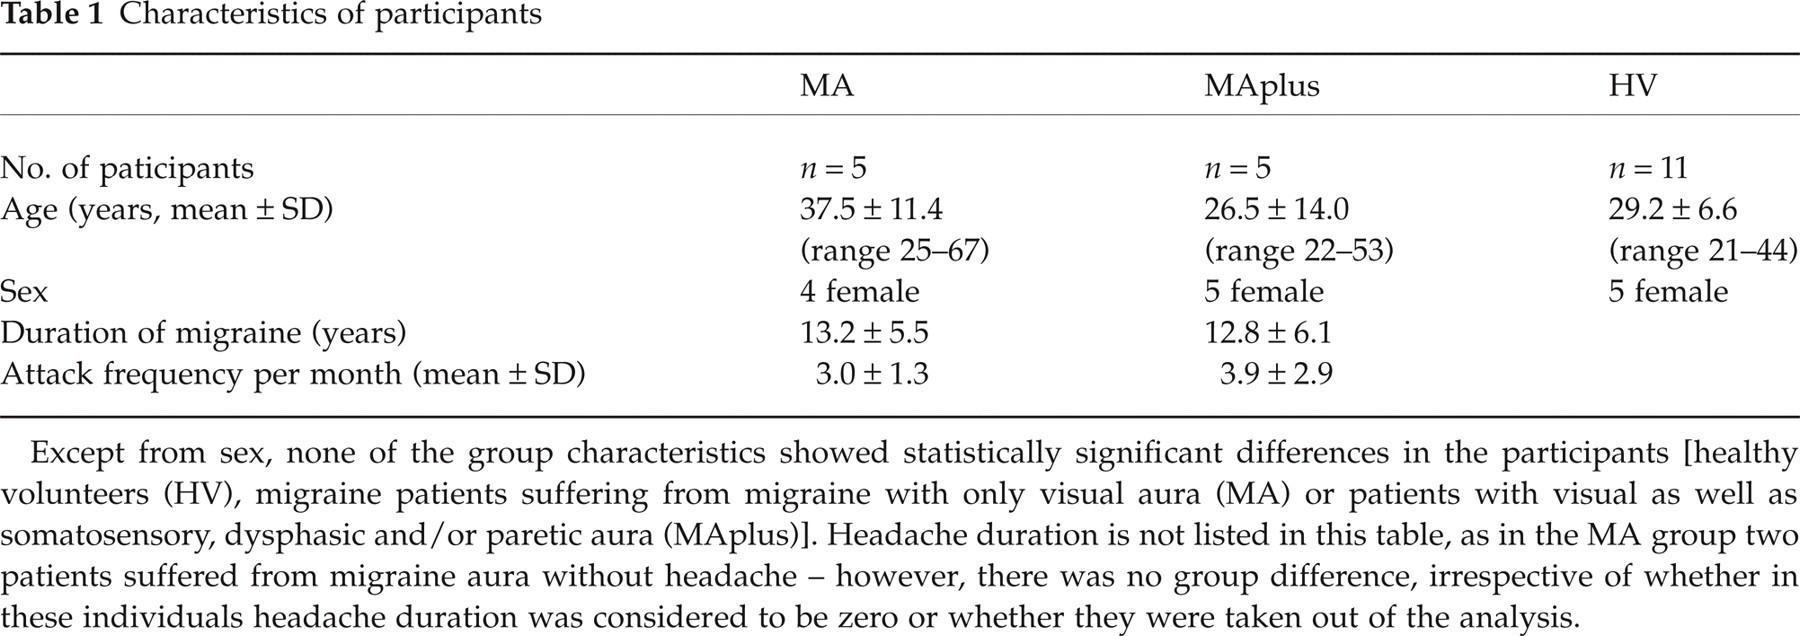
Except from sex, none of the group characteristics showed statistically significant differences in the participants [healthy volunteers (HV), migraine patients suffering from migraine with only visual aura (MA) or patients with visual as well as somatosensory, dysphasic and/or paretic aura (MAplus)]. Headache duration is not listed in this table, as in the MA group two patients suffered from migraine aura without headache – however, there was no group difference, irrespective of whether in these individuals headache duration was considered to be zero or whether they were taken out of the analysis.
All experiments in patients were performed at a temporal distance of at least 3 days from a migraine attack (a possible attack after the measurement was checked by telephone interview). All participants reported feeling relaxed during the measurements, and none of them experienced discomfort or fear. They also did not report any symptoms of hyperventilation. The experiments comply with the standards in force in Switzerland and all participants gave written informed consent prior to participating in the study.
fMRSI
Proton magnetic resonance spectroscopic imaging (MRSI) was used to asses the concentrations of the metabolites lactate (Lac), N-acetylaspartate (NAA), creatine and phosphocreatine (Cre) and choline containing compounds (Cho) in vivo. All MR experiments were performed on a 1.5-T whole body scanner (Philips Gyroscan ACS-NT), using a standard quadrature head-coil. Proton spectra were obtained from a 25 mm-thick slice placed along the calcarine fissure as shown in Fig. 1, covering visual and non-visual cortical regions. Outer volume suppression pulses, shown in Fig. 1 as grey slabs, were applied to suppress the signal from subcutaneous fat. One exclusion criterion was a linewidth of the NAA peak of > 15 Hz. Further criteria to exclude spectra were a distorted baseline or lipid contamination.

Sagittal and transversal scout images with planned magnetic resonance spectroscopic imaging (MRSI) volume of interest. Proton spectra were obtained from a 25 mm-thick slice along the calcarine fissure, covering visual and non-visual regions. The slice was divided into an 8 × 8 MRSI matrix. The grey slabs indicate the saturation slabs needed for the suppression of subcutaneous fat signal.
The slice with a field of view (FOV) of 150 × 150 mm2 was divided into an 8 × 8 MRSI matrix giving a nominal voxel size of 8.8 ml. Spectra were acquired over a bandwidth of 750 Hz (512 samples), yielding a spectral resolution of 1.5 Hz. The echo time was chosen to be 288 ms and the repetition time was set to 1500 ms. With these parameters, the acquisition of a 8 × 8 MRSI dataset takes less than 2 min, including a low resolution B0 measurement to enable a correction for field inhomogeneities during the postprocessing. Each MRSI measurement was averaged four times to achieve an increased signal to noise ratio, resulting in an acquisition time of 7 min.
In order to obtain temporal information on the metabolic dynamics, the technique of fMRSI was applied. In this technique each MRSI experiment is repeated consecutively over time, keeping all measurement parameters constant, while a functional paradigm such as a visual stimulus may be applied. For this study the MRSI measurement was repeated five times consecutively, resulting in an fMRSI experiment with a total duration of 35 min.
Visual stimulation
Visual stimulation was achieved by the projection of a blue and yellow checkerboard, reversing at 8 Hz and viewed through a mirror fixed on the head-coil with a viewing angle of 35 × 45°. The blue and yellow pattern was chosen based on functional imaging studies (18) as a kind of stimulation that leads to activation of relatively large cortical areas. The control state was complete darkness with the participants having their eyes closed.
The MRSI measurement was repeated five times, with the first and fifth measurement as control in darkness. During the second to fourth measurement, the subjects were instructed to look at a fixation point in the centre of the reversing checkerboard.
Postprocessing and analysis of the MRSI data
For each subject an individual mask of MRSI voxels included into the analysis was defined by using the linewidth of the NAA peak as criterion (see above). In this fashion all voxels containing only noise signal or strong fat signal contamination, covering the Lac and NAA peaks, were excluded. Furthermore, a neuroradiologist (S.S.K.) blinded to the data and using the anatomical T1-weighted images of the brain slices with the overlaid MRSI grid as basis, was asked to divide all measured voxels into three groups: those containing visual cortex (‘visual’), those containing both non-visual and visual cortices, and those not containing any visual cortex (‘non-visual’). The grouping was used to compare the metabolic behaviour of the visual cortices with non-visual cortical regions. Only those voxels that, according to above described anatomical criteria, were considered ‘visual’ or ‘non-visual’ cortices, were analysed.
Postprocessing of the MRSI spectra included a cosine filter in spatial k-space, an exponential filter of the time signal, B0 correction, a polynomial baseline correction and a manual phase correction. Reduction of the residual water signal was achieved by using the digital shift algorithm (19). All postprocessing parameters were kept constant for the five MRSI datasets of one functional measurement.
To determine the metabolite levels of Lac, NAA, Cre and Cho in each voxel, the absolute amplitudes of the signal were summed over an interval of 23 Hz (= 0.36 p.p.m.) in the case of NAA and 15 Hz (= 0.22 p.p.m.) otherwise, centred at the corresponding spectral peak. The peak-free interval between 0 and 0.22 p.p.m. was integrated also, giving an estimate of the fluctuations of a ‘noise interval’ over time, simply called ‘noise’ in the following.
During visual stimulation the NAA concentration is reported to stay constant (20, 21), allowing the use of NAA as internal reference. Therefore the time course of the Lac/NAA ratio over the five measurements was determined for all voxels contained in the mask, allowing interregional and interindividual comparisons of the lactate level.
As only the lactate concentration is expected to change due to visual stimulation, the relative change of Lac/NAA over time is compared with the relative change of other metabolite ratios in the results. As the lactate level is very low, it is important to compare its change with the absolute signal changes in the noise interval. In this case only the absolute change is of interest.
A conservative error estimation of the Lac/NAA levels in the time courses was achieved by taking into account the standard deviation of the real signal in the ‘noise interval’, as well as the relative standard deviation of the Cre level over the five time measurements. One approach determines the error due to noise fluctuations, while the other approach includes the measurement errors of a constant peak. Error bars for metabolite ratios, relative and absolute changes were calculated with standard error propagation.
Difference images were generated for data visualization. For each subject and each voxel the Lac/NAA ratio of the first measurement in darkness was taken as baseline value. In the following measurements, areas where the absolute difference between the Lac/NAA value and the baseline value was above the threshold of 5 were highlighted and overlaid on the anatomical image of the MRSI slice (for further description see caption of Fig. 2). This way regions with initially high lactate levels, e.g. regions containing CSF, are not displayed. Displaying a relative change would also highlight areas with no lactate but high noise variations. However, using absolute differences of the metabolite ratios, only regions with a clear change of Lac/NAA over time are highlighted.

‘Difference images’, in which only areas with an absolute change of lactate/N-acetylaspartate (Lac/NAA) with respect to the first measurement in darkness > 5 are highlighted, i.e. with (Lac/NAA)I − (Lac/NAA)0 > 5 where (Lac/NAA)0 stands for the baseline value and the index i counts the five magnetic resonance spectroscopic imaging (MRSI) measurements. The threshold was kept constant over all MRSI measurements and all subjects to allow interindividual comparison. A difference map was generated for each MRSI measurement, interpolated to a 256 × 256 matrix and overlaid on the anatomical image of the MRSI slice. Finally the five images are displayed next to each other, representing changes of Lac/NAA over time. Using absolute difference as encoding criterion, only regions with a clear change of Lac/NAA over time are visualized. A typical example of a healthy volunteer (a) shows an increase in Lac/NAA during the beginning of stimulation. Migraine patients (MAplus) (b) typically showed a prolonged increase in Lac/NAA, lasting during the whole stimulation period and even beyond.
Statistical analysis
To compare metabolites and their ratios, we applied the analysis of variance (
Results
Methodological experiments, including several control experiments, showed the feasibility of using fMRSI to study lactate as a possible marker of functional metabolic abnormalities in migraine.
In brief, the quality of the in vivo spectra was sufficiently high to detect even small lactate peaks, e.g. in an HV (Fig. 3). Using phantom measurements, stability of NAA and lactate could be demonstrated with a change during an experimental period of < 10% in these two substances. In a migraine patient a control measurement without stimulation was performed, demonstrating NAA changes of < 10% and lactate changes of < 40%. Noise levels, measured in all participants, were low and stable throughout stimulation.

Typical example for results from a healthy volunteer, male, 31 years old. (a) Reference image showing the magnetic resonance spectroscopic imaging (MRSI) grid with a highlighted voxel. (b) Spectrum originating from this voxel for the five MRSI measurements over time, from bottom to top, with the middle three measurements acquired during visual stimulation. From left to right, the borders of integration are depicted for choline, creatine, N-acetylaspartate (NAA), lactate (Lac) and the noise interval. (c) The two plots show the relative and absolute change of Lac/NAA over time with respect to the first measurement in darkness. In the plot with the relative change, triangles denote Lac/NAA, whereas squares indicate creatine/NAA. The absolute time course compares Lac/NAA with the noise flutuations: Triangles again denote Lac/NAA and diamonds stand for noise/NAA, with the noise measured between 0 and 0.22 p.p.m. The calculation of the error bars is described in Methods.
Healthy volunteers (Table 2, Figs 2, 3 and 4)
In the resting state, in only very few voxels was there detectable lactate in HVs without any difference between visual and non-visual cortical areas. During stimulation, lactate peaks became apparent in certain voxels in nine out of 11 individuals. They were located mostly, but not exclusively, in the visual cortex and the time course of the lactate to NAA ratio (Lac/NAA) correlated with the stimulation paradigm (Fig. 2a). However, the correlation was not always present, probably due to the low levels of detected lactate. Therefore, in some participants, for example, lactate peaks could appear during the first and third stimulation period or they could rise initially with a subsequent decline to baseline. In most voxels, however, lactate did not rise at all during stimulation, as shown in Fig. 3. Therefore, in HVs, the statistical analysis of the time course of the Lac/NAA in visual as well as non-visual cortical regions did not reveal any significant change during or after stimulation (Fig. 4).

Lactate to N-acetylaspartate ratio (Lac/NAA) changes in the three groups shown as absolute difference to baseline (= before stimulation). Mean values of the participants and SD are shown. Visual stimulation occurs during second to fourth condition (dashed box); the different conditions are indicated on the abscissa: bl bef = baseline before, stim 1–3 = visual stimulation for 7 min each, bl after = baseline after cessation of stimulation. Note that while in healthy volunteers (HV) and migraine with visual aura (MA) there is no change in Lac/NAA during sustained visual stimulation, in MAplus Lac/NAA rises, only in the visual cortex, during stimulation and decreases to baseline values, illustrating the
Lactate to N-acetylaspartate (Lac/NAA) ratios before, during and after visual stimulation (mean ± SD)

Lactate to N-acetylaspartate (Lac/NAA) ratios before and after visual stimulation in non-visual and visual cortices (see Methods) in three groups: healthy volunteers (HV), migraine patients suffering from migraine with only visual aura (MA) and patients with visual as well as somatosensory, dysphasic and/or paretic aura (MAplus).
Note that in visual cortices, MA shows higher baseline Lac/NAA before and after stimulation compared with the other groups and that in MA, Lac/NAA is significantly higher in visual compared with non-visual cortices, both before and after stimulation. There are no other significant differences between groups in the baseline measurements or within groups when the baseline after stimulation is compared with before stimulation. Note that, during stimulation, only in the visual cortex in the MA group are there significant differences compared with the baseline condition (h,i) and compared with the non-visual cortices.
Several statistical comparisons were carried out for each lactate to NAA ratio given in the table. Pairs of identical letters indicate the following statistical significances, e.g. ‘baseline before’ in visual cortex of MA is different at P < 0.05 (a) from ‘baseline before’ in visual cortex of HV while the significance level is higher (P < 0.001, c) when compared with the visual cortex of MAplus.
Different from each other at P < 0.05.
Different from each other at P < 0.001.
Different from each other at P < 0.01.
Different from each other at P = 0.01.
Non-significant trend (P = 0.06).
Significant from each other at P < 0.001.
Significant from each other at P < 0.05.
Migraine patients (Table 2, Figs 2, 4 and 5)

Fifty-three-year old female migraine patient with aura (MAplus) with the panels a, b and c as described for Fig. 3. The spectra originate from a voxel in the visual cortex. An increase in lactate during the whole duration of stimulation can be observed.
In MA, but also in some patients with MAplus, lactate could be seen in the spectra by visual inspection even before stimulation.
When comparing metabolites before stimulation, in visual cortices the Lac/NAA was significantly higher in MA compared with HVs or MAplus (P < 0.05 for MA vs. HVs, P < 0.001 for MA vs. MAplus, Table 2) while Lac/NAA tended to be lower in MAplus compared with HVs. There was no difference in Lac/NAA before stimulation between groups in non-visual cortices.
During visual stimulation, the Lac/NAA in visual cortices remained constantly high in MA and stayed significantly elevated compared with the other groups also in the resting state after stimulation (P < 0.01 for MA vs. MAplus, P < 0.05 for MA vs. HVs, Table 2, Figs 2 and 4). In MAplus, there was an increase in Lac/NAA in visual cortices that typically peaked during the second 7 min of stimulation, declining thereafter. After stimulation ended, no statistically significantly higher values than at baseline before stimulation were detected (Fig. 5). In non-visual cortices, there was no significant change during stimulation. The
Over all three groups,
Discussion
Using fMRSI in migraine allows the study of the putative distinct pathophysiological components of abnormal cortical information processing and metabolic abnormalities (see the Introduction) with one method. We combined the method of MRSI with a functional paradigm using sustained visual stimulation. This allowed us to study the metabolism of the visual cortex in function, and additionally, to compare visually activated with non-activated brain areas, thus controlling for possible non-specific influences. We improved and tested the method in a series of experiments in healthy volunteers. In the methodological tests that accompanied this work, done in HVs, migraine patients and patients with mitochondrial cytopathies, repeatability was good between different days, both without and with visual stimulation (data not shown). In our hands, the sensitivity of fMRSI proved to be sufficient to detect simultaneously lactate in different parts of the brain of healthy volunteers. Similarly to previous reports using single voxel techniques (20, 22), we found a transient increase of lactate in some voxels in the visual cortex of HVs during physiological stimulation. However, no statistically significant change of lactate was found when averaging over all visual cortex voxels and comparing them with non-visual cortices. This is probably due to the somewhat lower signal to noise ratio of the multivoxel compared with single voxel techniques, as well as the fact that a number of voxels containing visual cortex had to be excluded from the analysis due to overprojection with saturation bands necessary to avoid signal contamination from extracerebral tissue.
In patients with complex neurological auras (MAplus), it can be assumed that a larger area of cerebral cortex is involved by the pathophysiological process underlying the aura symptoms. Hence cortical spreading depression, which is the most likely pathophysiological factor (10, 11, 23), may extend into a wider area involving somatosensory and adjacent cortices in addition to the visual areas. Furthermore, MAplus, but not MA patients, may have subtle impairment of neuromuscular transmission on single-fibre EMG (12) suggesting pathophysiological differences between these two subgroups, which was the motivation to study this clinical subgroup separately from MA.
In the MAplus group, we found a significant transient increase of lactate during visual stimulation selectively in the visual cortex (Fig. 5), while this was not the case for the control or the MA group. The magnitude of the increase of lactate during physiological activation is comparable to that reported in HVs (20, 22). As with our multivoxel technique we did not observe a statistically significant increase of lactate in our healthy controls, the increase of lactate in the MAplus group was probably more pronounced than in HVs, suggesting that neuronal activation and subsequent metabolic activity was greater. The latter can be expected when cortical excitability is increased (24). Habituation of visual evoked potentials is closely correlated with a decrease in occipital lactate levels during sustained visual stimulation (20). It has been suggested that abnormalities in neuromuscular transmission as well as subclinical cerebellar signs in MAplus patients are the consequence of dysfunctioning Ca channels (12, 13). It remains to be determined whether this plays a role in the stimulation-induced lactate increase.
For the second subgroup studied, migraine with purely visual aura, we observed a different metabolic pattern. Compared with both HV and MAplus, lactate levels in visual cortical areas were elevated in MA before stimulation, but without further rise during the stimulation, in contrast to MAplus.
The lactate levels in visual cortices of MA patients were in the range of the maximal levels measured during photostimulation in MAplus. They cannot be explained by a higher attack frequency (Table 1), or by closer temporal proximity to the last attack or a longer disease duration, as these clinical variables were not significantly different between subgroups. There is a statistically not significant tendency of higher age in the MA compared with the control group. Looking at lactate to NAA ratios, an age-dependent decline could be a factor explaining higher values in the MA group. Several studies have looked into the age dependency of NAA. While some of the studies are in favour of an age-dependent decline (25, 26), others (27–29) do not find such a change. The matter is further complicated by work by others (30) who, using MRI segmentation, found in their elderly population between 59 and 89 years an increase in NAA with age in white matter (but not in grey matter). Therefore, the issue of age-dependent NAA changes cannot be considered as solved and an age-dependent decline can not, based on the literature, be considered as given.
Two of the MA patients reported to have very rarely experienced auras lasting slightly over 1 h, therefore strictly speaking fulfilling the classification criteria for prolonged auras (IHS code 1.2.2), but the majority of their auras were short-lived as in the other MA patients and participants in the MAplus group. Longer duration of the aura therefore is unlikely to explain the observed differences, but cannot entirely be excluded. In non-visual cortices, baseline lactate levels were low under all conditions and comparable between groups, excluding a significant metabolic effect due to non-specific factors such as stress.
Lactate is an anaerobic metabolite, which accumulates in case of mitochondrial dysfunction. In addition, there is evidence that during physiological neuronal activation and glutamatergic neurotransmission, astrocytes may produce lactate and supply it to the neurons, where after transformation into pyruvate it is used for oxidative metabolism (for review, see Tsacopoulos and Magistretti (31)). While the latter may explain transient stimulation-induced lactate increases if baseline lactate is low, it is not a likely explanation for elevated lactate levels during rest. Indeed, even during prolonged neuronal activation lactate levels decrease over time after an initial rise (20). Subclinical waves of cortical spreading depression, which, if frequent enough, may in theory lead to persistently increased lactate levels, are also unlikely as they have never been reported in patients using appropriate techniques. The most plausible abnormality underlying the increase in resting lactate levels is thus a subtle mitochondrial dysfunction. A reduced mitochondrial phosphorylation potential was indeed found in migraineurs with 31P NMR spectroscopy by two separate groups for migraine with and without aura (4–6). Watanabe et al. (7) studied migraine with aura patients using single voxel 1H MRS without visual stimulation. They reported slightly increased resting lactate to NAA ratios, comparable to our findings in MA, in the visual cortices of five out of six patients and attributed these changes to subtle mitochondrial dysfunction. Increased cortical lactate levels at rest are well known in mitochondriopathies (32, 33).
In our study, MA patients were also characterized by the lack of rise in lactate levels during photostimulation. Similar results were obtained by Kuwabara et al. (32) in four patients with Kearns Sayre syndrome, a mitochondrial encephalopathy, using single voxel 1H MRS: baseline Lac/NAA were elevated in these patients without any further rise during visual stimulation. We had similar results in a patient with the mitochondrial encephalopathy, lactic acidosis and stroke-like episodes (MELAS) syndrome, another mitochondriopathy (34). Using the same paradigm as in our migraine patients, we found Lac/NAA values in visual cortical areas up to 0.4 that were stationary during visual stimulation (data not shown). These values, exceeding those of about 0.12 obtained in MA, are compatible with a more severe mitochondrial dysfunction. The lack of stimulation-induced lactate increase in MA and in patients with mitochondriopathies might be in part due to a saturation of lactate transporter systems (35).
The question arises, why an association between the clinical picture and the functional metabolic pattern exists and what the reason might be, that in the subgroup with high resting lactate, the aura seems to be limited to the visual cortex while this is not the case for the MAplus group. There is experimental evidence that decreased pH, which would accompany increased extracellular lactate, is an inhibiting factor for spreading depression (36, 37). The clinical observation that acetazolamide, producing metabolic acidosis, is able to stop aura status (38) is in support of the role of metabolic acidosis as a limiting factor of spreading depression in humans.
Future studies are needed to elucidate further possible correlations between metabolic and other pathophysiological abnormalities and the clinical picture of different migraine subgroups, including also migraine without aura.
The method of fMRSI needs to be refined and its sensitivity increased, to detect more subtle metabolic changes, like a rise of lactate in healthy volunteers using this multivoxel technique which could be achieved with high-field MR systems and/or the use of surface coils. Furthermore, correlations of different measures during habituation paradigms, e.g. between metabolic and visual evoked potential measurements, need to be investigated in the different clinical subgroups. Finally, treatment effects on functional metabolic abnormalities (e.g. of riboflavin and β-blockers) need to be studied similarly as in previous electrophysiological work (39).
Footnotes
Acknowledgements
The authors thank Dr Gerard Crelier for his help with setting up the stimulation tools and Thomas Lange for his helpful comments on the manuscript. U.D. was supported by Swiss National Science Foundation grant 31-52173.97. There is a collaboration between the MR group of P.B. and Philips, including exchange of expertise and sponsoring of MR machines and software.