
Abstract
Three studies are reported that explore colour perception in migraine. In each, sensitivity for colours detected selectively by the S-cones and the L- and M-cones was assessed separately. The first study assessed the discrimination of small colour differences using the Farnsworth-Munsell 100-hue test. The second assessed threshold detection for purple, yellow, red and green targets on five equiluminant background colours. The third examined supra-threshold colour scaling using two colour series, purple-yellow and red-green. Each study indicated that differences in colour perception between migraine and control groups were restricted to colours detected by the S-cones, there were no differences in performance for colours detected by the L- and M-cones. The results are discussed in terms of possible pathologies in the early visual pathways.
Introduction
Many aspects of visual processing have been investigated in migraine research in an attempt to elucidate physiological or cognitive biases that may underlie this condition; however, colour perception has hitherto been largely neglected. Here, three studies are reported that examine colour processing in migraine, one using a clinical test of colour vision (the Farnsworth-Munsell 100-hue test), one using a threshold detection task, and the third using a scaling task. Each study revealed selective differences in some aspects of colour vision between people with and without migraine.
Interest in visual processing in migraine results in part from the visual disturbances and photophobia that can occur before and during the attack, and in part from reports that certain visual patterns can induce an attack. Common descriptions of both of these have encouraged the study of achromatic, or black and white, patterns. For example, the classic fortification spectra that can precede the headache in those with visual aura are typically described as a bright, shimmering line that arcs and zigzags its way through a hemifield, leaving transient blindness behind (1, 2). Other positive symptoms that can be experienced include bright flashes, stars or phosphenes twinkling over time, again often in one hemifield. These are described as achromatic in many cases, although coloured fortification spectra, stars and phosphenes can be experienced (2, 3). The visual patterns reported to induce migraine are also often achromatic, such as flickering light, high contrast striped patterns or bright sunshine (4–8). Strong colour contrast, however, can also be an effective trigger and, indeed, colour reversing red-green checkerboards have been used to induce migraine (9).
The experiments reported here developed in part from these observations and in part from reports of precortical dysfunction in migraine, specifically at the level of the lateral geniculate nucleus (LGN) in the thalamus (10, 11). The LGN contains parvocellular and koniocellular layers, which are typically described as subserving spatial and colour processing; and magnocellular layers, subserving the processing of motion and flicker (12–14). Coleston et al. (10) and Oelkers et al. (11) used high contrast black and white flickering or striped patterns in their tasks, however, finding differences that they attributed to the parvocellular layers of the LGN raised the question of anomalous colour perception in migraine. Finally, the growing number of reports that wearing tinted spectacles can reduce migraine frequency (15, 16) suggested that a systematic study of colour vision could be useful in understanding not only the pathophysiology of migraine but also alternative treatments. Demonstrating an abnormality in the colour vision of people with migraine should guide research into how tinted lenses might work. Colour perception in migraine, however, has not been assessed systematically before.
In the present studies, colours were selected that lay along two physiologically important directions in any colour space, described as cardinal colour directions (17). Colours that lie on cardinal colour directions are selective for one or two of the cone photoreceptors in the retina. At the earliest level of visual processing light is absorbed by three cone photoreceptors, the L-, M- and S-cones, which are maximally responsive to long (or reddish), middle (greenish) and short (bluish) wavelength light, respectively, (see Zeki (18) for further details on the wavelengths each cone photoreceptor responds to). Along one of the cardinal colour directions only the signal from the S-cones varies, the signals from the L- and M-cones are constant (a tritanopic confusion line). The appearance of colours that lie along this direction varies from purple to yellow. Along the second cardinal direction, the signal from the S-cones is now constant but the ratio of L- to M-cone activity varies. The appearance of colours that lie along this direction varies from pink to green-blue. These directions are described as cardinal as they correspond to the separate colour opponent pathways that connect the retina and cortex.
In the first study, each participant completed the Farnsworth-Munsell 100-hue test. In Experiment 2, colour detection thresholds were determined for colours that lay along each cardinal direction. In Experiment 3, participants were asked to set equal appearing colour scales using the same colour directions. The rationale for the current studies was to extend to colour the methods previously employed to examine achromatic contrast thresholds, contrast scales and pattern sensitivity (the illusions and discomfort experienced when viewing high contrast striped patterns) (19). That study revealed consistent associations: impaired or extreme responses on one task were associated with impaired or extreme responses on the others. Thus, those who saw several or intense illusions when viewing high contrast striped patterns set the lowest contrasts in the scaling task and had the poorest contrast detection on the threshold task. Similarly, those who saw few or no illusions in high contrast striped patterns set higher contrasts in the scaling task and had better contrast detection in the threshold task. The research presented here aimed not only to explore colour perception in migraine, but also to determine whether a similar pattern of associations would be seen between the different tasks.
Methods
Subjects
One hundred and fourteen migraine and 96 control participants were recruited from advertisements and from volunteer subject panels. Every participant completed a questionnaire that asked about the characteristics of their headaches, headache triggers, headache duration, frequency of headache and the time elapsed since the last attack. All migraine participants fulfilled the IHS (1988) criteria for migraine (20). None of the control subjects experienced headaches fulfilling the IHS criteria. All participants had at least 6/9 vision monocularly and 6/6 vision binocularly either with or without optometric correction and were screened for normal colour vision with the Farnsworth-Munsell 100 hue test (Experiment 1). Acuity was assessed before the experiments commenced and current lens prescriptions were obtained when necessary and recreated at the time of testing with a set of trial lenses. Informed written consent was obtained in accordance with the declaration of Helsinki (1991), and ethical approval from the Medical Research Council Cognition and Brain Sciences Unit (Cambridge) and Birkbeck College's School of Psychology ethical committees.
Thirty-nine of the migraine group and 39 control subjects participated in Experiment 2. Fifty-three from each group participated in Experiment 3, however, only 52 of the migraine group managed to complete it, of whom 36 migraine and 31 control participants had completed Experiment 2. One discontinued Experiment 3 because she found the yellow scale colours unpleasant. In Experiments 2 and 3 the control participants selected were matched individually by age and sex to the migraine participants (see Table 1 for further details). No migraine participant had taken acute medication within 48 h of testing (nor within one week for those who took ergotamine), two (one VA, one NVA) were on prophylactic treatment (pizotifen) yet still experienced migraine at least once a month. All participants were asked to telephone if they developed a migraine on the day following testing, but only two did so, after Experiment 3 (both VA). The pattern of results reported below is the same whether these two are included or excluded.
Migraine participant details. 1: Farnsworth-Munsell 100 hue test; 2: colour thresholds; 3: colour scaling

n = number; M = male; F = female. The migraine with aura group was divided into two: those with exclusively nonvisual aura symptoms (NVA), such as pins and needles, speech disturbances or co-ordination difficulties, and those with visual aura (VA) such as fortification spectra or other positive visual symptoms, experienced either on their own or together with nonvisual symptoms; MO = migraine without aura. Frequency estimates should be treated as a guide only as they are based on retrospective self-reports and may include counts of headaches other than migraine.
Experiment 1: Farnsworth Munsell 100-hue test
Procedure
The Farnsworth-Munsell 100-hue test was administered under simulated daylight from a MacBeth sol-source desk lamp. The test consists of 85 coloured discs, presented in four trays. The discs in each tray must be arranged to form a smooth colour sequence between two reference discs. As recommended for people with neurological disorders, no time limit was imposed. Total error scores were calculated for each participant using the traditional scoring method (21). Partial error scores for a Blue-Yellow colour axis (caps 1–12, 34–54 and 76–85) and a Red-Green axis (caps 13–33 and 55–75) were also calculated for each participant (21, 22). Errors made for these two axes are used to assess colour discrimination for the S-cone and for the L- and M-cone pathways, respectively. A cube root transformation was used to normalize the distribution of error scores for the statistical analyses, after adding a constant (1) to all scores (23–25), which resulted in the ratio of skew to its standard error falling in the range ± 1 for both groups.
Experiment 2: colour thresholds
Experimental display
The experimental stimuli were presented on an Apple RGB 17 inch colour monitor (Sony Trinitron) with a spatial and temporal resolution of 832 by 624 pixels and 75 Hz. The screen measurement and calibration procedure have been described in detail elsewhere (26). In each experiment, the monitor was the only source of light in an otherwise dark room.
Procedure
Colour sensitivity was assessed with a forced choice threshold detection test using the method of constant stimuli. The screen displayed a uniform coloured background (33° by 16° at a viewing distance of 50 cm) and the task was to detect the presence of a briefly presented equiluminant target square of a slightly different colour (duration 1 second). Each square subtended 6° visual angle and could be presented at one of four locations symmetrically placed around a central fixation point and within the central 14° of the screen. The luminance of all areas in the display was 30 cd/m2. An auditory warning preceded the presentation of each square and, in between trials, the screen displayed the uniform background colour.
Colour detection thresholds were determined on five equiluminant background colours. The background and target square colours were chosen to lie along cardinal colour directions, and thresholds were determined around the most saturated purple, yellow, red and green standards used in Experiment 3 (see Fig. 2). In separate trials, S-cone thresholds were determined on three backgrounds: purple, neutral and yellow. In each case, the responses of the L- and M-cones to the test squares and to the three background colours were constant, so performance was mediated by signals originating in the S-cones. Similarly, L- and M-cone thresholds were determined on three equiluminant backgrounds: red, neutral and green. For these conditions, the responses of the S-cones to the test squares and to the three background colours were constant, so performance therefore depended on signals originating in the L- and M-cones.

The chromaticities of the colours used in Experiment 3 plotted in the modified MacLeod-Boynton (1979) cone-excitation diagram in which cardinal colour directions plot as horizontal and vertical lines. The co-ordinates (0, 0) represent the chromaticity of the grey background (actual co-ordinates 0.6535, 0.0207). Positive points along the abscissa represent
On half the trials the target square was a more saturated colour than the background, with 10 different colour increments presented in each of the four locations. On the other half the target square was a less saturated colour than the background, with 10 different colour decrements presented in each of the four locations. After an initial practice session, there were 80 trials in total for each of the six background colours, presented in random order. Subjects were instructed to look at a central cross and press one of four buttons on a control box corresponding to the target square's location.
Experiment 3: colour scaling
Procedure
The experimental stimuli were presented on the colour monitor used in Experiment 2. The screen displayed five circles (each subtended 6° visual angle at a viewing distance of 50 cm) on a grey surround (33° by 16°, see Fig. 1). The luminance of each of the circles was 34 cd/m2 throughout the experiment. Small random luminance variations were introduced into the grey surround to minimize differential luminance or colour contrast effects against each of the five circles due to screen nonuniformities (26, 27). Each screen pixel was randomly assigned a luminance between 28.6 and 33.8 cd/m2, giving an overall average screen luminance of 31 cd/m2 and the appearance of a feintly speckled grey surround.
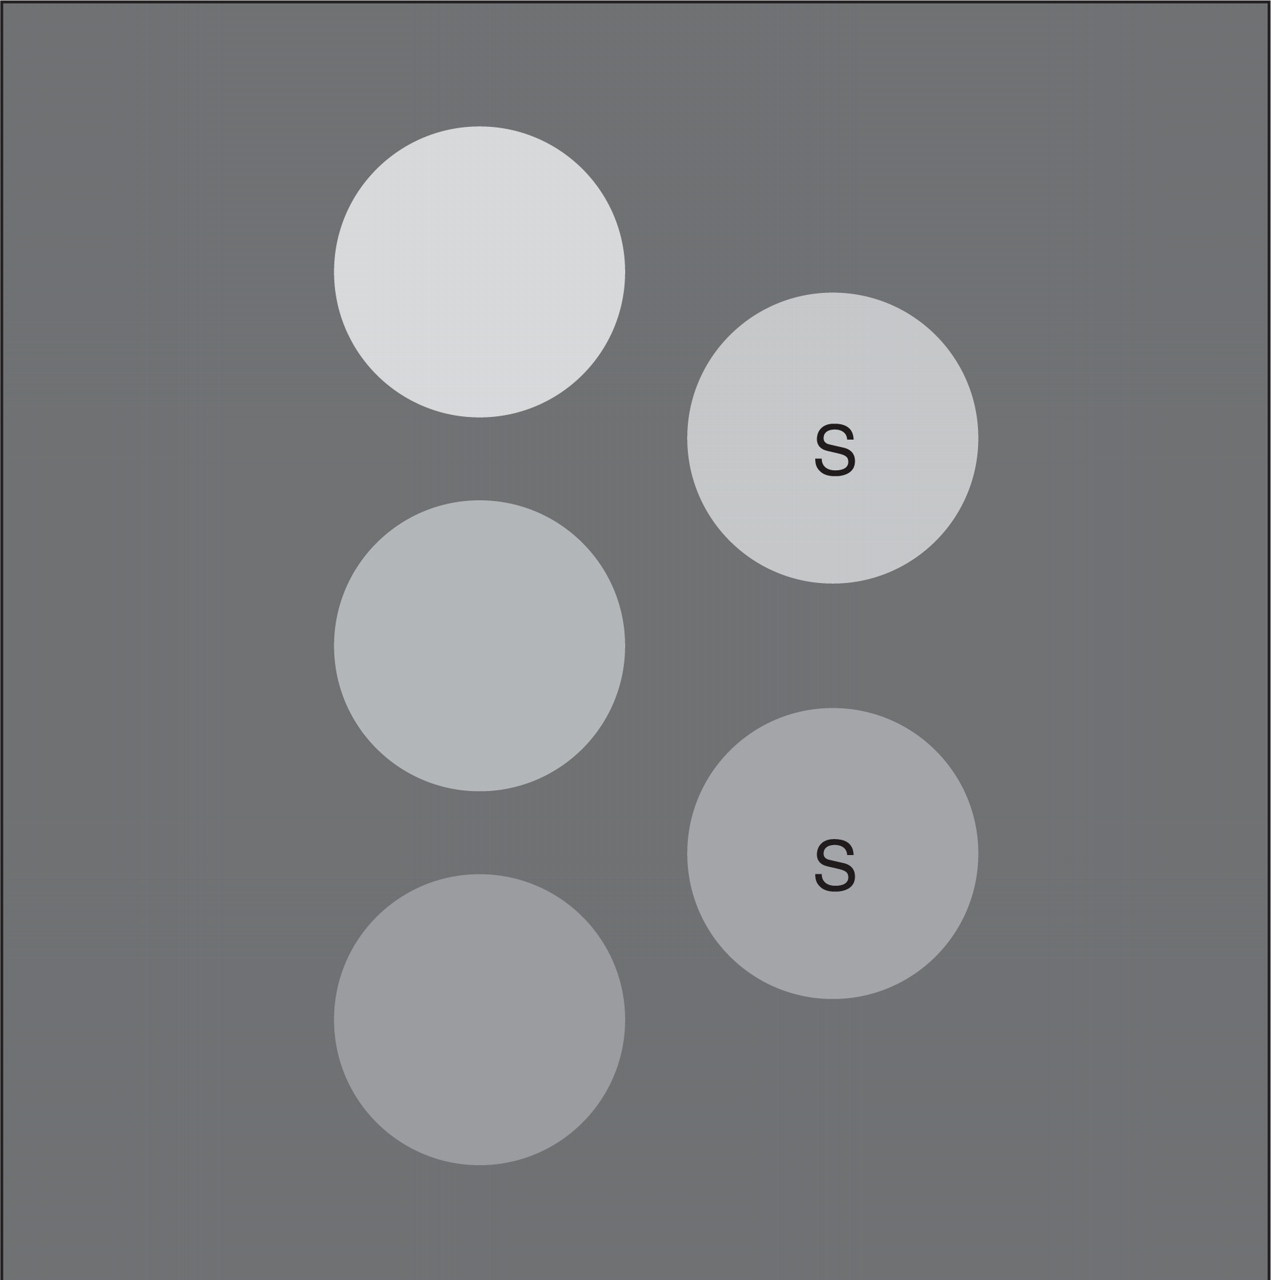
The display used in the colour scaling experiment (Experiment 3). Each circle displayed a uniform colour, here depicted as grey. Two of the circles were standards (marked here with ‘S’) and their colour could not be altered. The colour of the remaining three circles could be changed either from purple to yellow or from red to green. The task was to set the colours of these three circles such that the five circles formed a series in which colour appeared to change uniformly from circle to circle. In separate trials participants set scales with five pairs of standards that ranged either from purple to yellow or from red to green. The series of standard colours are given in Fig. 3.
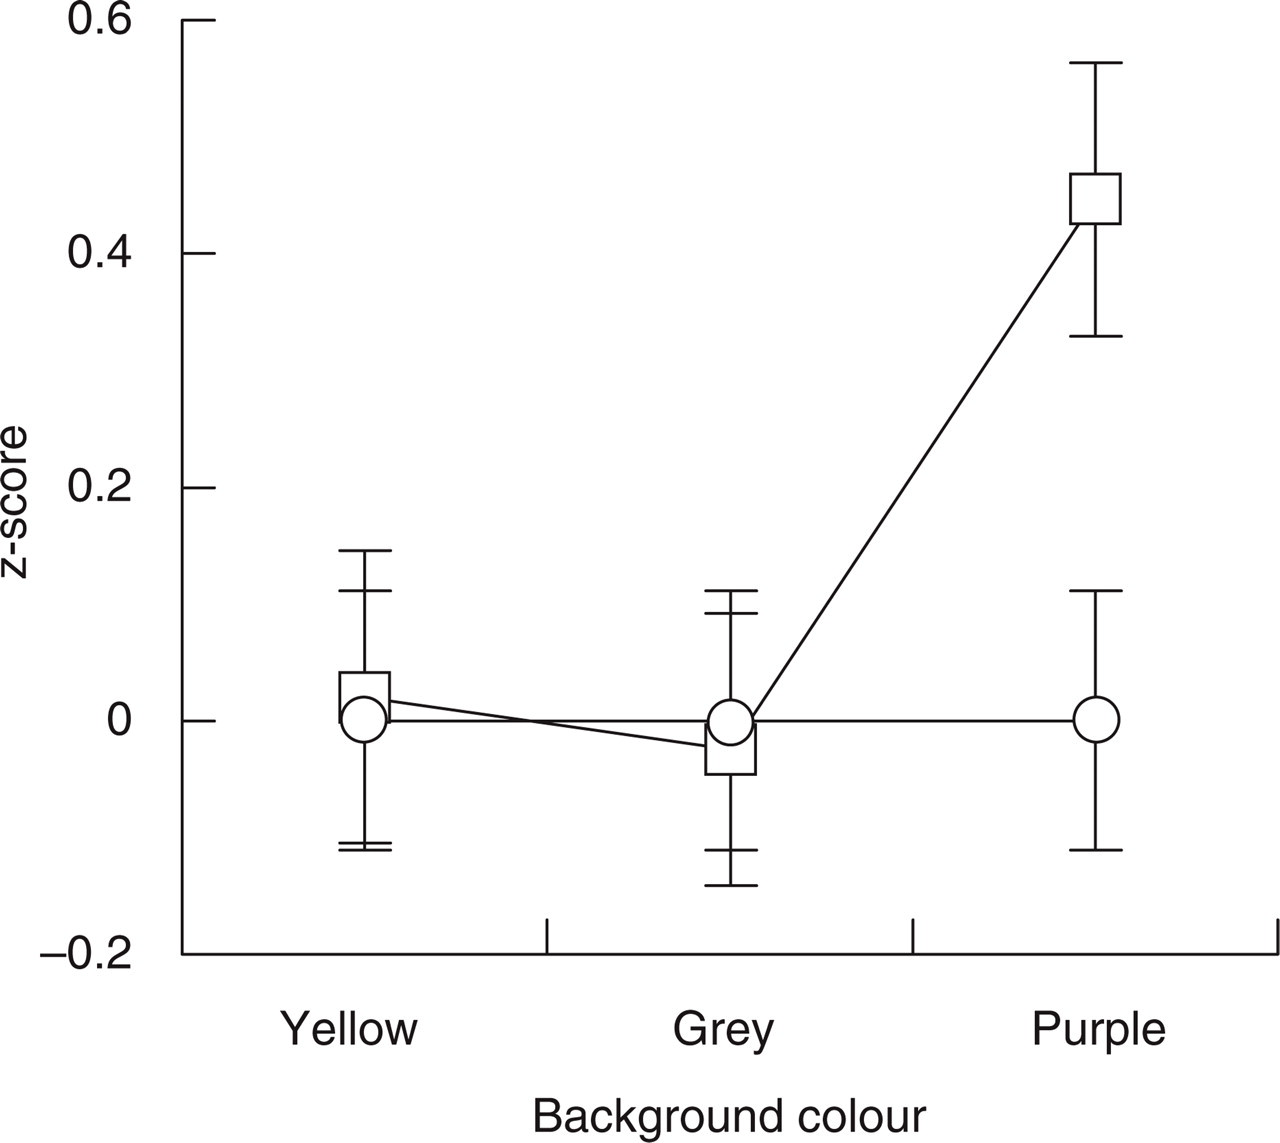
Results for the threshold detection experiment for the S-cone colours. For both migraine (□) and control (○) groups, the average percentage errors were transformed to z-scores relative to the control group's performance. Error bars denote ± 1 standard error. The migraine group made more errors than the control group when targets were presented on the purple background.
Two of the five circles were standards (marked ‘S’ in Fig. 1) whose colours could not be changed during any trial. Participants were instructed to set an even colour scale around the two standards, first by setting the colour of the middle circle to be half way between those of the two standard circles, and then setting the upper and lower circles such that, looking sequentially at the five circles, the changes in colour between adjacent circles appeared uniform. In separate trials participants set scales that varied along the two cardinal colour directions and, for each of these, the scales were set with five sequential pairs of standards, making 15 settings in total. The chromaticities of the two colour directions and of the standard colours are depicted in Fig. 2.
The subjects made their settings using a six button control box. One pair of buttons changed the colour of the currently selected circle by stepping through a set of 78 calibrated colours ranging between the extremes of either colour direction (purple to yellow or red to green). There were thus 78 settings available for each circle-position to give participants a sufficiently wide range and small enough step sizes to set an even colour scale. Other buttons on the control box allowed the participants to move between the three circles and to record their scales when they were satisfied the changes in colour appeared uniform.
Results
Experiment 1
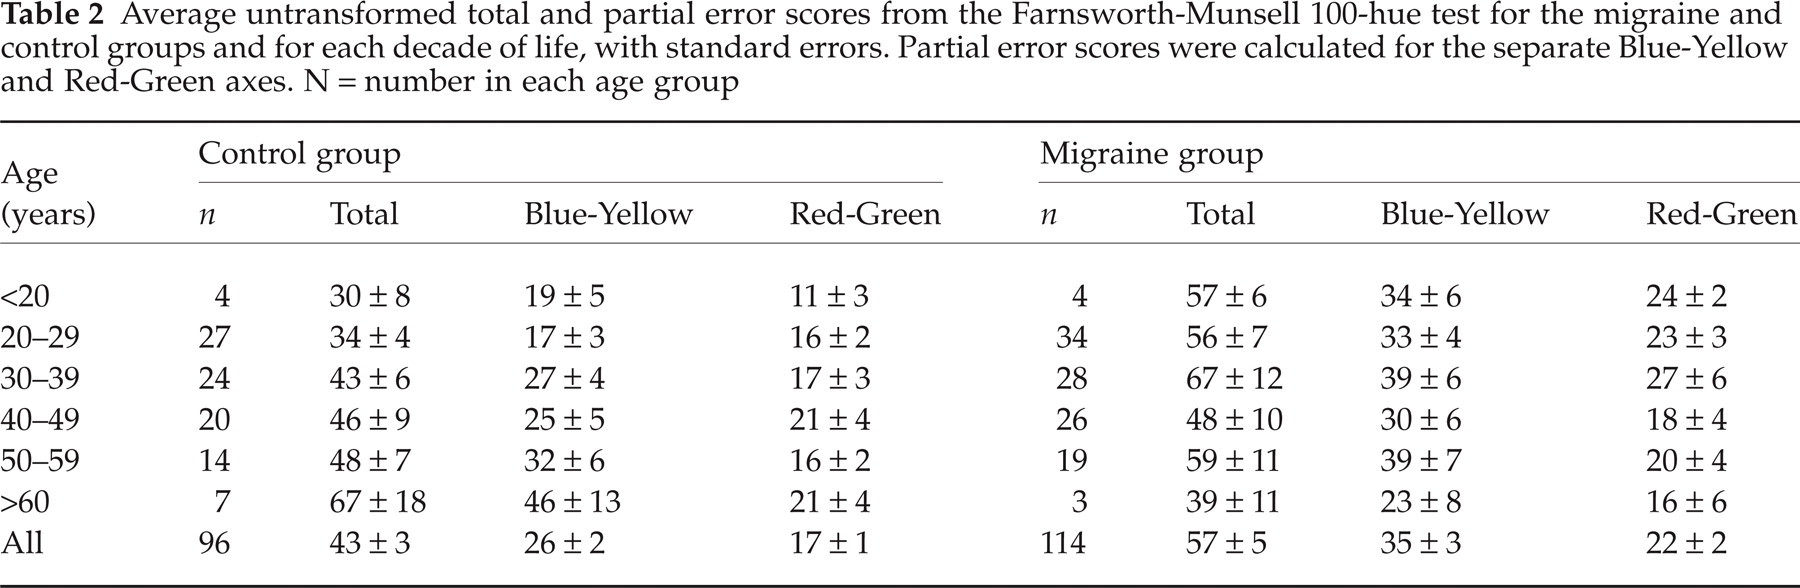
Total error scores (TES) on the Farnsworth-Munsell 100-hue test are presented in Table 2, together with partial error scores (PES) for the Blue-Yellow and Red-Green colour axes.
Average untransformed total and partial error scores from the Farnsworth-Munsell 100-hue test for the migraine and control groups and for each decade of life, with standard errors. Partial error scores were calculated for the separate Blue-Yellow and Red-Green axes. N = number in each age group
Total error scores
The average performance of each group was similar to the test norms reported for their appropriate age groups (Table 2) (21, 28). The slightly greater number of errors made by the migraine group (average 3√TES = 3.56, standard error = 0.10) did not differ significantly from the performance of the control group (3√TES average = 3.31, standard error = 0.09, t(208) = 1.8 (NS). None of the control group had a raw TES indicated as abnormal by Verriest et al. (28), however, 13 (11.5%) of the migraine group had a TES that exceeded the critical values (95th percentile) for normal performance for binocular tests (MO N = 4, NVA N = 3, VA N = 6, age range 24–55). Kinnear and Sahraie (21) published lower critical values for normal performance (95th percentile), but their estimates were based on a smaller sample. Five (5.2%) from the control group had a TES that exceeded their critical values, compared to 22 (19.5%) from the migraine group (MO N = 6, NVA N = 8, VA N = 8).
In the control group there was a significant association between 3√TES and age, as reported previously (21, 22, 28). Older subjects had higher 3√TES than younger (r(94) = 0.20, P = 0.049), which resulted mainly from increased errors along the Blue-Yellow axis with age (r(94) = 0.25, P = 0.013). There was no significant association between the Red-Green 3√PES and age (r(94) = 0.1 (NS). In the migraine group, in contrast, the correlations between age and either the 3√TES or Blue-Yellow or Red-Green 3√PES were close to 0.
Partial error scores
The migraine group made more errors than the control group for the Blue-Yellow axis (t(208) =−2.07, P = 0.04), but the performance of the two groups did not differ significantly for the Red-Green axis (t(208) =−1.11, NS). There were no significant differences between the migraine subgroups (VA, NVA, MO) for either the Blue-Yellow or Red-Green axes (in each case F < 1, NS). There were no significant correlations between either 3√TES or 3√PES and migraine duration, frequency, the time elapsed since the last attack, nor visual triggers. There was, however, a significant association between pattern sensitivity (see Shepherd (19) for details on the assessment of pattern sensitivity) and the Blue-Yellow 3√PES (rpb = 0.24, P = 0.018). Those who experienced discomfort or distortions when viewing high contrast black and white striped patterns had higher error scores on the Blue-Yellow axis than those who did not.
Experiment 2
In Experiment 2, S-cone incremental (purplish) and decremental (yellowish) targets had to be detected on each of the three coloured backgrounds, yellow, grey and purple. In many psychophysical tasks different results can be obtained for incremental vs. decremental stimuli (29–31), therefore the results for increments and decrements are presented separately.
A preliminary analysis of the control group's data revealed effects due to age and to the different background and target colours. Overall, older subjects made more errors than younger (46% vs. 36%, respectively, assessed by dividing the data into two groups at the median age of 44 years). This result parallels the trend for older control subjects to have higher error scores than younger on the Blue-Yellow axis of the Farnsworth-Munsell 100-hue test. More generally, the correlation between performance on the S-cone threshold tasks and Farnsworth-Munsell 3√PES for the Blue-Yellow axis were each highly significant (Table 3). Second, the detectability of the target square varied on each of the three colour backgrounds. These effects were also apparent in the migraine group's data (Table 3). Since they were not of primary interest in a study of differences between migraine and control groups, they were removed by transforming all scores to z-scores. Two control groups were formed by dividing their data at the median age of 44 years. The data from the migraine participants were then expressed as z-scores relative to the appropriate control group. This removes the effects of age and of background and target colours, but leaves intact differences between the migraine and control groups.
Percentage errors for the six sets of colour detection thresholds, with standard errors. Results for the S-cone colours and results for the L(–M) cone colours. Detectability of the target square varied on each of the colour backgrounds, for example, for the S-cone colours, both groups made approximately 30% errors when detecting the target square on the yellow background, and slightly more on the grey and purple backgrounds. For the L(–M) cone colours, they made fewest errors on the red background and most on the green

Numbers in italics show the correlations between the error rates and Farnsworth-Munsell 3√PES for (A) the Blue-Yellow and (B) the Red-Green axes.
denotes significant one–tailed associations at P < 0.05.
An analysis of the data with group (migraine vs. matched control), background colour (purple, grey, yellow), and target (incremental vs. decremental) as three within-factors and migraine type (VA, NVA, MO) as the between-factor in a mixed
There was also a significant interaction between group and target (F (1,36) = 6.2, P = 0.017), which also resulted in a significant main effect of target on the standardized scores (F (1,36) = 7.9, P = 0.008). The former indicates that when the data for the purple, grey, and yellow background colours were combined, the migraine group made more errors for the incremental (purplish) target colours (average z-score = 0.36) than the control group (average z-score = 0.0), whereas the performance of the two groups did not differ, overall, for the decremental (yellowish) target colours (average migraine z-score =−0.06, average control z-score = 0.0).
Other comparisons, including all comparisons involving migraine type, did not approach significance (all F’s < 1.2, NS). Considering only those migraine participants who experienced visual aura and those without aura produced exactly the same pattern of results, except that the main effect of colour now reached significance (F (2,48) = 4.2, P = 0.02). Inspection of the data from the three migraine groups revealed that the differences between the migraine and control groups were greatest for those with visual aura and without aura, whereas the errors for the nonvisual aura group were closer to the control group. Finally, the number of errors did not vary systematically with the location of the target square for any of the migraine groups.
Other factors to consider are migraine duration, frequency of attacks, time elapsed since the last attack, pattern sensitivity (see Shepherd (19) for the assessment of pattern sensitivity) and whether migraine could be induced by visual patterns. There were no significant effects associated with these factors.
In separate trials,
Experiment 3
In Experiment 3, participants set equal appearance colour scales around sequential pairs of standard colours that ranged from purple through neutral to yellow, and from pink through neutral to green. Considering the former settings first, a preliminary analysis of the control group's data (Fig. 4a) showed changes in colour over the 15 settings, from purple to yellow, which were not of primary interest to a study of visual function in migraine as they simply reflect the way the task had been designed. There were, however, no significant effects of age (determined by dividing the data into two groups at the median age, 44 years).
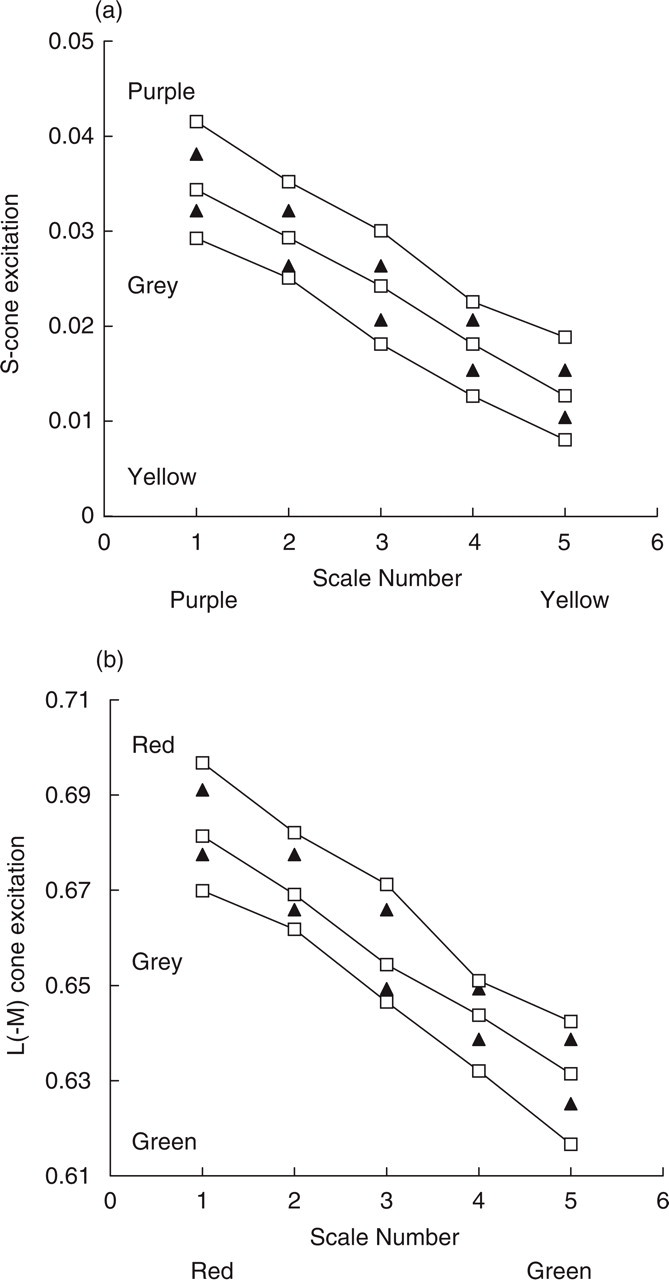
Results of the colour scaling experiment for the control group. Scale-number is plotted on the abscissa and the sets of three points (□) plotted at each scale-number correspond to the average of the control group's settings for the three circle-positions (upper, middle and lower, see Fig. 2). The colours of each pair of standards are plotted (▴). (a) data for the S-cone colour scales, (b) data for the L(– M) colour scales. See Fig. 5 for the data from the migraine group.
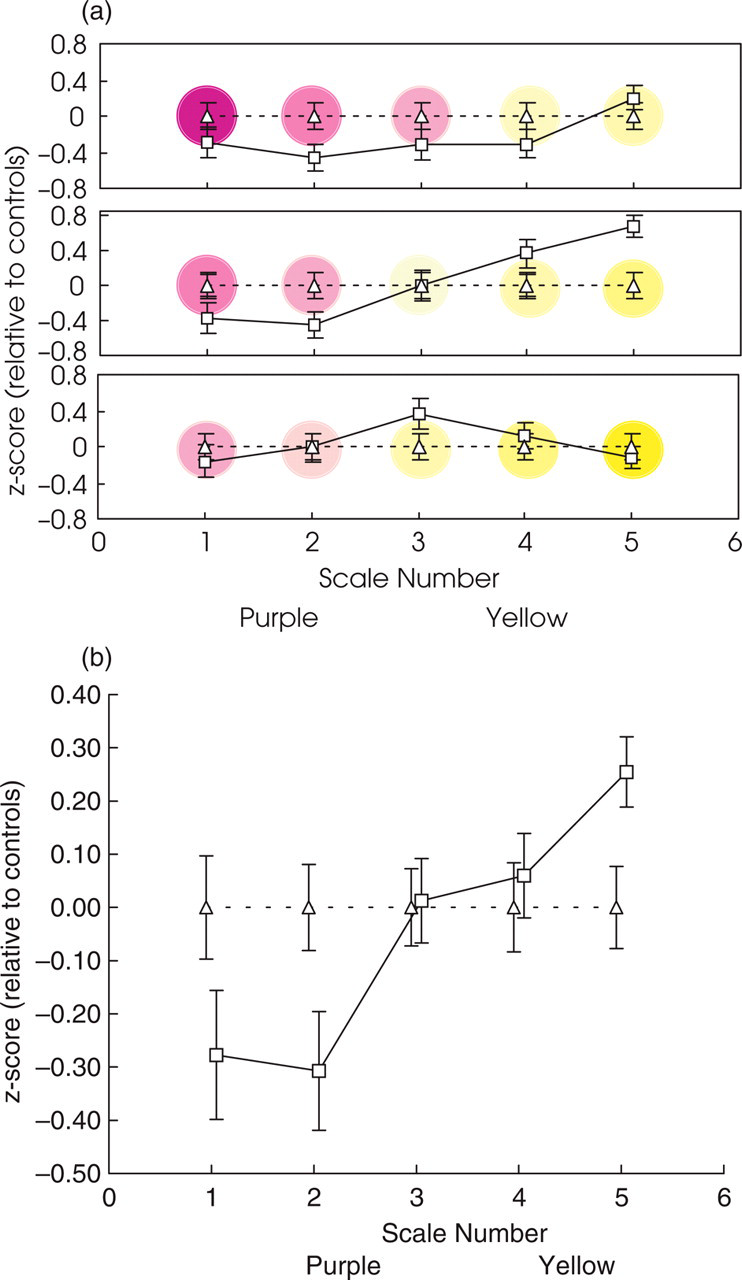
Results of the colour scaling experiment for the S-cone scales. (a) The significant group by scale-number by circle–position interaction. The migraine groups’ settings are expressed as z-scores relative to the control group's settings, which now necessarily lie on horizontal lines for each circle-position (upper: top panel, middle: middle panel, lower: bottom panel). Scale-number is plotted on the abscissa and the sets of three points plotted at each scale-number correspond to the settings made for the three circle-positions (upper, middle and lower) by the migraine group (□). Overall, the migraine group set paler colours than the control group (▵). Coloured discs in the background are provided as a guide to clarify the trends discussed in the text. (b) The trends shown in (a) also resulted in a significant group by scale–number interaction and a significant main effect of scale-number. The data plotted at each scale-number are the average of the three circle-position settings (upper, middle and lower) for that scale-number. For both purple and yellow scales, the average settings by the migraine group at each scale-number are paler than the settings made by the control group. The effect is strong enough to result also in a significant main effect of scale-number, which is the average of the migraine and control groups’ data. Error bars denote ± 1 standard error.
Since these effects simply indicated that purple differs from yellow, they were removed by transforming all scores to z-scores where the settings from the migraine group were expressed as z-scores relative to the control group. This transformation removes the effects of scale-number and circle-position that are due to changes in colour from purple to yellow, but it leaves intact relative differences between the migraine and control groups. Running the following analysis on the raw scale settings, rather than on the z-scores, produces an identical pattern of significant effects and interactions, the group differences are simply easier to interpret using the transformed scores.
A mixed
The tendency for the migraine group to set paler colours than the control group is also apparent in the significant group by scale–number interaction (F (2,8, 137) = 4.7, P = 0.005), depicted by the upward trend in Fig. 5(b), that was also sufficiently large to result in a significant main effect of scale-number (F (2,5, 124) = 5.7, P = 0.002). None of the other effects approached significance, including those involving migraine type, whether those with migraine were classified as VA, NVA and MO (all F’s < 2.2, NS) or those with visual aura were compared to those without (all F’s < 2.5, NS).
Other possibly relevant factors include migraine duration, frequency of attacks, time elapsed since the last attack, pattern sensitivity and whether migraine can be triggered by visual patterns. As in Experiment 2, there were no significant effects associated with these factors.
An analysis of the red and green scale settings again revealed no significant differences between the migraine and control groups, whether those with migraine were classified as VA, NVA and MO or as those with visual aura and those without.
Discussion
Three different studies have indicated that differences in colour sensitivity between migraine and control groups are restricted to colours detected by the S-cones. Experiment 1 (Farnsworth-Munsell 100-hue test) and Experiment 2 (colour thresholds) indicated an impaired ability to discriminate S-cone colours in migraine. The migraine group made more errors than the control group for the Blue-Yellow axis of the Farnsworth-Munsell 100-hue test. Similarly, in Experiment 2, the migraine group made more errors than the control group for incremental S-cone targets, which appeared paler yellow, purple, and more saturated purple on the yellow, grey and purple backgrounds, respectively. Experiment 3 (colour scales) indicated that participants with migraine set overall less saturated colours than control participants. Could this tendency to set paler colours be due to an impaired ability to discriminate between the various available shades, or between the standards? All participants in Experiment 3 had completed Experiment 1. Thirty-six from the migraine group, and 31 from the control group, participated in both Experiments 2 and 3. Overall purple and yellow scale values from Experiment 3 were obtained for each group by averaging together the scales set for circles 1–6 and for circles 10–15, respectively. These two averages were correlated with the error scores from Experiment 1 (Blue-Yellow axis) and Experiment 2. In the migraine group, the only significant positive correlation occurred for the average yellow scale settings and number of errors made on the yellow background in Experiment 2 (r (34) = 0.37, P = 0.025): those participants who set the palest colours for the yellow scales produced the greatest number of errors for the targets on the yellow background (pale yellows correspond to relatively larger S cone values than more saturated yellows). In the control group, none of the small positive correlations between the average scale settings and the errors made in Experiments 1 and 2 were significant. Thus, there is some evidence that the pale colours set by the migraine group in Experiment 3 could reflect impaired discrimination, at least of yellowish (low S) stimuli. Some other explanation is required, however, to explain the group differences for the purplish colours in each experiment.
A preliminary issue is to consider what could be responsible for a colour vision deficit in migraine that is restricted to S-cone colours. Although one group has speculated that there are similarities between the retinal changes that occur in glaucoma and in migraine (32), other data suggest that the differences are unlikely to arise from changes in retinal function. First, previous electroretinogram (ERG) studies have reported no differences between migraine and control groups (33). Components of the flash and pattern ERG have been attributed to photoreceptor and retinal ganglion cell function, respectively. Second, a retinal cause should have produced strong positive correlations between performance on the three tasks in the present studies, but this was not observed. Based on these data, it is therefore likely that the differences between migraine and control participants arise at a site in the visual pathways proximal to the retina.
S-cone signals are carried in chromatic opponent pathways that extend from the retinal ganglion cells, via the parvocellular and koniocellular layers of the LGN in the thalamus, to the early visual cortex (Areas V1 and V2) at least (12, 34). The opponency derives from an interaction between signals from the S- and the L- and M-cones: + S–(L + M), or blue-yellow. Signals from the L- and M-cones also contribute to a separate opponent channel (±L±M, or red-green) and to a nonopponent channel. The differences reported here could arise throughout this pathway or at one of many stages within it. The lack of association between the scaling and other tasks is consistent with performance on these tasks reflecting different processes or stages. The specificity of group differences to the S-cone colours, however, suggests a stage or stages before the signals from the colour opponent pathways combine, which has also been proposed to occur as early as V1 (35–37). Proposed pathologies of opponent pathways include a disruption of the dynamic range of the opponent signals or a disruption of adaptation (38). Either of these pathologies could be consistent with the pattern of results obtained in these three experiments, but do not help to clarify why they were restricted to the S-cone pathway. However, reports of S-cone deficits are not uncommon in various conditions (e.g. Parkinson's disease (39), multiple sclerosis (40), Huntington's chorea (41), epilepsy (42)) and also occur following centrally acting medication (43, 44). The preponderance of acquired S-cone deficits may simply reflect that there are relatively few S-cones, compared to the numbers of L- and M-cones, so any alteration in visual processing is likely to present (initially) for S-cone colours. Alternatively, the subcortical pathways are morphologically distinct, and there may be some features of the S-cone pathway that makes it more vulnerable to changes in sensitivity, damage or disease (38).
The involvement of either of the proposed pathologies in migraine, and their specificity for the S-cone pathway, could be assessed with further research. For example, Shepherd (45, 46) has already reported increased adaptation effects in migraine using moving displays (the motion after-effect) and achromatic gratings (the tilt after-effect). Those experiments examined the appearance of test patterns following adaptation. A second general effect of adaptation is that it elevates detection thresholds for targets similar to the adapting display (47). If differences in adaptation between migraine and control groups extend to colour, then enhanced effects of adaptation to the background colour in Experiment 2 could be consistent with increased errors in the migraine group. Increased errors, however, occurred only for the S-cone trials. It is unlikely that the test was insufficiently sensitive to show impaired performance for the L- and M-cone trials, since comparable percentage errors occurred for both the L- and M-cone and the S-cone sets of trials.
These experiments are the first to show selective impairments for the perception of S-cone colours in migraine, and were designed as preliminary studies of threshold and supra-threshold colour perception. A more systematic study of colour sensitivity following adaptation would help clarify the origin of this impairment. For example, threshold measurements of a person's ability to detect colours are usually determined on various coloured backgrounds, as in Experiment 2. Dynamic dyschromatopsia refers to the paradoxical elevation in colour thresholds that occurs when the adapting backgrounds are removed (38, 48). The effect reflects post photoreceptoral but monocular processes (i.e. up to the primary visual cortex). Alterations in the dynamic range of opponent signals could be assessed using colour discrimination rather than detection thresholds. Such research could confirm the selective impairment in colour perception reported here and clarify its origin, and might indeed help explain why tinted glasses have been reported to reduce attack frequency in some people with migraine (15, 16).
Footnotes
Acknowledgements
This work was supported by a Birkbeck College Research Grant. Pilot data were presented at Anglo–Dutch Migraine Association meetings (![]() ). The experiments used low-level routines written in C, some of which were based on Denis Pelli's ‘Video Toolbox’ collection. I would like to acknowledge the assistance of Elisabeth Pimm who provided optometric correction where necessary and of Arnold Wilkins and Ian Nimmo-Smith for useful discussions.
). The experiments used low-level routines written in C, some of which were based on Denis Pelli's ‘Video Toolbox’ collection. I would like to acknowledge the assistance of Elisabeth Pimm who provided optometric correction where necessary and of Arnold Wilkins and Ian Nimmo-Smith for useful discussions.