
Abstract
Pooled data from multiple clinical trials can provide information for medical decision-making that typically cannot be derived from a single clinical trial. By increasing the sample size beyond that achievable in a single clinical trial, pooling individual-patient data from multiple trials provides additional statistical power to detect possible effects of study medication, confers the ability to detect rare outcomes, and facilitates evaluation of effects among subsets of patients. Data from pharmaceutical company-sponsored clinical trials lend themselves to data-pooling, meta-analysis, and data mining initiatives. Pharmaceutical company-sponsored clinical trials are arguably among the most rigorously designed and conducted of studies involving human subjects as a result of multidisciplinary collaboration involving clinical, academic and/or governmental investigators as well as the input and review of medical institutional bodies and regulatory authorities. This paper describes the aggregation, validation and initial analysis of data from the sumatriptan/naratriptan aggregate patient (SNAP) database, which to date comprises pooled individual-patient data from 128 clinical trials conducted from 1987 to 1998 with the migraine medications sumatriptan and naratriptan. With an extremely large sample size (>28000 migraineurs, >140000 treated migraine attacks), the SNAP database allows exploration of questions about migraine and the efficacy and safety of migraine medications that cannot be answered in single clinical trials enrolling smaller numbers of patients. Besides providing the adequate sample size to address specific questions, the SNAP database allows for subgroup analyses that are not possible in individual trial analyses due to small sample size. The SNAP database exemplifies how the wealth of data from pharmaceutical company-sponsored clinical trials can be re-used to continue to provide benefit.
Keywords
Introduction
Pooled data from multiple clinical trials can provide information for medical decision-making that typically cannot be derived from a single clinical trial. By increasing the sample size beyond that achievable in a single clinical trial, pooling individual-patient data from multiple trials provides additional statistical power to detect possible effects of study medication, confers the ability to explore rare outcomes, and facilitates evaluation of effects of a manipulation among subsets of patients (1). The analysis of pooled individual-patient data from clinical trials has yielded important insights regarding treatment of diseases such as rheumatoid arthritis and breast cancer (1–3).
These data-pooling initiatives have generally not involved pharmaceutical companies, which sponsor and, in collaboration with clinical, academic, and/or governmental investigators, design and implement the majority of large clinical trials of new medicines. As a result of multidisciplinary collaboration as well as the input and review of medical institutional bodies and regulatory authorities, pharmaceutical company-sponsored clinical trials are arguably among the most rigorously designed and conducted of studies involving human subjects. Data from pharmaceutical company-sponsored clinical trials thus lend themselves to data-pooling and data-mining initiatives.
This paper describes the aggregation, validation and initial analysis of data from the sumatriptan/naratriptan aggregate patient (SNAP) database, which comprises pooled patient data from clinical trials of the migraine medications sumatriptan and naratriptan. GlaxoSmithKline, maker of sumatriptan and naratriptan and sponsor of the SNAP database, introduced sumatriptan into clinical practice more than a decade ago. Available in oral, injectable, intranasal, and suppository forms, sumatriptan has been studied in the most extensive program of clinical trials conducted with a headache medication. Naratriptan, which was first introduced into clinical practice in 1997, has also undergone thorough study in clinical trials. The SNAP database was created to provide a resource for exploring questions about the characteristics and treatment of migraine that cannot be answered by individual clinical trials employing relatively small sample sizes.
SNAP study group
The establishment and use of a pharmaceutical company database are accompanied by unique challenges arising from the company's real or perceived commercial interests that could influence database development or analysis and interpretation of the data. If the database is to provide valid, credible, clinically useful information, then data aggregation, analysis, and interpretation should not be motivated or be perceived to be motivated by purely commercial interests. Developers of a pharmaceutical company database therefore need to implement measures to protect the database and its products from possible commercial influence.
The SNAP Study Group was conceived as a multidisciplinary, multinational team with representatives
working in the pharmaceutical industry, academia and clinical practice;
having expertise in statistics, data aggregation, clinical medicine (specifically, neurology and headache care) and/or clinical trials;
doing research or practicing medicine in countries in which migraine-specific therapy is widely prescribed.
The group has provided strategic and tactical guidance at all stages of the project from identification of studies for inclusion in the database through data aggregation and analysis. The academic members of the SNAP Study Group have provided guidance in the planning of the SNAP database, generated the initial hypotheses for exploration, and reviewed the corresponding analysis results. The GlaxoSmithKline members of the SNAP Study Group have been responsible for implementation of the project, review of analysis results and communication of the outputs.
Identification of studies for inclusion
For the first phase of database development, the SNAP Study Group established three broad criteria for selecting studies for inclusion in the database. Studies had to include a sumatriptan or naratriptan group, enroll human subjects and be completed prior to the end of 1998. The GlaxoSmithKline sumatriptan/naratriptan global safety database, which comprises GlaxoSmithKline-sponsored studies included in United States or European Union regulatory submissions for sumatriptan or naratriptan, was searched for studies meeting these inclusion and exclusion criteria. In addition, a search of document indexes and GlaxoSmithKline computer systems was conducted. Experts in migraine from the clinical, health outcomes, epidemiology, and statistics areas of the company were asked to provide lists of studies they were aware of. All lists were combined and all studies meeting the criteria outlined by the SNAP Study Group were included in the first phase of the database.
One hundred and twenty-eight studies conducted from 1987 to 1998 were identified for inclusion in the first version of the SNAP database (Table 1). These studies enrolled 49642 subjects, including 28391 who treated 143177 migraine attacks. (The remaining subjects treated an indication other than migraine, or were enrolled in trials that did not include treating a migraine attack.) The difference in the number of subjects in the database and the number who treated migraine attacks is an indication of the scope of the database. Studies could be single-blind, double-blind, or open-label; could have enrolled healthy volunteers or patients; and could be of parallel-group or crossover, observational or randomized, and controlled or uncontrolled design. Furthermore, although the majority of studies enrolled patients with migraine, studies of patients with other headache types (e.g. cluster) and other disorders (e.g. atypical facial pain) were also identified.
SNAP database characteristics

Suma, Sumatriptan; Nara, Naratriptan; PO, oral tablets; IN, nasal spray; PR, suppositories; SC, injection.
In the majority of studies evaluating the acute treatment of migraine, patients were asked to treat moderate or severe headache with study medication. Headache severity was recorded both immediately prior to dosing and at predetermined time points after dosing (e.g. 30 min and 1, 2, 3 and 4 h postdose) on a 4-point scale: 0 = no pain; 1 = mild pain; 2 = moderate pain; 3 = severe pain. In some studies, patients were also asked to score clinical disability predose and at the same predetermined time points after dosing on a 4-point scale: 0 = able to function normally; 1 = ability mildly impaired; 2 = ability severely impaired; 3 = requires bed rest. Patients were also routinely asked to indicate whether or not nausea, vomiting, photophobia, and phonophobia were present predose and at predetermined postdose intervals. Some protocols permitted patients to take a second dose of study medication or rescue medication beginning 2 h or 4 h postdose in the event that relief of pain was inadequate after the first dose of study medication. In most of the studies, patients were also asked to indicate whether headache, once relieved, recurred between 2 or 4 h and 24 h postdose.
Aggregation
After sumatriptan and naratriptan clinical trials were identified for inclusion in the SNAP database, the data from each trial were aggregated, or assembled to a common platform. Data aggregation was accomplished by a team of statisticians and statistical programmers. Logistical issues that the team confronted in aggregating the large volume of sumatriptan and naratriptan data included: selection of computer platforms and software; determination of the structure of the database, methods of coding the data, and standards and rules of aggregation; allocation of appropriate resource for performing aggregation; determination of the best methods of documenting the aggregation process; determination of process for independent validation of the aggregation. SAS® programs were developed to support the aggregation.
The aggregated database includes elements for demography, study medication, baseline migraine characteristics, efficacy parameters, adverse events, concurrent and rescue medication use, premature study withdrawals, vital signs, and quality-of-life data (Table 2). Also included are study characteristics, such as study identifier and study design. In some cases, patients’ records were missing the values for one or more of the variables within an element. For example, the value for unilateral pain was recorded as missing if the study in which the patient was enrolled did not collect this information or if the patient failed to provide data. The level of detail contained in the database varied from study-specific (e.g. protocol title), to patient-specific (e.g. demographic characteristics), to event-specific (e.g. baseline characteristics for an attack), to time-specific (e.g. 1 h after the first dose of study medication for an attack).
Elements Included in the aggregated database


Not listed: Quality of life data elements.
Endpoints of migraine clinical trials can be derived from these data variables. Derived endpoints include headache response (shift from moderate or severe baseline pain to mild or no pain), pain-free response (shift from moderate or severe baseline pain to no pain) and sustained headache relief (i.e. headache response accompanied by no use of rescue medication and no headache recurrence within 24 h). To ensure consistency of approach, raw data originally entered and validated directly from patients’ headache diaries and case report forms (CRF) were aggregated and used to compute these and other possible endpoints even if the available data already contained derivations of these endpoints. The privacy of the individual subjects is protected in accordance with the original consent signed by the subjects, because only data entered during the original study were considered for aggregation. The aggregated data do not contain information that would allow identification of named individuals.
Several challenges arose during data aggregation (Table 3). For example, retrieving data collected over a span of more than a decade and stored on different computer platforms and operating systems (e.g. UNIX, VMS) in different countries consumed significant time and resources. Standardizing data obtained using various data collection methods was also challenging because of inconsistent coding of variables among studies. One example of inconsistency among the study databases is in the collection and entry of the migraine-associated symptoms of nausea and vomiting. Some studies asked whether the patient had nausea at a specific time point and whether the patient had vomiting at the time point (i.e. two questions, two answers). Some studies asked whether the patient had nausea and/or vomiting at a specific time point (i.e. one question, one response). Further complicating the issue, only the positive responses were databased for some studies, leaving patients without the symptom with a missing value for the variable. These individual-study data had to be converted to the standardized SNAP codings in order for the data to be included in the aggregated database. The SNAP database contains three dichotomous variables relating to these symptoms: nausea, vomiting, and nausea/vomiting. If a study asked about the combined symptoms (i.e. nausea and/or vomiting), that response was used for the nausea/vomiting variable, and the two separate variables were left missing. If the study collected data on the symptoms separately, those data were used in the two separate variables. The combined variable was then calculated from the separate variables. (If nausea was present OR vomiting was present, then nausea/vomiting was set to yes. If both nausea and vomiting were absent, then nausea/vomiting was set to no. If the answers to both questions were missing, then nausea/vomiting was left missing.) For missing values, if the only values entered in the study database were positive responses it was assumed that all missing responses to the question for that study were actually negative responses (i.e. symptom not present). For studies that had both the positive and negative responses entered in the database, missing values were left as missing. This is just one example. The data throughout the SNAP database had to be checked to see that the same coding was used throughout the database, with appropriate translations from the original study data.
Challenges of data aggregation

Challenges and problems that arose during data aggregation were logged and reviewed by the full data aggregation team on a regular basis. When necessary, other GlaxoSmithKline members of the SNAP study group were consulted to assist with resolution.
Validation
After the data had been aggregated, the aggregation was validated. Figure 1 is a schematic of the validation process. Several issues were considered in determining the approach to validating the aggregation:
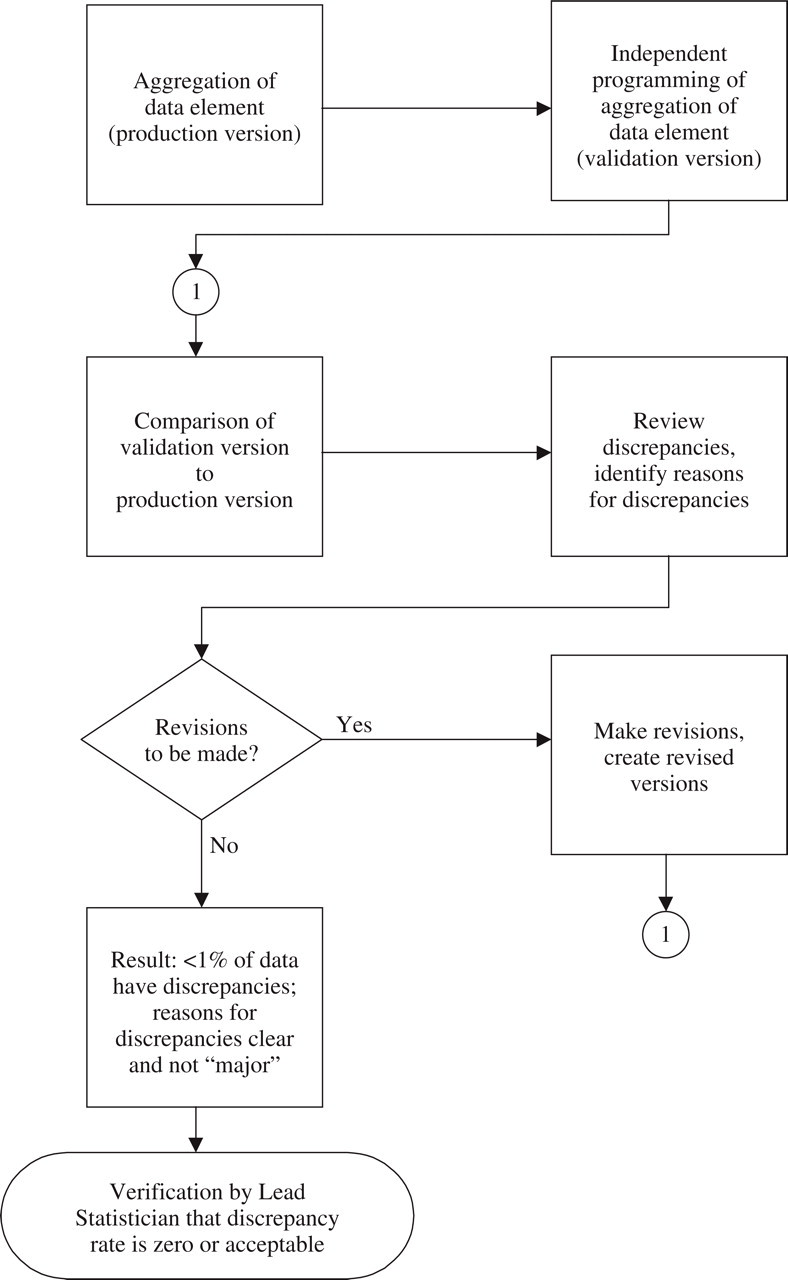
Process map of validation of aggregation.
Should the aggregation be validated via a new, complete, independent programming of the aggregation or via a series of crosschecks?
A complete, independent programming of the aggregation was considered to be time-consuming but more likely than a simpler crosscheck approach to identify potential problems in the aggregation. In the interest of ensuring the soundness of the aggregation and the validity of the analyses and conclusions based on the aggregated data, a new, independent programming of the initial aggregation was performed to determine whether the results of the aggregation could be replicated. This validation programming followed the rules, conventions, and algorithms established during initial aggregation of the data, creating a validation database. The validation database was compared to the database generated during the initial aggregation. Any discrepancies were investigated and resolutions agreed among the aggregation and validation team members. The final result was that less than 1% of the data did not match exactly between the SNAP database and the validation database).
Should individuals who were involved in the aggregation or individuals who were not involved in the aggregation perform the validation?
To ensure the rigor and objectivity of the validation, individuals did not validate sections of the data that they had previously aggregated. Independent contractors were hired for the validation of the aggregation of key components (e.g. efficacy).
Should validation occur while aggregation is in process or after aggregation is complete?
A sequential approach was adopted in creating and validating the aggregated database. During the first stage, the demography, study medication, concurrent and rescue medication use, baseline migraine characteristics, and efficacy elements were aggregated. During the second stage, the aggregation of these elements was validated; and the adverse event, premature study withdrawal, and vital signs elements were aggregated. During the third stage, the second stage aggregation was validated, and quality-of-life elements (which were less numerous and complex than the other elements) were aggregated and validated. The sequential approach in the first two stages was taken to allow complete separation of the aggregation and validation. It also allowed the team to consider the database as a whole in making strategic decisions and decisions about standardization. The validation of a group of studies began as the aggregation for the group was completed.
Should all data or a random sample of data be validated?
The decision to perform an independent programming to replicate the results of the aggregation allowed the 100% validation of the data elements. Once the programming was developed, all data were included in the validation.
Analysis
For initial data analysis, the SNAP Study Group identified a number of questions of interest. The first analyses were thus performed on data from double-blind studies involving sumatriptan tablets 100 mg for the acute treatment of migraine and for the endpoints of headache response and pain-free response 2 h and 4 h postdose. Several additional analyses have been conducted since this initial one, and new analyses are continuously undertaken using a variety of analysis techniques including meta-analysis and data-mining strategies. This section describes the analysis procedures applied to the initial data analysis.
Before the data were analysed, the aggregated data were used to create an analysis-ready dataset according to the following rules:
The last-observation-carried-forward (LOCF) method was used to impute missing values for migraine pain, however, no values were imputed for time points not measured in the original study. For example, if pain status assessment ended at 2 h postdose for a particular study, then the 4 h pain status was coded as missing for that study in the SNAP database rather than using LOCF to impute a value. Similarly, if pain status assessment began at 1 h postdose for a particular study, the 30 minute pain status was coded as missing for that study in the SNAP database.
Pain severity data for patients taking a second dose of study medication or rescue medication was set to ‘severe’ (i.e. a treatment failure) from the time of taking the second dose or rescue medication. (Since the time of these initial analyses, a new algorithm has been implemented, in which the pain severity prior to or at the time of taking the second dose or rescue medication is carried forward to all future pain assessment time points.).
Preliminary analyses were conducted using recursive partitioning, parametric and nonparametric univariate statistical analysis, and regression analysis techniques (4–9). The HelixTree® software from Golden Helix, Inc. was used to perform the recursive partitioning analysis. Version 6.12 of SAS® was used for the other analyses. Recursive partitioning is unique among analysis approaches in its ability to detect the influences of subtle interactions among variables on an outcome. As such, it is helpful in identifying key variables to be considered in follow-up logistic regression analysis. Recursive partitioning is also helpful in addressing the problem of missing values for variables – one of the most salient of several challenges that arose during the preliminary data-analysis phase. The challenge of handling of missing values arose from the fact that the same variables were not always assessed from study to study. Whereas many of the primary efficacy and tolerability variables were consistent across studies, data for other variables were collected in only a subset of studies. For example, not all studies collected data on whether or not headache pain was exacerbated by routine activity. However, because some studies did collect data on this variable and because the SNAP Study Group considered the variable to be important, it was included in the aggregated database despite a large number of missing values for it.
In cases in which the number of missing values was high, recursive partitioning was useful because it can take missing values into account rather than ignoring them. Like the traditional approach of logistic regression, recursive partitioning identifies variables important to determining specified outcomes. For each variable considered in an analysis, recursive partitioning subsets the data based on the values of the variable and then determines whether the outcome of interest(e.g. headache response) differs among the subsets. It repeats this subsetting of the data until it finds the partitioning that provides the most significant splits for the variable. In a recursive partitioning analysis, missing values can be treated as a subset that can be considered alone or grouped with other subsets. For example, a dichotomous variable with yes, no or missing as possible values can be grouped into subsets in any of several ways:
(Yes or missing) and (no)
(Yes) and (no or missing)
(Yes or no) and (missing)
(Yes) and (no) and (missing).
After the partitioning of the data for each variable, the variables are ranked from most statistically significant to least statistically significant in terms of predicting the outcome. The recursive partitioning can then be performed within the subsets of selected variables (by subsetting the subsets) until no statistically significant differences are detected. This approach results in a hierarchical list of variables that are highly correlated with an outcome.
Besides the advantage of accounting for missing values, the ability to explore quickly and efficiently relationships among variables in large datasets also differentiates recursive partitioning from logistic regression (Table 4). While recursive partitioning confers these advantages, its primary disadvantage is a poor ability to identify multiple highly correlated variables determining an outcome. If two variables are highly correlated, for example, it is possible that only one will be detected by recursive partitioning when automatic partitioning is employed. Because of their complementary advantages, both logistic regression analysis and recursive partitioning were employed in preliminary analysis of the SNAP data.
Characteristics of recursive partitioning and logistic regression

Recursive partitioning can be used to develop a tree structure that can be used to summarize complex information in simple terms. A variety of methods can be used to evaluate how well the tree structure represents the data, including split sample validation (select a random subset of the data, compute a tree for it, test the tree using the data not in the random subset) and multiple tree analysis (based on creating many random trees). Future analyses involving SNAP data could include other aspects of recursive partitioning analysis, such as computing resampled estimates of P-values, graphical exploration of interactions and correlations, and multivariate tree analysis.
For the preliminary analyses of the SNAP data, recursive partitioning was used to determine the independent variables that most significantly partitioned the data set into distinct subsets. Parametric and nonparametric analyses were used to confirm the importance of the splits identified using recursive partitioning. The variables identified as important via the recursive partitioning analysis were included in the initial logistic regression model.
Analysis examples
Preliminary analyses have been performed to explore questions such as what factors predict freedom from pain in migraine attacks and what are the effects of early treatment of migraine headaches with oral sumatriptan (10–13).
These preliminary analyses involved only a small subset of the SNAP database. They focused on data from patients using sumatriptan tablets 100 mg in double-blind studies. (If the study was a multi-attack study, only the first treated attack was included in the analysis.) Many more analyses are possible, given the breadth of the database. Examples of some of the research areas being considered include:
multiple attack analyses;
more exploration of the relationship of some predictors to outcome;
other doses and formulations;
exploration of the relationship between demographic characteristics and having an adverse event;
efficacy in subgroups of patients (e.g. specific racial groups or age groups).
Maintenance
Now that the data have been aggregated and preliminary data analysis is complete, maintenance of the SNAP database is guided by the objectives of ensuring that SNAP is a ‘living’ database to which results of newly completed studies are continuously added and increasing the current and future accessibility and usefulness of SNAP analyses and outputs. To meet these two objectives, a SNAP Project Team, consisting of experts in migraine from the clinical, health outcomes, and statistics areas of GlaxoSmithKline, has been established to oversee the SNAP database project on an on-going basis. The project team will consider research questions posed by members of the scientific community as well as analyses requested from within GSK. The project team is then responsible for conducting the analyses and communicating results.
In addition, the project team is responsible for identifying additional studies to be aggregated, setting priorities for the project, and identifying resource needs. A central location accessible by other GlaxoSmithKline migraine team members will be maintained by the SNAP Project Team for the purposes of communication and documentation. Decisions made by the project team (such as the criteria for new studies to be aggregated), research questions addressed using SNAP data as well as the approaches to addressing the questions will be documented.
Limitations
Care should be taken in interpreting results from pooled data or meta-analyses. Although a large sample size is associated with many benefits (e.g. increased ability to investigate rare events and explore results in subsets of the population), it can also have the disadvantage of revealing small, clinically meaningless numerical differences to be statistically significant. In addition, the studies being combined are likely not completely independent. Moreover, between-study differences in design or conduct could affect the pooled results. Given these limitations, results should be considered exploratory and hypothesis-generating.
The results of the SNAP database analyses are used for clinical trials planning and the generation and exploration of hypotheses. For example, it was hypothesized that treating a migraine attack while the pain is mild would produce higher rates of sustained efficacy than waiting until the pain is moderate or severe. The SNAP database was queried to confirm that the hypothesis is valid (7). Even though many of the patients in the database treating mild pain were doing so in violation of the protocol, the data served as a tool to evaluate the feasibility of the hypothesis. When combined with theory from experts in migraine, it was decided that sufficient justification existed to design a prospective clinical trial to further explore the question. Additional examples can be found in the use of the SNAP database to explore potential new endpoints and to obtain estimates of variability to use in designing clinical trials.
Conclusions
The SNAP database provides a rich source of data for exploring issues relating to the characteristics and treatment of migraine. With an extremely large sample size, the SNAP database allows exploration of questions about migraine and the efficacy and safety of migraine medications that cannot be answered in clinical trials enrolling smaller numbers of patients. Besides providing the adequate sample size to address specific questions and facilitate data-mining, the SNAP database allows for subgroup analyses that are not possible in individual trial analyses due to small sample size. The SNAP database exemplifies how the wealth of data from pharmaceutical company-sponsored clinical trials can be re-used by the company, thereby continuing to provide benefit.
Footnotes
Acknowledgements
The following individuals are acknowledged for their work in the aggregation, validation, and analysis of the SNAP data: Martha Fabri, Mark Foxwell, Ed Carr, Kelvin Barr, Sam Miao, Todd Eggleston, Cathy Edwards, Allison Elledge Howell, and Carol Lubbers. The authors acknowledge Jane Saiers, PhD, for assistance with writing the manuscript. The authors also thank the referees for their comments and suggestions. The SNAP database is supported by GlaxoSmithKline.
Members of the SNAP Study Group at the time of the aggregation and analysis discussed in this paper were:
S. Randall Austin, Cathy Barrows, Timothy A. Kuhn, Hank Mansbach, Gayla Putnam and William Saunders (GlaxoSmithKline, Research Triangle Park, USA), Hans-Christoph Diener (University of Essen, Germany), Michel Ferrari (Leiden University Medical Centre, the Netherlands), Peter Goadsby (Queen Square, London, UK), Richard Lipton (Albert Einstein College of Medicine, USA) and K. Michael Welch (Finch University of Health Sciences, The Chicago Medical School, USA).