
Abstract
Brain plasticity is an important mechanism for functional recovery from a cerebral lesion. The authors aimed to visualize plasticity in adult rats with a neonatal freeze lesion in the somatosensory cortex using functional magnetic resonance imaging (fMRI), and hypothesized activation outside the primary projection area. A freeze lesion was induced in the right somatosensory cortex of newborn Wistar rats (n = 12). Sham-operated animals (n = 7) served as controls. After 6 or 7 months, a neurologic examination was followed by recording of somatosensory evoked potentials (SSEPs) and magnetic resonance experiments (anatomical images, fMRI with blood oxygen level–dependent contrast and perfusion-weighted imaging) with electrical forepaw stimulation under α-chloralose anesthesia. Lesioned animals had no obvious neurologic deficits. Anatomical magnetic resonance images showed a malformed cortex or hyperintense areas (cysts) in the lesioned hemisphere. SSEPs were distorted and smaller in amplitude, and fMRI activation was significantly weaker in the lesioned hemisphere. Only in a few animals were cortical areas outside the primary sensory cortex activated. The results are discussed in respect to an apparent absence of plasticity, loss of excitable tissue, the excitability of the lesioned hemisphere, altered connectivity, and a disturbed coupling of increased neuronal activity to the hemodynamic response.
Keywords
After irreversible injury of brain tissue, functional recovery can still occur when unaffected brain regions take over initially lost functions. This process is usually termed plasticity or, more specifically, reparation plasticity (Trojan and Pokorny, 1999), and is probably the major mechanism underlying compensation for perinatal brain damage (Kolb et al., 2000; Vaccarino and Ment, 2004) and other brain injuries or stroke rehabilitation (Johansson, 2000). Experimental data suggest that stimulation of plasticity (e.g., by an enriched environment or by pharmacological interventions) could be a rewarding strategy for brain injury rehabilitation (Johansson, 1996; van Praag et al., 2000).
In the present study, we aimed to visualize plasticity by means of functional magnetic resonance imaging (fMRI) as a noninvasive, dynamical method to map functional activation of brain regions using either blood oxygenation level–dependent (BOLD) contrast or perfusion-weighted imaging (PWI). We chose a model with an expected high chance for plasticity: Compared with the adult brain, the immature, developing brain exhibits a higher potential for compensating structural damage because developmental compensatory mechanisms may promote neural and functional plasticity (Kolb et al., 2000; Vaccarino and Ment, 2004). We produced a focal freeze lesion in the primary somatosensory cortex (S I) of neonatal rats at day P0 (Dvorak and Feit, 1977; Luhmann and Raabe, 1996; Rosen et al., 1992). This procedure leads to the formation of a microgyrus with only four cortical layers, which resembles human polymicrogyria. This pathology is often associated with epilepsy in humans, and electrophysiologic in vitro slice studies in this animal model revealed enhanced, epileptiform excitability around such foci (Chevassus-au-Louis et al., 1999; Jacobs et al., 1996; Luhmann and Raabe, 1996; Luhmann et al., 1998b).
The animals were examined at 6 to 7 months of age. After a neurologic examination of the awake animals, we recorded somatosensory evoked potentials and performed fMRI experiments under α-chloralose anesthesia (Ueki et al., 1988). We hypothesized that brain activation after electrical forepaw stimulation would appear outside the lesioned area, either in adjacent or remote cortical regions (Luhmann, 1996), or even in the unlesioned hemisphere (Macdonell et al., 1999; Ono et al., 1991).
Because the in vitro studies showed an increased excitability, we also expected increased fMRI activation in the lesioned animals as compared with controls.
MATERIALS AND METHODS
Neonatal freeze lesion
Animal handling and surgery were performed in accordance with animal protection guidelines and approved by local authorities.
At the day of birth, a cortical freeze lesion was produced in the right somatosensory cortex (S I) of Wistar rats (n = 12, several litters); details are given elsewhere (Dvorak and Feit, 1977; Luhmann and Raabe, 1996). Briefly, animals were anesthetized by hypothermia, the skull was exposed, and a liquid-nitrogen–cooled copper cylinder of 2 mm diameter was placed above the right somatosensory cortex for 10 seconds. In sham-operated animals (n = 7) the copper cylinder had room temperature. The wounds were closed and the animals were allowed to recover and grow up in cages housing two or three animals.
Neurologic examination
After a period of 6 or 7 months, a brief neurologic examination (blinded to animal group) was performed. The examination consisted of observing the animals' behavior (e.g., feeding, walking, grooming, whisker movements), lifting the animals by their tails and observing their grip to the bars of their cages, and pinching the forepaws with forceps to elicit withdrawal.
Animal preparation for fMRI experiments
Animals were anesthetized (1% to 1.5% halothane in 30:70 O2:N2O) and the right femoral artery and vein were catheterized for blood pressure recording, blood gas sampling, and drug administration. After tracheotomy, animals were artificially ventilated and paralyzed with pancuronium bromide (0.2 mg · kg−1 · h−1). The wounds were treated with lidocaine (Xylocaine) spray before closure. After surgery, anesthesia was switched from halothane to intravenous α-chloralose (initial bolus of 80 mg · kg−1, then 40 mg · kg−1 every 90 minutes) and N2O was replaced by N2.
During the fMRI experiments, body temperature was recorded with a rectal thermocouple and kept at 37°C with a feedback-controlled warm-water blanket. Arterial PO2, PCO2, and pH were measured at regular intervals and kept within the physiologic range. Blood glucose and hematocrit were determined at the beginning and the end of experiments.
The scalp was shaved and depilated. Graphite electrodes, covered with contact gel and Parafilm, were placed bilaterally above the somatosensory cortices for EEG recording. These two electrodes were referenced to an indifferent electrode on the nose of the animals. Needle electrodes for electrical forepaw stimulation were placed subcutaneously at the palmar side of the wrist. Care was taken to position all the electrodes as symmetrically as possible.
Stimulation and recording of somatosensory evoked potentials
Rectangular constant current pulses (0.3 milliseconds, 1 or 3 Hz) were applied using a stimulator with an isolation unit (B. Radermacher, Max-Planck-Institute for Neurological Research, Germany). For recording of somatosensory evoked potentials (SSEPs), the EEG was amplified 1000-fold, bandpass filtered between 5 and 1,000 Hz, digitized at a sampling rate of 2,000 Hz, and transferred to a PC. Averaging 100 triggered, single evoked potentials with the program DasyLab (DATALOG, Mönchengladbach, Germany) yielded one SSEP. Paws were stimulated in an alternating fashion and a total number of six SSEPs (three per paw) were recorded per animal. The amplitude and latency of the first positive peak, P1, the first negative peak, N1, the second positive peak, P2, and the overall SSEP amplitude were measured for each SSEP. When these peaks were not present, only the overall amplitude of the SSEP entered analysis.
Functional magnetic resonance imaging
Experiments were conducted at 7 T using a Bruker Biospec DBX system (Bruker Medical, Ettlingen, Germany) with a 30-cm bore magnet equipped with actively shielded gradient coils (200 mT · m−1). Radiofrequency pulses were applied with a Helmholtz coil (12 cm diameter) actively decoupled from the inductively coupled surface receiver coil (2.3 cm diameter), which was placed over the skull of the animals. Multislice sagittal FLASH images of the animal were used to position the central coronal imaging plane 4.5 mm posterior to the rhinal fissure. After local shimming on a volume of approximately 15 × 15 × 6 mm3, the proton line width at half maximum was typically between 12 and 20 Hz.
For anatomical lesion characterization, seven coronal inversion recovery spin echo images (echo time [TE] of 20 milliseconds, repetition time [TR] of 5,000 milliseconds, inversion time [TI] of 400 milliseconds, 3 × 3-cm2 field of view [FOV], slice thickness 1.7 mm, 1282 matrix, seven coronal slices) were acquired, again with the central slice positioned 4.5 mm posterior to the rhinal fissure.
To include unexpected, unknown activation areas in lesioned animals, we covered large parts of the brains with altogether three fMRI imaging modalities:
Multislice T2*-weighted images were acquired with a segmented (n = 2) echoplanar imaging sequence (TE 33.3 milliseconds, TR 1,500 milliseconds, 3 × 3-cm2 FOV, slice thickness 1.7 mm, 1282 matrix, slice separation of 0.1 mm, three coronal slices). Echoplanar-imaging–inherent ghosting was minimized using preceding reference scans with identical scan parameters but switched off phase encoding (Bruder et al., 1992). Reconstruction incorporating the reference scan was performed using the manufacturer's scanner software (ParaVision 2.1.1).
A horizontal, T2*-weighted slice covering large parts of the dorsal cortex was obtained with a conventional gradient echo sequence (TE 20 milliseconds, TR 70 milliseconds, flip angle α = 22.5°, 3 × 3-cm2 FOV, slice thickness 2 mm, 642 matrix).
Finally, perfusion-weighted images were acquired in the central coronal slice using arterial spin labeling with snapshot FLASH imaging (α = 18°, TE 3.9 milliseconds, TR 7.4 milliseconds, 3 × 3 cm2 FOV, slice thickness 2 mm, 128 × 64 matrix) (Kerskens et al., 1996).
We switched 45-second periods of “off” versus “on” stimulation (3 Hz, 1 mA, 0.3 milliseconds) four times, resulting in a total of 80 T2*-weighted echoplanar images and 40 perfusion-weighted images per block, respectively. Right and left paws were alternately stimulated and animals were allowed to rest for at least 5 minutes between the stimulation sessions. A total of 18 stimulation blocks were applied per animal, six for each of the three modalities.
Image processing
Statistical parametric maps were calculated from the experimental data using the software package STIMULATE (Strupp, 1996); the details of the analysis have been described earlier (Burke et al., 2000). Briefly, images were filtered with a Gaussian-shaped filter function and the time course of each pixel was examined by a paired Student's t-test with the null hypothesis that the mean value of the signal intensities for this pixel acquired without stimulation is the same as the mean signal intensity under stimulation. When this hypothesis was rejected with a confidence level of P ≤ 0.01, the pixel was marked as activated in the statistical parametric map. After calculation of the statistical parametric map, the statistical significance for each cluster of activated pixels was calculated. To control the rate of false-positive error due to multiple comparisons, we used the procedure described by Xiong et al. (1995). Only clusters with a confidence level of P ≤ 0.05 entered further analyses.
For these clusters, we then calculated three parameters, separately for each hemisphere:
The mean activated area (AREA), by multiplying the number of activated pixels with the pixel size (mm2).
The mean BOLD and PWI signal intensity increases (ΔSIBOLD, ΔSIPWI (%)).
The product of AREA and ASI, which was termed ACT (mm2 ϗ %), as a measure for the overall activation.
To obtain a measure for the symmetry of activation between the hemispheres, we calculated the hemispheric directional asymmetry coefficient AC [AC = 2 (R – L)/(R + L)] (Zilles et al., 1996)) for all fMRI parameters and SSEP amplitudes for successive stimulations (where R is the measure of the respective parameter obtained for the right and L for the left hemisphere, respectively). Hence, an AC of −2 means solely left hemispheric activation, zero stands for symmetrical, and +2 for solely right hemispheric activation. Because successive stimulations were compared, this procedure also removes some of the variability caused by small variations of physiologic parameters and depth of anesthesia.
Analysis of variance was used for group comparison and Tukey honestly significant difference test was applied for post hoc analyses (SPSS 8.0).
RESULTS
Neurologic examination
None of the animals showed obvious neurologic deficits. They were moving normally, used both forepaws (e.g., for grooming, holding food pellets, climbing, holding onto the bars of the cages), and were withdrawn equally upon pinching with forceps. Also, the whiskers were used symmetrically for exploration. Without extensive behavioral testing, it was impossible to distinguish between lesioned and control animals.
Physiologic parameters
The physiologic parameters were kept in the physiologic range throughout the activation experiments by adjusting artificial ventilation and administration of appropriate amounts of sodium bicarbonate if necessary. Stimulation with 1 mA did not cause any changes of blood pressure or heart rate in any animal, which was interpreted as an absence of painful stimuli.
Morphology of freeze lesion
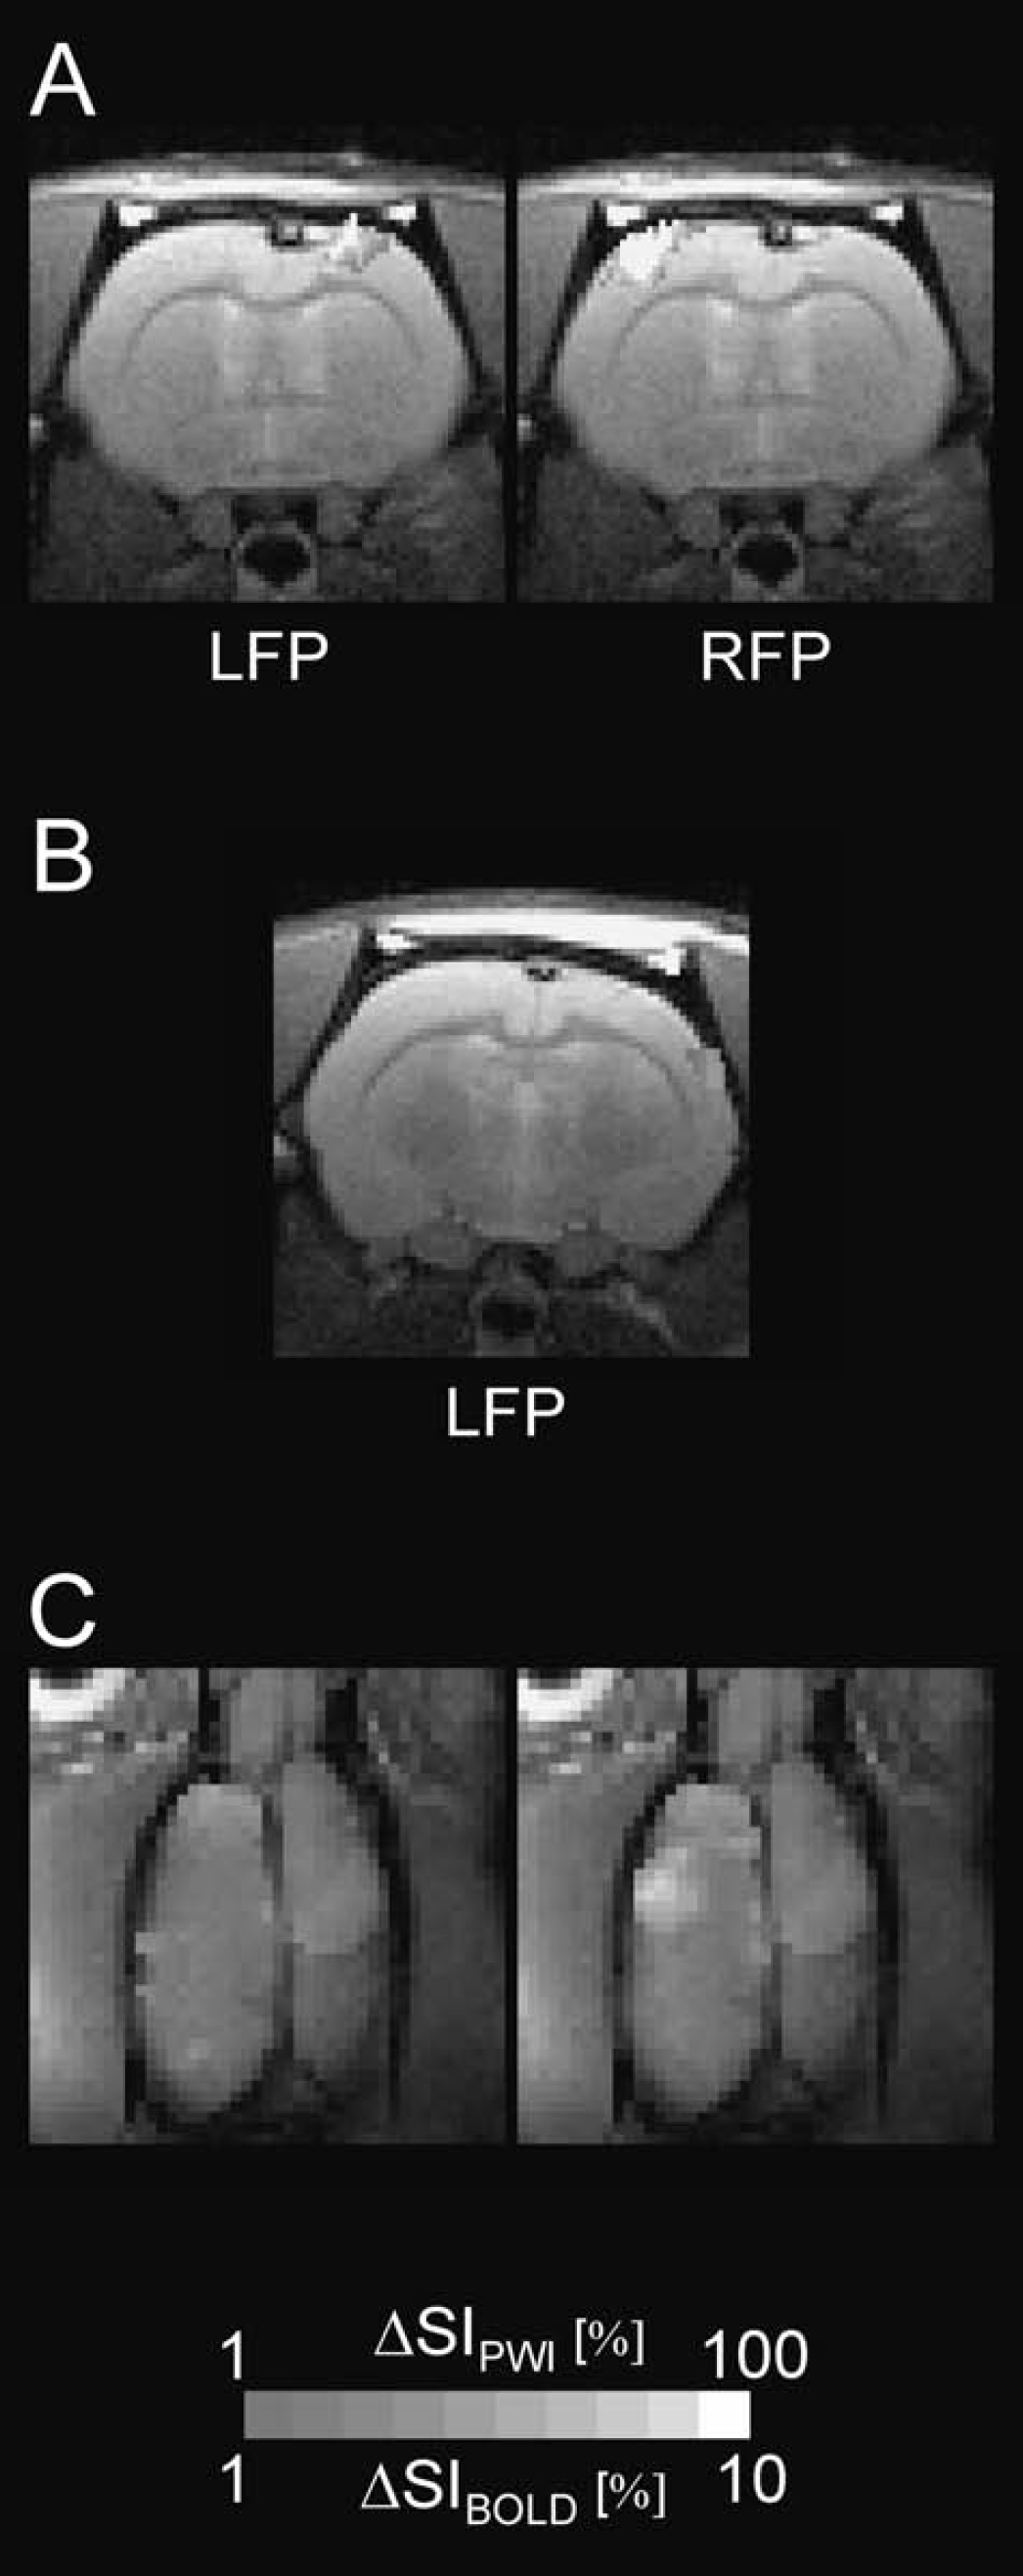
Whereas expectedly no lesion was observed in sham-operated controls (Fig. 1 A), two forms of lesions were seen in the anatomical magnetic resonance images of freeze-lesioned animals. The prevailing lesion type I (L1, n = 9) was characterized as a reduced thickness of the cortex and sometimes a faintly visible microsulcus (Fig. 1B) in the MR images. The macroscopic correlates, typical of microgyria, were a scar like formation in the somatosensory cortices of these animals (Fig. 1B). In contrast, lesion type II (L2, n = 3) presented sharply demarcated areas with a high signal intensity, similar to that of cerebrospinal fluid (Figs. 1C and 3C). When the brains were removed, the pathomorphologic correlates turned out to be porencephalic cysts (Rosen and Galaburda, 2000).
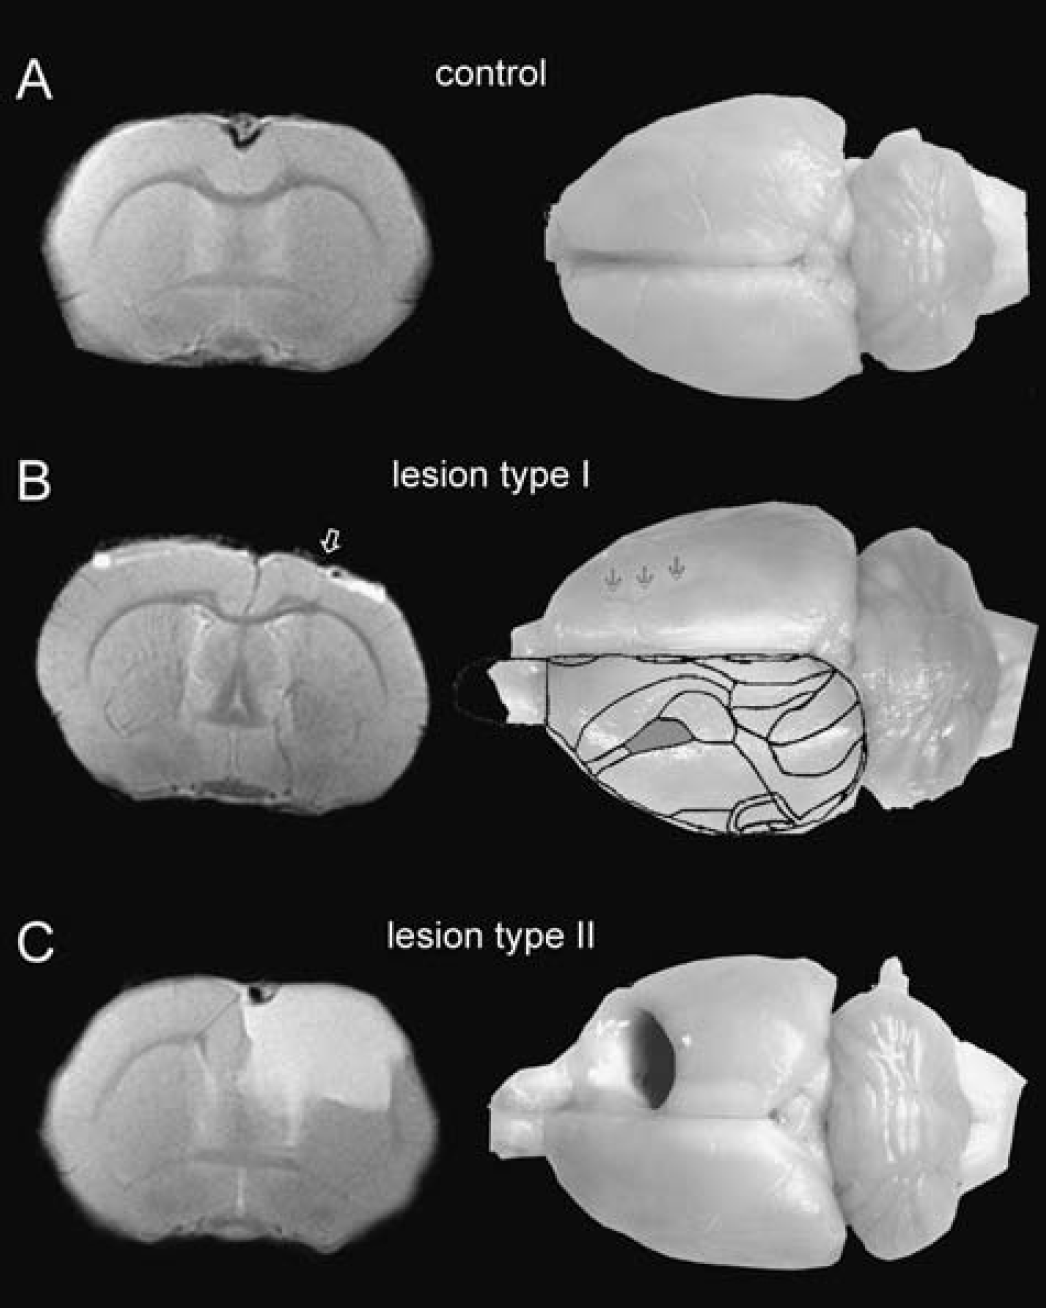
Representative anatomical inversion recovery images and perfusion-fixed brains of (
All lesions were located in the somatosensory cortex. For comparison, the somatosensory forelimb area is superimposed onto the unaffected hemisphere in Fig. 1B (modified from Paxinos, 1994).
The extent and location of the lesions varied to some extent. One of the porencephalic cysts was rather large (Fig. 1C), replacing the frontal part of the right hemisphere nearly completely.
Somatosensory evoked potential recordings
The SSEPs recorded in sham-operated animals were symmetrical on both hemispheres. The SSEPs recorded from the lesioned cortex of either lesion type (L1 and L2) were reduced in amplitude, distorted, or, in single cases, even completely abolished (Fig. 2).
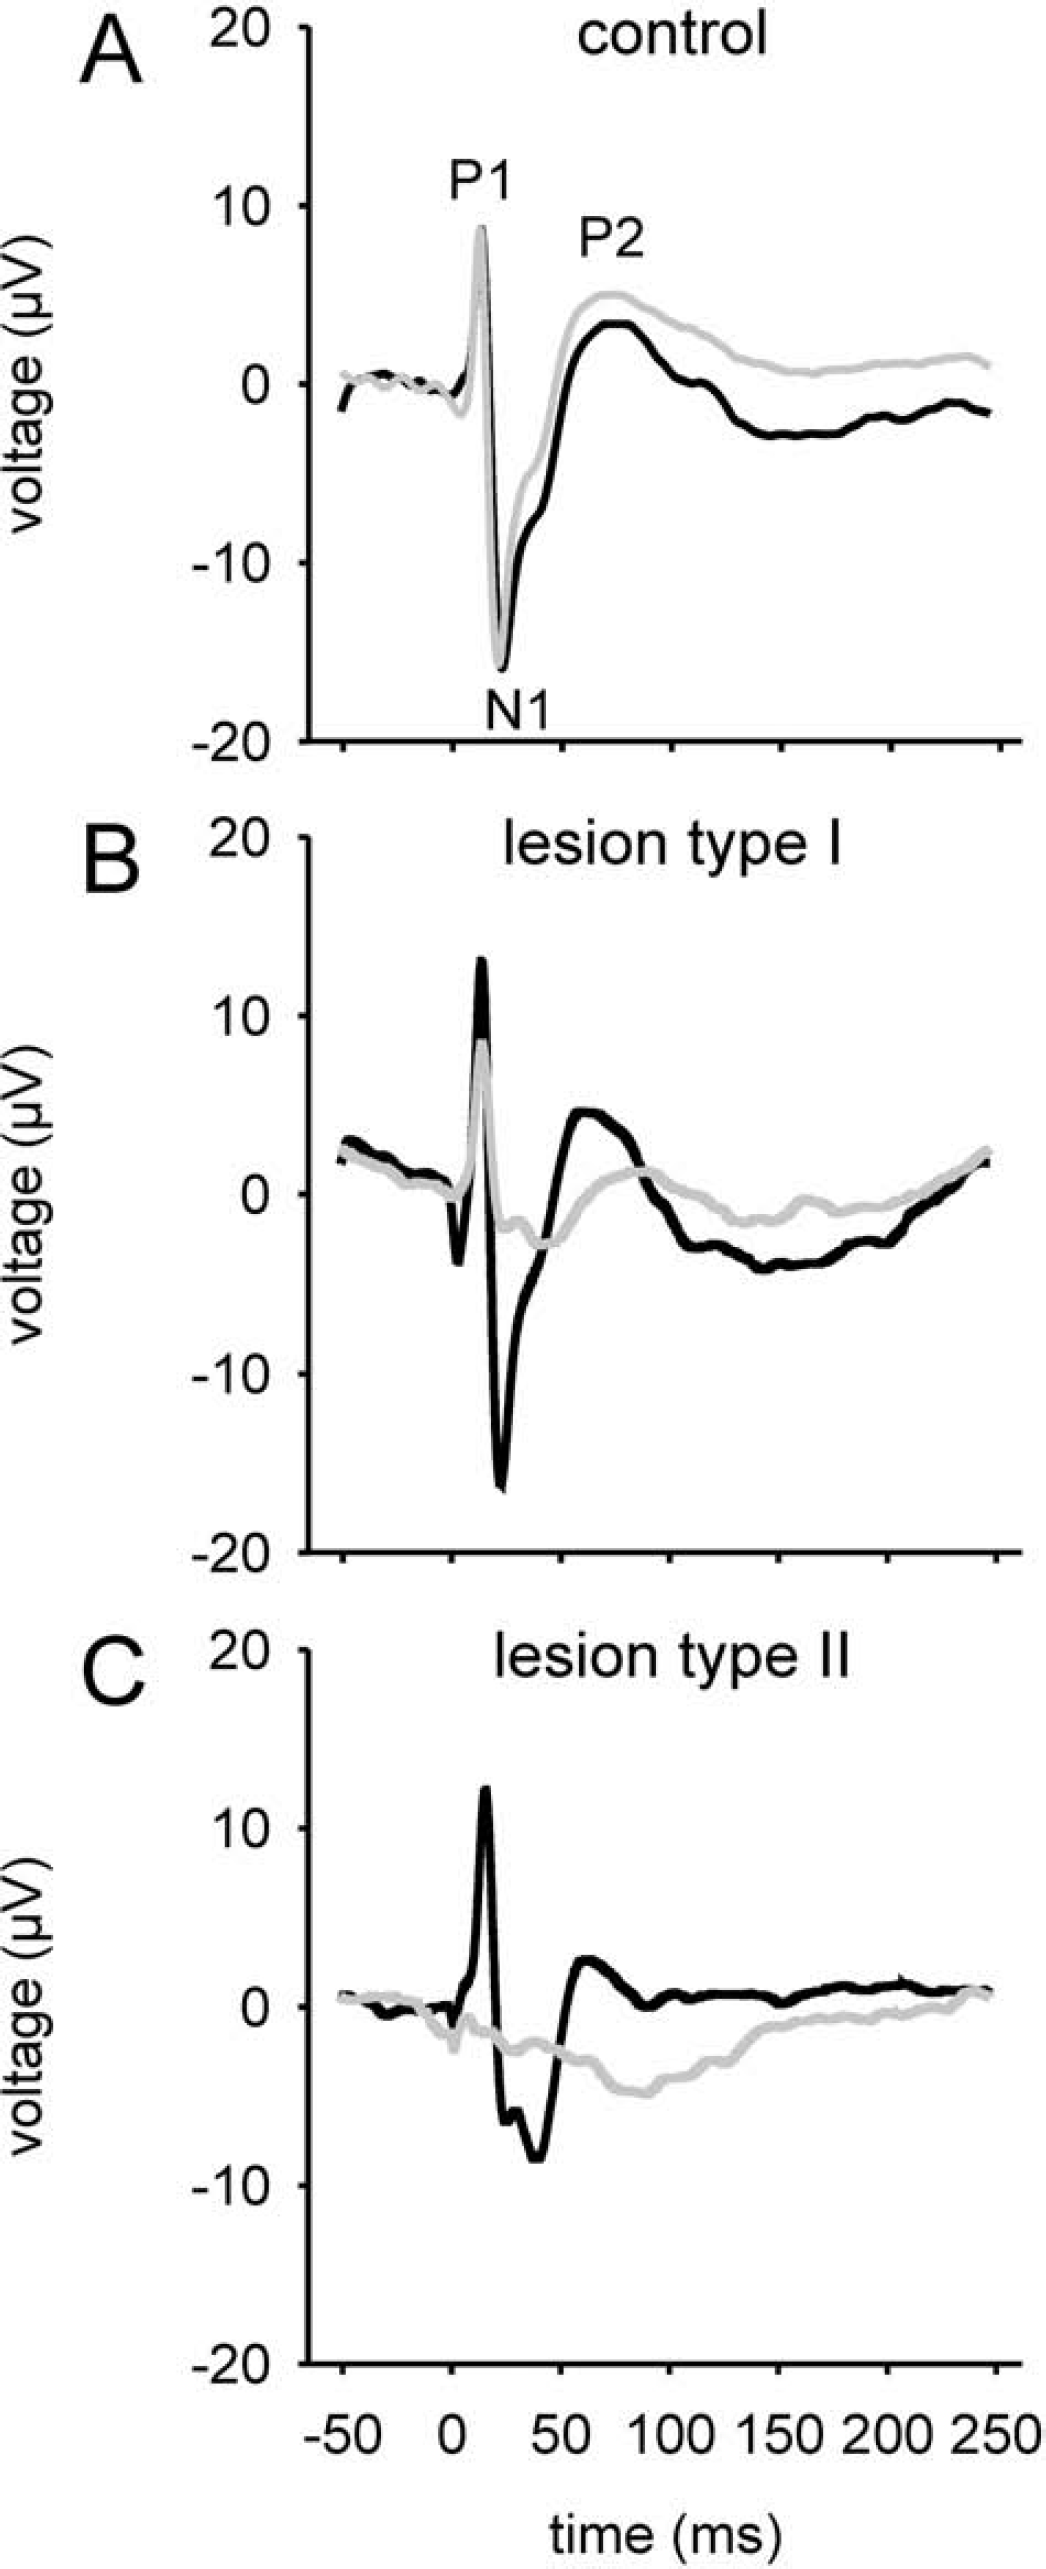
Somatosensory evoked potentials (SSEPs) recorded from left (black curves) or right/lesioned (grey curves) hemispheres contralateral to the stimulated paw. Panels
This is also reflected by the data presented in Table 1. The lesioned hemisphere P1, N1, P2, and the overall amplitudes were significantly reduced for both lesion types, compared either with the unlesioned hemisphere or with the response above the corresponding hemisphere of control animals.
The asymmetry coefficient AC of the SSEP amplitudes mirrored these changes: it was close to zero for the control animals, indicating equivalent amplitudes on both hemispheres, and −0.62 and −1.25 for the L1 and L2 groups, respectively, reflecting larger SSEPs on the left, unlesioned side (Table 1). The ACs were highly significantly different from control animals as well as between the two lesion types (P < 0.01, respectively).
Whereas the SSEP amplitude was generally reduced over the lesioned hemisphere, increased average SSEP amplitudes as well as P1 and N1 amplitudes were found for the unaffected hemisphere of L1-type animals as compared with controls (P < 0.01). The same trend was observed in the L2 group, but only the N1 amplitude reached significance (P < 0.05), whereas P1 was similar to controls.
Functional magnetic resonance imaging
As in previous experiments (Brinker et al., 1999; Ueki et al., 1992), fMRI activation was mainly seen in the primary somatosensory cortex (S I area) contralateral to the stimulated forepaw. The S II area occasionally showed some activated pixels, and in approximately 9% of all stimulations we observed activation in S I ipsilateral to the stimulated paw.
Activation contralateral to stimulated paw
Activation in sham-operated animals was fairly symmetrical (Fig. 3A). This finding is confirmed by the asymmetry coefficients (Table 2), which were close to zero, and by the AREA, ΔSI, and ACT measurements for the three imaging modalities (Table 3), which were not significantly different between the right and left hemispheres in the control group.
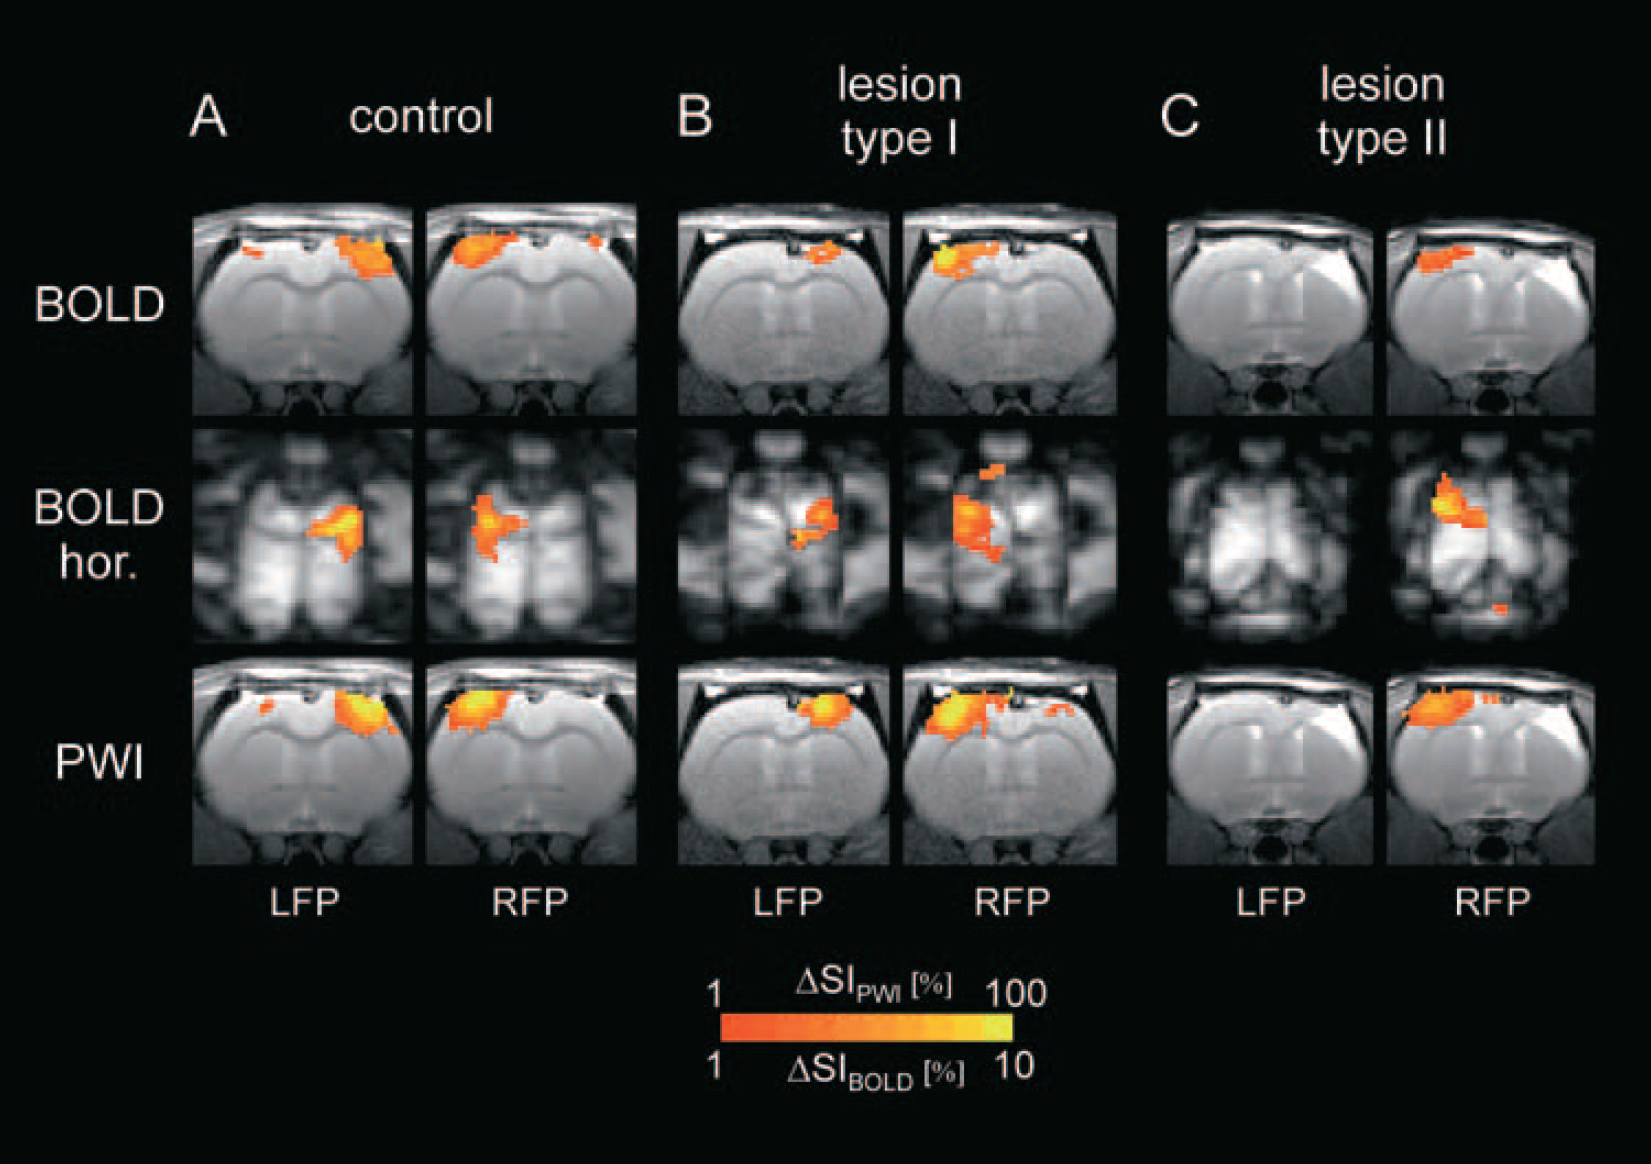
Representative fMRI images for control (
Amplitudes and latencies of SSEPs and their peaks (P1, N1, and P2) and hemispheric asymmetry coefficient (AC) in control and lesional animals from right (lesioned) and left hemisphere upon stimulation of contralateral paw
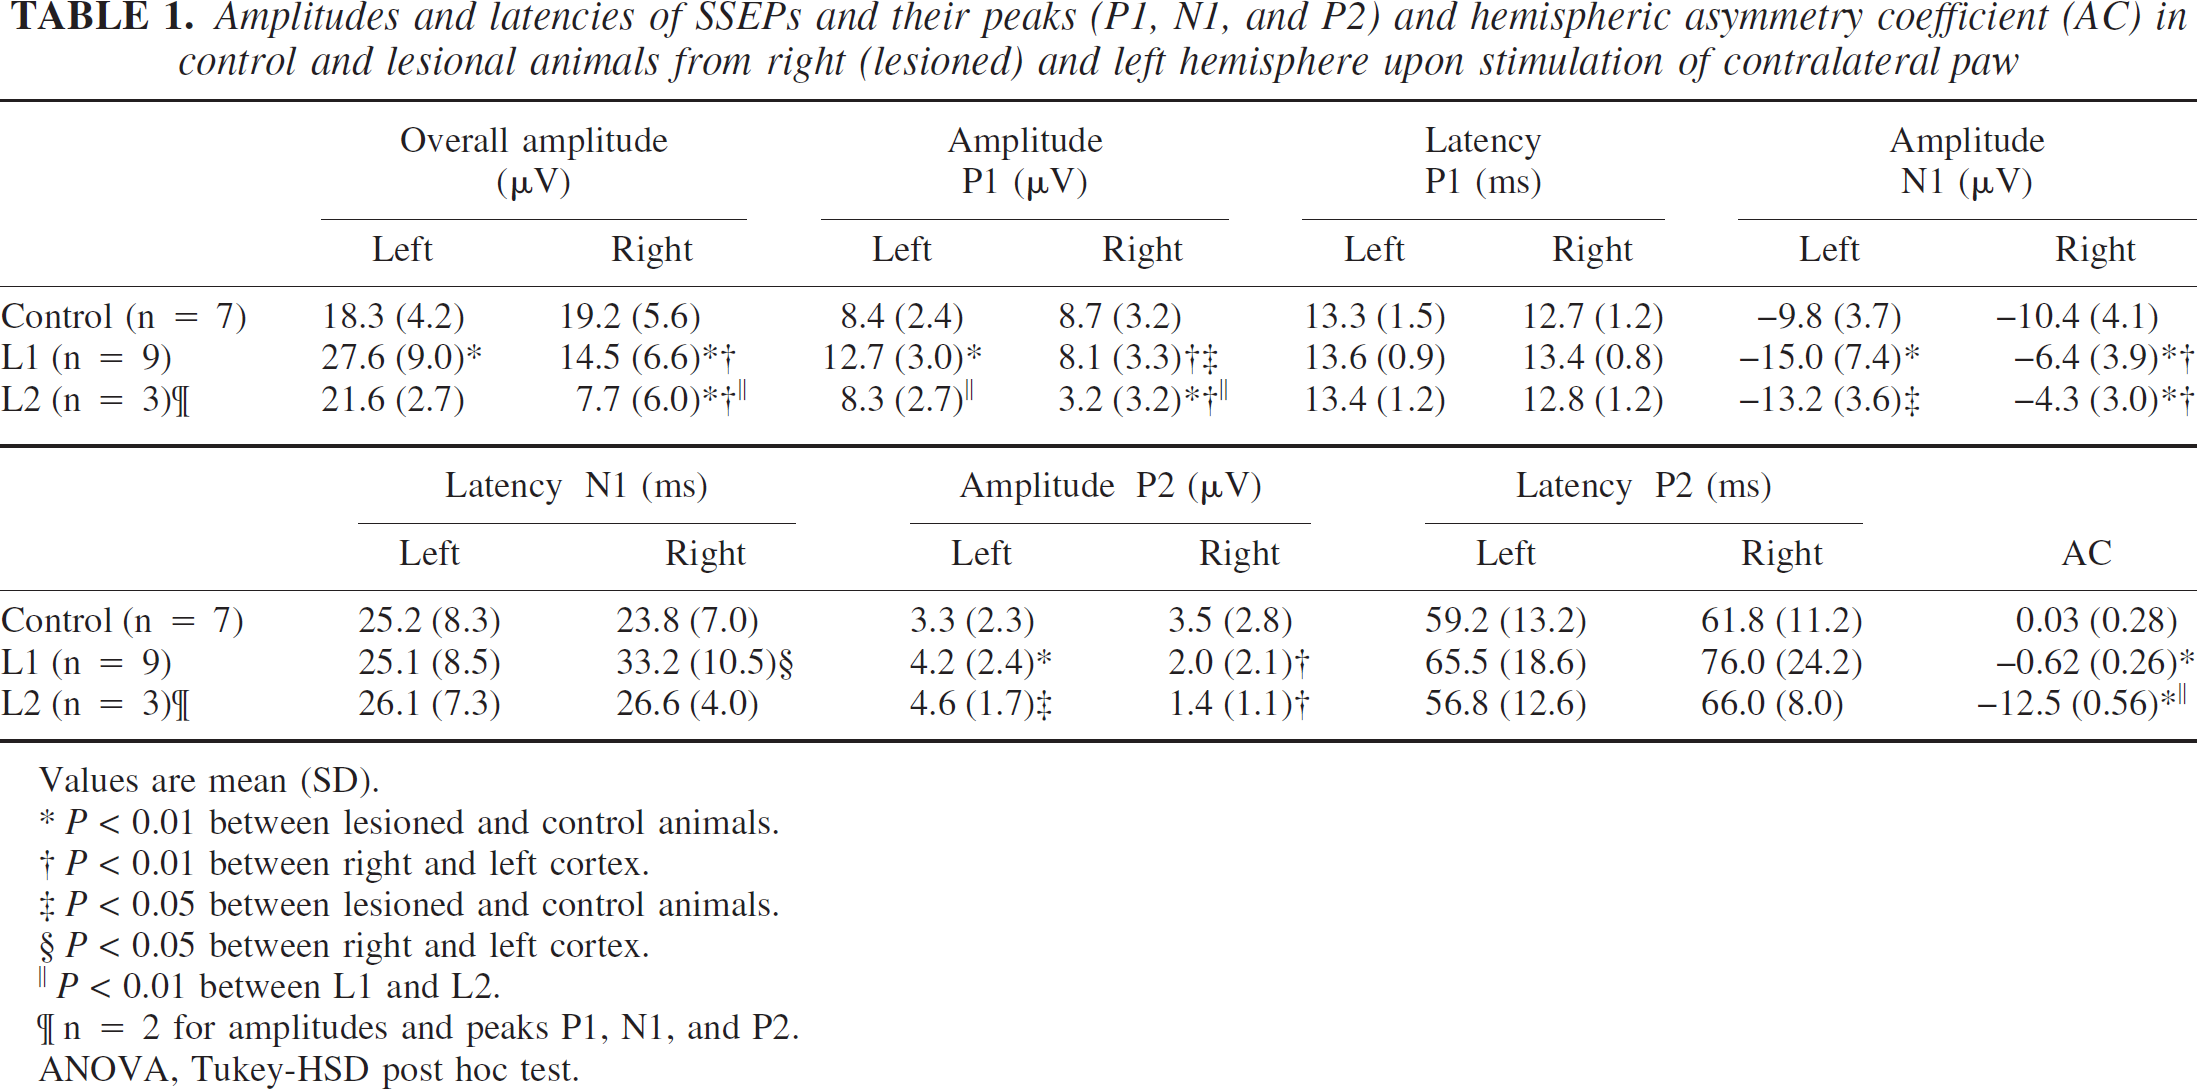
Values are mean (SD).
*P < 0.01 between lesioned and control animals.
P < 0.01 between right and left cortex.
P < 0.05 between lesioned and control animals.
P < 0.05 between right and left cortex.
‖ P < 0.01 between L1 and L2.
n = 2 for amplitudes and peaks P1, N1, and P2.
ANOVA, Tukey-HSD post hoc test.
The response in the lesioned hemispheres, however, was much weaker for both lesion types (Figs. 3B and 3C). AREA, ΔSI, and ACT were significantly smaller in the lesioned hemispheres than in the unlesioned hemisphere and in control animals (P < 0.01; Table 3). Although L2-type animals tended to have smaller values, the only parameter that was significantly different between L1 and L2 was ΔSI for the horizontal BOLD images.
The ACs were negative for all these parameters, indicating the larger activation on the left, unaffected side (Table 2). All ACs for L1 and L2 were significantly different from controls and between both lesion types (P < 0.01), respectively.
Mean (SD) of hemispheric asymmetry coefficient (AC) for activated area (AREA), signal intensity increase (∆SI), and their product (ACT) for the different imaging modalities
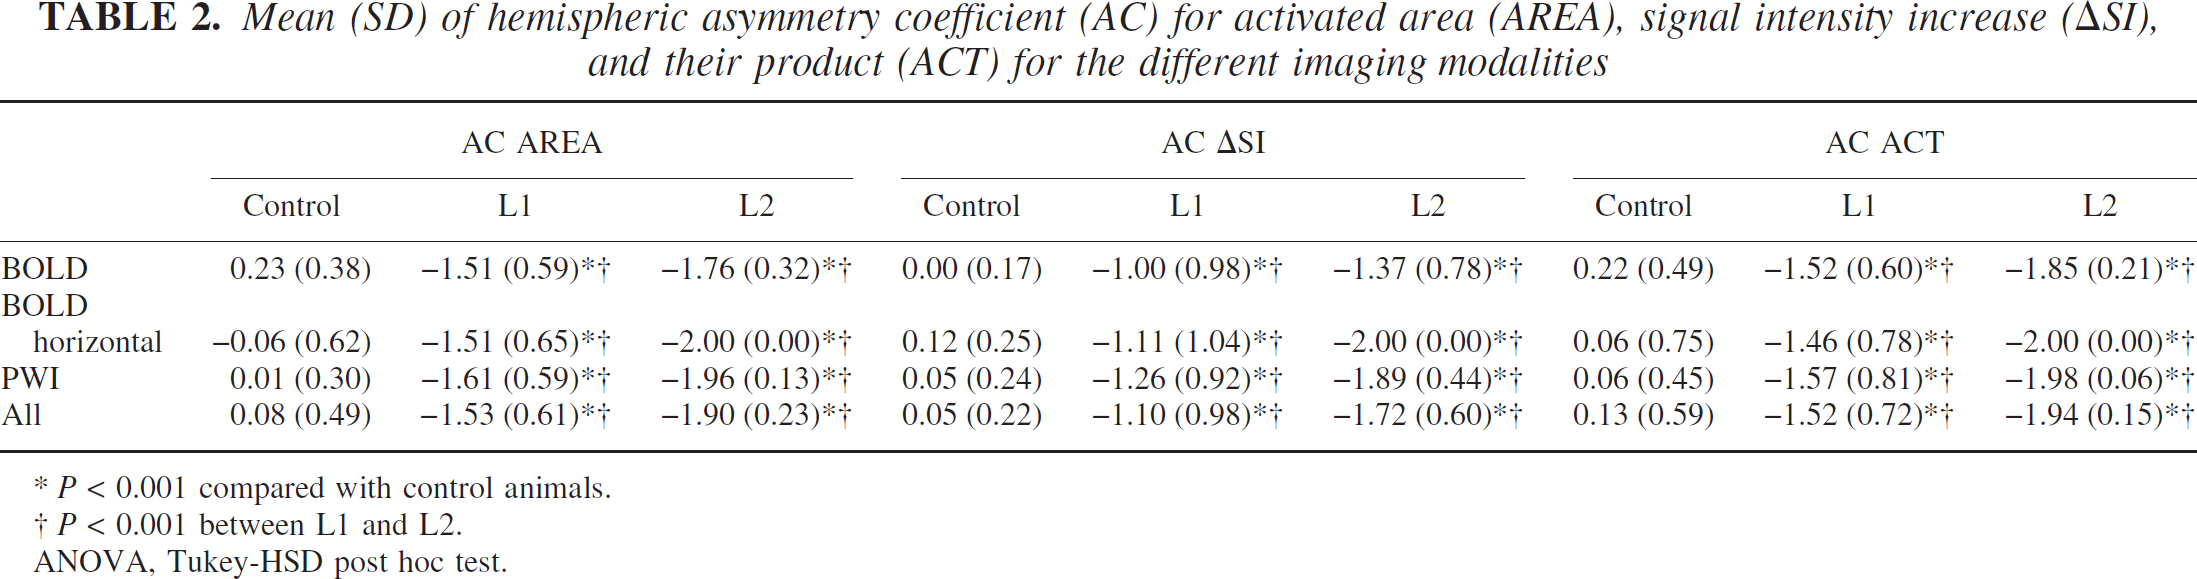
P < 0.001 compared with control animals.
P < 0.001 between L1 and L2.
ANOVA, Tukey-HSD post hoc test.
Although activation of the unlesioned side was not different from the sham-operated animals using the echoplanar and perfusion-weighted images, the horizontal BOLD images, covering larger parts of the cortex, showed an increased activation as compared with controls. Whereas differences in AREA and ACT reached significance (P < 0.01, 0.05 for L1 and L2, respectively), ΔSI was not significantly different from control.
Activation ipsilateral to stimulated paw
The main activation was always seen in the somatosensory cortex contralateral to the stimulated paw. In contrast, activation ipsilateral to the stimulated paw was much weaker and was detected in only about 5% to 12% of all stimulations in the three different animal groups. Whereas its occurrence was again symmetrical in controls, L1 animals showed a higher incidence (12%) on the lesioned side as compared with the unlesioned side (6%). Values for AREA, ΔSI, and ACT were not normally distributed; therefore, we applied the Kruskal-Wallis test as a nonparametric rank-order test. Differences were not statistically different between the groups with the exception of the horizontal BOLD images. Here AREA, ΔSI, and ACT were different, with P values of 0.006, 0.005, and 0.005, respectively. Rank-order testing revealed that lesioned animals had higher ipsilateral activation parameters than controls. The strongest activations occurred in the right hemisphere of L1 animals, followed by the left hemisphere of L2 rats.
Activation outside primary projection areas
Exofocal activation outside S I, the primary projection area, was very rarely observed. In a number of animals the area of activation was shifted slightly medially (Fig. 5A). In others the S II area presented activation (Fig. 5B). There was only a single animal, the one with the enormous porencephalic cyst, where activation occurred predominantly ipsilateral to the left forepaw (Fig. 5C). The activation was found posterior and spatially clearly separated from the area activated by stimulation of the right forepaw. During this experiment, this atypical activation was very reproducible.
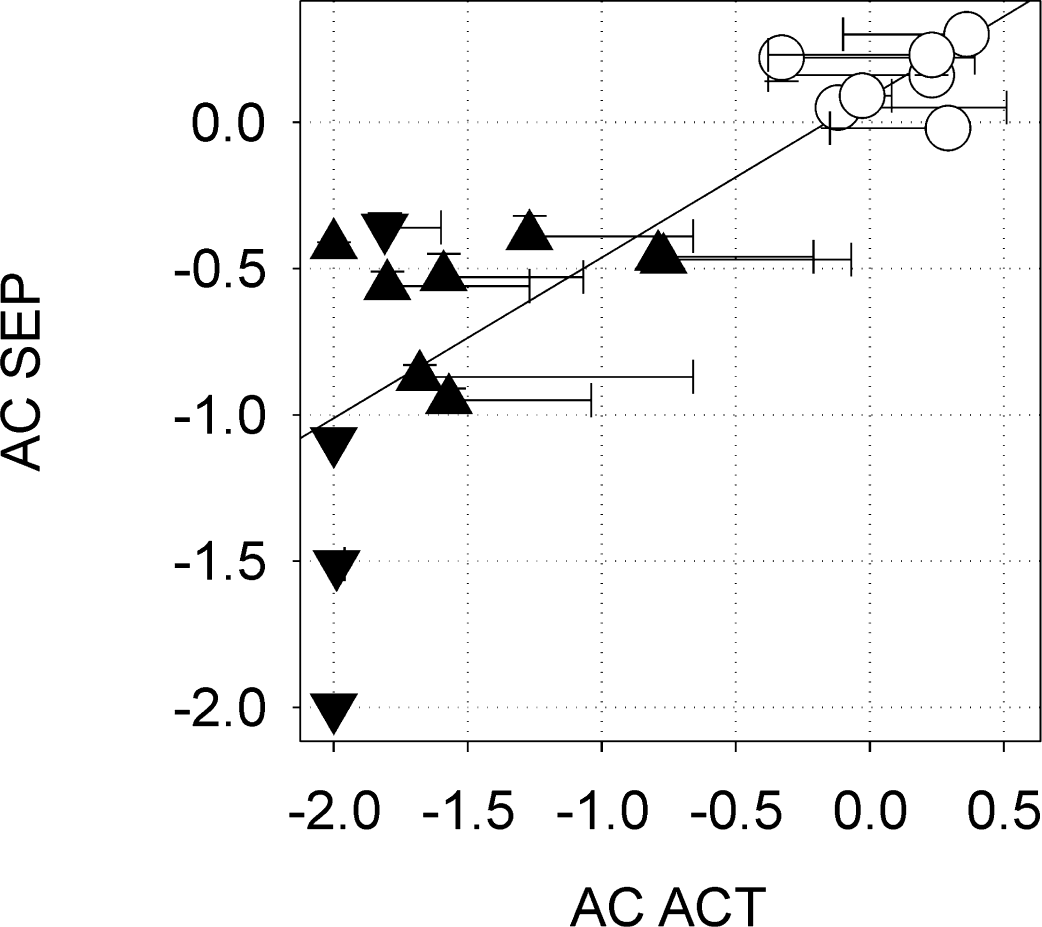
Correlation of hemispheric asymmetry coefficient (AC) of fMRI ACT (activated area times signal intensity change) and SSEP amplitude in controls (○), lesioned animals type I (▴), and lesioned animals type II (θ). Error bars indicate standard deviation. Linear regression, least square fit: R = 0.81, P = 2.3 × 10⁻⁵(Pearson correlation coefficient, two-sided test).
Examples of exofocal activation outside the primary projection area SI. (
It must be emphasized, however, that exofocal activations were a rare finding. The main result of this study is the reduced activation of the lesioned hemisphere.
Mean (SD) of activated area (AREA), signal intensity change (∆SI), and “activation” (ACT) of the hemisphere contralateral to the forepaw stimulation for the different imaging modalities
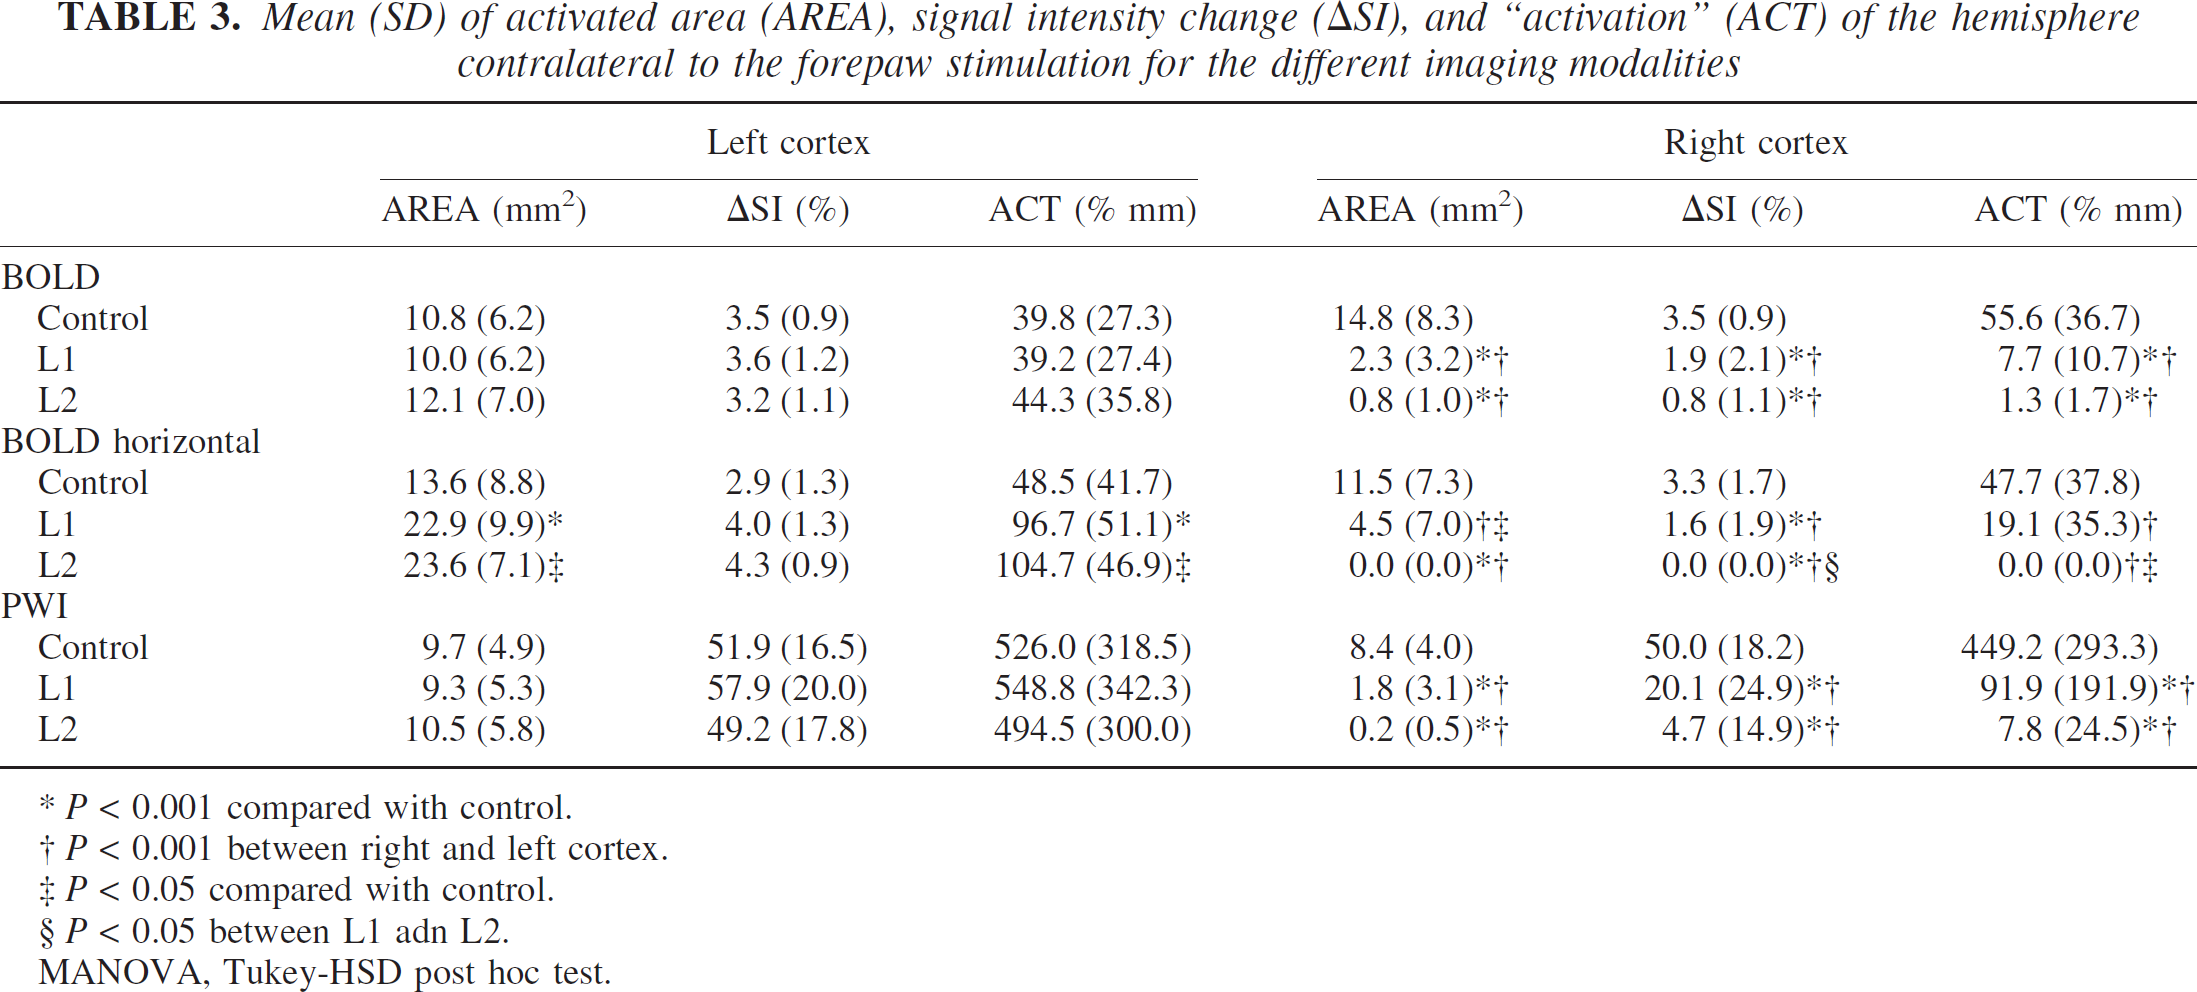
P < 0.001 compared with control.
P < 0.001 between right and left cortex.
P < 0.05 compared with control.
P < 0.05 between L1 adn L2.
MANOVA, Tukey-HSD post hoc test.
Correlation between SSEPs and fMRI activation
There was a pronounced correlation between SSEPs and fMRI activation. Indeed, the correlation was so good, that it was nearly possible to predict qualitatively the later fMRI activation by the SSEP amplitudes recorded at the beginning of an experiment. Figure 4 shows the correlation between the hemispheric asymmetry coefficients of the fMRI activation, AC ACT, and the SSEP amplitude, AC SSEP (R = 0.81, P = 2.3 × 10⁻⁵; Pearson correlation coefficient, two-sided test).
DISCUSSION
Although detectable, the hypothesized activations outside the primary projection areas were only rare and rather the exception than the rule. There was some evidence for an increased activation in the unaffected, contralateral hemisphere, as postulated from the in vitro experiments (Chevassus-au-Louis et al., 1999; Jacobs et al., 1996; Luhmann and Raabe, 1996; Luhmann et al., 1998b). Still, the dominant findings of our study were (1) absence of obvious neurologic deficits, and (2) highly reduced activation (fMRI and SSEPs) in the lesioned hemisphere. Basically, these partly paradoxical findings can be interpreted in two ways, which will be elaborated in more detail below:
Plasticity is not a major feature of the neonatal freeze lesion model. The fMRI and SSEP results therefore indicate an absence of relevant plastic reorganization.
Functional reorganization did occur, but was not reliably detected by the applied methods. Reasons for this may include loss of excitable tissue, disturbed signal transduction, changes of tissue excitability or thalamocortical and cortico-cortical connectivity, or a disturbed coupling of neuronal activity to the hemodynamic response.
Apparent absence of plasticity
From this and other studies, it is evident that neonatal freeze lesions result in only minor neurologic deficits, which, if at all, can only be detected by subtle testing (Fitch et al., 1994; Herman et al., 1997; Rosen et al., 1995). Even neonatal decortication does not result in overt deficits (Ono et al., 1990). Because of the small functional impact of the lesions, the absence of gross neurologic deficits is not a good indicator for plasticity or its absence. However, one possible explanation for the reduced fMRI and SSEP activation of the lesioned hemispheres could be that the normal function of the injured cortex is compromised and not sufficiently reorganized at the time of the investigation (i.e., plasticity did not occur).
Other reasons might include the rather deprived environment in which the animals were housed (Johansson, 1996; Kolb and Whishaw, 1998; Ohlsson and Johansson, 1995; van Praag et al., 2000), or that the functional handicap caused by the lesions was not severe enough to impose a sufficient challenge for functional compensation. Dijkhuizen et al. (2003) reported that a shift of brain activation toward the contralesional hemisphere depended on the extent of tissue injury. This is in line with our finding that exofocal activation ipsilateral to the stimulated paw was found only in the somewhat exceptional animal with the huge porencephalic cyst.
Loss of excitable tissue
In the animals in which a porencephalic cyst had developed (type II), the decrease or abolition of SSEP amplitude and fMRI activation might be simply explained by the loss of excitable tissue and/or brain vessels, which can respond to the somatosensory stimuli.
This argument, however, is probably not valid for animals with type I lesion (microgyrus). Although the amount of tissue is reduced as well, previous in vitro slice studies revealed enhanced rather than decreased excitability of the malformed cortex and the surrounding tissue (Jacobs et al., 1996; Luhmann and Raabe, 1996; Luhmann et al., 1998b). Therefore, reasons other than mere tissue loss must account for the reduced activation found in the present study.
Changes in tissue excitability
Another interpretation of the reduced fMRI activation and SSEPs in the lesioned hemispheres might be altered tissue excitability.
Electrophysiologic data from cortical slice preparations of freeze-lesioned animals show enhanced excitability and propagating epileptiform activity (Jacobs et al., 1996, 1999; Luhmann and Raabe, 1996; Luhmann et al., 1998b; Palmini, 2000). This hyperexcitability results from an imbalance between excitatory and inhibitory synaptic transmission (Luhmann et al., 1998a). Such an imbalance is further supported by quantitative receptor autoradiography (Zilles et al., 1998) showing an increased binding to NMDA and AMPA receptors and a reduced binding to GABAA and GABAB receptors in the dysplastic cortex. Also in exofocal regions, including the unlesioned hemisphere, AMPA and kainate receptor binding is increased whereas GABAA receptor density is decreased (Redecker et al., 2000). Although it was not the major finding, our data give at least some evidence for an increased excitability in lesioned animals: SSEP amplitudes and part of the fMRI activation parameters were larger in the unlesioned hemisphere of both lesion types, and lesioned animals also showed more ipsilateral activation (Tables 1 and 3). However, there is no evidence for a subsequent increase of baseline cerebral blood flow in the lesioned hemisphere in this animal model that would decrease the hemodynamic response detectable by fMRI (Kraemer et al., 2001).
Mean (SD) of activated area (AREA), signal intensity change (∆SI), and “activation” (ACT) of the hemisphere ipsilateral to the stimulation for the different imaging modalities
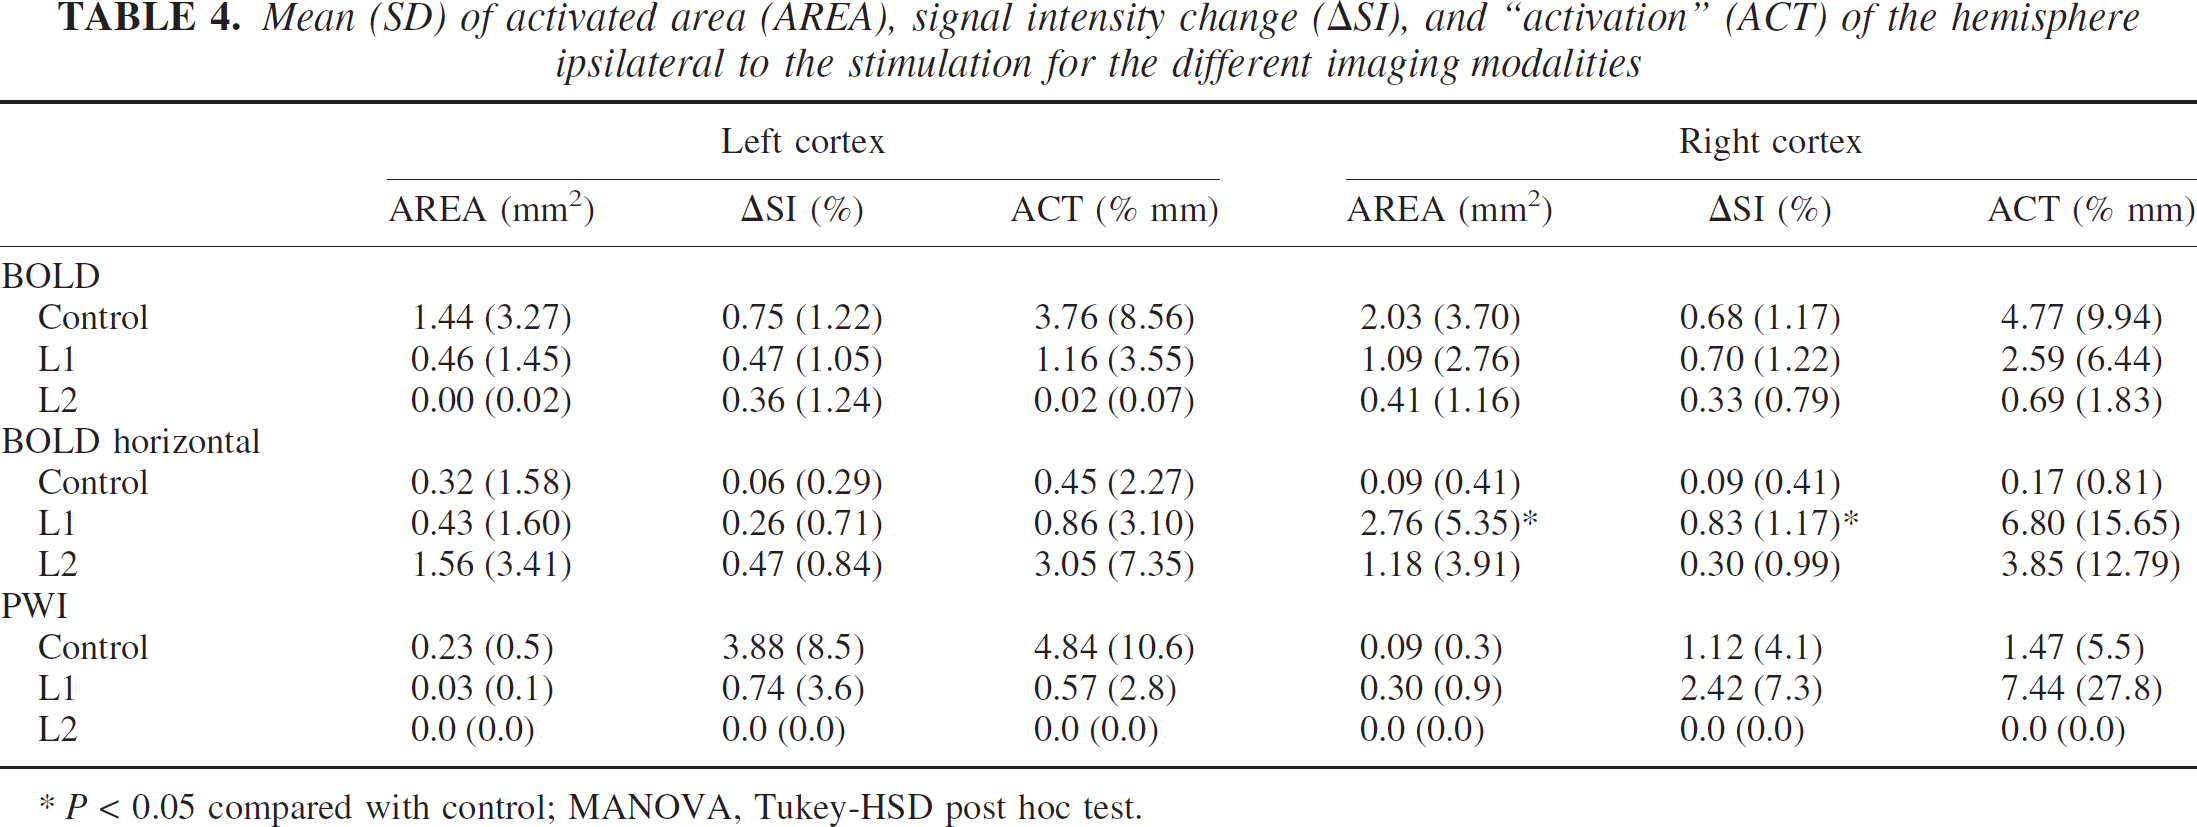
P < 0.05 compared with control; MANOVA, Tukey-HSD post hoc test.
We cannot exclude the possibility that reduced fMRI activation of the lesioned hemisphere reflects increased inhibition in the lesioned cortex, as reported by Prince and Jacobs (1998) in the same animal model. In the present study, this inhibition could be even further enhanced by α-chloralose. This anesthetic substantially reduces cerebral blood flow and glucose metabolism, but preserves or even facilitates the metabolic and hemodynamic response to sensory stimulation, rendering it ideally suited for activation studies requiring anesthesia (Bonvento et al., 1994; Dudley et al., 1982; Ueki et al., 1992). Additional experiments in which the anesthetic was added to the bathing solution of slices cut from 3-week-old rats (Kilb and Luhmann 2001, unpublished observations) showed unaltered spontaneous excitatory postsynaptic currents, whereas the frequency of GABAA-induced inhibitory post synaptic currents (IP-SCs) (i.e., GABAergic inhibition) was reduced by 50% in vitro. There is an unresolved discrepancy between the reduced fMRI activation and SSEPs of the lesioned hemisphere in vivo and the α-chloralose induced disinhibition in vitro.
Reduced thalamocortical and cortico-cortical projections
Although in control animals there was a large reciprocal projection between the ventrobasal thalamus and the somatosensory cortex and there were numerous callosal projections, mainly between homologous regions of the somatosensory cortex, freeze-lesioned animals showed a virtual absence of these projections in the lesioned area and only rarely exhibited a dense plexus of thalamocortical fibers at the border of the lesion (Rosen et al., 2000). Thus, the reduced activation of the lesioned hemisphere is in accordance with the altered projection patterns.
Disturbed coupling of neuronal activity and the hemodynamic response
Because fMRI techniques are mainly sensitive to changes of cerebral blood flow, another reason for the reduced activation, especially of the lesioned hemisphere, could be a disturbed hemodynamic response to the increased neuronal activity. One reason could be a reduced number of responsive vessels. But such disturbances also seem plausible from what is known about altered NMDA, GABA, and AMPA receptor densities (Redecker et al., 2000; Zilles et al., 1998) and downregulation of the endothelin B receptor (Gorlach et al., 1998). However, the concurrent reduction of the electrical response (SSEPs) argues strongly against this interpretation.
In summary, our study failed to visualize plasticity in the model of neonatal freeze lesion; i.e., activation outside the primary projection area was not a robust finding. The key findings were a decreased electrical response, as revealed by reduced SSEP amplitudes, paralleled by a significantly reduced activation in fMRI images of the lesioned hemisphere. Altered activations as measured by fMRI and SSEPs can most likely be explained by functional alterations in GABAergic inhibition, or by reduced or even absent thalamocortical projections to the lesioned area.
Footnotes
Acknowledgements
The authors thank Ms. Mila Jagodnik for technical assistance.