
Abstract
Excellent progress has been made toward understanding the physiology and pharmacology of specific calcium-related cellular processes of the brain, but few studies have provided an integrated view of brain calcium kinetics. To further the knowledge of the size and binding properties of brain calcium compartments, the authors have conducted a series of experiments in hippocampal brain slices exposed to high and low extracellular calcium. Slices were incubated in buffers containing 0.001 to 4.5 mmol/L calcium for up to 75 minutes. Slice calcium content was analyzed by three methods: exchange equilibrium with 45Ca, synchrotron-radiation–induced x-ray emission, and inductively coupled plasma. Data were analyzed using a model based on a Langmuir isotherm for two independent sites, with additional extracellular and bound compartments. In parallel experiments, altered low calcium had no effect on slice histology and only mild effects on slice adenylates. When combined with prior 45Ca and fluorescent probe binding experiments, these results suggest that there are at least five kinetically distinct calcium compartments: (1) free extracellular (∼10%); (2) loosely associated extracellular plasma membrane (∼55%); (3) intracellular compartment with moderate avidity (∼17%); (4) tightly bound, nonexchangeable intracellular compartment (∼15%); and (5) free cytoplasmic (<0.01%). If only the third compartment is considered a potential calcium buffer, then the buffering ratio is calculated to be ∼2,700:1, but if the second compartment is also included, then the buffering ratio would be ∼13,000:1. This may explain the wide range of estimates observed by fluorescent probe studies.
Calcium, as the cation Ca2+, is a major cofactor for a broad variety of cellular and signaling processes in the nervous system. Calcium also plays a major role in many pathologic processes. Not surprisingly, therefore, Ca2+ is tightly regulated within the intracellular and extracellular compartments of the central nervous system involving processes that include transport mechanisms across the blood–brain barrier and cellular membranes, extensive binding by proteins and other macromolecules, and sequestration within a variety of intracellular organelles. Despite considerable progress in understanding the detailed regulation of many of these individual compartments, many questions persist regarding the kinetic properties of the system as a whole at the tissue level. The total Ca2+ present in the central nervous system, the relative proportions among the major compartments, and the kinetic properties that describe transfer of Ca2+ among the compartments all remain uncertain. There are related questions about cellular buffering capacity for Ca2+. These questions cannot be answered using fluorescent probes, which respond primarily to the concentration of free cytoplasmic Ca2+, commonly signified by [Ca2+]i and thus do not directly image the majority of cellular Ca2+, so that alternative analytic methods are necessary.
Cerebrospinal fluid Ca2+ is tightly maintained in a very narrow range even when blood Ca2+ varies markedly (Merritt and Bauer, 1931; Katzman and Pappius, 1973; Tai et al., 1986; Murphy et al., 1988). Prior estimates of total brain calcium vary depending on the analytical method, species, and region of brain. Various studies have measured total brain calcium of anesthetized animals ranging from as low as 1.2 μmol/g to as high as 5.6 μmol/g, with most studies suggesting that steady-state whole brain calcium is between 3.5 and 5 μmol/g (Dienel et al., 1995; Mies et al., 1993; Murphy et al., 1988; Anghileri et al., 1994). Estimates of basal free cytoplasmic Ca2+ concentration in neuronal cultures suggest values as low as 0.1 μmol/L (Thayer et al., 1987; O'Donnell and Bickler, 1994).
The most common method of studying tissue Ca2+ kinetics in brain tissue involves radiolabeling of brain slices with 45Ca as a function of time (Moriarty, 1980; Kass and Lipton, 1986; Newman et al., 1995). These studies have made clear that there are at least two compartments within this system. Our laboratory has recently extended these results using hippocampal slices to describe a model that includes diffusion in the extracellular space (ECS), a large rapidly exchanging compartment, and a smaller slowly exchanging compartment, either in series or in parallel with the first (Patlak et al., 1998). However, because measurements of tissue Ca2+ using 45Ca depend on complete exchange of the radioisotope during the hour or so of the experiment, radiolabeling cannot detect the presence of Ca2+ that is tightly bound within the tissue or that exchanges too slowly to be observed during the experiment. To our knowledge, no studies have combined measurements of total tissue Ca2+ with radiolabeling techniques in an effort to demonstrate such a bound component.
To further test the validity of our kinetic model and establish whether there is an additional compartment of tightly bound calcium, we have altered the extracellular Ca2+ from 0.001 to 4.5 mmol/L, measured total tissue calcium measured by synchrotron-radiation–induced x-ray emission (SRIXE) and inductively coupled plasma (ICP) spectroscopy, and determined the effects on steady-state tissue 45Ca levels based on avidity of Ca2+ binding rather than on temporal properties.
COMPARTMENTAL MODEL
We seek to develop the simplest model of brain Ca2+ kinetics that is consistent with conceptual and experimental progress of the past. The model seeks to incorporate all tissue-associated Ca2+, from the ECS to the minute but physiologically active compartment of free, cytoplasmic Ca2+. Although this latter compartment is not detected by any of the methods used in this article, its existence and properties are well established (Thayer et al., 1987; O'Donnell and Bickler, 1994) and, therefore, it is considered part of our kinetic model even though it is not included in the data analysis. As already noted, our recent studies (Patlak et al., 1998) have confirmed the presence of at least two kinetically distinct compartments (Moriarty, 1980; Kass and Lipton, 1986; Newman et al., 1995) in addition to Ca2+ in the ECS. In all of these prior kinetic studies, one tissue Ca2+ compartment is found to be large and in rapid exchange with the ECS, whereas the other is more modest in its size and exchange rate. Thus, including the free, cytoplasmic pool, at least four compartments are necessary to provide the minimum description of Ca2+ kinetics in brain. Finally, it is important to establish whether there is also a tightly bound compartment that would not be seen by any of these dynamic techniques. Including the possibility of this bound compartment, a simple kinetic model is shown in Fig. 1. This model assumes that Ca2+ can reach the second reversible compartment (Langmuir Isotherm Space 2) either directly from the first exchangeable compartment or through the cytoplasm but not directly from ECS, although this cannot be established by the existing data. The assumption also has been made that any bound compartment is filled through the second reversible compartment even though this also is not established. The possible associations of these kinetically defined compartments with physiologic compartments will be considered later in this article.
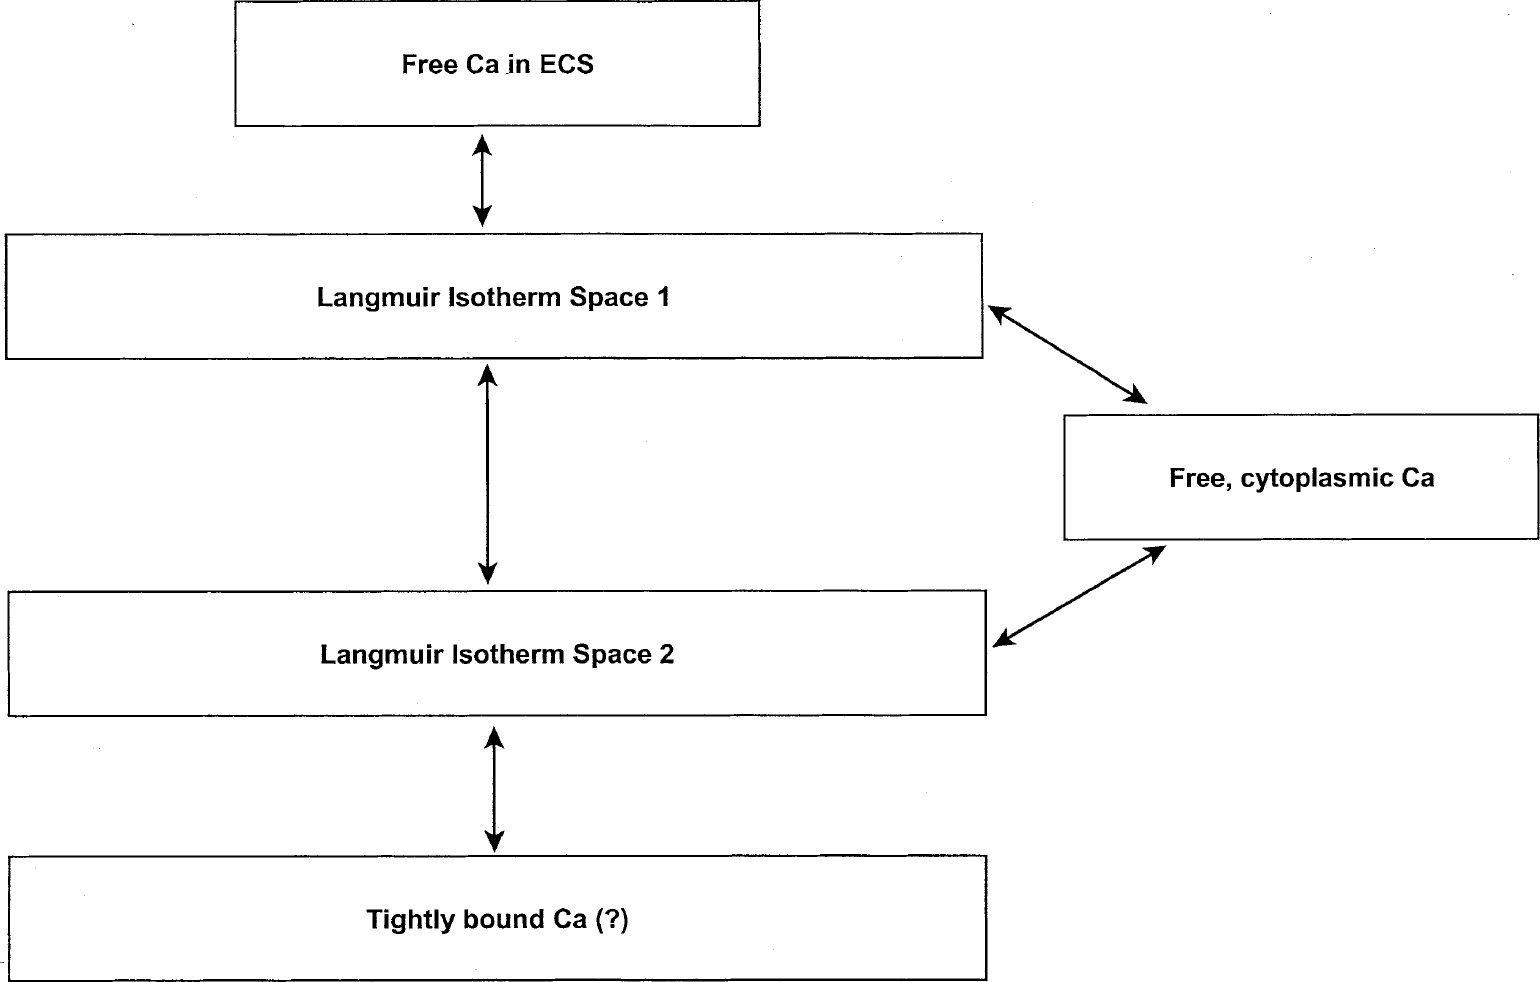
Preliminary kinetic model of Ca2+ compartments in brain slices.
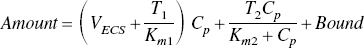
The changes in tissue Ca2+ that occur as a function of [Ca2+]o, the calcium concentration in the perfusing buffer, were analyzed by analogy with a Langmuir isotherm for two independent, reversible binding sites, Bj, at equilibrium, where j = 1,2. For each binding site, there is a local concentration, Cpj, there are Tj binding sites and two reversible binding constants, K1j and K2j. At equilibrium,

EXPERIMENTAL PROCEDURES
Materials
All buffers, dextran (mean MW 77,000), and inorganic salts were obtained from Sigma Chemical, Inc. (St. Louis, MO, U.S.A.) and were of cell culture grade. The 95% O2–5% CO2 gas mixtures and liquid N2 were purchased from Matheson (E. Rutherford, NJ, U.S.A.). 45CaCl2 (sp. act. 2.1 mC/mL) was from Amersham Corp. (Arlington Heights, IL, U.S.A.). Scintillation cocktail was obtained from National Diagnostics (Manville, NJ, U.S.A.). Water was deionized and purified to a resistance of 17 MOhm with a Barnstead NANOpure system (Boston, MA, U.S.A.). Organic solvents for high-performance liquid chromatography were obtained from Fisher Scientific (Springfield, NJ, U.S.A.).
Brain slice preparation, isotope incubations, and analysis
Each incubation day, three male Sprague-Dawley rats (225 to 275 g; Taconic Farms, Germantown, NY, U.S.A.) were lightly anesthetized with 3% halothane in 50% N2O–50% O2 and maintained with 2% halothane in 50% N2O–50% O2. A rectal temperature probe was inserted, and the rat was immersed in a bed of crushed ice until the probe read 30°C (Newman et al., 1992; Español et al., 1994). The rat was decapitated, and the brain was rapidly removed and chilled briefly in ice-cold preparation buffer (see next paragraph). Both hippocampi were dissected free and chopped perpendicular to the long axis at 450 μm using a Smith-Farquhar tissue chopper (Sorvall, Dupont, Wilmington, DE, U.S.A.) to obtain 12 slices per animal from the central portions of the hippocampi. The slices were separated in preparation buffer at 4°C using tools made of fire-polished drawn glass pipets. All slices were then transferred with a 7-mm I.D. polyethylene pipet to incubation chambers within 6 minutes of decapitation.
Twelve brain slices from each animal were loaded as pairs into six incubation chambers designed for biochemistry and histology, with the slices submerged by approximately 1 mm (Newman et al., 1995). Slices were incubated resting on nylon mesh suspended across glass rings (28 mm I.D.) at 22°C for 45 minutes and then the buffer temperature was raised during 20 minutes to 37°C for the remainder of the experiment. Buffer, already preequilibrated with humidified 95% O2–5% CO2, flowing at 1 mL/min, entered the chamber together with humidified 95% O2–5% CO2, flowing at 85 mL/min, through a glass frit, creating a constant light foam. Slices were incubated in a modified Krebs-Ringer–3.1% dextran buffer (control buffer) with (in mmol/L): NaCl, 122; KCl, 3.0; NaHCO3, 21.0; KH2PO4, 1.2; CaCl2, 1.5; MgSO4, 1.3; and glucose, 5; at pH 7.38 ± 0.02 with an osmolarity of 278 ± 1 mOsm measured by vapor pressure osmometry (Wescor, Logan, UT, U.S.A.). Dextran was included to reduce slice tissue water gain and improve histologic preservation (Banay-Schwartz et al., 1974; Newman et al., 1995). Changes in calcium concentration were accomplished by altering the amount of CaCl2 in the buffer with osmotic compensation by adjusting the NaCl. The lowest CaCl2 concentration represents the contamination of the cell culture grade NaCl salt without addition of any CaCl2. Calcium was undetectable in the purified water. EGTA (ethyleneglycol-bis(2-aminoethoxy)-tetraacetic acid) was not used to stabilize the low calcium concentrations, in keeping with our principle of avoiding complex inorganic compounds in our incubation buffers and to avoid potential complications for calculation of binding constants. Preparation buffer, which used phosphate to avoid pH changes caused by variation in temperature or the partial pressure of CO2, had a basic composition of (in mmol/L): NaCl, 121; KCl, 4.2; NaHCO3, 31; sodium phosphate, 8 (added as a mixture of mono- and dibasic salts to achieve pH 7.4 at 4°C), CaCl2, 1.5; MgSO4, 1.3; and glucose, 10. Preparation buffer also contained 3.1% dextran. The pH was adjusted, as necessary, to 7.38 with 0.154 mol/L NaHCO3. Preparation buffer was also equilibrated with 95% O2–5% CO2.
For slices incubated with radioisotope, the incubation chamber was modified so that buffer recirculated with a total volume of 15.4 mL at a flow rate of 2.0 mL/min. Buffer was exposed to gas on chamber reentry as already described. Isotope incubation buffers were identical to Krebs-Ringer–3.1% dextran as described herein except that they also contained 45CaCl2 with a specific activity of 0.84 μC/mL. Radiotracer incubations were begun by lifting the rings with slices from the preincubation chamber and gently pipetting 1 mL of radioactive buffer over the slices, thus avoiding dilution of radiolabel in the incubation chamber. The time was noted and the rings were immediately transferred to the isotope incubation chamber. Slices were incubated with radioisotope for 65 to 75 minutes (actual measured times of 70.3 ± 5.4 minutes for all slices) and then removed individually from the chamber with a wide-bore pipet and transferred to a slice-handling tool fashioned from 0.018” stainless steel wire bent into the shape of a spoon (8 × 6 mm), with bridal veil (tulle) sewn to the frame with ultrafine (1-lb test) nylon monofilament. Isotope incubations were ended by dipping the slice on the slice-handling tool in 10 mL of oxygenated nonradioactive experimental buffer, transferring it with a fine paintbrush to a tared Teflon-coated glass slide for weighing and then to a microfuge tube, which was closed and immersed in liquid N2. For efflux studies, the slices were first incubated with isotope at 1.5 mmol/L Ca2+ for 75 minutes, then removed, still in their ring, and rinsed with 20 mL of nonradioactive buffer in less than 5 seconds, ending the incubation. The ring was then transferred to a flow-through chamber for efflux measurements at either 1.5 or 0.001 mmol/L Ca2+. After times varying from 15 seconds to 120 minutes, slices were removed from the rinse chambers with the brush, transferred directly to a tared glass slide for weighing, and then frozen as already described.
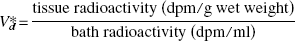
The frozen tissue was sonicated (Sonicator Heat Systems, Farmingdale, NY, U.S.A.) in a microfuge tube with 500 μL of ice-cold 0.3 mol/L perchloric acid and stored on ice. A protein pellet was obtained by centrifuging at 12,000 g for 20 minutes at 4°C. The entire supernatant was mixed with Liquiscint (National Diagnostics, Atlanta, GA, U.S.A.) scintillation cocktail and counted in an LKB Model 1214 liquid scintillation counter (Pharmacia-Wallac, Turko, Finland). The protein pellet was digested in 500 μL of 1 N NaOH overnight in an oven at 60°C and neutralized with 500 μL of 1 N HCl. Two hundred microliter aliquots were assayed by scintillation counting and protein determination (Lowry et al., 1951). Perfusate radioactivity was taken as the average of pre- and postincubation measurements because the radioactivity declines by 2% to 3% during the course of the incubation. The tissue volume of distribution (Vd*) was expressed in milliliters per gram tissue wet weight based on the equation

Slice incubations for calcium measurements by SRIXE and ICP methods were virtually the same as for 45Ca labeling except that no radioisotope was present. Slices were preincubated for 75 minutes, transferred to separate chambers preequilibrated with buffer containing the altered buffer Ca2+, and incubated for an additional 75 minutes. For SRIXE, each slice was transferred, at the end of the incubation, with a wide-bore pipet to its own mesh ring and allowed to air dry. Slices for ICP were frozen and extracted in the same manner as for 45Ca labeling.
The ICP calcium measurements were made with a Perkin-Elmer Liberty 100 ICP using optical emission spectroscopy (Perkin-Elmer, Norwalk, CT, U.S.A.). The instrument was operated at 393.366 nm for the calcium detection. The instrumental response was calibrated using Accutrace Reference Standard Calcium–Plasma Emission Standard (Accustandard, Inc., New Haven, CT, U.S.A.), which was traceable to the National Institute of Standards and Technology standards. Samples were diluted gravimetrically using calcium-free distilled-deionized water. A standard curve was generated using the incubation buffers.
The air-dried slice was analyzed for calcium using SRIXE at the Brookhaven National Synchrotron Light Source X26A x-ray microprobe beam line (Jones and Feng, 2001). A filtered white beam with a size of 1 × 1 mm was used for the measurements. Fluorescent x-rays were observed at 90° to the incident beam using a 30 mm2 Si(Li) x-ray detector. Each slice was analyzed in at least 3 locations for a counting time of 120 seconds. A typical x-ray energy spectrum is shown in Fig. 2. By using the Ca Kβ x-ray (4.012 keV) from the SRIXE data as a measure of the Ca concentration, it was possible to avoid the interference between the strong K Kβ x-ray (3.589 keV) and the less intense Ca Kα x-ray (3.690 keV). These measurements do not give absolute values for the amount of Ca because the mass of the measured tissue volume is unknown. Instead it was assumed that tissue K+ remained constant and that accurate relative Ca could be determined by normalizing to the amount of K. Therefore, the ratio, (Ca Kβ)/(K Kα), was calculated at each measurement point and the average of the three intensity measurements ratios was used as the value for that individual slice. The amount of Ca was estimated by normalizing the Ca/K ratio at each external calcium concentration to the Ca/K ratio found using ICP measurements at a buffer Ca concentration of 1.5 mmol/L. Again, this conversion rests on the assumption that tissue K remains constant while tissue Ca varies.
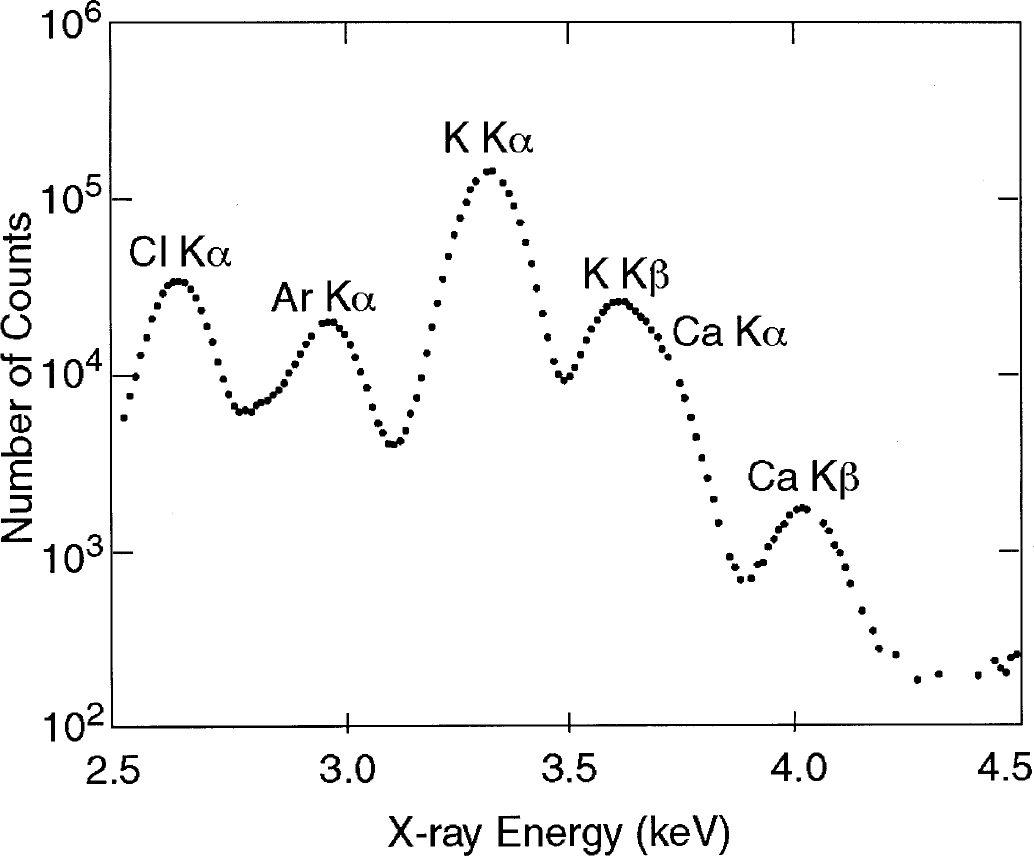
Typical x-ray energy spectrum produced by irradiation of a thin section of hippocampal rat brain tissue. The x-ray peaks in the region-of-interest from Cl, Ar, K, and Ca are identified on the figure.
Histologic analysis and adenylate assays
An additional group of rats was used to prepare slices for histology and adenylate assays. Slices were prepared and incubated as for 45Ca labeling in separate flow-through chambers for histology and adenylates and then removed from the chambers after 90 minutes in experimental buffer and either fixed or frozen in their rings.
Slices for histology were fixed at 37°C for 1 hour in Bouin's fixative, dehydrated, paraffin embedded, sectioned at 7 μm, and stained with hematoxylin and eosin. All slices were encoded and read by a single observer in a blinded manner. Details of our methods have been published recently (Newman et al., 1998). In all slice regions, the scale used was as follows: grade 1—virtually all neurons appear normal (defined in reference to the in vivo standards); grade 2—nearly all neurons remain and most neurons appear normal but as many as 20% show minor differences from in vivo; grade 3—significant changes were seen in up to 50% of neurons and some neurons could be lost; grade 4—more than 80% appear abnormal with up to 20% lost; grade 5—no remaining normal-appearing neurons and more than 20% of the neurons missing. Occasionally, if the histology of a region was heterogeneous, with more than one grade observed within the region, an intermediate grade, such as 2.5, was assigned.
Slices for adenylates (N = 32) were rapidly frozen in the incubation rings by immersion in liquid N2 without prior weighing. Frozen slices were extracted with 150 μL of perchloric acid and neutralized with 15 μL of 3.0 mol/L KHCO3 after centrifugation and removal of the protein pellet as already described. Tissue adenylates were measured by high-performance liquid chromatography using a modification of the method of Teerlink et al., 1993. A 50-μL sample of the neutralized extract was injected by autosampler onto a Microspher C18 reverse-phase 3-μm column (Chrompack, Raritan, NJ, U.S.A.). Compounds were eluted at a flow rate of 1 mL/min by gradient of buffer A (0.15 mol/L KH2PO4) and buffer B (H2O: MeOH: acetonitrile, 50:25:25), with the gradient of buffer B run as: 0% for 1 minute, a ramp to 15% at 5.4 minutes, a ramp to 40% at 6.4 minutes, holding at 40% to 7.4 minutes, then return to 0% at 7.9 minutes for column reequilibration by 12 minutes. All peaks were identified and quantified with reference to standards for all relevant compounds run at three concentrations at the beginning and end of every chromatography session. Peak heights were measured for ATP, ADP, AMP, adenosine, inosine, and hypoxanthine. The calculated amount of each compound was normalized for slice protein (Lowry et al., 1951) and the result expressed as nmol/mg protein. The total adenylate nucleotides (TAN) was calculated as TAN = ATP + ADP + AMP, and the adenylate energy charge (AEC) was calculated as AEC = (ATP + 0.5 * ADP)/TAN.
Statistical analysis
All averages are presented as means with standard deviations. Values for histology and adenylates were compared by multivariate analysis of variance with Pillai's, Hotelling's, and Wilk's multivariate tests of significance and then univariate analysis when multivariate tests of significance were significant at the P < 0.05 level (SPSS/PC + 5.0.2 for DOS, SPSS, Inc., Chicago, IL, U.S.A.). Two sets of multivariate analysis of variance were performed for the high-performance liquid chromatography fractions, one for ATP, ADP, AMP, and AEC and the other for adenosine, inosine, and hypoxanthine. Because TAN is a linear sum of other scores, it cannot be analyzed by multivariate analysis of variance but only by analysis of variance.
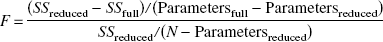
The 45Ca efflux curves at [Ca2+]o of 1.5 and 0.001 mmol/L were compared using a five-parameter kinetic model that includes diffusion through the ECS and into two tissue compartments in series (Patlak et al., 1998) and with the F statistic for sum of squares as follows:
Nonlinear least-squares analyses by simplex methods were also used to find the best fit correlating tissue calcium and [Ca2+]o based on Eq. 4a. Kinetic analyses were performed with programs written in True Basic (Addison-Wesley, Reading, MA, U.S.A.) and using Curvefit (Version 1.36, Microsoft Corp., Redmond, WA, U.S.A.).
RESULTS
Varying extracellular calcium ([Ca2+]o) from 0.001 to 4.5 mmol/L produced no observable histologic injury in any region of the hippocampal slices (Table 1). Note that the better scores in CA1 and dentate at all [Ca2+]o reflect the prior optimization of buffer conditions for those regions (Newman et al., 1995). There were two significant, although quantitatively small, changes observed in tissue adenine nucleotides in relationship to changing [Ca2+]o (Table 2). There was a definite increase in ADP at low [Ca]o (P < 0.01) along with insignificant trends toward lower ATP and higher AMP. As a result, there was a lower AEC at [Ca2+]o less than 1.5 mmol/L (P < 0.05). There were no consistent patterns of total adenine nucleotides, adenosine, inosine, or hypoxanthine, unlike in models of ischemia where such changes are prominent (Newman et al., 1998). There were no differences in the mean wet weight to protein ratios observed at 1.5 and 0.001 mmol/L [Ca2+]o, suggesting that low Ca did not induce any cellular edema.
Histologic scoring of varying Ca 2+ concentrations*
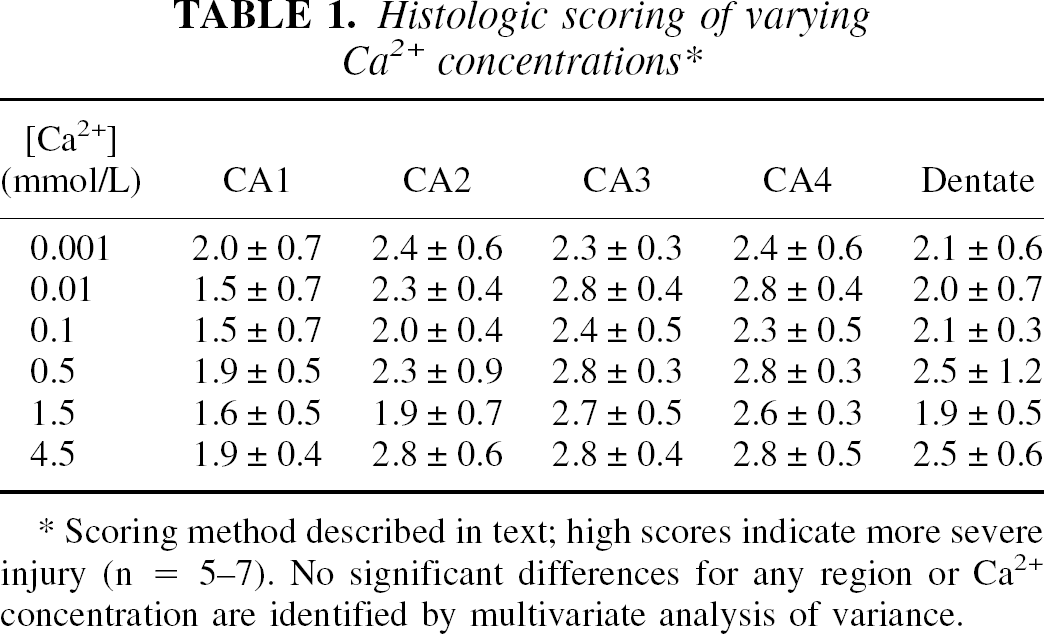
Scoring method described in text; high scores indicate more severe injury (n = 5-7). No significant differences for any region or Ca2+ concentration are identified by multivariate analysis of variance.
Tissue adenine nucleotides and purine nucleosides as a function of [Ca 2+ ] 0
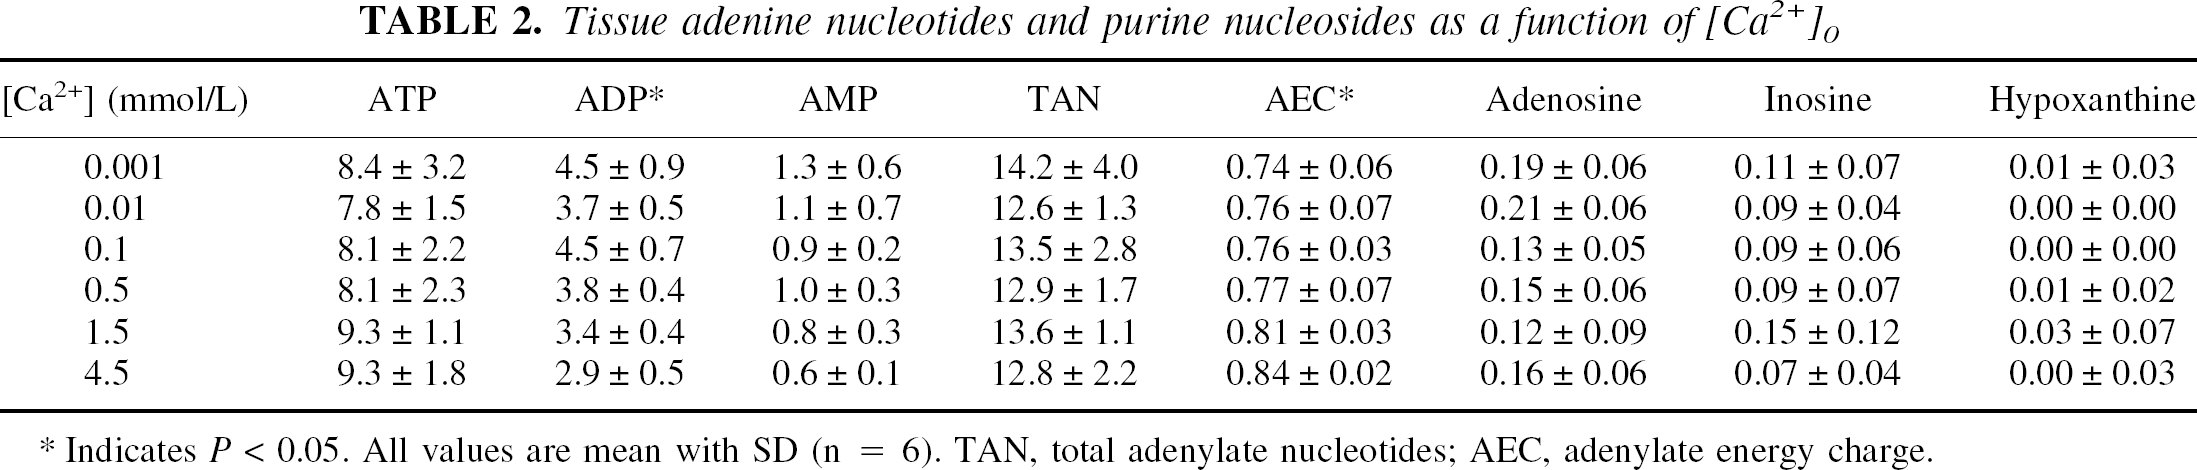
Indicates P < 0.05. All values are mean with SD (n = 6). TAN, total adenylate nucleotides; AEC, adenylate energy charge.
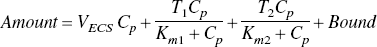
The effects of varying [Ca2+]o on tissue Ca, assayed by each of the three methods, are shown in Figs. 3A–D, together with the best-fit lines from the nonlinear least-squares analyses using Eq. 4a. Attempts to fit these curves with only one reversible binding compartment in the Langmuir isotherm analysis produced uniformly poor fits whether a Bound compartment was included or not. Thus, there are at least two populations of reversible Ca2+ binding sites with distinctly different binding affinities within the tissue. The results with Ca were readily fit using Eq. 4a, with Bound = 0 (Table 3). However, analysis using Eq. 4a for total tissue calcium, whether measured with ICP or SRIXE, with Bound = 0, consistently resulted in unstable fits with discontinuities. Thus, it was necessary to include a Bound compartment for both of these measurements. Values for the various kinetic parameters derived from the best least-squares fits are displayed in Table 3. It is apparent that the Bound compartment represents a substantial fraction of the total tissue calcium, estimated at between 11.3% and 15.5%.
Langmuir isotherm analysis of calcium binding data
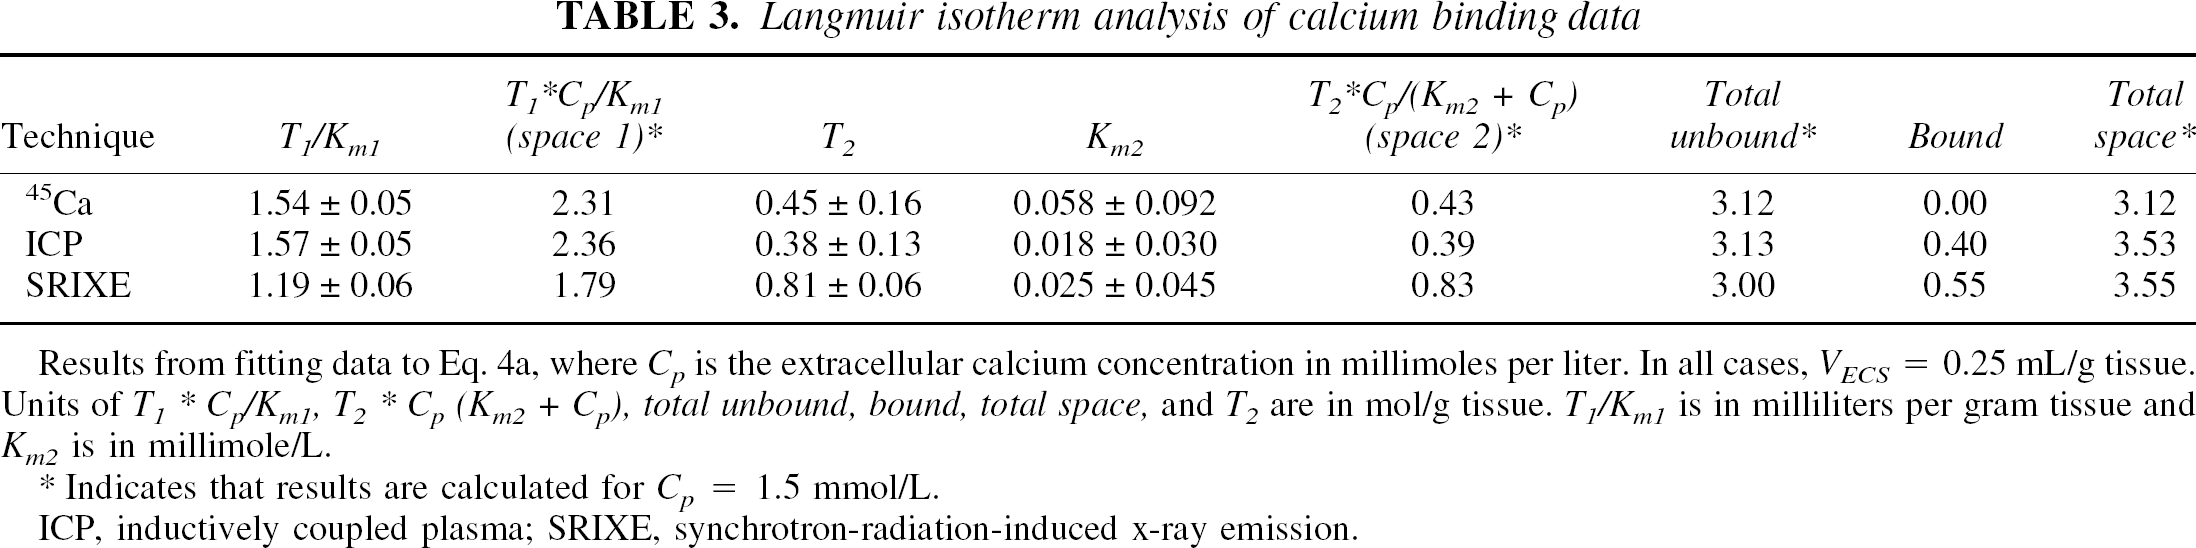
Results from fitting data to Eq. 4a, where C p is the extracellular calcium concentration in millimoles per liter. In all cases, V ECS = 0.25 mL/g tissue. Units of T1*C p /K m1 , T 2 * C p (K m2 + C p ), total unbound, bound, total space, and T 2 are in mol/g tissue. T 1 /K m1 is in milliliters per gram tissue and Km2 is in millimole/L.
Indicates that results are calculated for C p = 1.5 mmol/L.
ICP, inductively coupled plasma; SRIXE, synchrotron-radiation-induced x-ray emission.
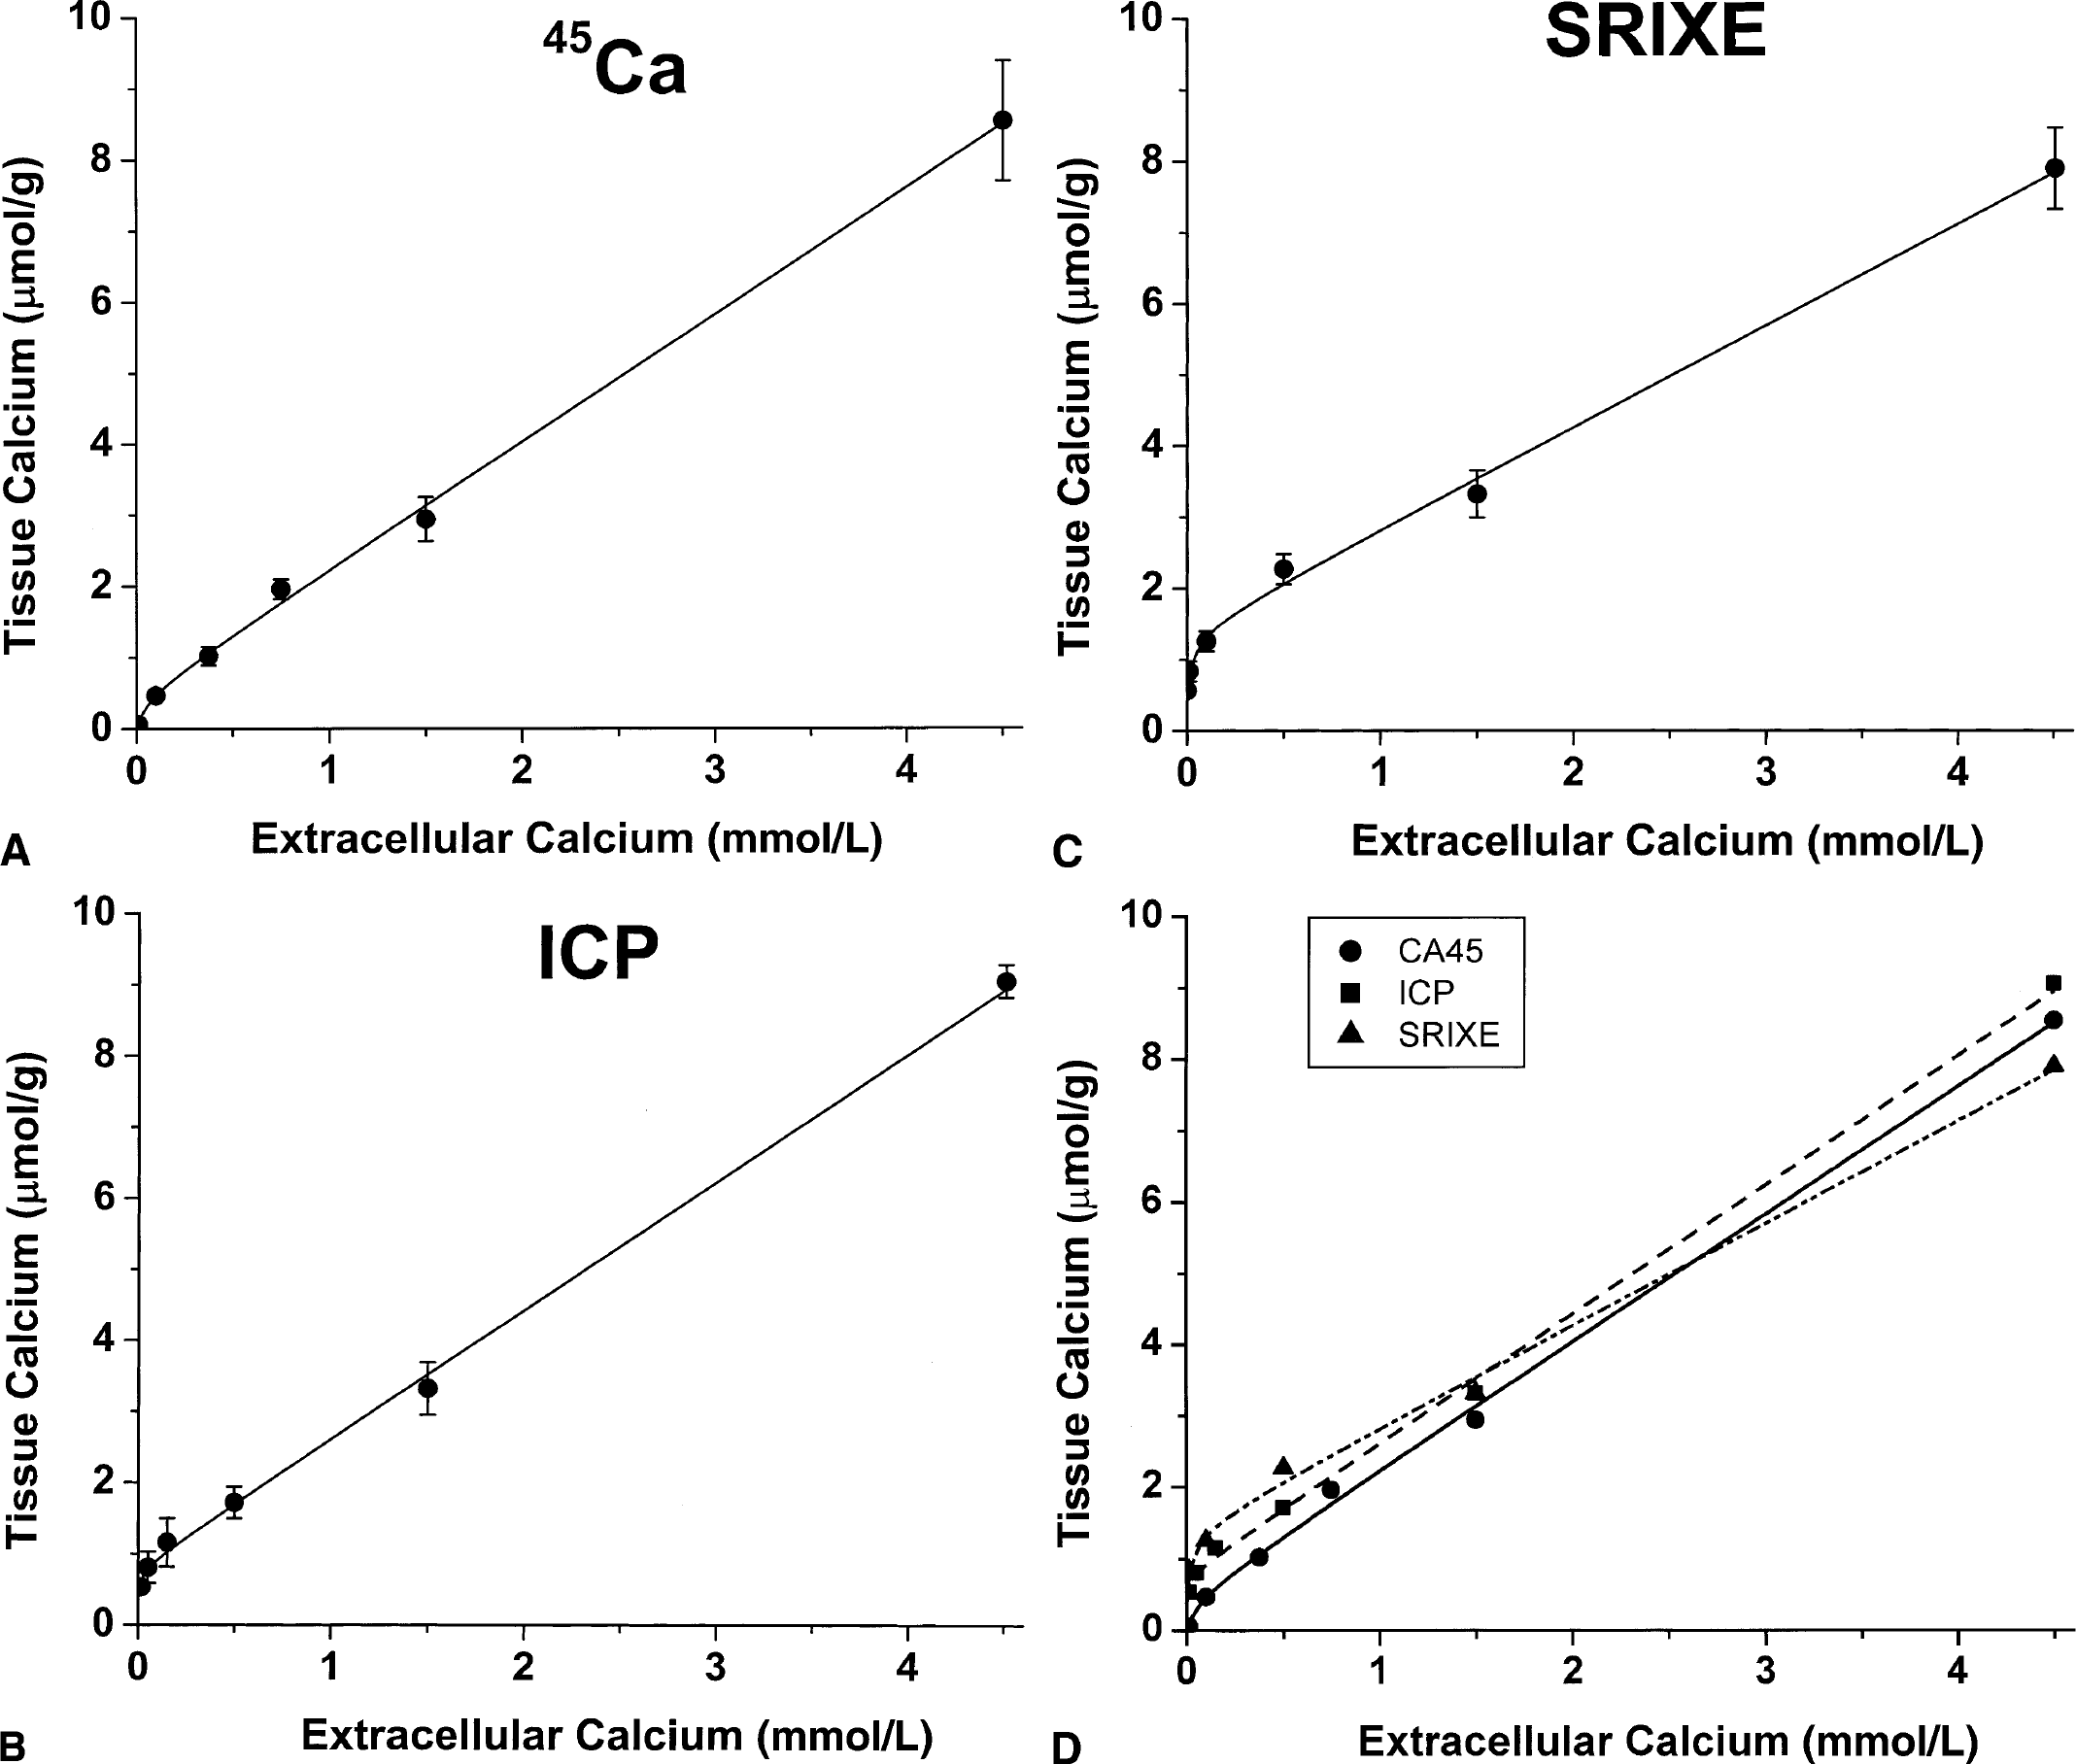
The effects of varying [Ca2+]o on tissue Ca are shown based on measurements by
The linear slopes of tissue Ca2+ versus [Ca2+]o more than 0.5 mmol/L are consistent with a large compartment with relatively low avidity that is nonsaturable at physiologic calcium concentrations. Least-squares analyses tend toward very large values for T1 and Km1, but the standard errors of the individual constants are too large to permit accurate quantification. Nonetheless, the results are sufficient to justify removing C from the denominator so that Space 1 can be calculated as Cp* T1/Km1. There is excellent agreement for the size of Space 1 between 45Ca and ICP and relatively good agreement with SRIXE (Table 3). All three methods identify a second smaller reversible compartment with relatively high avidity that would be close to saturation at physiologic [Ca2+]o. As with Space 1, there is excellent agreement between 45Ca and ICP methods for estimating Space 2 but, in this case, only fair agreement with SRIXE. However, because the SRIXE differences are in opposing directions, if Space 1 is combined with Space 2 and VECS to obtain the total unbound calcium in the tissue at 1.5 mmol/L, then there is excellent agreement between all three methods, with values of 3.12, 3.13, and 3.00 μmol/g tissue for 45Ca, ICP, and SRIXE methods, respectively. Once the Bound compartment is added, the calculated Total Space for ICP and SRIXE is larger than that calculated for 45Ca by approximately 0.42 μmol/g tissue (Table 3).
The effects of lowering [Ca2+]o on the rate of Ca2+ efflux from tissue was determined by comparing two groups of slices (n = 18 each) radiolabeled with 45Ca in 1.5 mmol/L [Ca2+]o for 75 minutes but then rinsed with buffer without radioisotope at either 1.5 mmol/L or 0.001 mmol/L [Ca2+]o (Fig. 4). It is apparent from inspection of this graph that there are no significant differences between the two curves, and this is confirmed by the F statistic (F = 1.43, where F5.31 > 2.52 would indicate P < 0.05). The key significance of this result is to exclude the theoretical possibility that the Bound compartment might represent an artifact of low [Ca2+]o, namely, the possibility that a compartment that exchanges with 45Ca at 1.5 mmol/L becomes “locked” and nonexchangeable at 0.001 mmol/L. In addition, lowering [Ca2+]o does not alter the rate of Ca2+ efflux from the tissue.
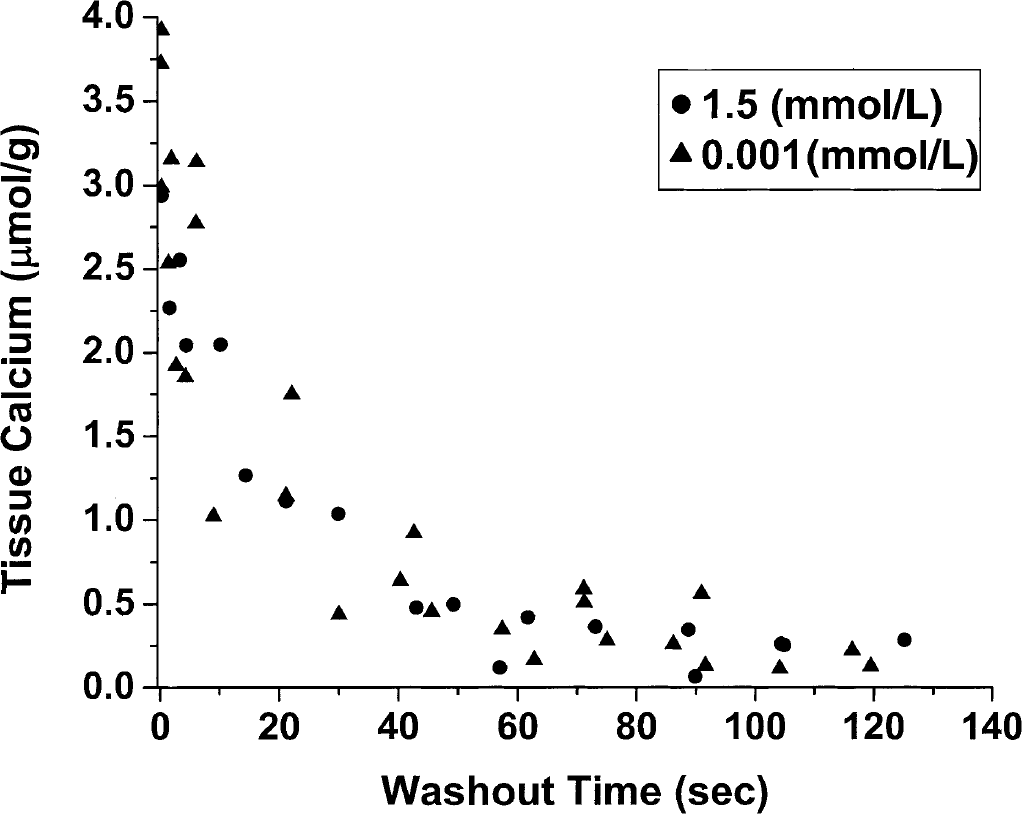
The effect of lowering [Ca2+]o on the rate of Ca2+ efflux from the slices. Data are shown for washouts in buffer solutions at 1.5 mmol/L or 0.001 mmol/L [Ca2+]o. The agreement of the two sets of data shows that lowering the [Ca2+]o concentration does not “trap” Ca2+ in a compartment that is in exchange with 45Ca at 1.5 mmol/L or alter the efflux rate of Ca2+.
DISCUSSION
The predominant new finding of this study is the demonstration of a bound Ca2+ compartment in brain tissue. Two lines of evidence indicate the existence of this compartment. The first is the repeated observation of discontinuities on attempted curve fitting of SRIXE and ICP data to Langmuir isotherms without a bound compartment. The second is the quantitative difference in the amount of tissue calcium found by the ICP and 45Ca methods. Combined with fluorescent probe studies of cytoplasmic calcium ([Ca2+]i) (Tsien, 1989; Neher and Augustine, 1992; O'Donnell and Bickler, 1994) and prior studies of tissue Ca2+ labeling with 45Ca as a function of time (Moriarty, 1980; Kass and Lipton, 1986; Newman et al., 1995; Patlak et al., 1998), the existence of this bound material indicates that there are at least five kinetically distinct Ca2+ compartments in brain (Fig. 5). It is barely necessary to state that there are almost certainly many more than five tissue Ca2+ compartments given the large number of Ca2+ binding macromolecules and Ca2+ sequestering organelles in neurons and in glia. The whole-slice methods used in these studies cannot differentiate Ca2+ related to these cell types or binding sites, so that the kinetic compartments are certainly heterogeneous. In addition, these equilibrium methods provide no information about the inter-relationships among the five compartments. Thus, the interrelationships of the model shown in Fig. 5 are based solely on the assumptions that (1) Ca2+ (flow is from free in ECS to extracellular binding) and then to intracellular spaces, which can be either free in cytoplasm, bound or sequestered intracellularly; and that (2) nonexchangeable Ca2+ derives from one or more intracellular compartments.
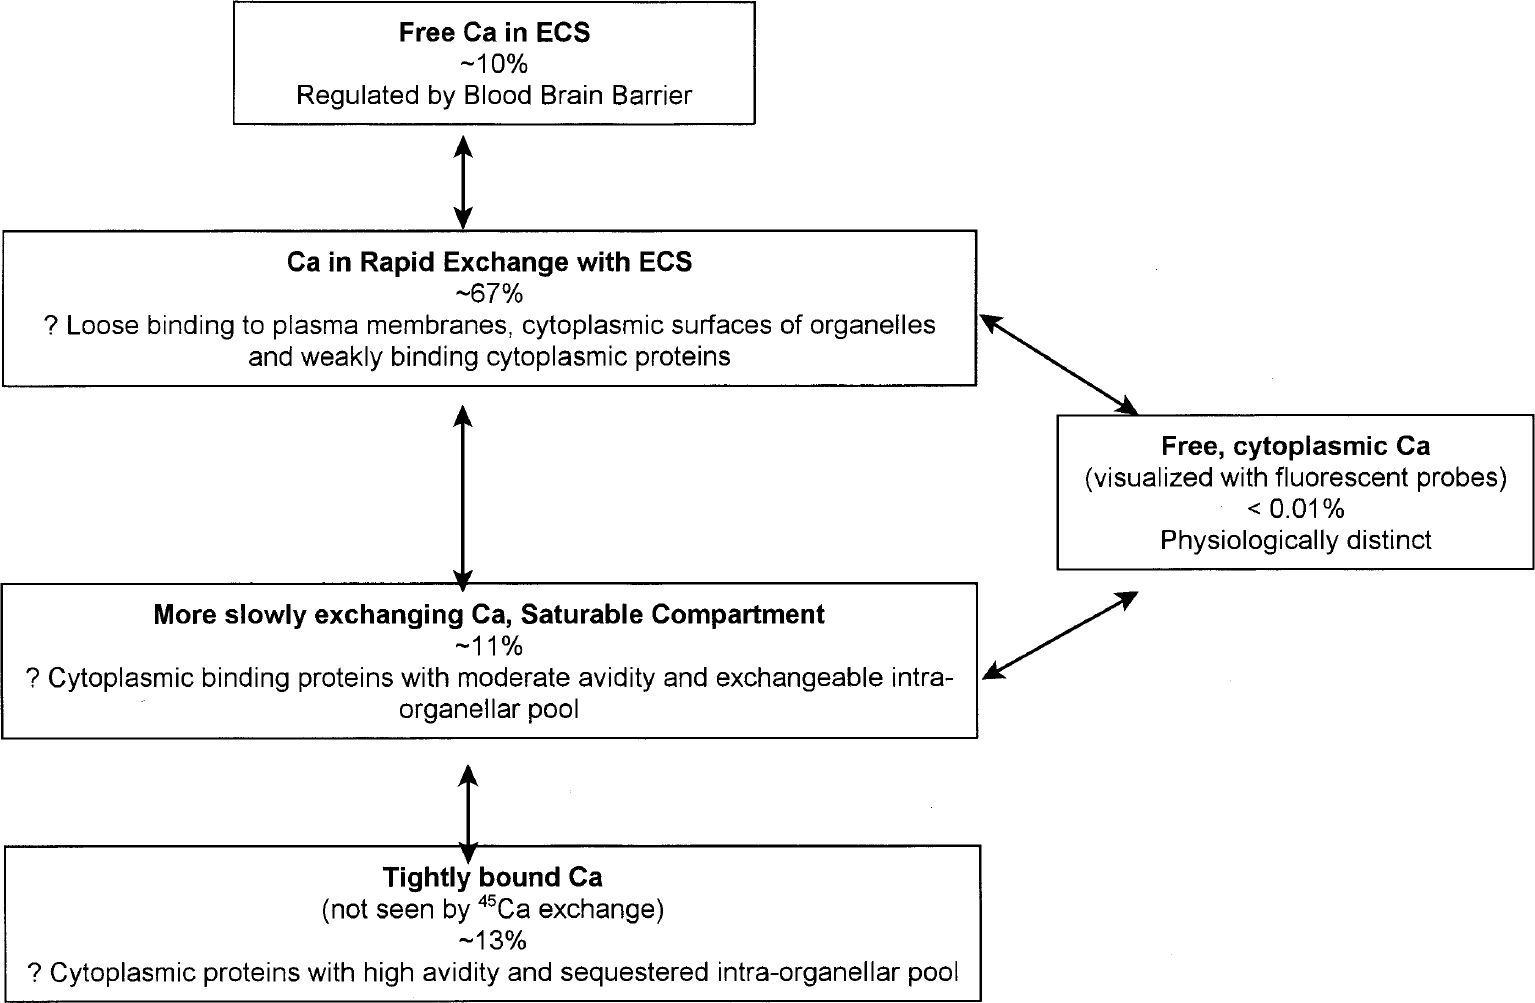
Summary of kinetic compartments suggested by these and related studies. Included are kinetic descriptions of the Ca2+ spaces, the relative size of each compartment determined by inductively coupled plasma measurements, and hypothetical tissue correlates. ECS, extracellular space.
The first compartment is simply the free Ca2+ in the extracellular space (CaECS). Blood–brain barrier regulation of this compartment is apparently crucial for normal physiologic function because it appears that tissue calcium rapidly equilibrates with free extracellular calcium. This rapid equilibrium may explain why cerebrospinal fluid [Ca2+] is defended so carefully in vivo against changes in blood [Ca2+] (Merritt and Bauer, 1931; Katzman and Pappius, 1973; Tai et al., 1986; Murphy et al., 1988). The amount of Ca2+ in this compartment is readily calculated from the product of [Ca2+]o and the volume of ECS in brain, which is approximately 0.20 mL/g in vivo but slightly larger, at 0.25 mL/g, in slices (Patlak et al., 1998). In hippocampal slices, this amounts to 0.375 μmol/g tissue in the ECS, representing just over 10.5% of total tissue Ca2+ at 1.5 mmol/L. Ca2+ movement through this space is well described by traditional diffusion equations (Nicholson and Rice, 1987; Patlak et al., 1998).
The second, and by far the largest, tissue Ca2+ compartment demonstrates linear binding throughout the experimental range of these studies. At 1.5 mmol/L [Ca2+]o, the present studies suggest that this compartment contains approximately 2.35 μmol/g tissue in hippocampal slices, or nearly 67% of total tissue Ca2+. The estimated size of Space 1, at 1.54 μmol/g tissue, is in good agreement with our prior finding of 1.7 ± 0.1 μmol/g tissue for this compartment, obtained from kinetic exchange studies with 45Ca at 1.5 mmol/L [Ca2+]o (Newman et al., 1995; Patlak et al., 1998). The Langmuir isotherm analyses of data from all three measurements suggest that this compartment is still linear at 4.5 mmol/L, well above the physiologic range of CaECS. Prior 45Ca kinetic experiments already cited have demonstrated that this compartment exchanges rapidly with extracellular Ca2+. It is proposed that this compartment represents Ca2+ in equilibrium with anionic sites embedded within the external surface of the plasma membranes. Evidence supporting this assignment and the associated binding properties have been carefully summarized (Kostyuk, 1992; Nemere, 1990). Support comes from model membrane systems (McLaughlin et al., 1971) as well as directly from neuronal cells using techniques such as shifts in current-voltage characteristics of ionic currents and electrophoretic mobility of isolated cells (Kostyuk, 1992). It is believed that Ca2+ actually binds to the membrane surface charges rather than only forming a screening diffusion layer such as occurs at solid, smooth surfaces. Binding to the extracellular membrane can be described by the Stern modification of the Gouy-Chapman theory using a single-compartment Langmuir isotherm (Kostyuk, 1992). Ca2+ is thought to contribute to membrane stability through cross-linking of the surface charges and is an important determinant of the intramembrane electric field. Prior studies have been unable to establish whether the extensive Ca + binding to external membrane charges is caused by a small number of tightly bound charges or a large number of loosely bound charges. Although also not conclusive, our past and present results strongly favor the latter.
The third compartment is of moderate size and characterized by binding that is reversible but distinctively more avid than that of the large second compartment (Table 3). The Langmuir isotherm analyses of the 45Ca and ICP experiments indicate a Ca2+ content of approximately 0.41 μmol/g tissue at 1.5 mmol/L [Ca2+]o representing 11% of the total tissue Ca2+. This is somewhat less than our prior estimates of 0.56 ± 0.07 μmol/g tissue for this compartment obtained by the exchange equilibrium 45Ca kinetic experiments (Patlak et al., 1998). Our prior kinetic experiments also suggest that rate constants for this compartment are significantly slower than those found for the large second compartment, although much greater than the irreversibly bound Ca2+ in the Bound compartment. The Km2 estimates of 0.018 to 0.058 mmol/L indicate that the third compartment would be nearly saturated and, therefore, relatively constant under physiologic conditions. The compartment would exhibit linear binding properties only at times of pathologically low CaECS such as may occur during ischemia or in association with intense epileptic activity (Heinemann et al., 1986; Vezzani et al., 1988). Based on these kinetic properties, we propose that this compartment includes a heterogeneous mixture of Ca2+ binding proteins, such as parvalbumin, calmodulin, and calbindin-D28K (Baimbridge et al., 1992) as well as Ca2+ sequestering organelles, including mitochondria and specialized endoplasmic reticulum (Nemere, 1990; Verkhratsky and Petersen, 1998). In Fig. 5, we assume that this compartment exchanges with Ca2+ of the external plasma membrane as well as with Ca2+ that is free in the cytoplasm, although many other models would also be consistent with the kinetic data.
A fourth kinetic compartment, characterized by essentially irreversible Ca2+ binding, has been identified by these studies. Ca2+ in this compartment can be observed with methods that detect total Ca2+ (SRIXE and ICP) but not by 45Ca exchange, leading us to designate this compartment as Bound. This compartment appears to contain between 0.40 and 0.55 μmol/g tissue at 1.5 mmol/L [Ca2+]o, representing between 11% and 15% of the total. Ca2+ in this compartment does not exchange significantly during the 70-minute 45Ca labeling period and would remain virtually constant at any Ca2+ concentration. It appears very unlikely that this compartment is simply an artifact of brain slice incubations at low calcium concentrations. Ca2+ in this compartment may serve structural functions within the cell, may be avidly bound to other nonstructural macromolecules, or may be sequestered in organelles in a manner that excludes exchange during routine physiologic processes. For the purposes of developing a model of tissue function, the Bound compartment has been placed in series with the third compartment, but this cannot be established from any existing data. It should be noted that studies with 45Ca performed during hypoxia or ischemia have demonstrated irreversible labeling of a tissue compartment that has not been further characterized (Kass and Lipton, 1986; Newman et al., 1995; Patlak et al., 1998).
The fifth tissue Ca2+ compartment is not observed with any of the techniques used in the present study but consists of free, cytoplasmic Ca2+, which is elegantly demonstrated by fluorescent probe techniques (Tsien, 1989; O'Donnell and Bickler, 1994). Although minuscule, at a concentration of approximately 0.130 nmol/g tissue, representing less than 0.005% of tissue Ca2+, its regulation is of critical importance to the normal function of the cell. Under hypoxic and ischemic conditions, this compartment has been observed to increase to as much as 10 nmol/g tissue which, however, is still less than 0.3% of total tissue Ca2+ (Bickler and Hansen, 1994).
The concept of tissue Ca2+ buffering has arisen to explain certain phenomena observed with intracellular Ca2+-sensitive fluorescent dyes in neural tissues. For instance, in chromaffin cells, when Ca2+ is introduced into a FURA-2 loaded cell via pipet, the size of the signal indicates the presence of Ca2+ binding or sequestration that competes with the buffering capacity of the dye (Neher and Augustine, 1992). The same phenomenon is observed when Ca2+ enters depolarized CA1 pyramidal neurons in brain slices (Helmchen et al., 1996). In both cases, the “buffer” is found to be immobile; that is, it cannot be removed by dialysis and does not move in the cell. Interestingly, the findings in chromaffin cells can be described by a two-compartment kinetic model in which the first compartment is very rapid and unsaturable and appears to be associated with the plasma membrane. The second compartment is slower, with a time course of seconds instead of milliseconds, and is ascribed, without further experimental support, to organellar pumps and “slow buffers.” These two studies provide limited quantification, suggesting only that at least 98% to 99.5% of the Ca2+ is buffered. The existence of intracellular buffers has also been hypothesized on the basis of the limitation of Ca2+ mobility in cells observed with fluorescent dyes and high-speed imaging, again without further quantification (Jaffe et al., 1994). Perhaps the most thorough attempt to quantify the degree of buffering involved the simultaneous quantification of free, cytoplasmic Ca2+ and influx of 45Ca into isolated synaptosomes (Fontana and Blaustein, 1993). Estimates based on depolarization-induced entry of Ca2+ yield buffering capacities of between 1,000:1 and 3,500:1, meaning that for every free atom of Ca2+ in the cytoplasm, 1,000 to 3,500 atoms are bound or sequestered. However, if total intraterminal Ca2+ is measured and compared with the resting free, cytoplasmic Ca2+, then the buffering capacity is estimated to be as high as 12,800:1. A similar study, also in synaptosomes, has yielded the same estimated range of buffering capacity, between 4500:1 to 11,200:1 (Duarte et al., 1991).
The buffering capacity estimates from our measurements depend on which compartments are included. Clearly, extracellular calcium, Bound calcium, and the free, cytoplasmic Ca2+ itself cannot contribute to buffering of free, cytoplasmic Ca2+, leaving only the two Langmuir isotherm compartments as candidates. Certainly the third compartment, ascribed to reversible calcium binding proteins and organellar sequestration, should be included, but it is less clear whether the large second compartment, tentatively assigned to the external plasma membrane, should be included as well. Assuming a resting free, cytoplasmic concentration of 0.15 μmol/L (Bickler and Hansen, 1994), restricting the buffering capacity to the third compartment would yield a buffering ratio of 2,700:1, whereas adding the second compartment would increase the estimate to 13,000:1. These calculations are entirely consistent with the fluorescent probe studies in synaptosomes. Together with those studies, our results suggest that the exact time course and experimental conditions of the experiment may determine the observed value for buffering capacity by including one or both of the available kinetic Ca2+ compartments.
These results are subject to the usual qualifications relevant to brain slice experiments, including the acute trauma and ischemia sustained during slice isolation, the potential of brain slices to gain water, and the absence of capillary perfusion in the system. We attempt to minimize slice swelling by including dextran in our incubation buffer to provide an oncotic driving force and prevent water uptake. Swelling also could be reduced by including ascorbate in the incubation buffer (Brahma et al., 2000). The accompanying histologic and metabolic studies demonstrate that there is minimal additional injury caused by high or low [Ca2+]o. The Ca efflux experiments (Fig. 4) and prior kinetic studies (Patlak et al., 1998) demonstrate that more than 90% of the exchangeable tissue Ca2+ in the third compartment will have completed exchanged during 70 ± 5 minutes average incubation time of these experiments. The calculations of data by SRIXE are subject to the limitations that no measurement of slice mass was obtained, so that the results depend on the assumptions of uniform chopping thickness and drying as well as the assumption that K+ remains constant when Ca2+ is lowered. Because the latter may not be strictly true (Murphy et al., 1988), these assumptions may introduce additional error in the calculations of absolute tissue Ca2+. However, based on comparison with ICP data, this appears to be a relatively minor factor.
These studies at low extracellular Ca2+ concentrations help elucidate the complex metabolism of this critical ion. There is a large amount of Ca2+ in brain, with total tissue levels that are ∼250% of an equivalent volume of extracellular fluid. A bound tissue Ca2+ compartment was demonstrated. Thus, at least five compartments can be identified by kinetic and fluorescent probe methods. The quantitative “buffering capacity” of hippocampal slices will vary according to which Ca2+ compartments are included but, based on these and other experiments, calcium-buffering capacity will be between ∼2,500 and ∼13,000 binding sites per free, cytoplasmic Ca2+ molecule. Future studies should continue efforts to assign specific cellular components to these kinetic compartments pharmacologically.