
Abstract
The role of cell type-specific Na+,K+-ATPase isozymes in function-related glucose metabolism was studied using differentiated rat brain cell aggregate cultures. In mixed neuron-glia cultures, glucose utilization, determined by measuring the rate of radiolabeled 2-deoxyglucose accumulation, was markedly stimulated by the voltage-dependent sodium channel agonist veratridine (0.75 μmol/L), as well as by glutamate (100 μmol/L) and the ionotropic glutamate receptor agonist N-methyl-
The stimulation of neuronal activity in distinct brain regions causes increased local glucose consumption, as demonstrated in laboratory animals by the quantitative autoradiographic 2-deoxyglucose (2-DG) method (Sokoloff, 1993) and in humans by noninvasive brain imaging techniques such as positron emission tomography. This function-related activation of local energy metabolism was found mainly in the neuropil and synapse-rich regions (Sokoloff, 1993). However, because of the intimate morphologic and functional interactions between neurons and astrocytes in these regions and the limited spatial resolution of the various imaging techniques, it was not possible to localize the function-related changes in glucose consumption at the cellular level. Furthermore, although it has been established that the increase in the glycolytic flux resulting from increased neuronal activity is directly linked to the activation of Na+,K+-ATPase (Mata et al., 1980; Sokoloff, 1993), it remains to be elucidated to which extent neurons and glial cells participate in this global response. In neurons, the Na+,K+-ATPase is thought to be crucial for the maintenance of excitability, whereas in glial cells, this pump appears to be responsible for the control of extracellular K+, which tends to accumulate during neuronal excitation. In all cell types, the Na+,K+-ATPase is required for cellular ion homeostasis and volume control, as well as for the carrier-mediated cotransport of various solutes across the plasma membrane.
The functional Na+,K+-ATPase is formed by two catalytic subunits (α) and two glycoprotein subunits (β), also termed regulatory subunits. Of both subunits, there are three known isoforms (α1, α2, α3 and β1, β2, β3, respectively). The catalytic subunit isoforms show distinct binding affinities for the cardiac glycoside ouabain (Sweadner, 1979; Walz and Hertz, 1982), whereas the combination with a particular regulatory subunit determines their affinity for Na+ and K+ (Jewell and Lingrel, 1991; Eakle et al., 1994; Blanco et al., 1995; Therien et al., 1996). The expression of these subunits in the brain is cell type-specific (McGrail et al., 1991; Watts et al., 1991; Fink et al., 1996; Peng et al., 1998) and is influenced by the cellular environment (Cameron et al., 1994; Fink et al., 1996; Peng et al., 1998). Furthermore, several isoforms show maturation-dependent expression (Inoue et al., 1988; Corthésy-Theulaz et al., 1990, 1991; Cameron et al., 1994; Fink et al., 1996; Peng et al., 1998). All known Na+,K+-ATPase subunit isoforms have been detected in the brain, although at different levels of expression (McGrail et al., 1991; Watts et al., 1991; Cameron et al., 1994; Peng et al., 1998). These studies show that the catalytic isoform cd, exhibiting low affinity to ouabain, is expressed by all neurons and glial cells, whereas the isoforms α2 and α3 with high ouabain affinity are differentially expressed in neurons and glial cells. The α3 isoform is expressed exclusively by neurons. The physiologic role of the various isozymes of Na+,K+-ATPase in neurons and glial cells is not completely elucidated. Whereas a considerable body of data shows that in astrocytes, Na+,K+-ATPase mediates an increase of glucose utilization in response to different neuronal cues (Cummins et al., 1979; Brookes and Yarowsky, 1985; Yarowsky et al., 1986; Hertz and Peng, 1992; Pellerin and Magistretti, 1994, 1996, 1997; Peng et al., 1996; Sokoloff et al., 1996), relatively few studies (e.g., Inoue and Matsui, 1990; Erecinska et al., 1991) address the question of a direct, neuronal link between membrane depolarization and increased glycolytic flux.
The current work examines the role of neuron-specific Na+,K+-ATPase in the depolarization-induced increase of glucose consumption. To this end, we used aggregating brain cell cultures prepared from fetal rat telencephalon and grown in a chemically defined medium. Neuron-glia mixed-cell cultures and neuron-enriched cultures were investigated. Previous work showed that these three-dimensional brain cell cultures exhibit maturation-and cell type-dependent expression of the Na+,K+-ATPase subunits, comparable with brain tissue in vivo (Corthésy-Theulaz et al., 1990, 1991). Measuring the rate of accumulation of radiolabeled 2-DG, we studied glucose utilization in response to activity-related stimuli such as membrane depolarization and elevated extracellular potassium.
MATERIALS AND METHODS
Cell culture
Aggregating cell cultures were prepared from mechanically dissociated fetal (ED 16) rat (Sprague-Dawley; BRL, Füllinsdorf, Switzerland) telencephalon and grown in a chemically defined medium under continued gyratory agitation (80 rpm) at 37°C in an atmosphere of 10% CO2/90% humidified air (Honegger and Monnet-Tschudi, 1997). The regular growth medium used was Dulbecco's modified Eagle's medium (DMEM) (Gibco, Life Technologies, Basel, Switzerland), 25 mmol/L
Culture treatments
For the different treatments, drugs were added directly to the medium from concentrated stock solutions. The drugs were added just before the initiation of the 2-DG uptake measurements. With chemicals requiring organic solvents (either ethanol or dimethylsulfoxide) for solubilization, the final solvent concentration in the medium never exceeded 0.05%, a concentration which did not affect 2-DG uptake. To increase the level of KCl in the culture medium, corresponding volumes of culture supernatant were replaced by an isoosmolar solution of KCI (185 mmol/L; 340 mOsm), In this case, control cultures received equal amounts of an isoosmolar NaCl solution. Hypoxic conditions were generated by flushing cultures for 3 minutes with a mixture of 90% N2/10% CO2 and then closing the culture flasks (DeLong glass flasks) hermetically with rubber stoppers. Although this treatment may have caused anoxia in the course of the experiment, the term hypoxia is used in this report to indicate that the total absence of oxygen was not certain. For pharmacologic treatments under hypoxic conditions, drugs were added under the anaerobic gas flow just before closing the flasks with rubber stoppers.
Measurement of 2-deoxyglucose uptake
To measure the rate of 2-DG uptake, aggregates from several flasks were pooled, and their medium replaced by fresh growth medium containing 5.5 mmol/L of
Biochemical analyses
For biochemical analyses, cultures were washed twice with 5 mL of ice-cold phosphate-buffered saline and homogenized in 0.5 mL of 2 mmol/L potassium phosphate buffer containing 1 mmol/L ethylenediamine tetraacetic acid (pH 6.8) using glass-glass homogenizers (Bellco). The homogenates were briefly sonicated, divided into aliquots for the different assays, and stored at -80°C. The activities of the neuron-specific enzymes, GAD (EC 4.1.1.15) and ChAT (EC 2.3.1.6), and of the astroglial enzyme, GS (6.3.1.2), were determined by radiochemical assays as described in detail elsewhere (Honegger and Monnet-Tschudi, 1997). The oligodendrocyte-related enzyme CNP (EC 3.1.4.37) was assayed spectrophotometrically as described previously (Honegger and Monnet-Tschudi, 1997). Enzyme activities were expressed as units per milligram of protein, where 1 unit is defined as the conversion of 1 μmol of substrate per minute. Protein concentrations were determined by the Lowry method using bovine serum albumin as a standard. The glucose concentration in media supernatants was determined by the glucose oxidase method (Beckman Glucose Analyzer 2).
Chemicals
Powders for culture media preparation were from Gibco Life Technologies; the other media components were from Fluka (Buchs, Switzerland) (vitamin B12) and Sigma (St. Louis, MO, U.S.A.). Drugs were purchased from Tocris (Bristol, U.K.) (AMPA; CNQX, MK801 maleate; cyclothiazide; NMDA); Alexis (Laufelfingen, Switzerland) (staurosporine, FK506, and KN-62); Sigma (kainic acid, veratridine; cytosine arabinoside); Alomone labs, Jerusalem (Israel) (α-latrotoxin and tetrodotoxin); and Fluka Buchs, Switzerland (cyclosporin A, ouabain, picrotoxin).
Statistical analyses
The data are expressed as mean ± SD. Each value is the mean of at least three individual cultures. Each experiment was repeated at least twice using batches of different culture preparations. All results were concordant. The significance of differences was tested by ANOVA followed by the Dunnett's posttest. Differences were considered significant when P < 0.05.
RESULTS
Relation between 2-DG uptake and glucose utilization
Serum-free aggregating cell cultures of fetal rat telencephalon (DIV 21) were used to compare the rate of 2-DG uptake with the rate of glucose consumption. For the assay, the free-floating aggregates were pooled from several flasks and the medium replaced by fresh growth medium containing 5.5 mmol/L
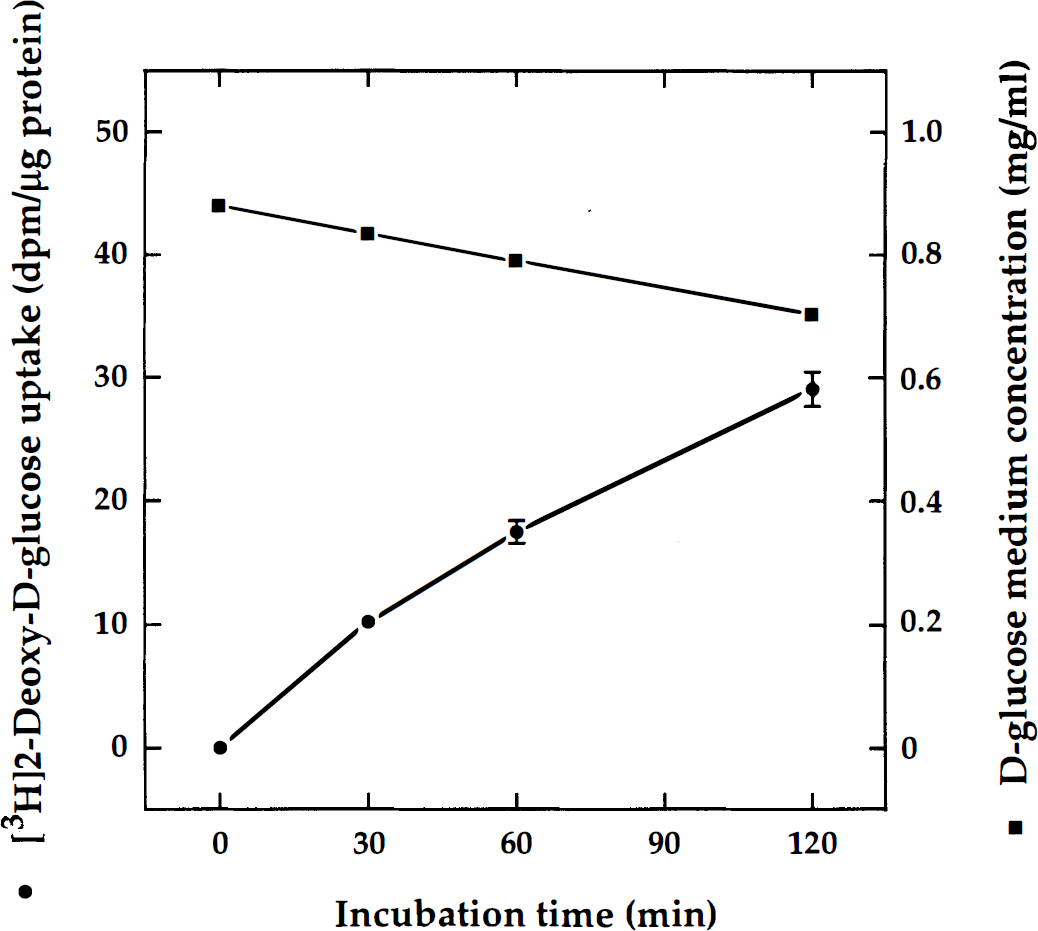
Glucose consumption and uptake of 2-deoxyglucose (2-DG) in aggregating brain cell cultures. Mixed neuron-glia cell aggregate cultures (day in vitro [DIV] 21) were incubated in fresh growth medium containing 5.5 mmol/L of
Stimulation of glucose utilization by depolarizing agents and by hypoxia
Aliquots of mixed-cell aggregate cultures (DIV 21) were used to measure 2-DG uptake under different stimulatory conditions. For neuronal depolarization, cultures received veratridine (0.75 μmol/L), an activator of voltage-gated Na+ channels, and NMDA (10 μmol/L) as specific agonist of a subtype of the ionotropic glutamate receptors. For comparison, the stimulation of glycolysis under hypoxic conditions was examined in parallel, since this response (also called inverse Pasteur effect) is a well-known phenomenon in the brain. Hypoxic conditions were obtained by flushing culture flasks for 3 minutes with a mixture of 90% N2/10% CO2 and keeping the glass flasks gas-tight during incubation with the tracer. The results (Fig. 2) show that all three treatments caused marked increases in 2-DG uptake. Compared with the untreated controls (taken as 100%), 2-DG uptake increased to 256% in the presence of veratridine, 183% with NMDA, and 261% under hypoxic conditions. In analogous experiments with immature cultures (DIV 7), it was found (data not shown) that at this early stage of maturation, the increase of glucose utilization in response to depolarizing agents was insignificant, whereas the response to hypoxia was pronounced (221%). This observation is in accord with the view that the switch to anaerobic glycolysis results from the metabolic regulation of enzyme activities, whereas the depolarization-induced response involves plasma membrane pathways that are subject to cellular maturation.
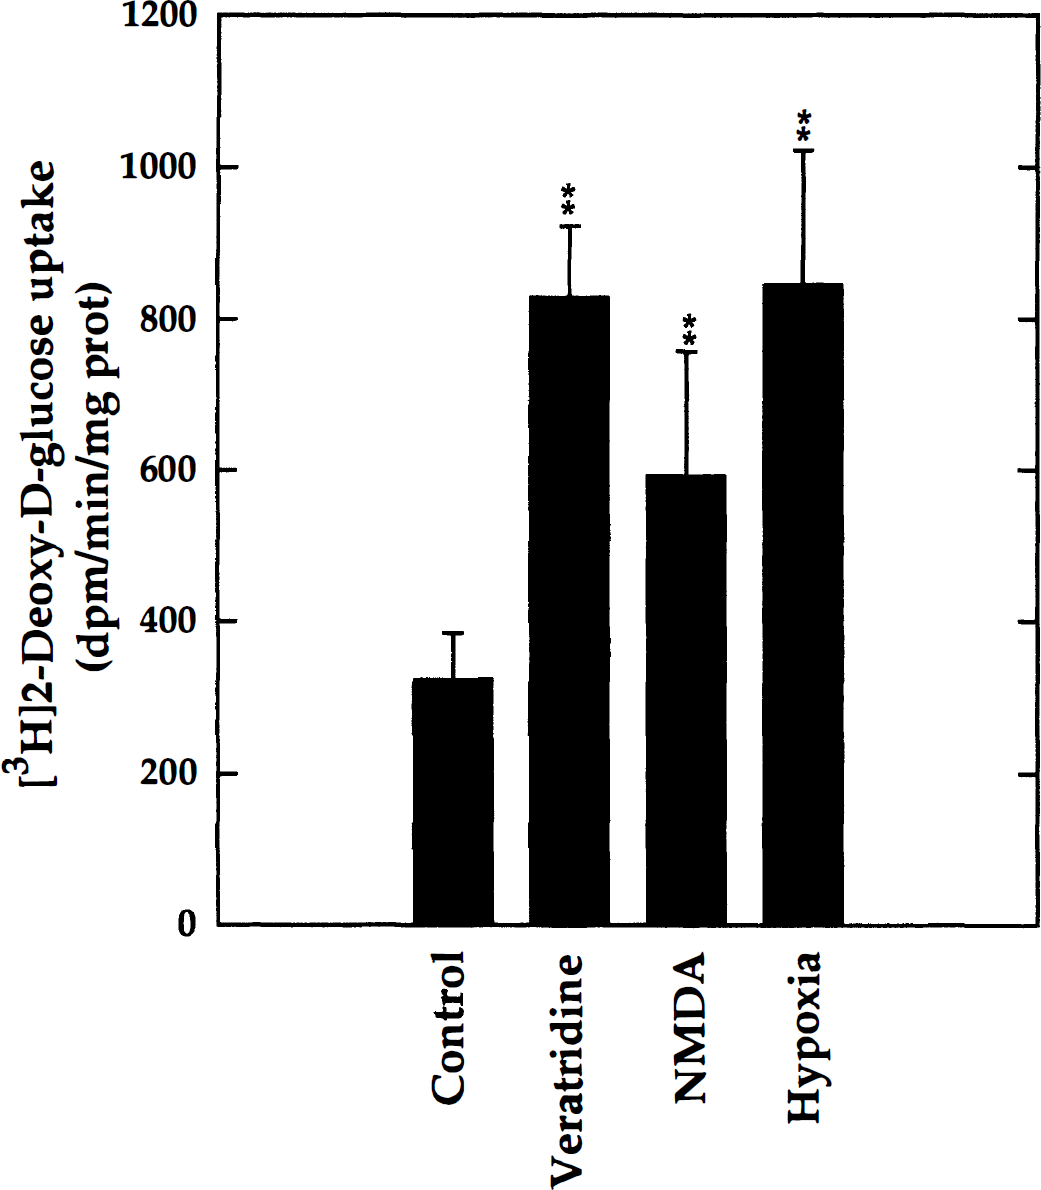
Stimulation of 2-DG uptake by the depolarizing agents veratridine and N-methyl-
To further distinguish between neuron- and glia-specific responses, neuron-enriched cultures were studied in parallel with their mixed-cell (neuron-glia) counterparts. Neuron-enriched aggregate cultures were used at DIV 22 to measure the stimulation of 2-DG uptake by veratridine (0.75 μmol/L) and NMDA (10 μmol/L) and to examine the specificity of these responses using specific antagonists, that is, tetrodotoxin (1 μmol/L) blocking voltage-gated Na+ channels and MK801 (20 μmol/L), a noncompetitive antagonist of NMDA receptors. As was found previously using neuron-glia mixed-cell cultures (Fig. 2), the results obtained with neuron-enriched cultures showed (Fig. 3) that 2-DG uptake was significantly increased by veratridine (283%) and NMDA (193%). Furthermore, tetrodotoxin and MK801 completely blocked the glycolytic response to the corresponding agonists, veratridine and NMDA, respectively. Hypoxia also markedly increased 2-DG uptake (312%), and, as expected, this response was only slightly affected by tetrodotoxin and MK801. The blocking agents tetrodotoxin and MK801 tended to decrease the basal levels of 2-DG uptake, perhaps by reducing endogenous neuronal activity.
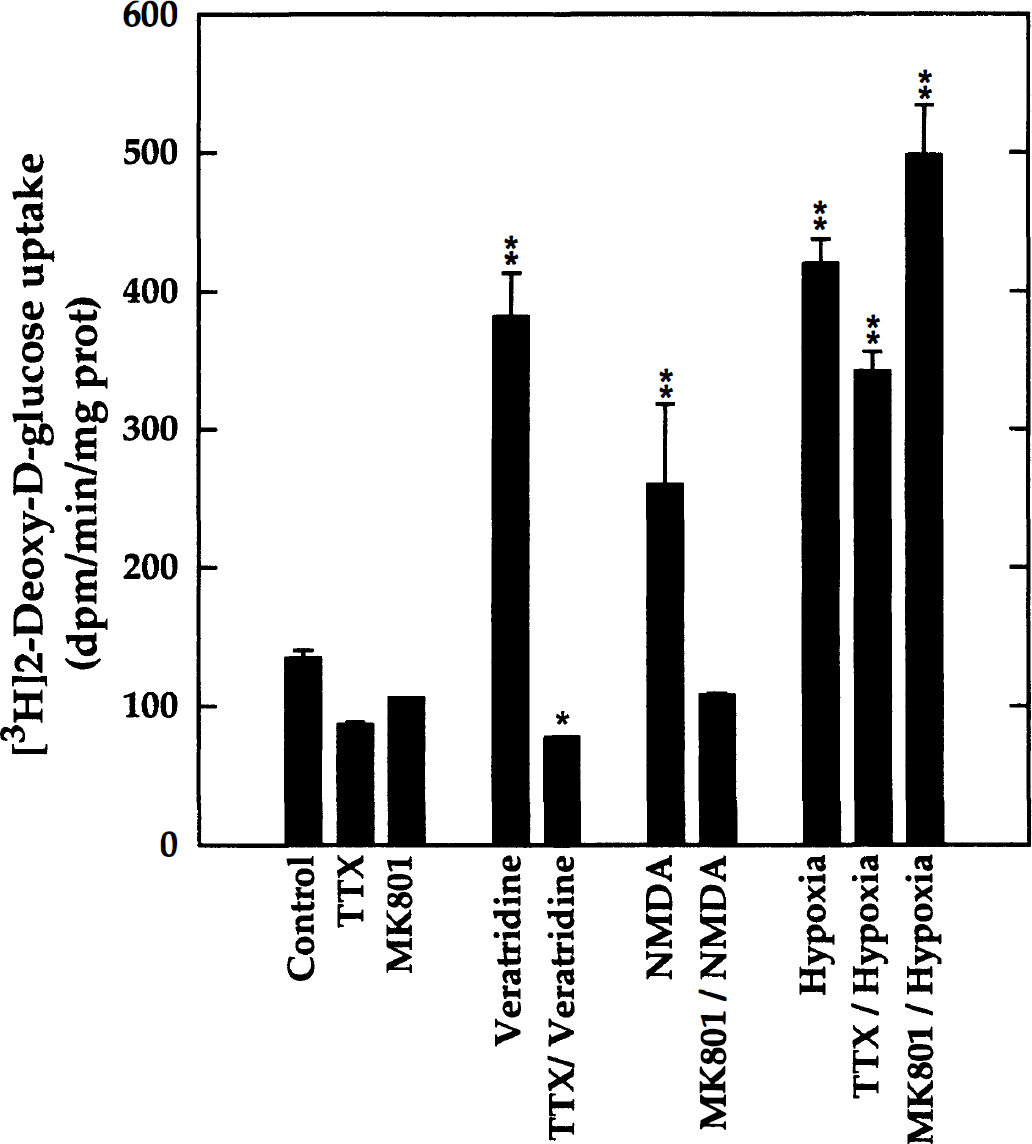
Stimulation of 2-DG uptake by veratridine, N-methyl-
To examine 2-DG uptake in response to glutamate, the prevailing excitatory neurotransmitter in the brain, mixed-cell aggregate cultures (DIV 20) were treated either with glutamate (100 μmol/L) or with α-latrotoxin (1 nmol/L), known to induce neurotransmitter release in cultured rat CNS neurons. Furthermore, antagonists (MK801 and CNQX) of NMDA- and non–NMDA-specific ionotropic glutamate receptor subtypes were applied to examine the specificity to the responses. It was found (Fig. 4) that α-latrotoxin significantly increased 2-DG uptake (129% of basal levels). Furthermore, cultures treated with glutamate (100 μmol/L) showed a large stimulation of 2-DG uptake (204%). Both the α-latrotoxin– and the glutamate-induced responses were abolished in the presence of the two ionotropic glutamate receptor blockers, MK801 (20 μmol/L) and CNQX (50 μmol/L). These results indicate that the glycolytic response elicited by glutamate resulted mainly from ionotropic receptor stimulation, whereas the possible glial response by increased glutamate transport was negligible. Furthermore, it appears that α-latrotoxin provoked the release of endogenous glutamate, which also stimulated 2-DG uptake through ionotropic glutamate receptor activation.
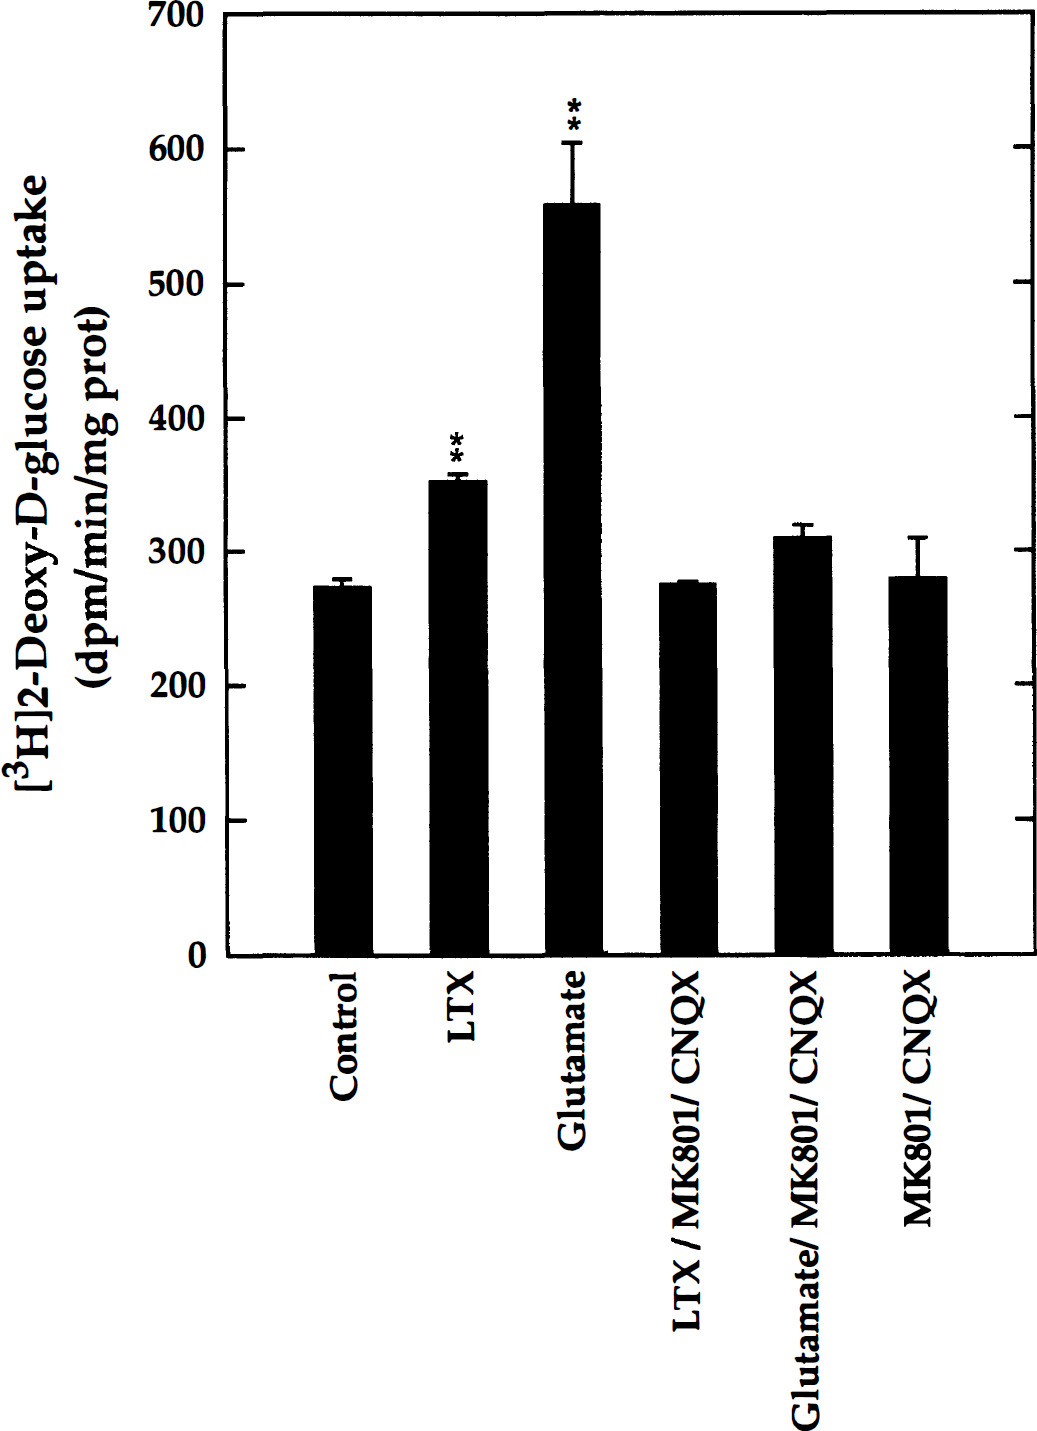
Stimulation of 2-DG uptake by glutamate and endogenous neurotransmitter release. Mixed neuron-glia aggregate cell cultures (DIV 22) received either L-glutamate (100 μmol/L) or α-latrotoxin (LTX, 1 nmol/L) to stimulate neurotransmitter release. The specificity of the responses was examined using a combination of blockers of ionotropic glutamate receptors, MK801 (20 μmol/L) and CNQX (50 μmol/L). Control cultures remained untreated. The rate of 2-DG uptake was determined in 30-minute incubations. Glutamate and α-latrotoxin significantly stimulated 2-DG uptake, and both effects were blocked by the two antagonists, indicating a glycolytic response through the activation of ionotropic glutamate receptors. Significant increases compared with untreated controls are shown: **P < 0.01; ANOVA/Dunnett (n = 3).
To further examine the concentration dependence of the glycolytic response to agonists of NMDA- and non–NMDA-specific ionotropic glutamate receptors, neuron-enriched cultures were treated with two different concentrations (1 μmol/L and 10 μmol/L each) of either NMDA, AMPA, or kainic acid. As shown in Fig. 5, all three agonists significantly stimulated 2-DG uptake. The stimulation with AMP A was maximal at 1 μmol/L, whereas NMDA elicited a significant effect only at 10 μmol/L. The response to kainic acid was concentration-dependent between 1 and 10 μmol/L. Additional experiments showed that cyclothiazide (50 μmol/L), known to block AMPA receptor desensitization, also significantly stimulated 2-DG uptake (172 ± 9%). In contrast to these specific activators of ionotropic glutamate receptors, glutamate up to 100 μmol/L did not stimulate glucose utilization in the neuron-enriched cultures (not shown). This latter finding may be explained by high endogenous (GABAergic) inhibition, since it was found that picrotoxin (50 μmol/L), a GABAA receptor antagonist, greatly increased glucose utilization in these cultures (342 ± 12% of untreated controls). These results taken together are in accord with a neuronal link between ionotropic glutamate receptor activation and increased glucose consumption.
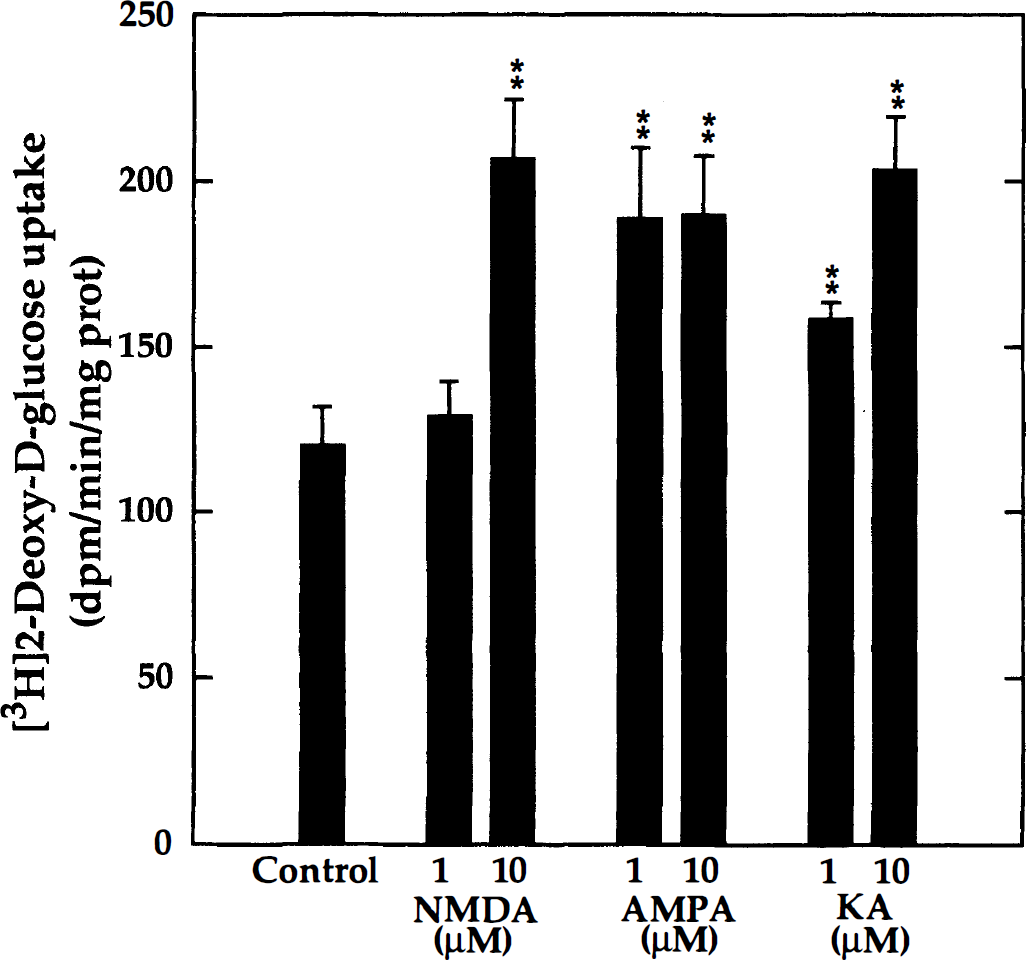
Concentration-dependent stimulation of 2-DG uptake by agonists of distinct ionotropic glutamate receptors. Neuron-enriched aggregate cultures (DIV 22) were treated with either N-methyl-
Stimulation of glucose consumption by elevated extracellular potassium
Neuron-glia (mixed-cell) aggregate cultures and their neuron-enriched counterparts (DIV 22 to 26) were exposed to elevated extracellular potassium (12 mmol/L and 30 mmol/L KCl), and the rate of 2-DG uptake was measured in 30-minute incubations. In unstimulated control cultures, the potassium concentration was 5 mmol/L, as in the regular growth medium. The results (Fig. 6) show that in mixed-cell cultures, 12 mmol/L KCl significantly increased 2-DG uptake (152% of basal levels). Exposure to 30 mmol/L KCl further increased the rate of 2-DG uptake (236%). The results from analogous experiments in neuron-enriched cultures (Fig. 6) showed no significant increase of 2-DG uptake at 12 mmol/L KCl, but a significant stimulation at 30 mmoliL KCl (182%). These findings indicate that the elevation of the extracellular potassium concentration to 12 mmol/L was not stimulatory to neurons, although it increased glucose utilization in astrocytes. The high potassium concentrations (30 mmol/L) also stimulated neurons, presumably through membrane depolarization.
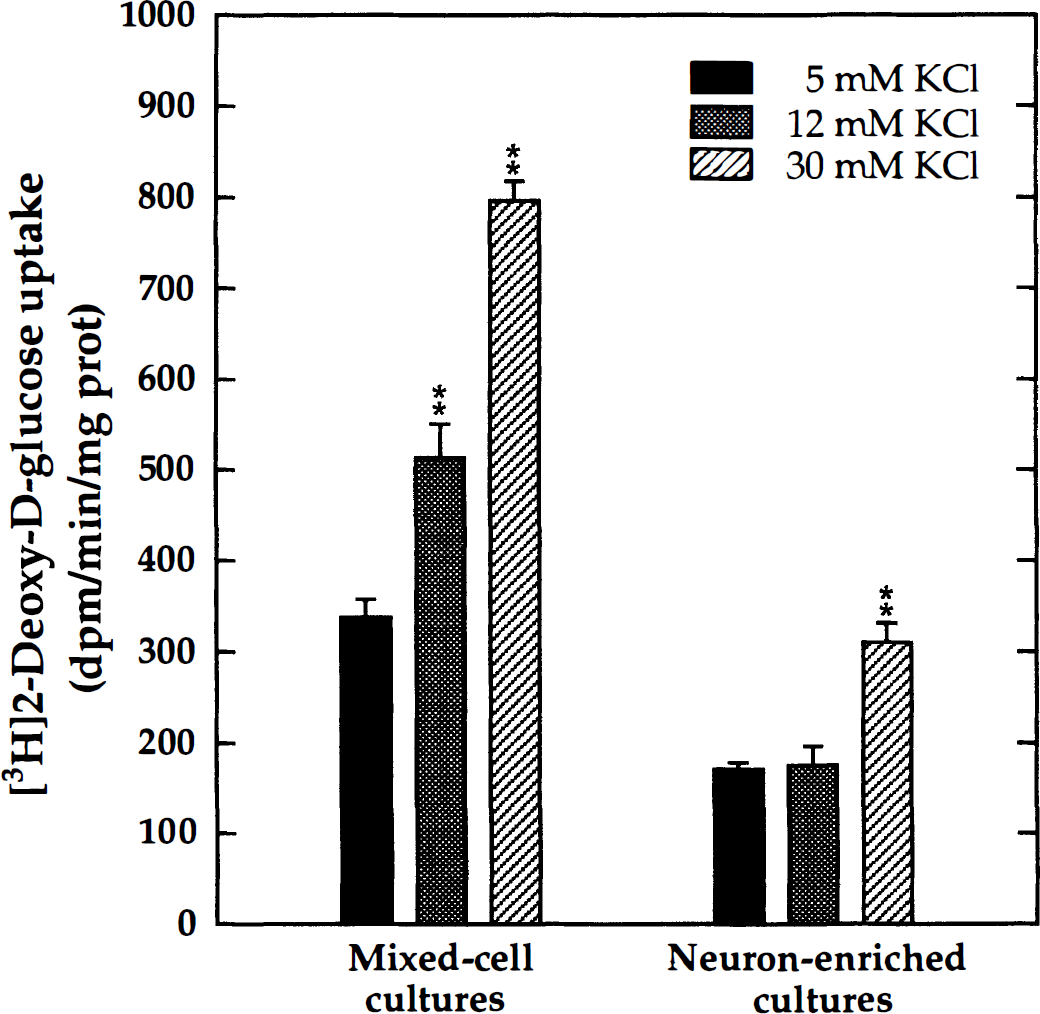
Effect of elevated extracellular potassium on 2-DG uptake in mixed-cell and neuron-enriched aggregate cultures. Cultures (DIV 22 to 26) were treated with aliquots of an isoosmotic KCl solution (185 mmol/L KCl; 340 mOsm) to obtain final media concentrations of 12 mmol/L and 30 mmol/L KCl. Control cultures (5 mmol/L KCl) received an equal volume of an iso-osmotic NaCl solution. The rate of 2-DG uptake was measured in 30-minute incubations. Mixed-cell cultures showed a concentration-dependent stimulation of 2-DG uptake by extracellular potassium, whereas neuron-enriched cultures responded only to the high potassium concentration. Significant increases compared with controls in 5 mmol/L KCl are shown: ** P < 0.01; ANOVA/Dunnett (n = 10).
Ouabain sensitivity of the glycolytic response to depolarizing agents and potassium
Mixed-cell aggregate cultures (DIV 21 to 23) were exposed to the various stimuli that were found to enhance 2-DG, that is, veratridine (0.75 /mol/L), NMDA (10 mmol/L), KCl (12 mmol/L), and hypoxia, either in the absence or in the presence of a relatively low concentration of ouabain (10−6 mol/L). Control cultures either remained untreated or received ouabain only. The measurements of the rate of 2-DG uptake under the various conditions showed (Fig. 7) that at this low concentration, ouabain had little effect on the basal level of 2-DG uptake, although it was able to abolish the increase of glucose utilization in response to veratridine and to NMDA. In contrast, ouabain reduced only partially the response to elevated potassium, suggesting that the neuronal response to depolarizing agents was more affected by ouabain than the glial (presumably astrocytic) response to elevated potassium. Furthermore, since ouabain is a specific inhibitor of Na+,K+ -ATPase, these results suggest that in both cell types the increase in glucose metabolism was mediated by distinct ouabain-sensitive isozymes. As expected, ouabain had little effect on the stimulation of glycolysis by hypoxia.
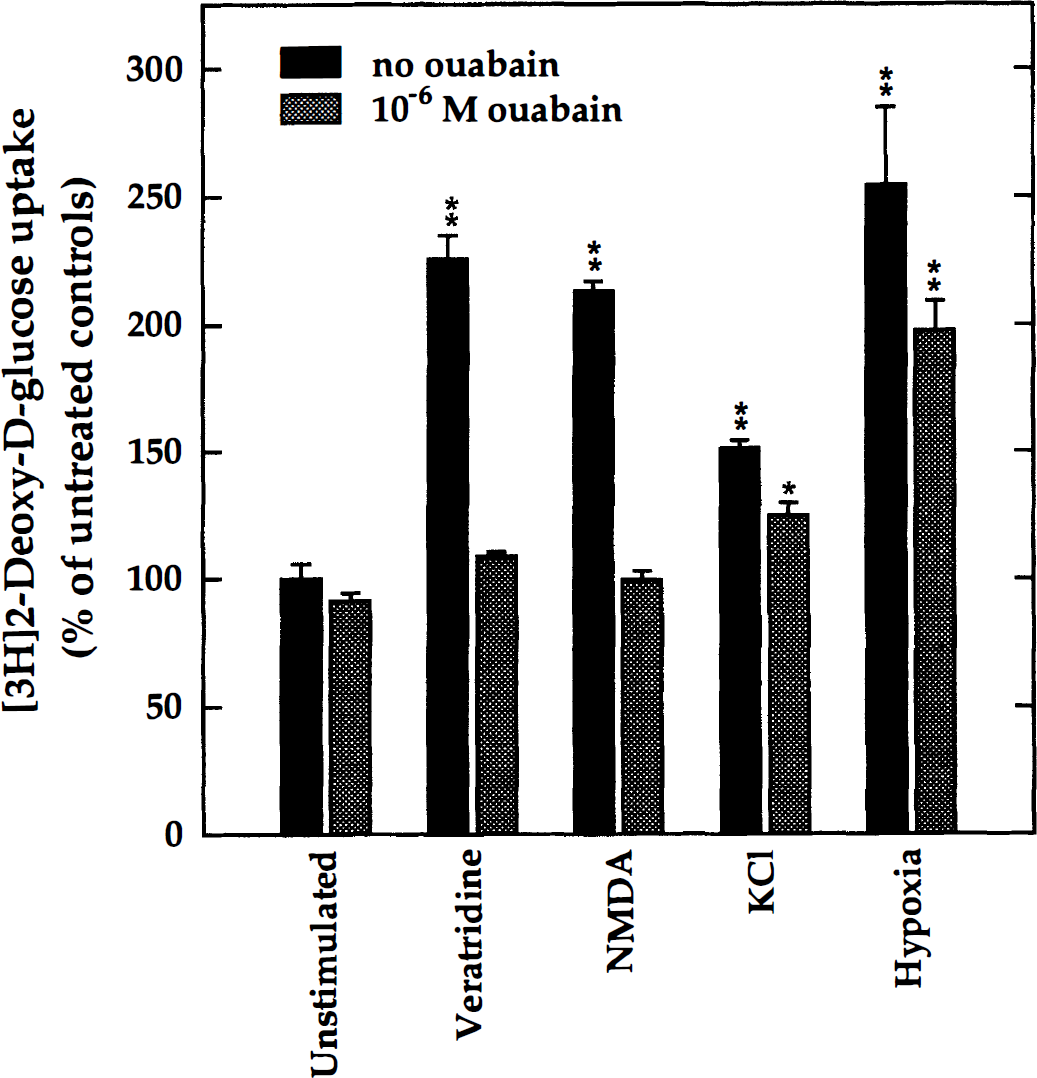
Ouabain-sensitivity of the glycolytic response. Mixed-cell cultures (DIV 21 to 23) received either veratridine (0.75 μmol/L), N-methyl-
DISCUSSION
In rat brain cell aggregate cultures, 2-DG accumulation increased nearly linearly as a function of time. The slight deviation from linearity that also had been observed in other studies (Takahashi et al., 1995) could have resulted from the dephosphorylation and washout of tracer (Yarowsky et al., 1986) caused by the stringent washing procedure applied. The rate of glucose consumption in mixed-cell cultures, estimated from the measurements of glucose medium concentrations (Fig. 1), was comparable with, although higher than, that reported in cultured astrocytes (Cummins et al., 1979; Brookes and Yarowsky, 1986). Furthermore, the rate of 2-DG uptake was higher in mixed-cell cultures than in the neuron-enriched counterparts, which is in good agreement with previous reports (Hertz and Peng, 1992; Takahashi et al., 1995; Sokoloff et al., 1996) showing higher resting energy metabolism in astrocytes than in neurons. Although the response of neurons to depolarizing agents appeared to be similar in neuron-enriched and mixed-cell cultures, the absolute values were higher in mixed-cell cultures. This difference was most pronounced when a depolarizing concentration of potassium (30 mmol/L KCl) was used as a stimulus (Fig. 6), and it might reflect higher endogenous inhibition or differences in the amount of neuropil, which appeared considerably more elaborated in mixed-cell cultures than in their neuron-enriched counterparts (Riederer et al., 1992; Honegger and Monnet-Tschudi, 1997). It is well established that the presence of glial cells is important for the formation of neuronal connectivity. On the other hand, the magnitude of the response to depolarizing K+ may vary, depending on the neuronal subtype: Peng et al. (1994), using high concentrations of KCl (50 mmol/L), found increased 2-DG uptake in astrocytes and cerebellar granule cells but relatively little stimulation in cerebral cortical neurons.
In neuron-enriched and mixed brain cell aggregate cultures, all depolarizing agents tested caused a marked stimulation of 2-DG uptake. Compared with the mixed-cell counterparts, neuron-enriched cultures showed a similar response to veratridine to specific activators of ionotropic glutamate receptors, and to 30 mmol/L KCl, but a distinct response to moderately elevated extracellular K+. Previous reports show that cultured astrocytes are able to respond to veratridine by membrane depolarization (Bowman and Kimelberg, 1984) and increased 2-DG uptake (Takahashi et al., 1995; Sokoloff et al., 1996). However, the concentration of veratridine used to elicit the latter response was 100-fold higher than in the current study. Glutamate also was shown to stimulate 2-DG uptake in cultured astrocytes (Stephens et al., 1993; Pellerin and Magistretti, 1994, 1997; Takahashi et al., 1995; Rose and Ransom, 1996; Sokoloff et al., 1996), but it is well established that this response involves a carrier-mediated ion transport rather than ionotropic glutamate receptor activation. In accord with this view is the observation that NMDA, in contrast to glutamate, did not affect the membrane potential of astrocytes (Bowman and Kimelberg, 1984). Furthermore, antagonists of NMDA and non-NMDA ionotropic glutamate receptors abolished the response to glutamate in neuron-glia aggregate cell cultures (Fig. 3) but not in pure astrocyte cultures (Sokoloff et al., 1996). The finding of a similar response pattern for all depolarizing agents in both neuron-enriched and mixed-cell cultures also supports the view that it was specific for neurons. The inhibition of these responses by low concentrations of ouabain (10−6 mol/L) suggests that they were mediated by a ouabain-sensitive, neuron-specific Na+,K+-ATPase. In contrast, the response to moderately elevated extracellular potassium (12 mmol/L KCl) could be attributed to glia (presumably astrocytes), since it occurred in mixed-cell cultures but not in the neuron-enriched counterparts, and it was only partially reduced in the presence of ouabain (10−6 mol/L). This conclusion is in good agreement with a number of observations in vivo (reviewed by Hertz and Peng, 1992) and in vitro (Cummins et al., 1979; Walz and Hertz, 1984; Brookes and Yarowsky, 1985; Hertz and Peng, 1992; Peng et al., 1996) showing that the elevation of extracellular K+ concentrations to 12 mmol/L stimulated glucose consumption in astrocytes (but not in neurons) through the activation of a glial Na+,K+-ATPase, whereas highly elevated K+ (above 20 mmol/L) caused indirect metabolic effects in astrocytes as well as neuronal depolarization. Extracellular K+ concentrations up to 12 mmol/L have been observed in vivo during seizures (Sykova, 1983) and are taken as the physiologic upper limit in the stimulated cerebral cortex (Cummins et al., 1979; Hertz and Peng, 1992). Astrocytes generally are recognized as being responsible for the regulation of extracellular K+, which increases during neuronal excitatory activity. The absence of a metabolic response to elevated K+ in certain astrocyte preparations (Takahashi et al., 1995) could be explained by the recent observation (Peng et al., 1996, 1998) that cultured astrocytes are highly variable in the expression of the cell type-specific Na+,K+-ATPase isoforms.
The differential effect of ouabain on the depolarization- and potassium-induced increase in glucose utilization (Fig. 7) indicates the involvement of two distinct cell type–specific isoforms of Na+,K+-ATPase. Neurons can express both ouabain-sensitive catalytic subunit isoforms α2 and α3 as well as the regulatory subunit isoforms β1 and β2, but β2 and β2 are not always present in cerebral neurons (McGrail et al., 1991; Cameron et al., 1994). Furthermore, cortical astrocytes appear to express predominantly α2 (besides the ubiquitous catalytic isoform α1) and β2 as the most prevalent regulatory isoform (McGrail et al., 1991; Cameron et al., 1994). Similarly, as shown previously (Corthésy-Theulaz et al., 1990, 1991), in aggregate brain cell cultures, α3 and β1 isoforms were predominant in neuron-enriched cultures, whereas α2 and β2 isoforms were prevalent in glial cell-enriched cultures. Furthermore, in mixed-cell (neuron-glia) aggregate cultures, the transcripts of all isoforms examined (i.e., α1, α2, α3, β1, β2) were detected in proportions similar to those observed in vivo (Corthésy-Theulaz et al., 1990, 1991). It therefore appears likely that the depolarization-induced increase of glucose consumption in neurons was mediated by a Na+,K+-ATPase containing the α3β1 isoforms. Indeed, expressed in HeLa cells, the α3β1 combination showed relatively low Na+ affinity (Jewell and Lingrel, 1991), which would be appropriate for a Na+ pump that is supposed to respond only to elevated levels of intracellular Na+. In accord with this view, Inoue and Matsui (1990) showed in cultured cerebral neurons that glutamate as well as veratridine markedly increased the activity of the highly ouabain-sensitive isoform of Na+,K+-ATPase through an increase of intracellular Na+. We have investigated whether second messengers can modulate the depolarization-induced glycolytic response by applying agents such as staurosporine (20 nmol/L), KN-62 (2 Jmol/L); okadaic acid (200 nmol/L), cyclosporin A (1 μmol/L), and FK-506 (1 μmol/L), which are known to affect the phosphorylation/dephosphorylation states of intracellular proteins. However, we found no significant effect on the depolarization-induced increase in glucose utilization (data not shown), which is consistent with the conclusion that it was elicited by the activation of Na+,K+-ATPase through increased intracellular Na+ concentrations. By contrast, the stimulation of glycolysis in astrocytes by the moderate (physiologic) elevation of extracellular K+ appears to occur through extracellular stimulation of Na+,K+-ATPase. This response might be mediated by the α2β2 isoform combination known to be ouabain sensitive and typical for astrocytes (see earlier). Indeed, the apparent K+ and Na+ affinities estimated for this isoform combination seem to be in good agreement with such a role (Blanco et al., 1995; Peng et al., 1998). Probably, a different isozyme would regulate astrocytic glycolysis in response to increased carrier-mediated Na+ influx (Bowman and Kimelberg, 1984; Stephens et al., 1993; Pellerin and Magistretti, 1994, 1996, 1997; Takahashi et al., 1995; Rose and Ransom, 1996; Sokoloff et al., 1996). Likely candidates are the highly ouabain-sensitive isozyme described recently by Pellerin and Magistretti (1997) and the ubiquitous a α1-containing sodium pump. In conclusion, the current findings support the view that during neuronal activity in the brain, glucose consumption increases in neurons and astrocytes through the activation of distinct isoforms of Na+,K+-ATPase and the subsequent increase in glucose utilization. It also appears that under maximal stimulation, glucose consumption was higher in neurons responding to membrane depolarization than in astrocytes responding to elevated extracellular potassium and to increased carrier-mediated transport activity. However, further work is needed to elucidate the extent to which these different Na+,K+-ATPase–mediated responses contribute to the function-related local increase in glucose metabolism observed in vivo.
Footnotes
Abbreviations used
Acknowledgment
The authors thank Ms. D. Tavel for excellent technical assistance.