
Abstract
Functional activation stimulates CMRglc more than CMRO2 and raises lactate levels in brain. This has been interpreted as evidence that brain work is supported mainly by energy derived from anaerobic glycolysis. To determine if lactate production accounts for the “excess” glucose consumption, cerebral arteriovenous differences were measured in conscious rats before, during, and 15 minutes after sensory stimulation; the brains were rapidly frozen in situ immediately after completion of blood sampling and assayed for metabolite levels. The molar O2/glucose uptake ratio fell from 6.1 ± 1.1 (mean ± SD) before stimulation to 5.0 ± 1.1 during activation (P < 0.01); lactate efflux from brain to blood was detectable at rest but not during stimulation. By 15 minutes after activation, O2 and lactate arteriovenous differences normalized, whereas that for glucose fell, causing the O2/glucose ratio to rise above preactivation levels to 7.7 ± 2.6 (P < 0.01). Brain glucose levels remained stable through all stages of activity. Brain lactate levels nearly doubled during stimulation but normalized within 15 minutes of recovery. Brain glycogen content fell during activation and declined further during recovery. These results indicate that brain glucose metabolism is not in a steady state during and shortly after activation. Furthermore, efflux from and increased content of lactate in the brain tissue accounted for less than 54% of the “excess” glucose used during stimulation, indicating that a shift to anaerobic glycolysis does not fully explain the disproportionately greater increases in CMRglc above that of CMRO2 in functionally activated brain. These results also suggest that the apparent dissociation between glucose utilization and O2 consumption during functional activation reflects only a temporal displacement; during activation, glycolysis increases more than oxidative metabolism, leading to accumulation of products in intermediary metabolic pools that are subsequently consumed and oxidized during recovery.
Keywords
For several decades, it has been believed that functional activity in brain is normally supported by energy derived from obligatory oxidative metabolism of glucose. This belief was based on numerous studies in which cerebral arteriovenous differences and rates of consumption or production of O2, glucose, CO2, lactate, and other potential substrates and products of cerebral energy metabolism were measured in humans under steady-state conditions. The results in subjects with a variety of physiologic conditions, but with brains that were presumably functionally active because they were conscious, disclosed no potential substrates of cerebral energy metabolism other than glucose and O2 that were normally taken up from the blood in more than trivial amounts (Kety, 1957; Sokoloff, 1960; Clarke and Sokoloff, 1994). Furthermore, glucose and O2 were found to be consumed in almost stoichiometric amounts for complete oxidation of glucose to H2O and CO2. In fact, glucose utilization normally exceeded the rate accounted for by the O2 consumption or CO2 production by about 20% (i.e., 5.5 moles of O2 consumed per mole of glucose compared with 6.0 for exact stoichiometry). The fate of the excess carbon is unknown, but it has been assumed to be distributed among the many intermediate pools between glucose and its final end products (Kety, 1957; Lassen, 1959; Sokoloff, 1960; Siesjö, 1978; Clarke and Sokoloff, 1994). When the brain's supply of either O2 or glucose becomes limiting, this ratio is altered, but cerebral functions then are also disturbed. It was, therefore, reasonably concluded that the oxidative metabolism of glucose provides the energy needed to support normal functional activities in the brain. Ketotic states are an exception; when ketone body levels in blood are elevated, they can substitute in part for glucose as substrates for oxidative metabolism without major alteration in cerebral functions (Owen et al. 1967).
The belief that CMRO2 and CMRglc remain obligatorily coupled during different conditions of functional activity has been challenged. Somatosensory stimulation has been reported to increase CBF but not CMRO2 in the sensorimotor cortex (Fox and Raichle, 1986), and visual stimulation raised CBF and CMRglc with little change in CMRO2, resulting in a fall in the ratio of O2 consumption to glucose utilization (O2/glucose ratio) in the visual cortex (Fox et al., 1988). Fox et al. (1988) therefore proposed that normal functional activation in brain is supported by energy derived from anaerobic rather than oxidative metabolism of glucose, even when the O2 supply is adequate and despite the fact that oxidative glucose metabolism is 15 to 20 times more efficient than glycolysis in the production of ATP. The brain does have the capacity to increase CMRO2 in abnormal conditions with markedly increased neural activity, for example, in experimentally induced seizures (Katsura et al., 1994). Seizures induce twofold to fivefold increases in both CMRO2 and CMRglc within minutes, and these can be sustained for at least 2 hours in experimental animals; the O2/glucose ratio falls at seizure onset but rises with time (reviewed by Siesjö, 1978).
This provocative hypothesis of Fox et al. (1988) has gained support from a variety of sources. Also using positron emission tomography procedures, Ribeiro et al. (1993) observed in normal humans disproportionately greater increases in CMRglc than in CMRO2 during visual stimulation, and Madsen and associates (1995), using the Kety-Schmidt technique (Kety and Schmidt, 1948), which relies on arteriovenous differences, found a small but significant decrease in the O2/glucose ratio during cerebral activation by psychological testing that persisted for some time after the test was terminated. Further support came from demonstrations in animals and humans by means of microdialysis, direct chemical measurements, and magnetic resonance spectroscopy that in many conditions, including functional activation, the level of lactate in brain tissue rises, its efflux into cerebral venous blood is increased, or both (Kuhr and Korf, 1988; Schasfoort et al., 1988; Prichard et al., 1991; Sappey-Marinier et al., 1992, Madsen et al., 1992, 1995; Fellows et al., 1993; Adachi et al., 1995). These are changes to be expected if glycolysis were increased without a commensurate rise in oxidative metabolism to match the increased rate of lactate production. Finally, the finding by magnetic resonance imaging that the content of deoxyhemoglobin is decreased in functionally activated brain tissue has been interpreted as evidence that blood flow is increased without any comparable rise in O2 utilization (Belliveau et al., 1991; Ogawa et al., 1992).
If the rate of glycolysis exceeds the rate of oxidation of its products to CO2, then there must be some alternative disposition of the excess carbon derived from glucose. It is not accounted for by the removal of lactate through the cerebral circulation. The rate of efflux of lactate from the human brain during functional activation is low and accounts for a small fraction of the glucose taken up in excess of O2 (Madsen et al., 1992, 1995). The excess carbon must be sequestered within the brain in metabolic pools derived from glucose (e.g., lactate, glycogen) or unmetabolized glucose itself. In the current studies we identify the fate of the excess carbon. Cerebral uptake or loss of glucose, O2, and lactate were determined by measurement of cerebral arteriovenous differences and compared with levels of tissue metabolites measured before, during, and after sensory stimulation. The results do not support the explanation that the mismatch between glucose and O2 uptake into working brain is fully explained by conversion of glucose to lactate or glycogen.
MATERIALS AND METHODS
Animals and surgical preparation
Normal adult male Sprague Dawley rats (Zivic-Miller Laboratories, Pittsburgh, PA, U.S.A.), weighing 400 to 600 g, were maintained on an alternate 12-hour light-dark cycle with controlled humidity and provided with water and food ad libitum. All procedures performed on animals were in strict accordance with the National Institutes of Health Guide for Care and Use of Laboratory Animals and were approved by the local Animal Care and Use Committee.
On the day of the experiment, nonfasted rats were anesthetized with halothane (5% for induction and 1.5% for maintenance) in 70% N2O/30% O2, and polyethylene catheters (18 cm, PE 50, Clay-Adams, Parsippany, NJ, U.S.A.) filled with physiologic saline containing sodium heparin (100 U/mL) were inserted into a femoral artery and femoral vein. The surgical wounds then were closed. The scalp was retracted, and a hollow screw was screwed into the skull immediately posterior to the lambdoid suture. The dura was carefully punctured, and a tightly fitting cannula was inserted through the shaft of the screw and carefully advanced until it penetrated the dura and entered the torcular Herophili. A polyethylene catheter was connected to the cannula and filled with heparinized saline. This catheter was used for sampling mixed cerebral venous blood from the confluence of the sinuses. Lidocaine ointment (5%) then was applied to all surgical wounds. A loose-fitting plaster cast was applied to the lower torso and taped to the animal board for restraint. The surgical preparation was achieved within 27 to 63 (mean, 43) minutes, and 2.5 to 5.5 (mean, 3.6) hours were allowed for recovery from the anesthesia and surgery before initiation of the experimental procedure. During the recovery period, the rat was kept in a shelter constructed of lead bricks with a cardboard top; the shelter had apertures to allow the passage of catheters for blood sampling. Although the rat was not completely isolated from the laboratory environment, efforts were made to minimize external disturbances while it was in the shelter. Rectal temperature was monitored with a thermistor (Yellow Springs Instrument Co., Yellow Springs, OH, U.S.A.) and maintained at 37°C by a thermostatically controlled heating lamp. Physiologic variables were assessed 20 minutes before initiation of the experimental procedure. Arterial blood glucose and lactate levels were measured with a YSI 2700 Select Dual Channel Biochemistry Analyzer (Yellow Springs Instrument Co.); arterial blood PaO2, PaCO2, and pH were determined with a Model 170 pH/blood-gas analyzer (Corning Medical Scientific, Medfield, MA, U.S.A.); mean arterial blood pressure was measured with an air-damped mercury manometer; and arterial blood hematocrit was determined after centrifugation.
Determination of arteriovenous differences
Cerebral arteriovenous differences for oxygen [(A-V)O2], glucose [(A-V)glc], and lactate [(A-V)lac] were determined in timed blood samples drawn simultaneously from the femoral arterial and cerebral venous catheters. The dead space volume of both catheters was 0.06 mL and was flushed out immediately before each blood sample by the withdrawal of 0.20 mL of blood through each catheter. The paired arterial and venous blood samples (0.25 to 0.30 mL) were withdrawn at rates less than 0.35 mL/min into gas-tight, ice-cold 1-mL tuberculin syringes (Popper & Sons, Inc., New Hyde Park, NY, U.S.A.) containing heparin and NaF. Immediately after sampling, blood for determination of blood glucose and lactate concentrations were transferred to tubes containing dried fluoride-ethylenediamine tetra-acetic acid and stored on ice for no more than 15 minutes before their glucose and lactate contents were assayed in quadruplicate in the YSI Biochemistry Analyzer. The remaining blood in the syringe was stored on ice until analyzed in triplicate within 10 minutes of its collection for percent O2 saturation, hemoglobin concentration, and O2 content in an OSM3 Hemoximeter (Radiometer, Copenhagen, Denmark) set in the animal mode for analysis of rat blood and an O2-binding coefficient for hemoglobin equal to 1.39 mL O2/g hemoglobin.
Sampling and chemical analysis of brain tissue
Immediately after withdrawal of the last blood sample, the rats were anesthetized by an intravenous injection of sodium thiopental (15 to 25 mg/kg), and in situ funnel-freezing of the brain was initiated within 1 minute (Pontén et al., 1973). To minimize cerebral hypoxia during the freezing procedure, 100% O2 was administered through a nose cone. With this procedure, the circulation is interrupted in dorsal, lateral, and ventral regions of the cerebral cortex at about 10, 40, and 90 seconds, respectively, and dorsal and lateral cortex is frozen within 20 to 40 seconds; labile intermediary metabolites and energy charge are preserved in all regions of the funnel-frozen cerebral cortex, indicating adequate delivery of O2 to the tissue during the freezing (Pontén et al., 1973; Siesjö, 1978). When fully frozen, the head was removed, immersed in liquid N2, and stored at −80°C until processed as follows. The heads were warmed to 25°C in a cryostat, the external tissue and skull were removed, and the superficial vessels and membranes were carefully dissected from the surface of the cerebral cortex. The entire dorsal cerebral cortex was dissected out of the frozen brain and powdered under liquid N2. Portions of the frozen powders were weighed while still at about −25°C. Paired samples of the frozen powders of each sample were homogenized in ice-cold 0.03 mol/L HCl at about −12°C, heated at 100°C for 45 minutes, incubated in parallel in the presence and absence of α-1,4-α-1,6-amyloglucosidase, and then centrifuged (Ghajar et al., 1982). Glucose and lactate contents in the supernatant fraction of each tissue sample were determined in the YSI Biochemistry Analyzer. Glycogen levels were calculated as the amount of glucosyl units released by the incubation with amyloglucosidase (i.e., difference in glucose levels between paired samples incubated with and without amyloglucosidase).
Functional activation
Generalized stimulation of sensory and motor pathways (e.g., sensory, motor, whisker-to-barrel cortex pathway) was used to achieve as widespread functional activation of the cerebral cortex and other structures as possible. At the beginning of the stimulation period, the shelter was removed, and the face, whiskers, and body, including forepaws, back, and tail, were stimulated by bilateral gentle stroking with small paint brushes. The stimulation was continued for 6 minutes, and then the animals were returned to the shelter and allowed to recover from the effects of the stimulation.
Tissue metabolites were measured in rat brains obtained before, during, and after functional activation. Immediately before the brain was frozen in situ by funnel-freezing, a pair of arterial and cerebral venous blood samples were drawn for determination of (A-V)O2, (A-V)glc, and (A-V)lac, and the rats then were anesthetized and their brains frozen. In preliminary experiments, serial pairs of arterial and cerebral venous blood samples were drawn at timed intervals (ranging from 2 to 10 minutes) from rats that were stimulated for 6 minutes and replaced in their shelters for up to 60 minutes; to minimize blood loss, the blood removed to flush the dead-space in the catheters before the withdrawal of each blood sample was replaced. Before and after sensory stimulation, blood samples were obtained from the catheters through apertures in the isolation shelter while the rat remained in the shelter.
Statistical analysis
Because some data were not normally distributed and variances for the different treatment groups were not always equivalent, nonparametric tests were used to identify statistically significant differences. The Kruskal-Wallis analysis of variance for ranked data was used to identify differences among the three treatment groups, and pair-wise comparisons were made with the Wilcoxon rank sum test or Dunn's test for multiple comparisons against the control group.
RESULTS
Physiologic variables
Arterial O2, glucose, lactate, and hemoglobin concentrations and PaCO2 all were within the normal range before sensory stimulation in all experimental groups (Table 1). During sensory stimulation, blood glucose and lactate levels increased, and arterial PaCO2 fell in these nonfasted rats; this may have resulted from stress, hyperventilation, and increased motor and sympathetic activity that mobilized glucose from muscle and liver glycogen stores (Table 1). Arterial blood O2 contents remained stable (Table 1). Most of these changes tended to return to normal during the 15 minutes after the functional activation (Table 1).
Physiologic variables and arteriovenous differences just before in situ freezing
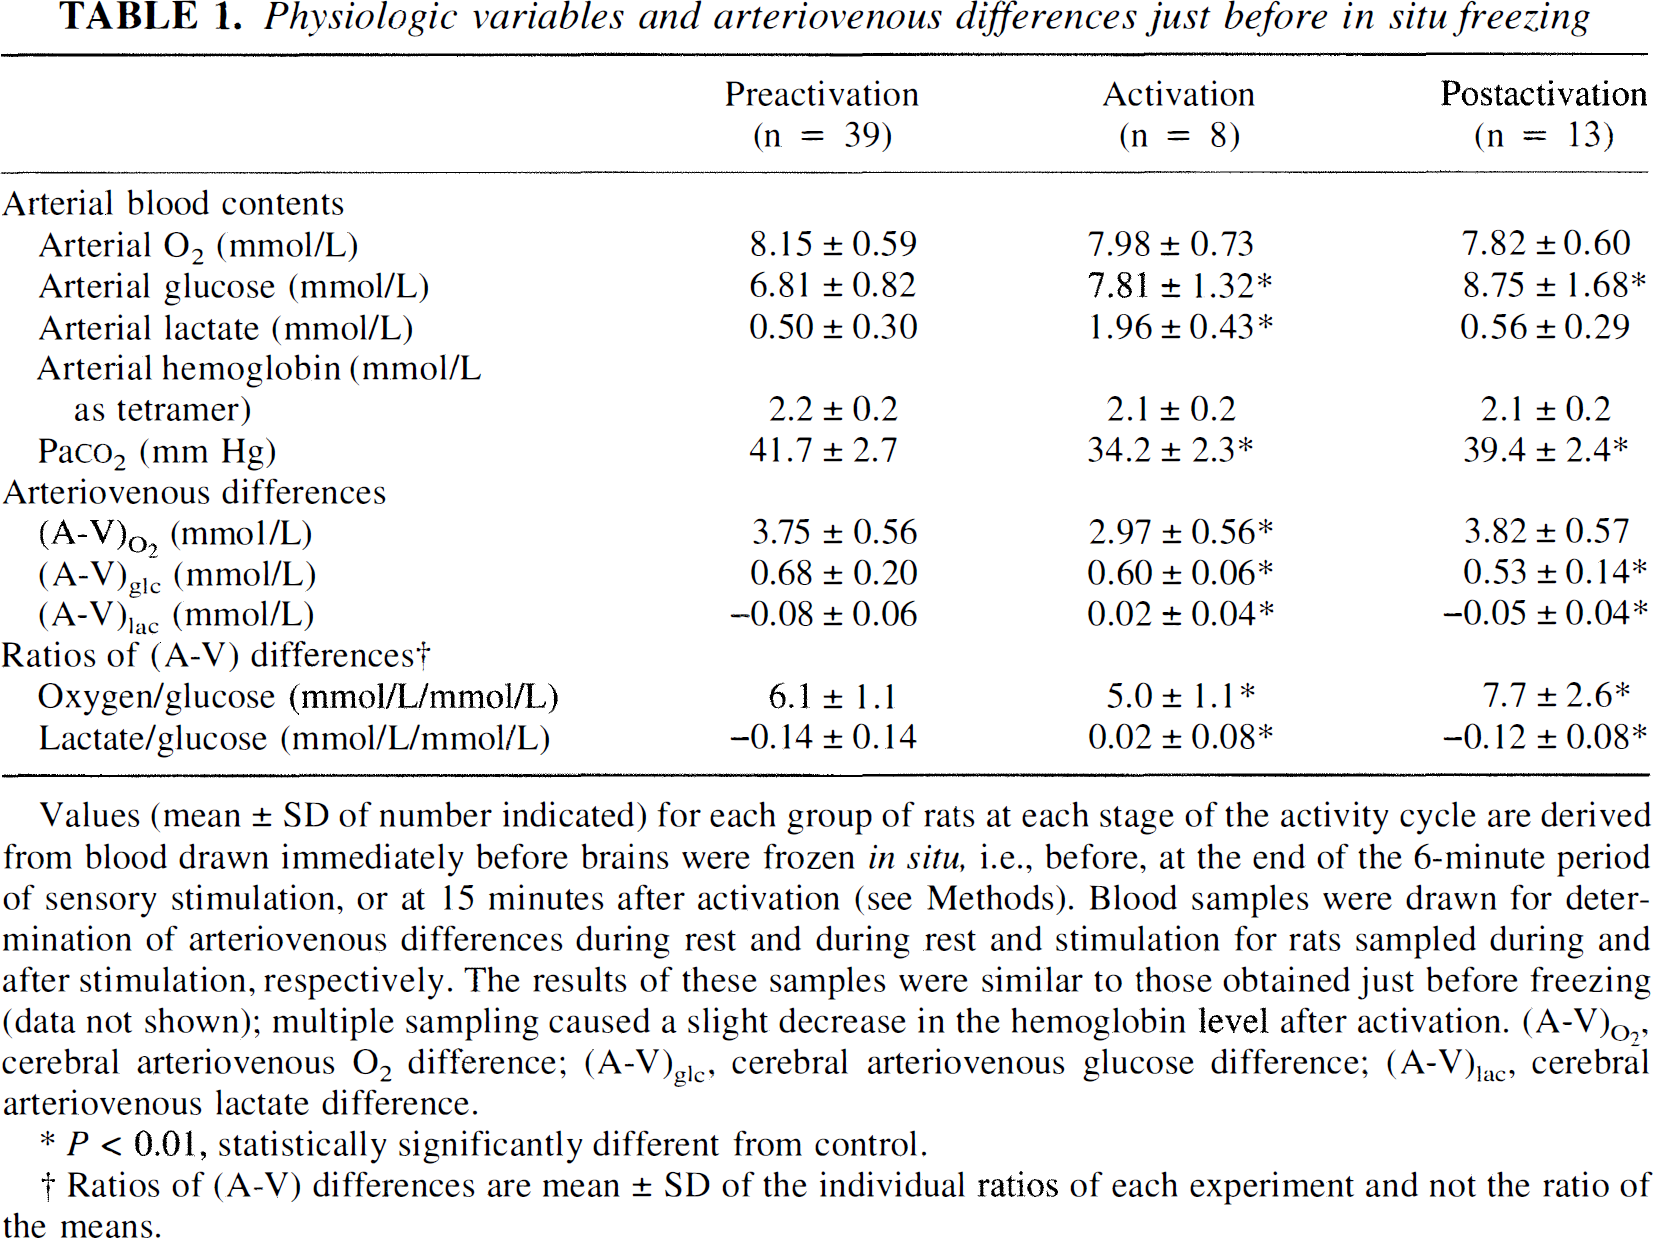
Values (mean ± SD of number indicated) for each group of rats at each stage of the activity cycle are derived from blood drawn immediately before brains were frozen in situ, i.e., before, at the end of the 6-minute period of sensory stimulation, or at 15 minutes after activation (see Methods). Blood samples were drawn for deter-mination of arterivenous differences during rest and during rest and stimulation for rats sampled during and after stimulation, respectively. The results of these samples were similar to those obtained just before freezing (data not shown); multiple sampling caused a slight decrease in the hemoglobin level after activation. (A—V)O2, cerebral arteriovenous O2 difference; (A—V)gle cerebral arteriovenous glucose difference; (A—V)lac cerebral arterivenous lactate difference.
P < 0.01, statistically significantly different from control.
Ratios of (A—V) differences are mean ± SD of the individual ratios of each experiment and not the ratio of the means.
Cerebral arteriovenous differences
Preliminary experiments were performed in separate groups of rats to evaluate spontaneous changes in arteriovenous differences for O2, glucose, and lactate over a period of time. In rats kept in the shelter, there were no significant time-dependent changes in the arteriovenous differences despite repeated blood sampling, provided extreme care was taken to isolate the rats from the environment. If isolation was not complete, the ratio of (A-V)O2 to (A-V)glc (O2/glucose ratio) sometimes exceeded 6.0 in the first pair of samples but then declined to about 5.0 in subsequent samples (data not shown). Within 2 minutes after onset of sensory stimulation, the O2/glucose ratio decreased and remained low for as long as 15 to 20 minutes after termination of the stimulation and return of the rat to its shelter. The time required for normalization of the O2/glucose ratio varied; sometimes there was an overshoot above the normal resting value of 5.0 to 6.0 (Sokoloff, 1960; Siesjö, 1978) (data not shown).
Before sensory stimulation, the O2/glucose ratio was 6.1 ± 1.1 (mean ± SD), which is almost equal to the theoretical stoichiometry of 6.0 for complete oxidation of glucose to CO2 and H2O, and efflux of lactate was slight though statistically significant (Table 1). During the last minute of the 6-minute period of stimulation, the (A-V)O2 fell 21% whereas the (A-V)glc fell only 12%, resulting in a significant decrease in the O2/glucose ratio to 5.0 ± 1.1 (Table 1). By 15 minutes after stimulation had ceased, the (A-V)O2 had returned to normal, whereas the (A-V)glc still remained low; the O2/glucose ratio, therefore, rose to 7.7 ± 2.6, well above the ratio of 6.0 for complete stoichiometry between O2 and glucose consumption (Table 1). During activation the (A-V)lac was not significantly different from zero, but by 15 minutes after activation, a slight efflux of lactate from brain again became detectable; the loss of lactate from brain accounted for about 6% of the glucose uptake into the brain before and after activation (Table 1).
Metabolite concentrations in brain tissue
To correlate changes in arteriovenous differences with levels of metabolites in brain, brain samples were obtained by in situ freezing immediately after each activity cycle (i.e., before sensory stimulation [n = 39]), at the end of the 6-minute stimulation period (n = 8), and 15 minutes after returning to the shelter for recovery from the sensory stimulation (n = 13). Brain glucose levels were slightly higher during and after activation than in the preactivation resting state, probably because of increased blood glucose levels (Tables 1 and 2). The brain lactate concentration nearly doubled at the end of the activation period but normalized within 15 minutes after cessation of activation (Table 2). Brain glycogen content was 11% and 21% below the preactivation level at the end of stimulation and after 15 minutes of recovery, respectively. During stimulation, loss of glucosyl units from glycogen was equivalent to 1.4 mmol of lactate per gram of tissue (i.e., greater than the increase in brain lactate content). The total carbon content in these three pools (e.g., glucose, lactate, and glycogen) was similar before and during activation but reduced about 9% in the postactivation period because of loss of glycogen (Table 2).
Metabolite levels in cerebral cortex before, during, and after sensory stimulation
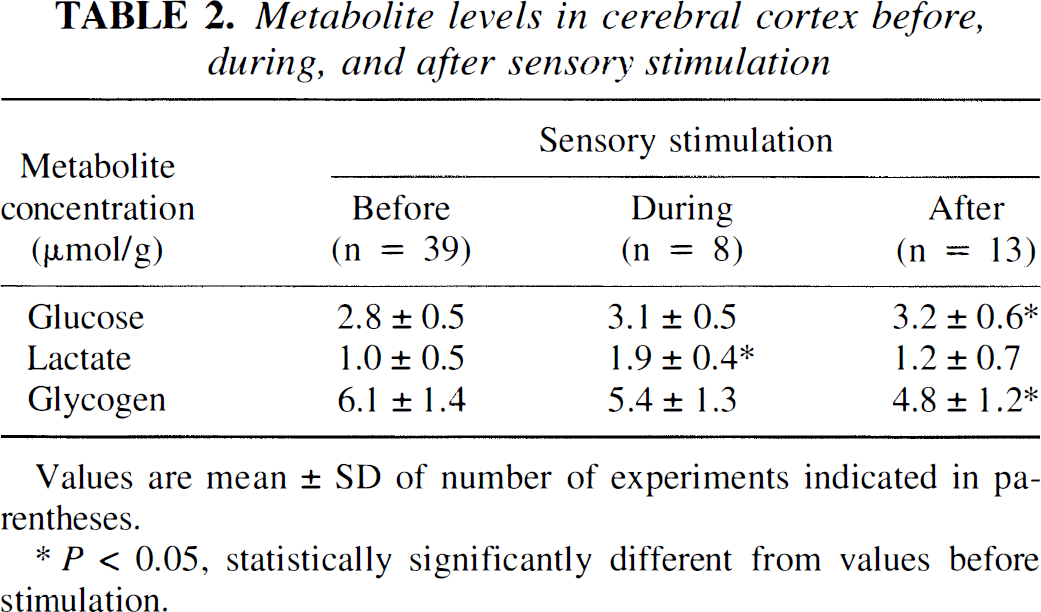
Values are mean ± SD of number of experiments indicated in parentheses.
P < 0.05, statistically significantly different from values before stimulation.
DISCUSSION
Numerous studies over many years have shown that glucose and O2 normally are consumed in human brains in close but not exact stoichiometric amounts for the complete oxidation of glucose to CO2 and H2O (Kety, 1957; Sokoloff, 1960). Glucose utilization was found to exceed the O2 consumption required for its complete oxidation by about 20%, but the fate of the excess glucose was never established (Kety, 1957; Sokoloff, 1960, Clarke and Sokoloff, 1994). These findings were based mainly on measurements of cerebral arteriovenous O2 and glucose differences in subjects in a steady state in a variety of conditions. Recent studies, however, indicate that cerebral glucose utilization in humans might be enhanced more than oxidative metabolism in regions of the brain that are functionally activated by sensory stimulation (Fox and Raichle, 1986; Fox et al., 1988; Madsen et al., 1995). These observations have led to a hypothesis that functional activity in brain is supported mainly, if not entirely, by energy derived from glycolytic rather than oxidative metabolism of glucose (Fox and Raichle, 1986; Fox et al., 1988). If not oxidized to CO2, the carbon in the excess glucose uptake must be disposed of in some other way because it cannot accumulate indefinitely. The current study was, therefore, undertaken to examine the effects of functional activation in an animal model in which it would be possible to carry out chemical analyses (e.g., glucose, lactate, and glycogen concentrations in brain and in arterial and cerebral venous blood) needed to account for the disposition of this excess carbon.
The results of the current study confirm that in the rat, as in humans, functional activation is associated with disproportionately greater increases in glucose utilization than O2 consumption. Before sensory stimulation, glucose uptake into brain was closely matched. In fact, contrary to the results in humans, the O2/glucose ratio of 6.1 (SD = ±1.1) was not statistically significantly different from the value 6.0 for complete oxidation of the glucose to CO2 and H20 (Table 1). There also was a slight efflux of lactate from the brain (Table 1), which is occasionally but not consistently seen in normal human subjects (Kety 1957; Cohen et al., 1964; Siesjö, 1978; Clarke and Sokoloff, 1994; Madsen et al., 1995). Functional activation statistically significantly lowered the O2/glucose ratio to 5.0 ± 1.1 (Table 1), which is in agreement with reported findings in human subjects (Fox and Raichle, 1988; Ribeiro et al., 1993; Madsen et al., 1995). The O2 and glucose arteriovenous differences both were reduced during sensory stimulation (Table 1), probably because of increases in CBF that were subsequently found to occur in rats with similar generalized sensory stimulation (Madsen et al., 1998). By 15 minutes after termination of the sensory stimulation, however, the O2/glucose ratio rose to 7.7 ± 2.6, a value even higher than normal, indicating about 28% more O2 uptake than the amount accounted for by the glucose uptake (Table 1).
Cerebral glucose utilization, O2 consumption, and lactate production can be calculated as the products of CBF and their respective arteriovenous differences during a steady state. Cerebral blood flow was not measured in the current study, but Madsen et al. (1998), in another study in rats with an identical experimental paradigm, found global CBF to rise from 1.1 in the resting brain to 1.8 mL·g−1·min−1 after 6 minutes of sensory stimulation, the same time at which the arteriovenous differences were determined in the current study. If these values for CBF are combined with the current data, then the mean rates of CMRglc and CMRO2 were increased from 0.75 and 4.13 in the resting state to 1.08 and 5.35 μmol·g−1·min−1 during functional activation, increases of 44% and 30%, respectively. When the rate of glucose uptake is corrected for the 0.3 μmol per gram increase in brain glucose content during the 6-minute period of stimulation (Table 2), the rate of cerebral glucose utilization during the activation is reduced to 1.03 μmol·g−1·min−1, still 37% above the rate in the resting state. These results differ from those of the studies in man (Fox and Raichle, 1986; Fox et al., 1988) in which CMRglc was increased with little or no change in CMRO2 during functional activation; in contrast, in the current study both were substantially increased.
Although net exchanges of lactate between brain and blood were small before and during activation (Table 1), there was during the activation a small but statistically significant switch from slight loss to slight uptake, probably because of an almost fourfold increase in arterial lactate levels from systemic lactate production. Each glucose molecule consumed produces two molecules of pyruvate, which rapidly equilibrates with lactate. Because the equilibrium constant of lactic dehydrogenase favors the direction toward lactate formation, the pool of lactate is much larger than that of pyruvate. The total rate of lactate/pyruvate production from glucose, therefore, equals twice the rate of glucose utilization. In the current study, the rate of production of lactate or pyruvate should have increased from 1.5 in the resting state to 2.1 μmol·g−1·min−1 in the activated state. Even if all of the O2 consumed was used only for oxidation of glucose or its products, the rate of O2 consumption during functional activation could account for a rate of glucose utilization of only 0.89 μmol·g−1·min−1, leaving an excess rate of glucose metabolism of 0.14 μmol·g−1·min−1, the reason for the observed low O2/glucose ratio of 5.0. This excess glucose utilization is equivalent to a combined rate of lactate and pyruvate formation of 0.28 μmol·g−1·min−1. If the excess glucose utilization reflected only anaerobic glycolysis, and if the efflux of lactate and pyruvate through the circulation was negligible, as indicated by the measured arteriovenous difference for lactate (Table 1), their combined concentration, mainly lactate, in the brain tissue should have risen during the 6-minute period of sensory stimulation by about 1.68 μmol/g. The measured increase in brain lactate concentration was, however, 0.9 μmol/g (Table 2), which accounts for only 54% of the total excess glucose consumption.
These calculations are based on arteriovenous differences measured at the end of 6 minutes of sensory stimulation and the assumption that these differences essentially were constant throughout the period of activation. This assumption is supported by data from preliminary experiments (data not shown), which showed that the O2/glucose and lactate/glucose ratios during the first 2-to 3-minute interval after onset of stimulation were similar to those determined at the end of the 6-minute period. Also, in the later study, Madsen et al. (1998) found the value at 6 minutes to be close to the mean of three arteriovenous samples taken during the 6-minute activation period.
Glycogen represents another possible pool to which glucose utilization contributes, but the results indicate that net synthesis of glycogen did not account for any of the extra glucose utilization not accounted for by the O2 consumption. In fact, its concentration in brain was found to decrease rather than to increase during sensory stimulation. The fall in brain glycogen content observed during stimulation was 0.7 μmol/g (in glucose equivalents) (Table 2), which would have contributed to the glycolytic flux and added as much as 1.4 μmol of mainly lactate and some pyruvate per gram of tissue to the 1.68 derived from the excess glucose utilization. Of this total of 3.08 μmol/g, the lactate concentration recovered in the brain tissue at the end of the period of stimulation accounted for only about 26%. The changes in lactate level thus accounted for an even smaller fraction of the total to be expected from the observed glycogen utilization and the increase in glucose uptake in excess of O2 uptake induced by functional activation. Glycogen is localized mainly in glial cells, and glycogen is thought to be degraded to lactate and exported for oxidation by activated neurons (Quach et al., 1978; Sorg and Magistretti, 1991; Swanson et al., 1992; Magistretti et al., 1993; Dringen et al., 1993; Sorg et al. 1995). Even so, this sequence still would require O2 consumption and would not alter the overall balance between steady-state rates of extraction of O2 and glucose from the blood. It might, however, contribute to temporary disruptions in the stoichiometry of their consumption.
Fifteen minutes after termination of sensory stimulation, the cerebral O2/glucose ratio rose to 7.7 mmol/mmol, a value considerably above the 6.0 level for completely equivalent rates of O2 and glucose consumption (Table 1), suggesting that there was oxidation of metabolites other than glucose. Inasmuch as lactate and glycogen levels in the brain fell during the 15-minute recovery period, it is likely that they were providing substrates for the excess O2 consumption. We have not defined the timing and magnitude of the changes in the relative rates of O2 and glucose uptakes during recovery from sensory stimulation, but results of preliminary experiments indicate that there may be variation in the time required for normalization of the O2/glucose ratio and the degree of overshoot of O2 consumption above equivalent glucose utilization.
The current studies have not defined the disposition of all of the surplus carbon taken up when glucose uptake exceeds the amount accounted for by O2 consumption during functional activation of cerebral metabolism. Lactate certainly can be a major reservoir of carbon derived from glucose metabolism in activated tissue (Adachi et al., 1995; Cruz et al., 1998), but the amounts of lactate lost to the blood and recovered in the activated tissue did not account for all of the excess glucose consumed. Some of the lactate may have diffused away from the activated tissue to other parts of the brain (Adachi et al., 1995; Cruz et al., 1998), which also would contribute to a lowering of the O2/glucose ratio. There are also many other pools in the pathways of glucose metabolism, and glucose carbon must traverse a series of intermediate pools before reaching those that are the direct substrates of oxidative metabolism. The size of these intermediate pools can change when glucose utilization is altered; they may rise during functional activation and return to normal during recovery. Carbon from glucose may be retained in these pools for considerable periods of time before fully cleared by oxidation. For example, Sacks (1957) administered intravenous pulses of 14C-labeled glucose to human subjects and found that “after 90 minutes only about 40% of the 14C taken up by the brain came out in the form of 14CO2” in the cerebral venous blood. There also is spatial separation of the pools within the brain tissue, which may contribute to the delay. Results of experiments mainly with cell cultures in vitro suggest that much of the glucose is metabolized first in astroglia to lactate, which then is exported to neurons for oxidation (Dringen et al., 1993; Magistretti and Pellerin, 1996; Tsacopoulos and Magistretti, 1996). Such compartmentalization of metabolic activities could lead to temporal dissociations between O2 consumption and glucose utilization. Enlargement, depletion, and restoration of these intermediary metabolic pools and of glycogen may lead, therefore, to relatively long periods of apparent dissociation between the uptakes of glucose and O2 by the brain and the deviation of the O2/glucose ratios from its normal stoichiometry. In effect, intermediate metabolic pools derived from glucose may be rapidly enlarged during functional activation and then slowly diminished to resting level by oxidative metabolism over an extended period of time during recovery. The dissociation may, therefore, be more temporal than material. Evidence that “an initial momentary glycolytic response to excitation is largely replaced by a subsequent sustained increase in respiration” also has been obtained in brain tissue slices stimulated electrically in vitro (McIlwain and Tresize, 1956). Some of the products of glycolysis also must be oxidized during the period of activation; studies with optical imaging (Malonek and Grinvald, 1996; Malonek et al., 1997) and nuclear magnetic resonance spectroscopy (Hyder et al., 1997) have provided evidence that O2 utilization does indeed increase during functional activation.
Notice that assessment of local metabolic balances during local functional activation from measurements of blood flow, arteriovenous differences, and tissue metabolite levels really requires that the venous drainage and the tissue samples be representative of the same activated region of the brain. Unfortunately, local venous drainage systems are not readily cannulated in brain, and “global” approaches that require sampling of venous blood contaminated with blood from other nonactivated tissues must be used. The concentrations of the constituents in such contaminated blood are the flow-weighted means of the concentrations in all of the contributing inflows. The cerebral cortex represents a relatively large and highly perfused fraction of the brain that contributes substantially to the venous flow into the torcular, and it can readily be rapidly frozen in situ. We, therefore, used generalized sensory stimulation (i.e., bilateral brushing of the whiskers, head, back, sides, paws, and tail) that would activate much of the entire cerebral cortex (e.g., parietal from input from cutaneous mechanoreceptors; somatosensory and sensorimotor from vibrissal stimulation; and occipital from observation of the brush movements). Local CBF (Takahashi et al., 1995) and CMRglc (Dienel et al., 1992) in the cerebral cortex generally are 25% to 100% higher than the weighted average of whole brain in resting rat brain. Global activation of the cerebral cortex should increase its relative outflow into the venous sampling site (i.e., the torcular), which drains the dorsal cerebral cortex of both hemispheres, as well as several deeper structures (Scremin, 1995). Attempts to sample from the superior sagittal sinus, which would have been more representative of only the cortex, were not consistently successful. To obtain close, although not exact, correspondence between blood and tissue sampling, the metabolites were assayed in samples of frozen dorsal cerebral cortex that had been mixed by powdering, thus providing average values weighted in proportion to the size, flow, and metabolism of its component structures.