
Abstract
Decreased arterial partial oxygen pressure (PaO2) below a certain level presents a strong stimulus for increasing cerebral blood flow. Although several field studies examined the time course of global cerebral blood flow (gCBF) changes during hypoxia at high altitude, little was known about the regional differences in the flow pattern. Positron emission tomography (PET) with [15O]H2O was used on eight healthy volunteers to assess regional cerebral blood flow (rCBF) during short-term exposure to hypoxia corresponding to simulated altitudes of 3,000 and 4,500 m. Scans at the simulated altitudes were preceded and followed by baseline scans at the altitude of Zurich (450 m, baseline-1 and baseline-2). Each altitude stage lasted 20 minutes. From baseline to 4,500 m, gCBF increased from 34.4 ± 5.9 to 41.6 ± 9.0 mL · minute−1 · 100 g−1 (mean ± SD), whereas no significant change was noted at 3,000 m. During baseline-2 the flow values returned to those of baseline-1. Statistical parametric mapping identified the hypothalamus as the only region with excessively increased blood flow at 4,500 m (+32.8% ± 21.9% relative to baseline-1). The corresponding value for the thalamus, the structure with the second largest increase, was 19.2% ± 16.3%. Compared with the rest of the brain, an excessive increase of blood flow during acute exposure to hypoxia is found in the hypothalamus. The functional implications are at present unclear. Further studies of this finding should elucidate its meaning and especially focus on a potential association with the symptoms of acute mountain sickness.
High-altitude physiology is of growing interest considering the increasing number of people engaging in high-altitude sports activities. One of the noninvasive accessible parameters concerning the CNS is global cerebral blood flow (gCBF). Doppler sonography of the large arteries feeding the brain allows its investigation in actual field experiments because the required instruments can easily be transported and handled. Several studies with this method documented increased gCBF at high altitudes (Reeves et al., 1985; Ellingsen et al., 1987; Huang et al., 1987; Otis et al., 1989; Jensen et al., 1990, 1996; Baumgartner et al., 1994). These and other studies demonstrated that decreased arterial partial oxygen pressure (PaO2) is a strong stimulus for increased cerebral blood flow to defend the brain against the reduced oxygen supply. In a laboratory study in rabbits, Todd et al. (1994) lowered the arterial oxygen content either by hemodilution or by reduction of the oxygen pressure in the inhaled gas mixture. They found that the two procedures exerted different effects on CBF and suggested that the oxygen tension in the tissues or somewhere in the vascular bed was a major determinant of regional CBF (rCBF). A burning issue in high-altitude physiology is acute mountain sickness (AMS). Its severest form may lead to cerebral edema, a life-threatening condition. The underlying pathophysiologic mechanisms are poorly understood. Correlations between the increase of gCBF at high altitude and the occurrence of symptoms of AMS are inconclusive. Some studies found no such correlation (Reeves et al., 1985; Jensen et al., 1990), whereas another reported higher increases in gCBF in symptomatic subjects (Baumgartner et al., 1994). Although the field studies mentioned above yielded valuable information about global blood flow, they did not allow any conclusions regarding potential regional differences in the flow pattern. Thus, it was the aim of the present study to evaluate rCBF during acute exposure to simulated altitudes. The study was performed with positron emission tomography (PET) and radioactively labeled water, currently the most accurate method to noninvasively measure CBF.
METHODS
Study population
Eight healthy and nonacclimatized volunteers (mean age 28 ± 5 years, range 24 to 38 years; 3 women, 5 men) were studied. None of the subjects had a history of cardiorespiratory and neurologic disorders. The study was approved by the local ethical committee, and written consent was obtained from each volunteer.
Altitude simulation
Each study consisted of four consecutive stages corresponding to different simulated altitudes and lasting 20 minutes each. During the first and fourth stage the gas mixture corresponded to the altitude of Zurich (450 m). In the second and third period altitudes of 3,000 and 4,500 m were simulated. This was achieved by inhalation of a hypoxic gas mixture. During all stages the gas mixture for breathing was humidified and supplied through a mouthpiece with the nasal airways occluded. Heart rate and peripheral arterial oxygen saturation (SaO2) were continuously recorded with a finger pulse oximeter (Nellcor N-200E, Nellcor Inc., Hayward, CA, U.S.A.) and stored at 1-minute intervals. Arterial blood pressure was measured using the oscillometric Riva-Rocci method with an upper arm cuff (Bosotron 2, Bosch & Sohn, Jungingen, Germany) every 5 minutes. Arterial PaO2 and PaCO2 were determined immediately before each scan in a blood sample from the radial artery.
After achieving a cardiorespiratory steady state, cerebral perfusion measurements using [15O]H2O PET were performed 15 minutes after the beginning of each stage.
[/15O]H2O positron emission tomography
The PET studies were performed on a whole body scanner (ADVANCE, GE Medical Systems, Waukesha, WI, U.S.A.). This is a scanner with an axial field of view of 14.6 cm and a reconstructed in-plane resolution of 7 mm. After injection of 400 to 500 MBq [15O]H2O with an automatic injection device, a series of 15 scans of 10 seconds' duration were acquired in the three-dimensional (3D) mode. During the PET measurement the time course of the arterial radioactivity was assessed by continuous sampling of arterial blood drawn from the radial artery. There may be concern about the full quantitative capacity in 3D mode. Of special concern are scatter correction and uniformity. A validation study performed on the GE AD-VANCE scanner in 3D mode demonstrated that the measured uniformity and the implemented algorithm for scatter correction should be adequate for full quantitation in head studies (Lewellen et al., 1996). In another study a direct comparison of two-dimensional and 3D mode acquisition demonstrated only minor differences in the measured activity concentration (Turkington et al., 1996). As part of quality control, uniformity measurements in 3D mode as well as the calibration of scanner and blood sampler are performed twice a month at our laboratory.
Data analysis
Region of interest analysis. Transaxial images of the brain were reconstructed using filtered back-projection (128 × 128 matrix, 35 slices, 2.34 × 2.34 × 4.25 mm voxel size). Photon attenuation was corrected by means of a 10-minute transmission scan and the data were corrected for decay. Quantitative parametric maps representing cerebral blood flow were then calculated using the integration method described by Alpert et al. (1984). On these maps the blood flow in various brain areas was determined using anatomic regions of interest. In addition mean global blood flow (gCBF) was calculated by averaging all pixels with more than 30% of maximum blood flow.
Statistical parametric mapping. Regions with excessive alteration of perfusion during hypoxia were looked for by means of statistical parametric mapping. This method is ideally suited to screen the whole brain for significant changes. The analysis was performed on summation scans representing the accumulated counts for 60 seconds after the arrival of the bolus in the brain. Such scans are routinely used in neuroactivation studies to demonstrate regional blood flow changes during a specific activation paradigm. The summation scans were subsequently transformed into stereotaxic space (Talaraich and Tournoux, 1988) and normalized to a global mean blood flow of 50 mL·minute−1·100 g−1. This normalization procedure eliminates changes in gCBF. Remaining significant differences between altitudes were then considered “excessive.” The difference between the blood flow at 4,500 m and baseline-1 was then evaluated pixel by pixel, using t statistics subsequently transformed into normally distributed z statistics. The resulting map of z values had a threshold at z = 4.3, corresponding to P < 0.05, corrected for multiple comparisons as described by Friston et al. (1995). Transformation and statistical parametric mapping were performed using the software SPM95 (Friston et al., 1995, 1996).
Statistical analysis of the region of interest data
Statistical analysis was performed with SAS (SAS Institute, Cary, NC, U.S.A.). Blood flow differences in the investigated regions at baseline-1, 3,000 m, 4,500 m, and baseline-2 were assessed by a multivariate analysis of variance. The mean flow values of the region of interest (n = 10) were standardized for each volunteer (mean = 0, SD = 1) and served as dependent variables. Altitude (n = 4) served as an independent variable. Univariate contrasts were computed to analyze the differences between the altitudes for each region of interest. Differences in mean global perfusion were assessed applying an analysis of variance with standardized mean global blood flow as dependent and altitude (n = 4) as independent variables. Unless otherwise mentioned, results are presented as mean ± SD.
RESULTS
The results of the arterial blood gas analyses at each altitude are presented in Table 1. At 3,000 m arterial PaO2 was 39% lower than at baseline-1, at 4,500 m there was a 56% decrease. Only minor changes were observed in arterial PaCO2. At 4,500 m only three subjects displayed a decrease of 3 mm Hg or more. At baseline-2 all parameters had returned to the values of baseline-1.
Blood gases and oxygen saturation at the different simulated altitudes
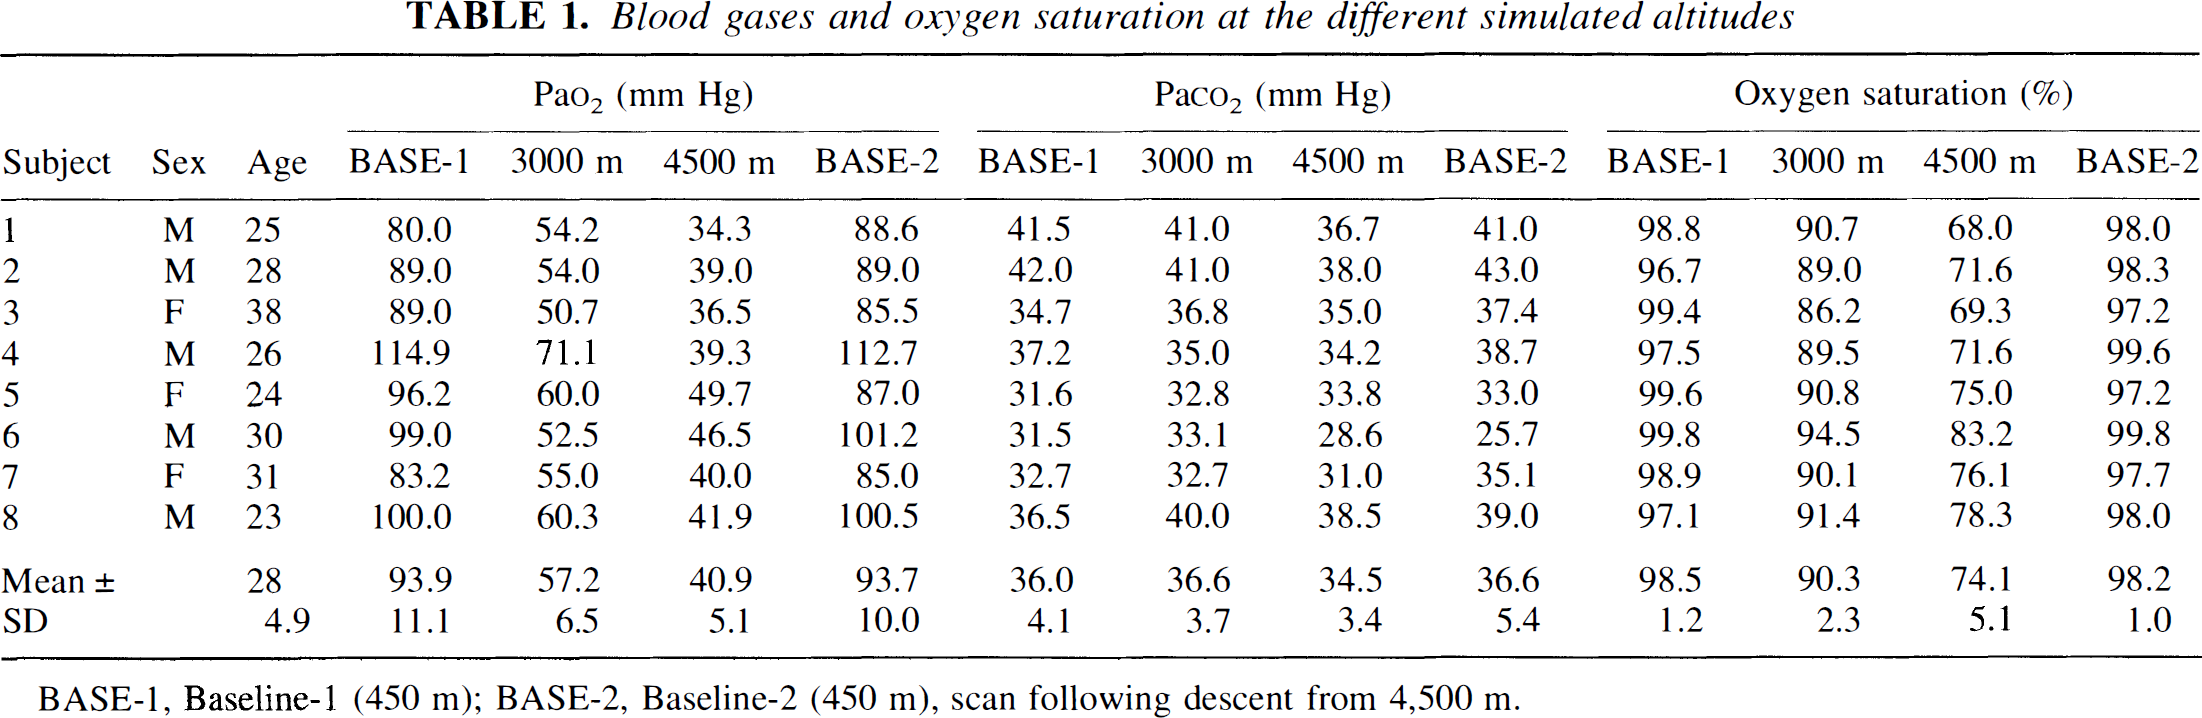
BASE-1, Baseline-1 (450 m); BASE-2, Baseline-2 (450 m), scan following descent from 4,500 m.
The changes of mean gCBF are documented in Table 2. An analysis of variance yielded a significant main effect of altitude (F(3) = 6.45; P = 0.0019). Although there was no relevant change from baseline-1 to 3,000 meters, gCBF increased from 31.4 ± 5.9 at baseline-1 to 41.6 ± 9.0 mL·minute−1·100 g−1 at 4,500 m (P < 0.05). The mean percentage change was 36.2%. At baseline-2 the values returned to those of baseline-1. The individual changes were quite variable. In four volunteers the increase at 4,500 m exceeded 60%, in three others the increase was moderate (4.2% to 15.5%), and in one volunteer there was a decrease of 18.4%.
Global blood flow at the simulated altitudes
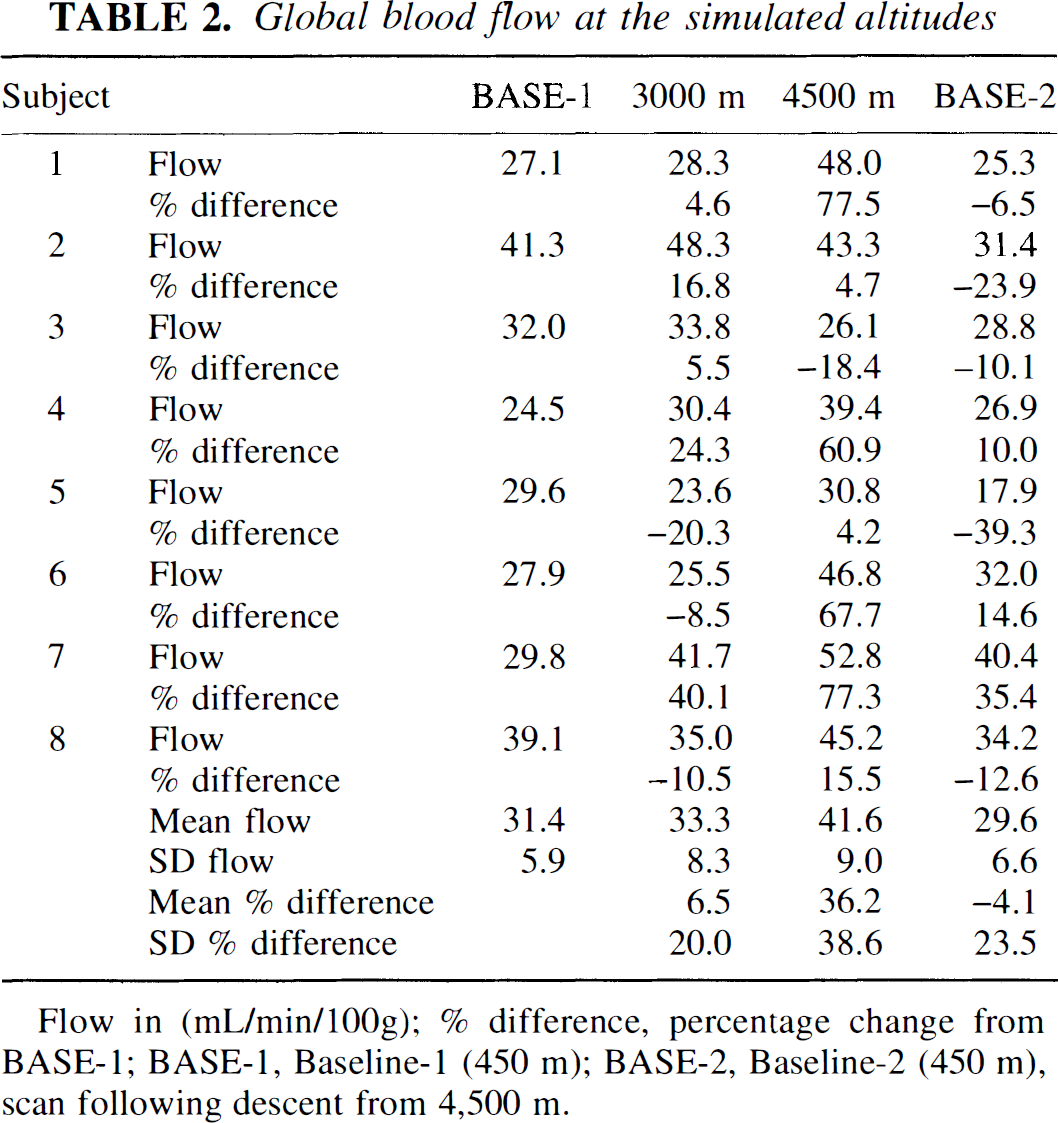
Flow in (mL/min/100g); % difference, percentage change from BASE-1; BASE-1, Baseline-1 (450 m); BASE-2, Baseline-2 (450 m), scan following descent from 4,500 m.
The correlation between gCBF and PaO2 was investigated with linear regression. For this purpose the gCBF values of all subjects and altitude stages were pooled. There was a significant negative correlation (gCBF = −0.169PaO2 + 46.05, r = 0.49, P = 0.004). No significant correlation was found between gCBF and PaCO2.
The regional variations in cerebral blood flow are demonstrated in Fig. 1. A multivariate analysis of variance proved the effects of altitude (Wilks' Lamda, F(30) = 3.43; P < 0.0001) to be highly significant. The univariate contrast analyses demonstrated that the examined regions displayed a significant increase of blood flow from baseline-1 to 4,500 m. The highest increase was detected in the hypothalamic region (+32.8% ± 21.9%, F(1) = 25.64, P < 0.0001). The second largest increases were observed in thalamus and cerebellum (19.2% ± 16.3% and 17.6% ± 14.8%). In the other regions the increase varied between 9.1% and 13.8%. At 3,000 m no significant flow changes occurred relative to baseline-1, although there was clearly a tendency toward a flow increase in the hypothalamus (+12.7% ± 26.0%). During baseline-2 the flow returned to the values of baseline-1 in all regions.
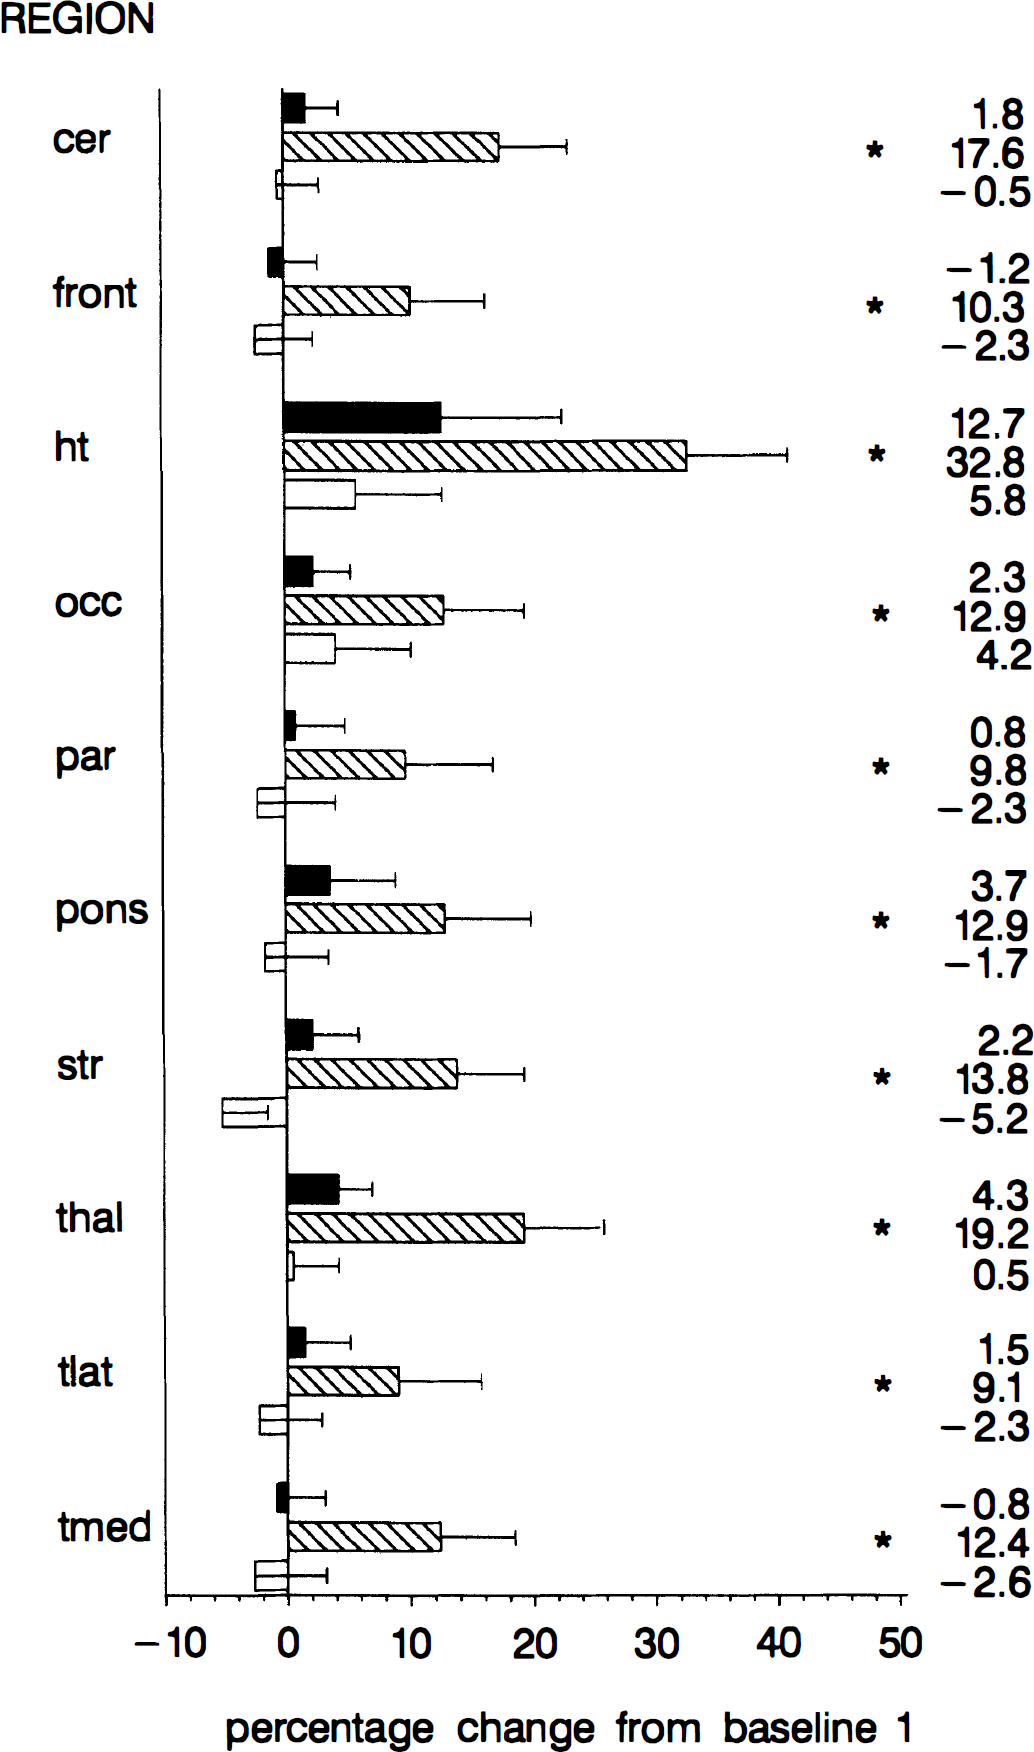
Regional changes at 3,000 m (top), 4,500 m (middle), and baseline-2 (bottom) relative to baseline-1. The bar graph represents the mean ± SEM of the percentage change. The numbers denote the mean of the percentage change. cer, cerebellum; front, frontal cortex; ht, hypothalamus; occ, occipital cortex; par, parietal cortex; str, striatum; thal, thalamus; tlat, lateral temporal lobe; tmed, medial temporal lobe. * P < 0.05 for contrast relative to baseline-1.
The result of statistical parametric mapping to screen for regions with above-average flow increases is shown in Fig. 2. The only region with excessive blood flow increases from baseline-1 to 4,500 m was the hypothalamus.
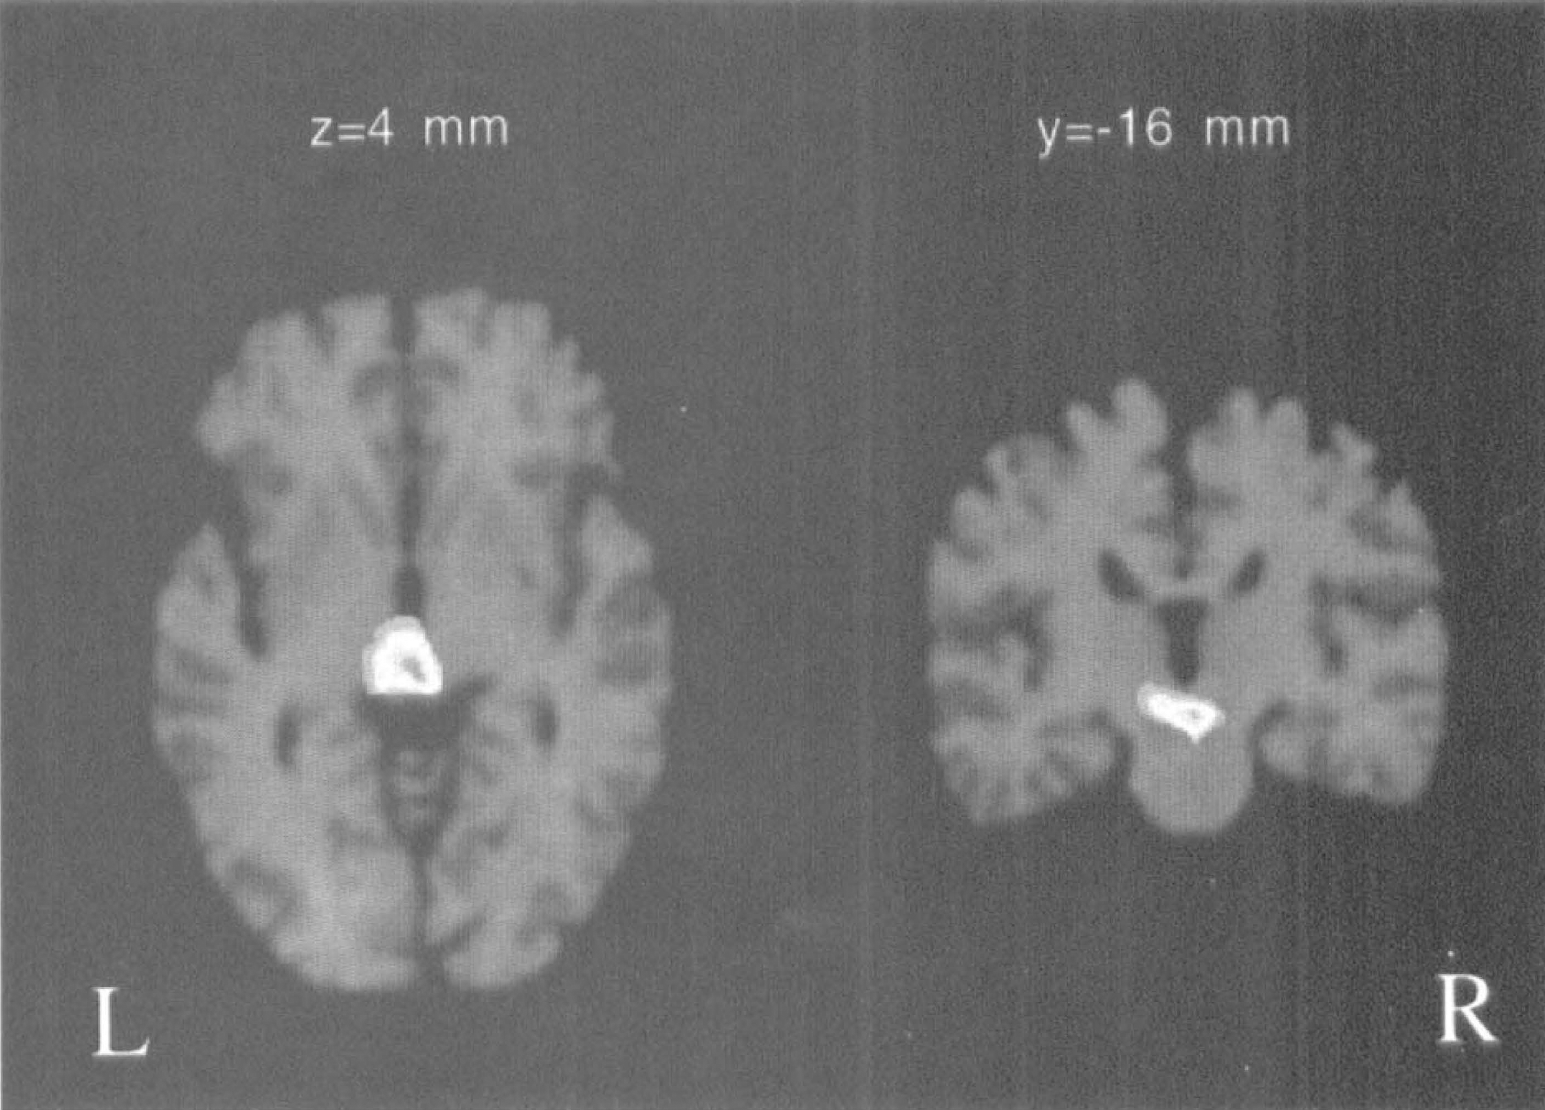
Area with excessive flow increase identified with statistical parametric mapping. Displayed are the z-scores of the contrast 4,500 m-baseline-1 superimposed on stereotaxically coregistered magnetic resonance slices through the hypothalamus. Indicated are only pixels with z > 4.3 (P < 0.05, corrected for multiple comparisons). Because global increases in blood flow were removed, remaining significant differences are considered excessive. The only region with excessive increase was the hypothalamus.
DISCUSSION
High-altitude physiology is gaining more attention given the increasing number of people engaged in altitude sporting activities. Although much data exist on the effect of hypoxia at high altitude on gCBF, little is known about regional effects. Thus, the major aim of this study was to investigate rCBF during short-term exposure to hypoxia. For this purpose PET is ideally suited because of its relatively high spatial resolution and the existence of validated methods to quantitatively assess rCBF.
Some discrepancies exist regarding the threshold at which gCBF at high altitude begins to rise. In our study a significant increase of gCBF occurred between 3,000 and 4,500 m, corresponding to PaO2 values between 57 and 41 mm Hg. This is in agreement with previous studies that reported a threshold of 50 mm Hg (PaO2) before gCBF begins to rise (Lassen, 1959; Shimojyo et al., 1968; Kogure et al., 1970). However, there is a report of no consistent increase after ascent from 1,600 m to 4,800 m (Reeves et al., 1985) and others that find significant increases after ascending from 150 m to 3,475 m (Jensen et al., 1990). Another issue is the role of PaCO2. It is well known that a decrease of PaCO2 under normoxic conditions exerts a vasoconstrictive effect in the CNS. During hypoxia the increase in CBF is smaller under hypocapnic compared with normocapnic conditions (Krasney et al., 1990). We did not find a correlation between gCBF and PaCO2. However, the drop in PaCO2 was minimal, at 4,500 m only three subjects displayed a decrease of PaCO2 of more than 3 mm Hg. Thus, this study does not allow clear conclusions on the role of PaCO2 in the regulation of CBF during hypoxia.
As mentioned in the introduction, AMS is a controversial topic in high-altitude physiology. Its pathophysiologic mechanisms are poorly understood. Studies on a potential correlation between the increase in gCBF and the occurrence of lesser symptoms of AMS such as headaches are inconclusive. In two studies, no such correlation was found (Reeves et al., 1985; Jensen et al., 1990), whereas in another gCBF increased relatively more in subjects with symptoms of AMS compared with subjects without (Baumgartner et al., 1994). These field studies differed considerably from our laboratory study. The subjects could be monitored for several days at high altitude, whereas the exposure to each altitude lasted only 20 minutes in our study. Thus, the results of this work concern only transient effects of short-term exposure to hypoxia.
A clear advantage of the PET method is the ability to quantitatively assess CBF on a regional basis, whereas only gCBF can be investigated in field studies. To our knowledge this is the first study to demonstrate excessive CBF increase in the hypothalamus during short-term exposure to hypoxia. The true increase can be expected to be even higher, because the limited resolution of the PET method leads to underestimation of CBF in small structures. The physiologic meaning of the finding is at present not clear. However, considering the essential function of the hypothalamus as the neuroendocrine interface between brain and body, impaired function might lead to life-threatening conditions. It is tempting to speculate that the excessive increase in hypothalamic blood flow indicates an increased susceptibility of this brain structure to hypoxic functional impairment. It would therefore be highly interesting to further follow up on this finding and to investigate whether the hypothalamic function is related to any symptoms of AMS.
Footnotes
Acknowledgements
The authors thank Thomas Berthold for the data acquisition, Nadia Kahn and Thomas Pfammater for medical assistance, and the radiochemistry team for their collaboration.