
Abstract
Nineteen lightly sleep-deprived healthy volunteers were examined with H215O and positron emission tomography (PET). Scanning was performed during wakefulness and after the subjects had fallen asleep. Sleep stage was graded retrospectively from electroencephalogram (EEG) recordings, and scans were divided into two groups: wakefulness or synchronized sleep. Global flow was quantified, revealing no difference between sleep and wakefulness. A pixel-by-pixel—blocked one-way analysis of variance (ANOVA) was performed after correcting for differences in anatomy and global flow. The sum of squares of the z-score distribution showed a highly significant (P < 0.00001) omnibus difference between sleep and wakefulness. The z-score images indicated decreased flow in the thalamus and the frontal and parietal association cortices and increased flow in the cerebellum during sleep. A principal component (PC) analysis was performed on data after correction for global flow and block effects, and a multivariate analysis of variance (MANOVA) on all PC scores revealed significant (P = 0.00004) differences between sleep and wakefulness. Principal component's 2 and 5 correlated to sleep and revealed distinct networks consisting of PC 2, cerebellum and frontal and parietal association cortices, and PC 5, thalamus.
Sleep typically is characterized (Rechtschaffen and Kales, 1968) and studied by means of changes in the electrical activity of the brain. These changes may be measured as the net changes of large neuronal populations by surface electroencephalogram (EEG; Lewine and Orrison, 1995), as single-unit recordings (Steriade and Hobson, 1976), or, more recently, as changes in neuronal populations as expressed by the accompanying changes in magnetic field potential (Lu et al., 1992).
Another line of studies attempts to study sleep by its effects on global and/or local metabolism or perfusion (Madsen and Vorstrup, 1991; Franzini, 1992). Although many metabolic mapping studies have used EEG for staging of sleep, there seem to have been no attempts to explain the findings of metabolic mapping in terms of the profound changes in electrical activity. Hence, the findings tend to be of intradisciplinary interest only, and little cross-fertilization occurs.
One problem inherent in the study of metabolic changes as a consequence of sleep is that the usual assumptions that a local increase in metabolism/perfusion indicates an increased neuronal activity (Roy and Sherrington, 1890), and hence an involvement in the process at hand, almost certainly are not valid during nonrapid eye movement (non-REM) sleep. During REM sleep, the brain operates in “relay mode” (characterized by irregular firing patterns and a tonic readiness at a cellular level; Steriade et al., 1990), the same as during wakefulness, and metabolic images obtained during REM sleep therefore may be interpreted according to the usual function-metabolism coupling. Indeed, in a recently published study on REM sleep, data were discussed according to that model (Maquet et al., 1996).
However, for the interpretation of non-REM sleep data, another model is required. In the present study, we assume that an increased synchronization is accompanied by a decreased mean firing rate and hence, by a decrease in perfusion. The assumption of decreased mean firing rate is supported by previous data (Steriade and Hobson, 1976), although some concern regarding its validity has been raised (Hari and Salmelin, 1997). Based on this assumption, we attempt to explain our findings during non-REM sleep based on the oscillatory rhythms encountered during sleep.
Previous studies on cerebral metabolism during sleep have indicated that global cerebral energy metabolism is decreased during non-REM sleep (Heiss et al., 1985; Ramm and Frost, 1986; Buchsbaum et al., 1989; Maquet et al., 1990; Madsen et al., 1991a; Madsen et al., 1991b), whereas the picture is somewhat less clear for perfusion, where both increases (Reivich et al., 1968), decreases (Madsen et al. 1991b) and inconclusive (Balkin et al., 1991) results have been reported. The situation becomes even more complex when considering local changes, where comparisons between studies (Madsen and Vorstrup, 1991; Franzini, 1992) are rendered more difficult by species differences and by different choices of regions for the regional analysis. However, notable is the conspicuous absence of changes in the midbrain reticular formation (Moruzzi and Magoun, 1995) and the relative consensus (Ramm and Frost, 1983; Ramm and Frost, 1986; Buchsbaum et al., 1989; Maquet et al., 1990; Balkin et al., 1991; Maquet et al., 1997; Braun et al., 1997) that the thalamus is affected. It is well known that the thalamus is involved in the generation of the sleep spindles observed on cortical EEG (Andersen and Andersson, 1968; Steriade et al., 1990), and in humans, its destruction has been shown to correlate to degree of insomnia in the neurodegenerative disease fatal familial insomnia (Manetto et al., 1992).
In the present article, data are presented from 56 scans during wakefulness and non-REM sleep in a total of 19 subjects. Global flow was quantified in a majority of cases, and its values were contrasted between sleep and wakefulness. Furthermore, we employed techniques used for the analysis of activation studies, such as pixel-by-pixel ANOVAs and PC analysis, to characterize the spatial patterns of sleep-related flow changes. These data have been presented previously in a preliminary form (Andersson et al., 1995a; Hetta et al., 1995)
MATERIALS AND METHODS
Experiments
Scanning. Nineteen healthy subjects were scanned using H215O and positron emission tomography (PET) during wakefulness and after onset of sleep. They all had been asked to rise 2 hours earlier than usual in the morning on the day of the scanning, and the scanning took place in the evening. Subjects were scanned in a Scanditronix/GEMS PC2048-15B (Holte et al., 1989) or in a Scanditronix/GEMS PC4096-15WB (Kops et al., 1990) scanner (GE Medical Systems, Milwaukee, WI, U.S.A.). Both scanners produce 15 contiguous 6.5-mm thick slices and have a 6-mm axial and transaxial resolution. A radial arterial catheter was inserted in the left wrist, and a venous catheter was placed in the right cubital vein. The arterial catheter was lead through an automatic blood measurement device (Eriksson et al., 1988) and connected to a syringe pump for continuous withdrawal. Electrodes were applied to the subjects head as described in the following section. After positioning and fixation (foam padding in a plexiglass head holder) a 10-minute transmission scan with a rotating 68Ge pin source was performed. The scanning room was dimly lit and the subjects were instructed to close their eyes; automated blood sampling was commenced with a sampling frequency of 1 Hz, and approximately 1,000 MBq of H215O was injected. Scanner data were collected for 125 seconds divided into 17 5-second frames and 2 20-second frames, and blood data were collected for 140 seconds. Blood gases were gauged (ABL 520, Radiometer, Copenhagen, Denmark) from an arterial blood sample taken from the syringe pump immediately after each scan. After the initial scan, subjects were left alone in the scanning room, and their EEGs were monitored continuously and judged by an experienced sleep scorer. When the desired sleep stage occurred, production of H215O started, followed 5 minutes later by injection. The desired goal was to obtain one scan for each subject in each of four stages: wakefulness, light sleep (stages I and II), deep sleep (stages III and IV), and REM sleep. Images were reconstructed with a 6-mm Hanning filter after correction for attenuation using the transmission scan and for scattered radiation (Bergström et al., 1983).
Electrophysiology. Electrodes for EEG monitoring were applied according to a standard sleep montage with electrodes C4-A1 and C3-A2. Additionally, two electro-oculogram (EOG) electrodes and submental electromyography (EMG) electrodes were used. After 100-μV calibration, data were collected continuously and stored with a sampling frequency of 100 Hz by a Nightingale Polygraphic Sleep Analyzer (Judex Datasystemer A/S, Aalborg, Denmark).
Data processing
To facilitate an understanding of how data were analyzed, the procedures are described schematically in Fig. 1, in addition to the verbal description in the following sections.
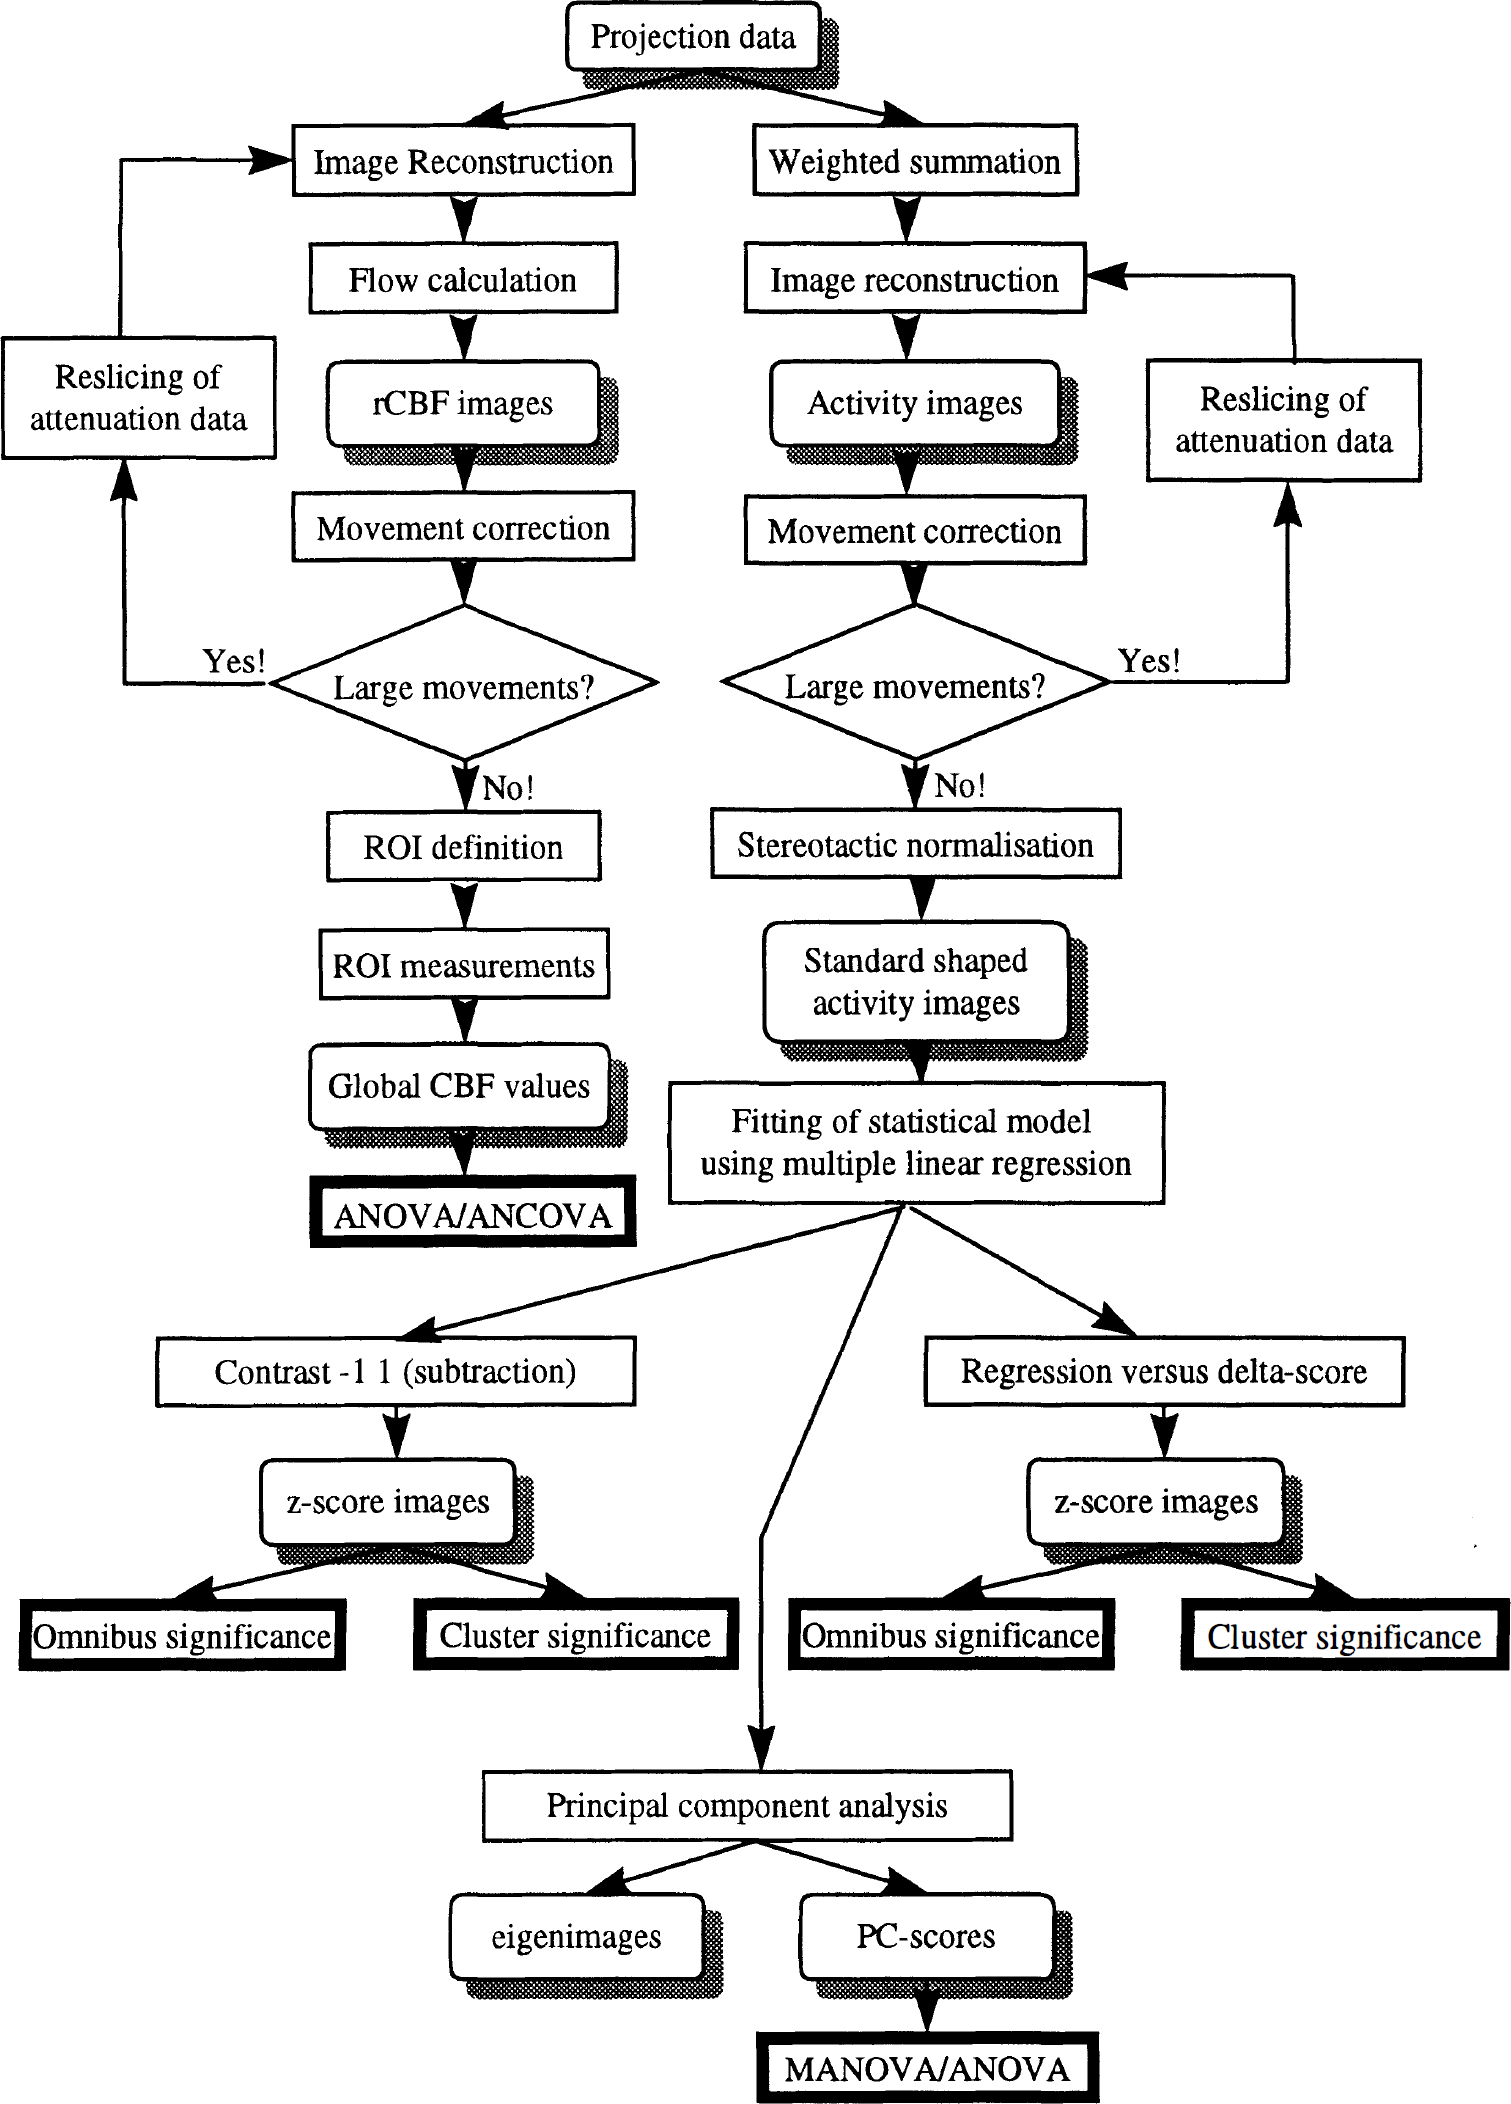
Schematic description of the analysis of data. The analysis progress from top to bottom. Rounded boxes with shadowing signify data, regular boxes signify an operation, and bold frames are used to denote the endpoint of each chain.
Sleep staging and calculation of delta score. Sleep scoring was done on 30-second epochs according to standard criteria (Rechtschaffen and Kales, 1968). Only if scoring was consistent throughout a 3-minute period centered on the PET data acquisition time was the study included for further processing. To derive a continuous measure of sleep depth, 2-second mini epochs were subjected to frequency analysis using autoregressive modeling of seventh order (Makhoul, 1975; Åström and Trojaborg, 1992). The delta power was calculated as the mean power(μV2) in the 0.5 to 3.5 Hz band from time of injection of H215O and 40 seconds afterward.
Calculation of global flow. The autoradiographic method (Herscovitch et al., 1983; Raichle et al., 1983) was used to generate quantitative flow maps. An integration time of 60 seconds from time of arrival of bolus to the brain was obtained by summing the individual 5-second images, the brain—blood partition coefficient was assumed to be 0.95 mL/mL, and delay and dispersion were estimated and corrected (Meyer, 1989). Because of technical problems associated with the blood sampling, quantitative blood flow could be calculated only for 42 scans in a subgroup of 16 subjects. Global flow was assessed by drawing regions of interest circumventing all intracerebral voxels in transversal slices corresponding approximately to a level 6 mm below the commisures and 28 mm upwards.
Weighted summation. A weighted summation of data from the first 100 seconds after arrival of bolus to the brain was performed. The weight function was chosen so that data obtained during the inflow phase, in which sensitivity to flow changes is highest, was given a relatively larger weight. It has been shown that this weighting yields near optimal signal-to-noise ratio (Andersson and Schneider, 1997). The weighting was performed on projection data, after which data were corrected for attenuation using the transmission scan and for scattered radiation (Bergström et al., 1983) and reconstructed with a 15-mm Hanning filter.
Registration. Movements between scans were detected and corrected (Andersson, 1995). When movements larger than 3 mm in any direction or 3° around any axis were found, the transmission scan was reoriented to ensure an accurate attenuation correction (Andersson et al., 1995b). The weighted summation images were normalized stereotactically to a computerized brain atlas (Greitz et al., 1991) by manually adapting selected atlas brain structures (Thurfjell et al., 1995) to PET data from each subject.
Statistical analysis
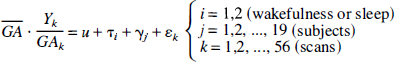
Global flow. The influence from sleep on global flow values was assessed 1) using a randomized block ANOVA and 2) using a completely randomized ANOVA, in the former case dividing data into sleep and wakefulness, and in the latter case dividing data into wakefulness, light sleep (stages I and II), and deep sleep (stages III and IV). Both analyses were performed both with and without the inclusion of arterial partial pressure of carbon dioxide (Pa
Furthermore, global flow was correlated to delta score according to
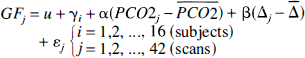
searching for a significant reduction of variance from the inclusion of β.
Pixel-wise multiple linear regression. Each voxel of the scaled images was fitted to a statistical model described by
where
Pixel-wise subtraction analysis. After fitting of data to the model described by equation 2, sleep was contrasted to wakefulness through a contrast vector with −1 for wakefulness, 1 for sleep, and 0 otherwise. The resulting t map (df = 36) was converted to a z-score map through a probability preserving transform (Friston et al., 1991). Significance of change was assessed both globally from the mean sum of squares of the z-scores from all intracerebral voxels (Worsley et al., 1995) and locally by considering the spatial extent of clusters of voxels with z-scores greater than 2.6 (Friston et al., 1994).
Note on choice of contrast. All sleep stages were lumped when performing the subtraction analysis to provide for tests of readily interpretable hypotheses. The “design” indicated in Table 1 is incomplete—that is, all sleep stages were not observed in all subjects—and unbalanced—that is, for progressively deeper sleep, there were fewer observations. Thus, it was not possible to test any direct hypotheses (e.g., stage I sleep vs. wakefulness; Milliken and Johnson, 1984). Of the two possible remedies, using type IV hypotheses involving a linear combination of state and block effects (Milliken and Johnson, 1984) or lumping data to obtain a complete design, we chose the latter.
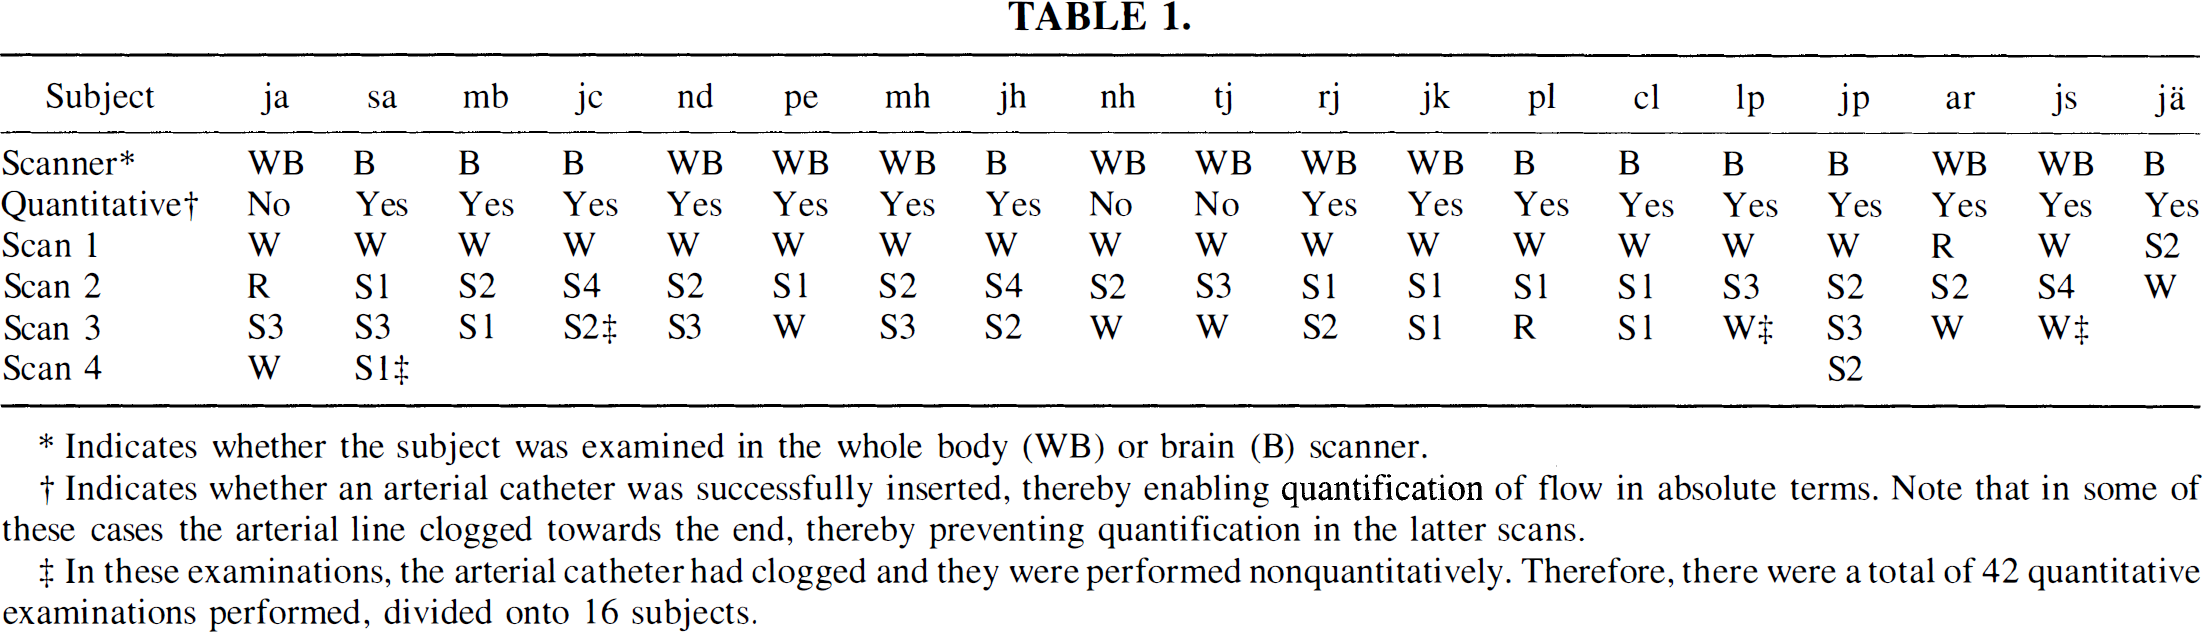
Indicates whether the subject was examined in the whole body (WB) or brain (B) scanner.
Indicates whether an arterial catheter was successfully inserted, thereby enabling quantification of flow in absolute terms. Note that in some of these cases the arterial line clogged towards the end, thereby preventing quantification in the latter scans.
In these examinations, the arterial catheter had clogged and they were performed nonquantitatively. Therefore, there were a total of 42 quantitative examinations performed, divided onto 16 subjects.
Pixel-wise regression of flow versus delta score. The lumping employed previously may lead to a poor power because of a large heterogeneity in the sleep group, containing everything from very light (stage I) to deep sleep (stage IV). The error variance might be decreased, and hence the power augmented, by correlating flow to delta score, thereby accommodating some of the variance of the sleep group. Therefore, data were fitted to a statistical model described by
where Δk denotes delta score in scan
Pixel-wise principal component analysis. After having obtained the least-square solution for equation 2, data for each scan and voxel were corrected for global mean and block effects (u and γ) and organized in a matrix,
RESULTS
Examinations were completed in a total of 19 subjects. Table 1 shows the scanner on which each subject was examined, whether absolute quantification of flow was achieved successfully, and a posteriori sleep classification for each scan for each subject. Note that when flow could be quantified in some but not all of the scans in a given subject, that subject has been marked with a “yes” in Table 1. Scans performed during REM sleep have been included in the table but were excluded from further analysis and will be the subject of a separate report.
Global flow
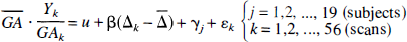
Global flow values, expressed in mL/(min · 100 mL), for wakefulness (n = 17, mean = 41.8, standard deviation [SD] = 5.5), light sleep (n = 17, mean = 41.9, SD = 8.6), and deep sleep (n = 8, mean = 43.7, SD = 10.1) are shown in Fig. 2. No significant differences in global flow were found between sleep and wakefulness, neither with the blocked ANOVA/analysis of covariance (ANCOVA) (P = 0.843/P = 0.315) or the completely randomized ANOVA/ANCOVA (P = 0.833/P = 0.832). Nor did Pa
Global flow during wakefulness and during light (stages I and II) and deep (stages III and IV) sleep.
Subtraction
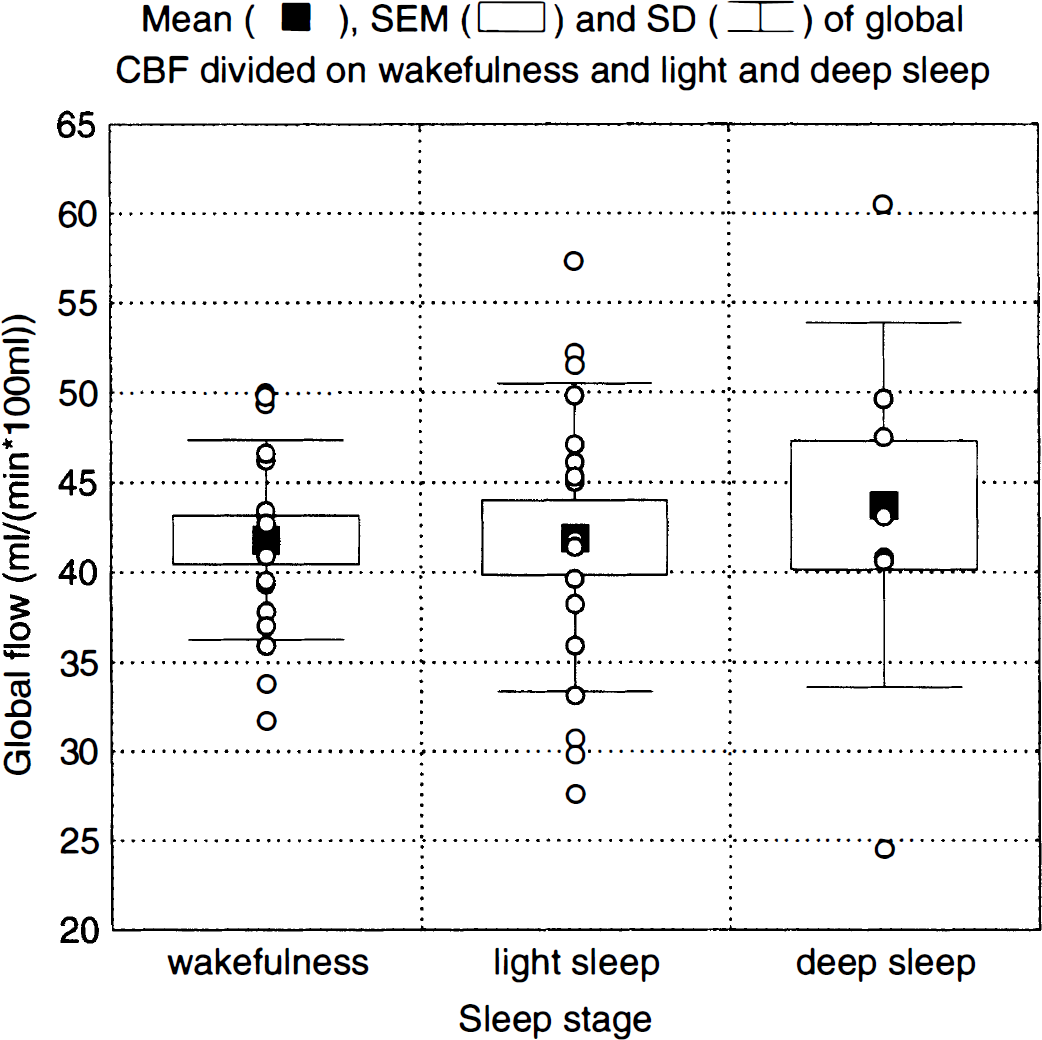
The subtraction analysis yielded z-score images, based on t images with 36 degrees of freedom, depicting increases (Fig. 3, upper two rows) and decreases (Fig. 3, lower two rows) during synchronized sleep compared with wakefulness. The omnibus statistic of the entire volume was highly significant (S = 1.797, P < 0.00001) (Worsley et al., 1995). Local decreases reaching statistical significance (0.05 for the entire volume) were found in the right prefrontal and in the left parietal cortices, whereas significant increases were located to the ventricular system (see discussion for an explanation of this). Because of the nonfocal nature of these changes, quite unlike anything we have encountered in activation studies, they will not be described in terms of coordinates of local maxima. Instead, they will be described in terms of the Brodmann areas that are covered to more than half their extent by the changes, as determined by a human observer.
Z-score images depicting increased (upper two rows) and decreased (lower two rows) flow during sleep compared with wakefulness. To facilitate the anatomic orientation, the brain surface, caudate, and putamen are shown in yellow, the thalamus and central sulcus in red, hippocampus in white, and hypothalamus in green. The images are viewed from below so that the right of the images correspond to the left of the brain.
A study of the z-score images (Fig. 3, lower two rows) indicates widespread bilateral decreases in frontal and association cortices with a sparing of the primary sensory, visual, and auditory cortices. The frontal changes encompassed Brodmann areas 47, 46, 10, 44, 45, and 4. Parietal changes occurred in areas 39 and 40, and an additional area of limited spatial extent was localized in the posterior gyrus cinguli (areas 23, 26, 29, and 30). Bilateral decreases also were seen in the thalamus and in the hippocampus. The magnitude of the mean changes in the thalamus was larger than that of other areas, but the residual error also was larger for the thalamus, thereby resulting in z-scores of approximately the same size. The increases (Fig. 3, upper two rows) were found mainly bilaterally at the anterior and posterior horns of the ventricular system, and to some extent in the cerebellum.
Regression versus delta score
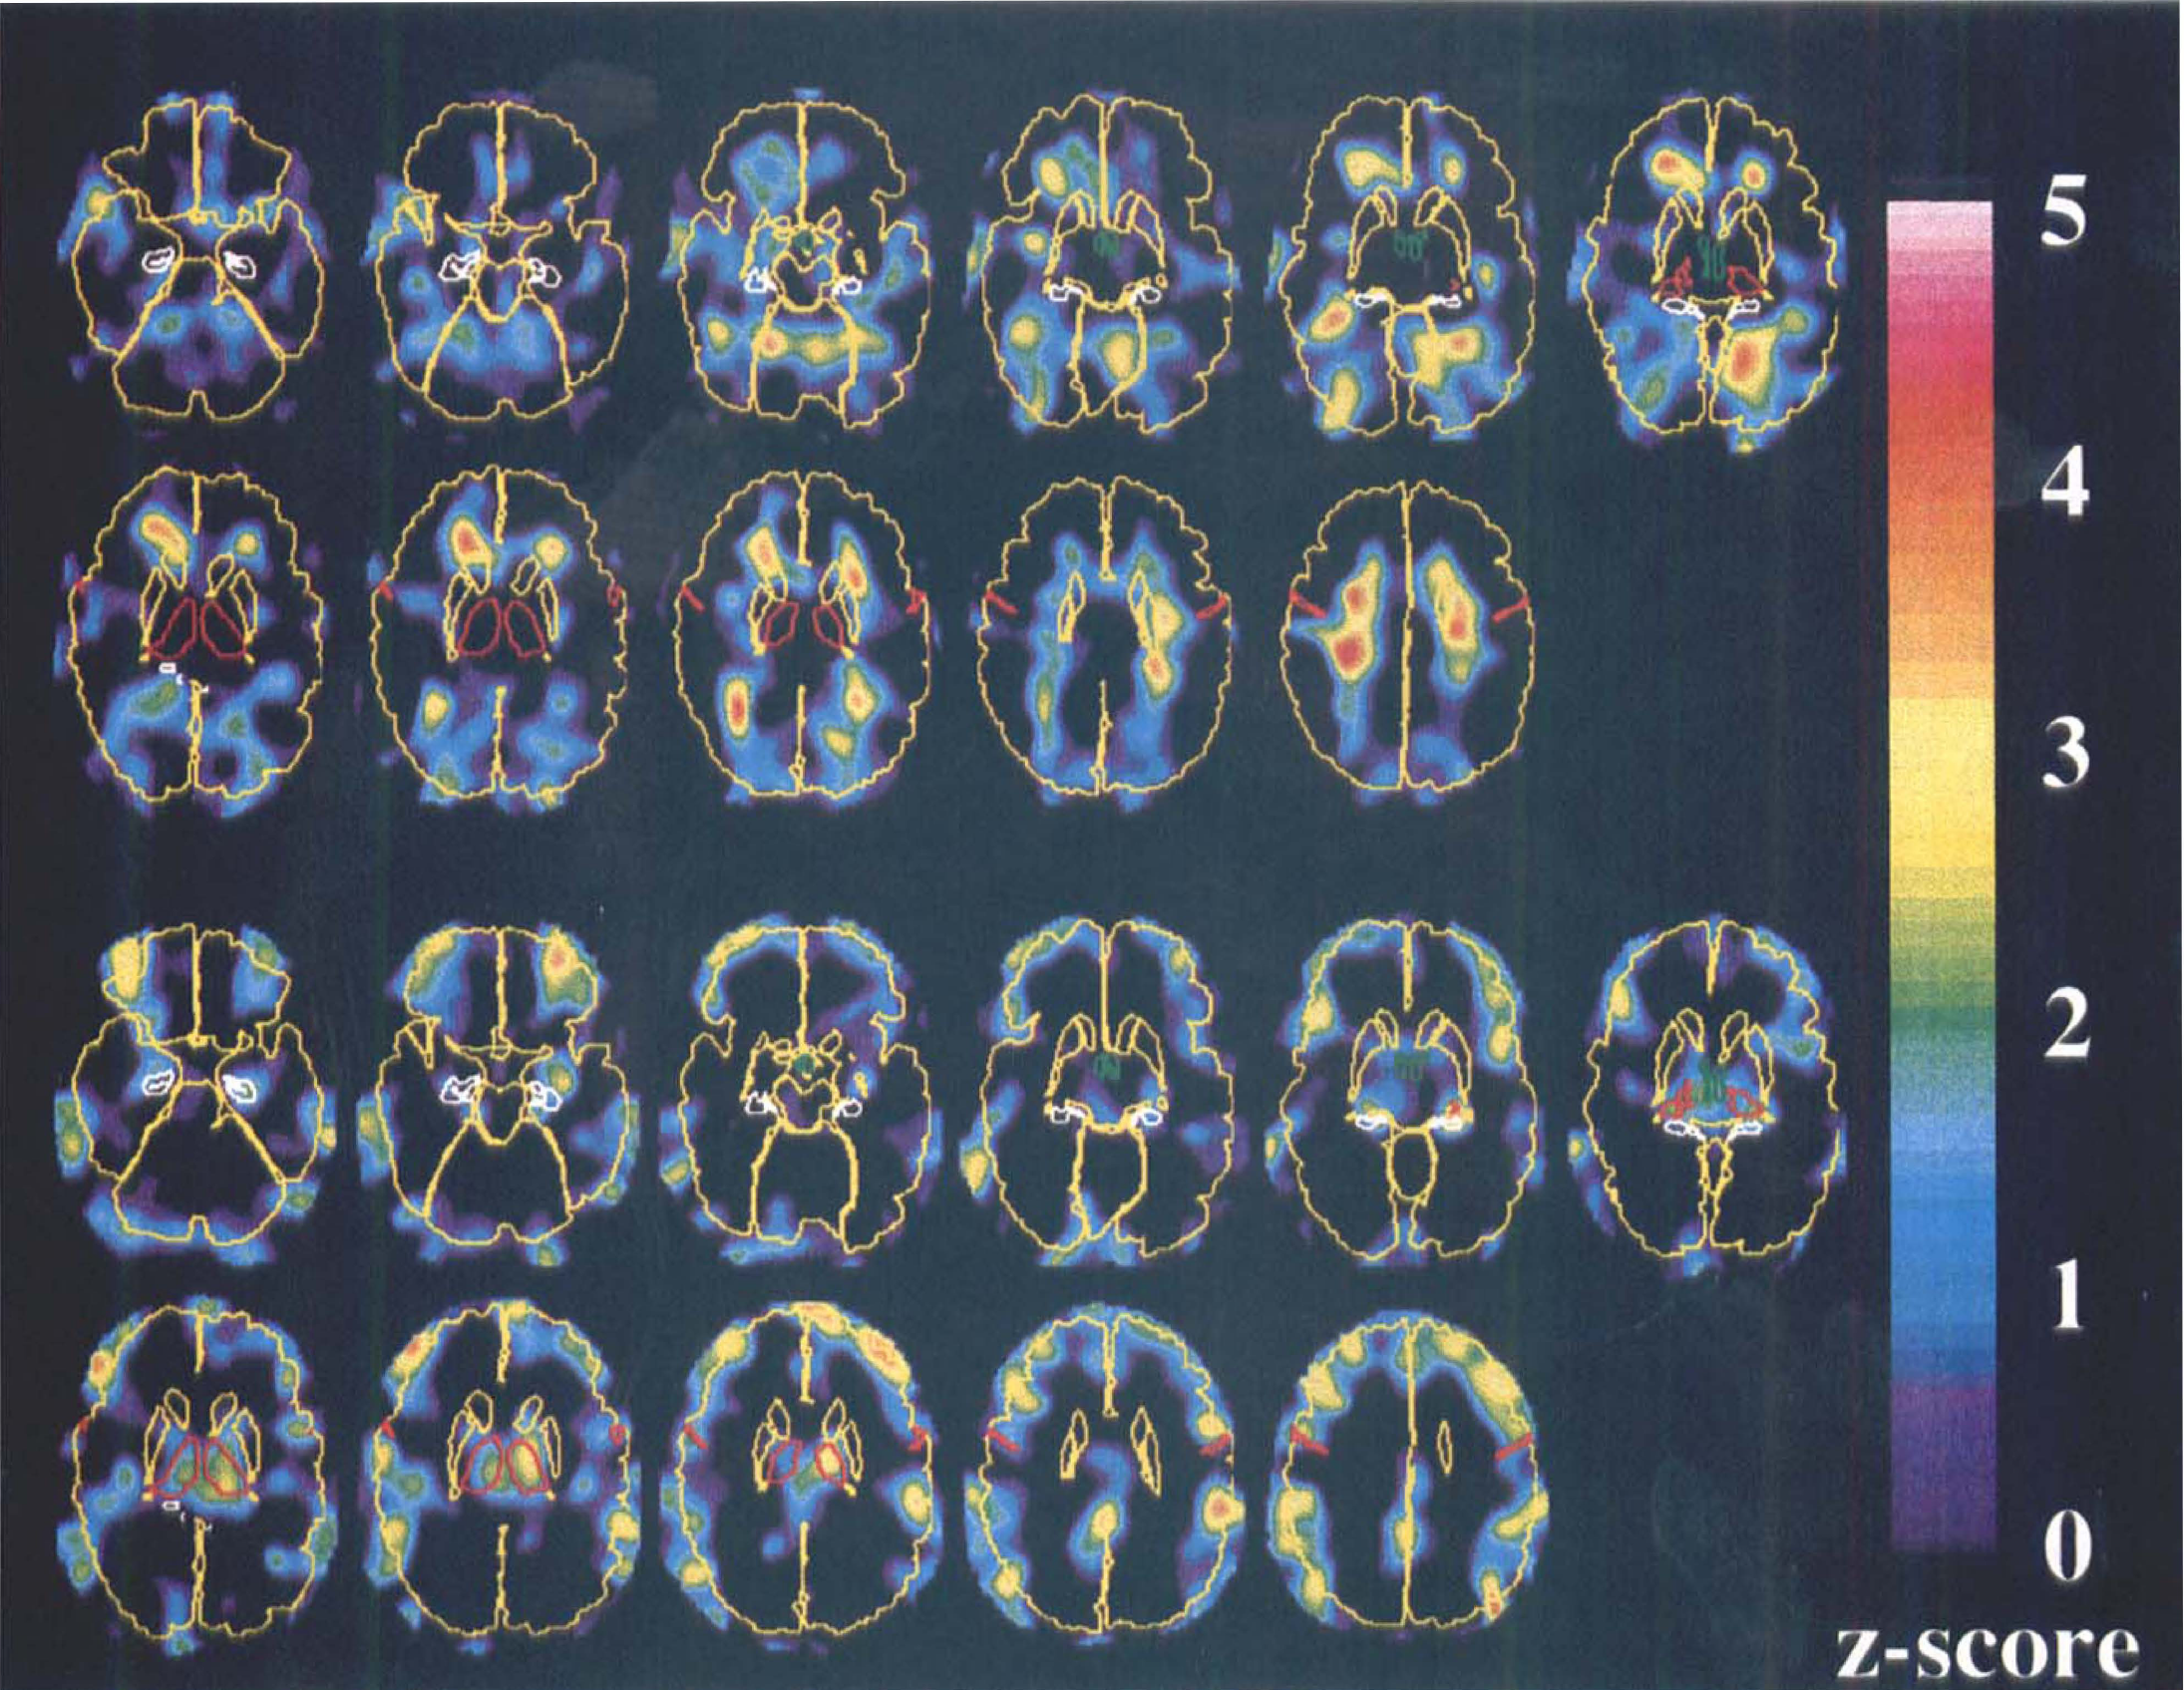
The z-score images obtained from the regression versus delta score are shown in Fig. 4, with increases in the upper two and decreases in the lower two rows. The z-scores generally were slightly higher than for the subtraction analysis, yielding an even higher square sum (S = 2.043, P < 0.00001) (Worsley et al., 1995). The images show great similarities to the subtraction images, which is expected because delta score correlates strongly with the sleep classification. Significant increases were confined to the cerebellum and to the ventricular horns. Three clusters with significant decreases were found in the right prefrontal cortex, in the prefrontal cortex along the midline, and in the left thalamus. The visual impression of the z-score images resembles that of the subtraction images, although there seem to be more deactivation of frontal cortex and the thalamus and less of the parietal cortex for the regression images. The Brodmann areas that were affected were the same as those described for the subtraction images. In addition, the caudal parts of the hippocampus and the amygdala show a negative correlation to delta score.
Z-score images depicting positive (upper two rows) and negative (lower two rows) correlations of flow versus delta score. To facilitate the anatomic orientation, the brain surface, caudate, and putamen are shown in yellow, the thalamus and central sulcus in red, hippocampus in white, and hypothalamus in green. The images are viewed from below so that the right of the images correspond to the left of the brain.
Principal component analysis
Thirty-seven nonzero eigenvalues with corresponding eigenimages were obtained. A two-way MANOVA on the scores from the first ten PCs indicated a highly significant overall difference in flow pattern between sleep and wakefulness (Wilks' Λ* = 0.039, df1 = 10, df1 = 9, P = 0.00004). Furthermore, the task by subject interaction (sleep vs. wakefulness) was significant (Wilks' Λ* = 0.0000064, df1 = 180, df1 = 100, P = 0.0045), indicating large intersubject differences in the effect from sleep on regional cerebral perfusion. When having performed the same type of analysis on data obtained with a highly reproducible paradigm, such as visual checkerboard stimulation, no task-by-subject interaction has been observed (J. Andersson, unpublished observation, 1997). Two-way ANOVAs performed on the PC scores from each of the ten first PCs indicated that mainly PC 2 and PC 5 (F1,18 = 9.48, P = 0.0065 and F1,18 = 19.13, P = 0.0004, respectively) showed sleep-related processes. Furthermore, only for the fifth PC did the two-way ANOVA indicate a significant task by subject interaction (F18,18 = 3.79, P = 0.0035).
The principal components are characterized by their eigenvalues, which rate their overall importance in explaining the observed variance; their eigenimages, which show which brain structures are involved; and by their scores, which may be used to show whether they correlate to sleep (or any other “peripheral” measure) and, which subjects contributed to it. Following is a short description of each of the five first PCs.
Principal component 1. The first PC explains 17% of the variance, and the scores show no correlation (F1,18 = 1,36, P = 0.259) to sleep. The eigenimages reveal a system with changes in one direction in the primary and secondary visual cortex and changes in the other direction in the cerebellum, thalamus, hypothalamus, and anterior gyrus cinguli. The scores did not reveal any obvious pattern, and it seems that this simply would be an interconnected system with large intrasubject variability of cerebral blood flow (CBF). This is consistent with previous reports indicating that a large part of the resting state variability in cerebral metabolism may be accounted for by one or two factors, although the implicated system does not seem to be identical to those previously described (Szabo et al., 1992).
Principal component 2. A high correlation (F1,18 = 9.48, P = 0.0065) was found between the second PC, explaining 10% of the variance, and sleep. Figure 5 shows the PC scores divided on wakefulness and light and deep sleep, and indicate that light and deep sleep affect the same system and that the magnitude of the changes is larger for deep sleep. The eigenimages show increases in the cerebellum (Fig. 6, upper row) and decreases in prefrontal, frontal, and parietal association cortices (Fig. 6, lower row) and in the hippocampus. Affected Brodmann areas are the same as those described previously for the subtraction images. The images of decreases show a strong similarity with the z-score images, except for the absence of the thalamus.
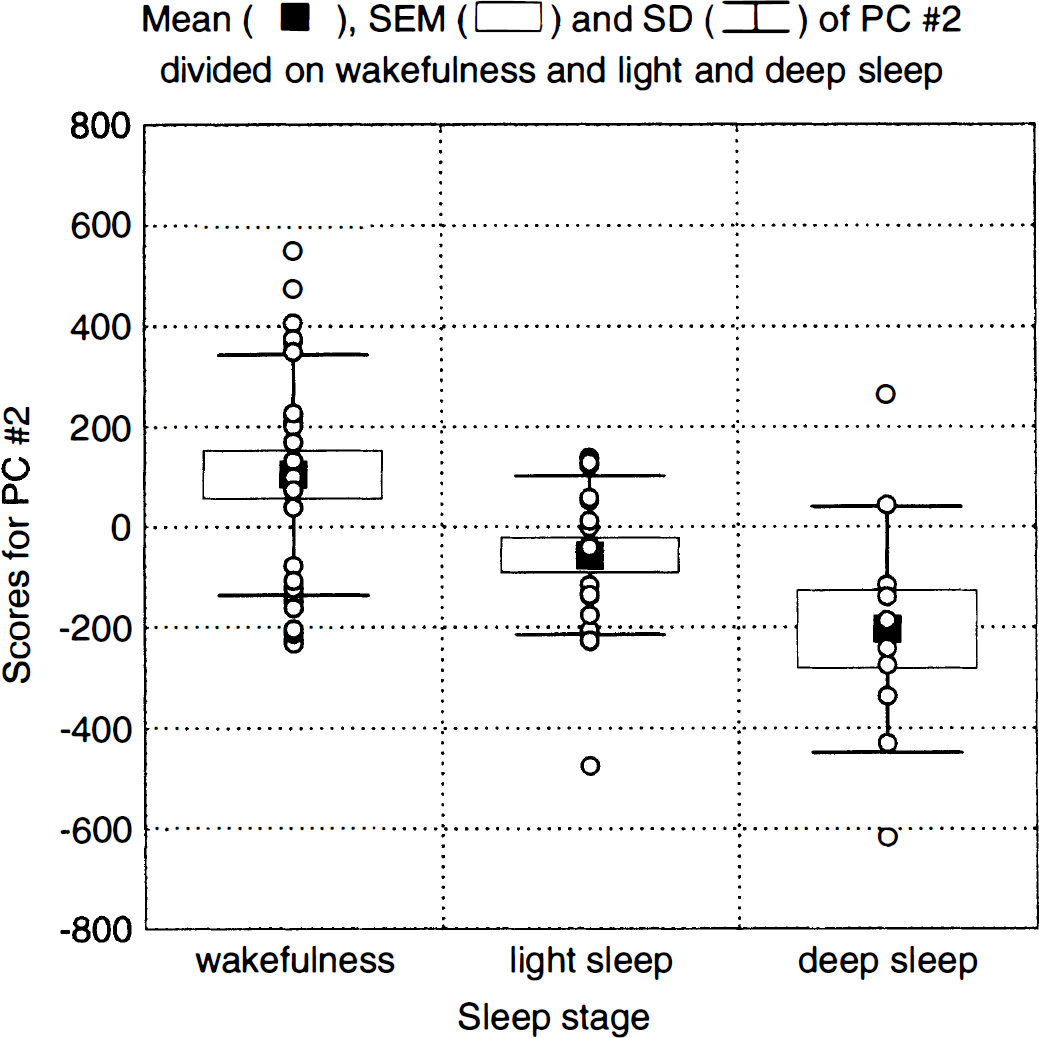
Scores for principal component (PC) 2 divided into wakefulness and light and deep sleep.
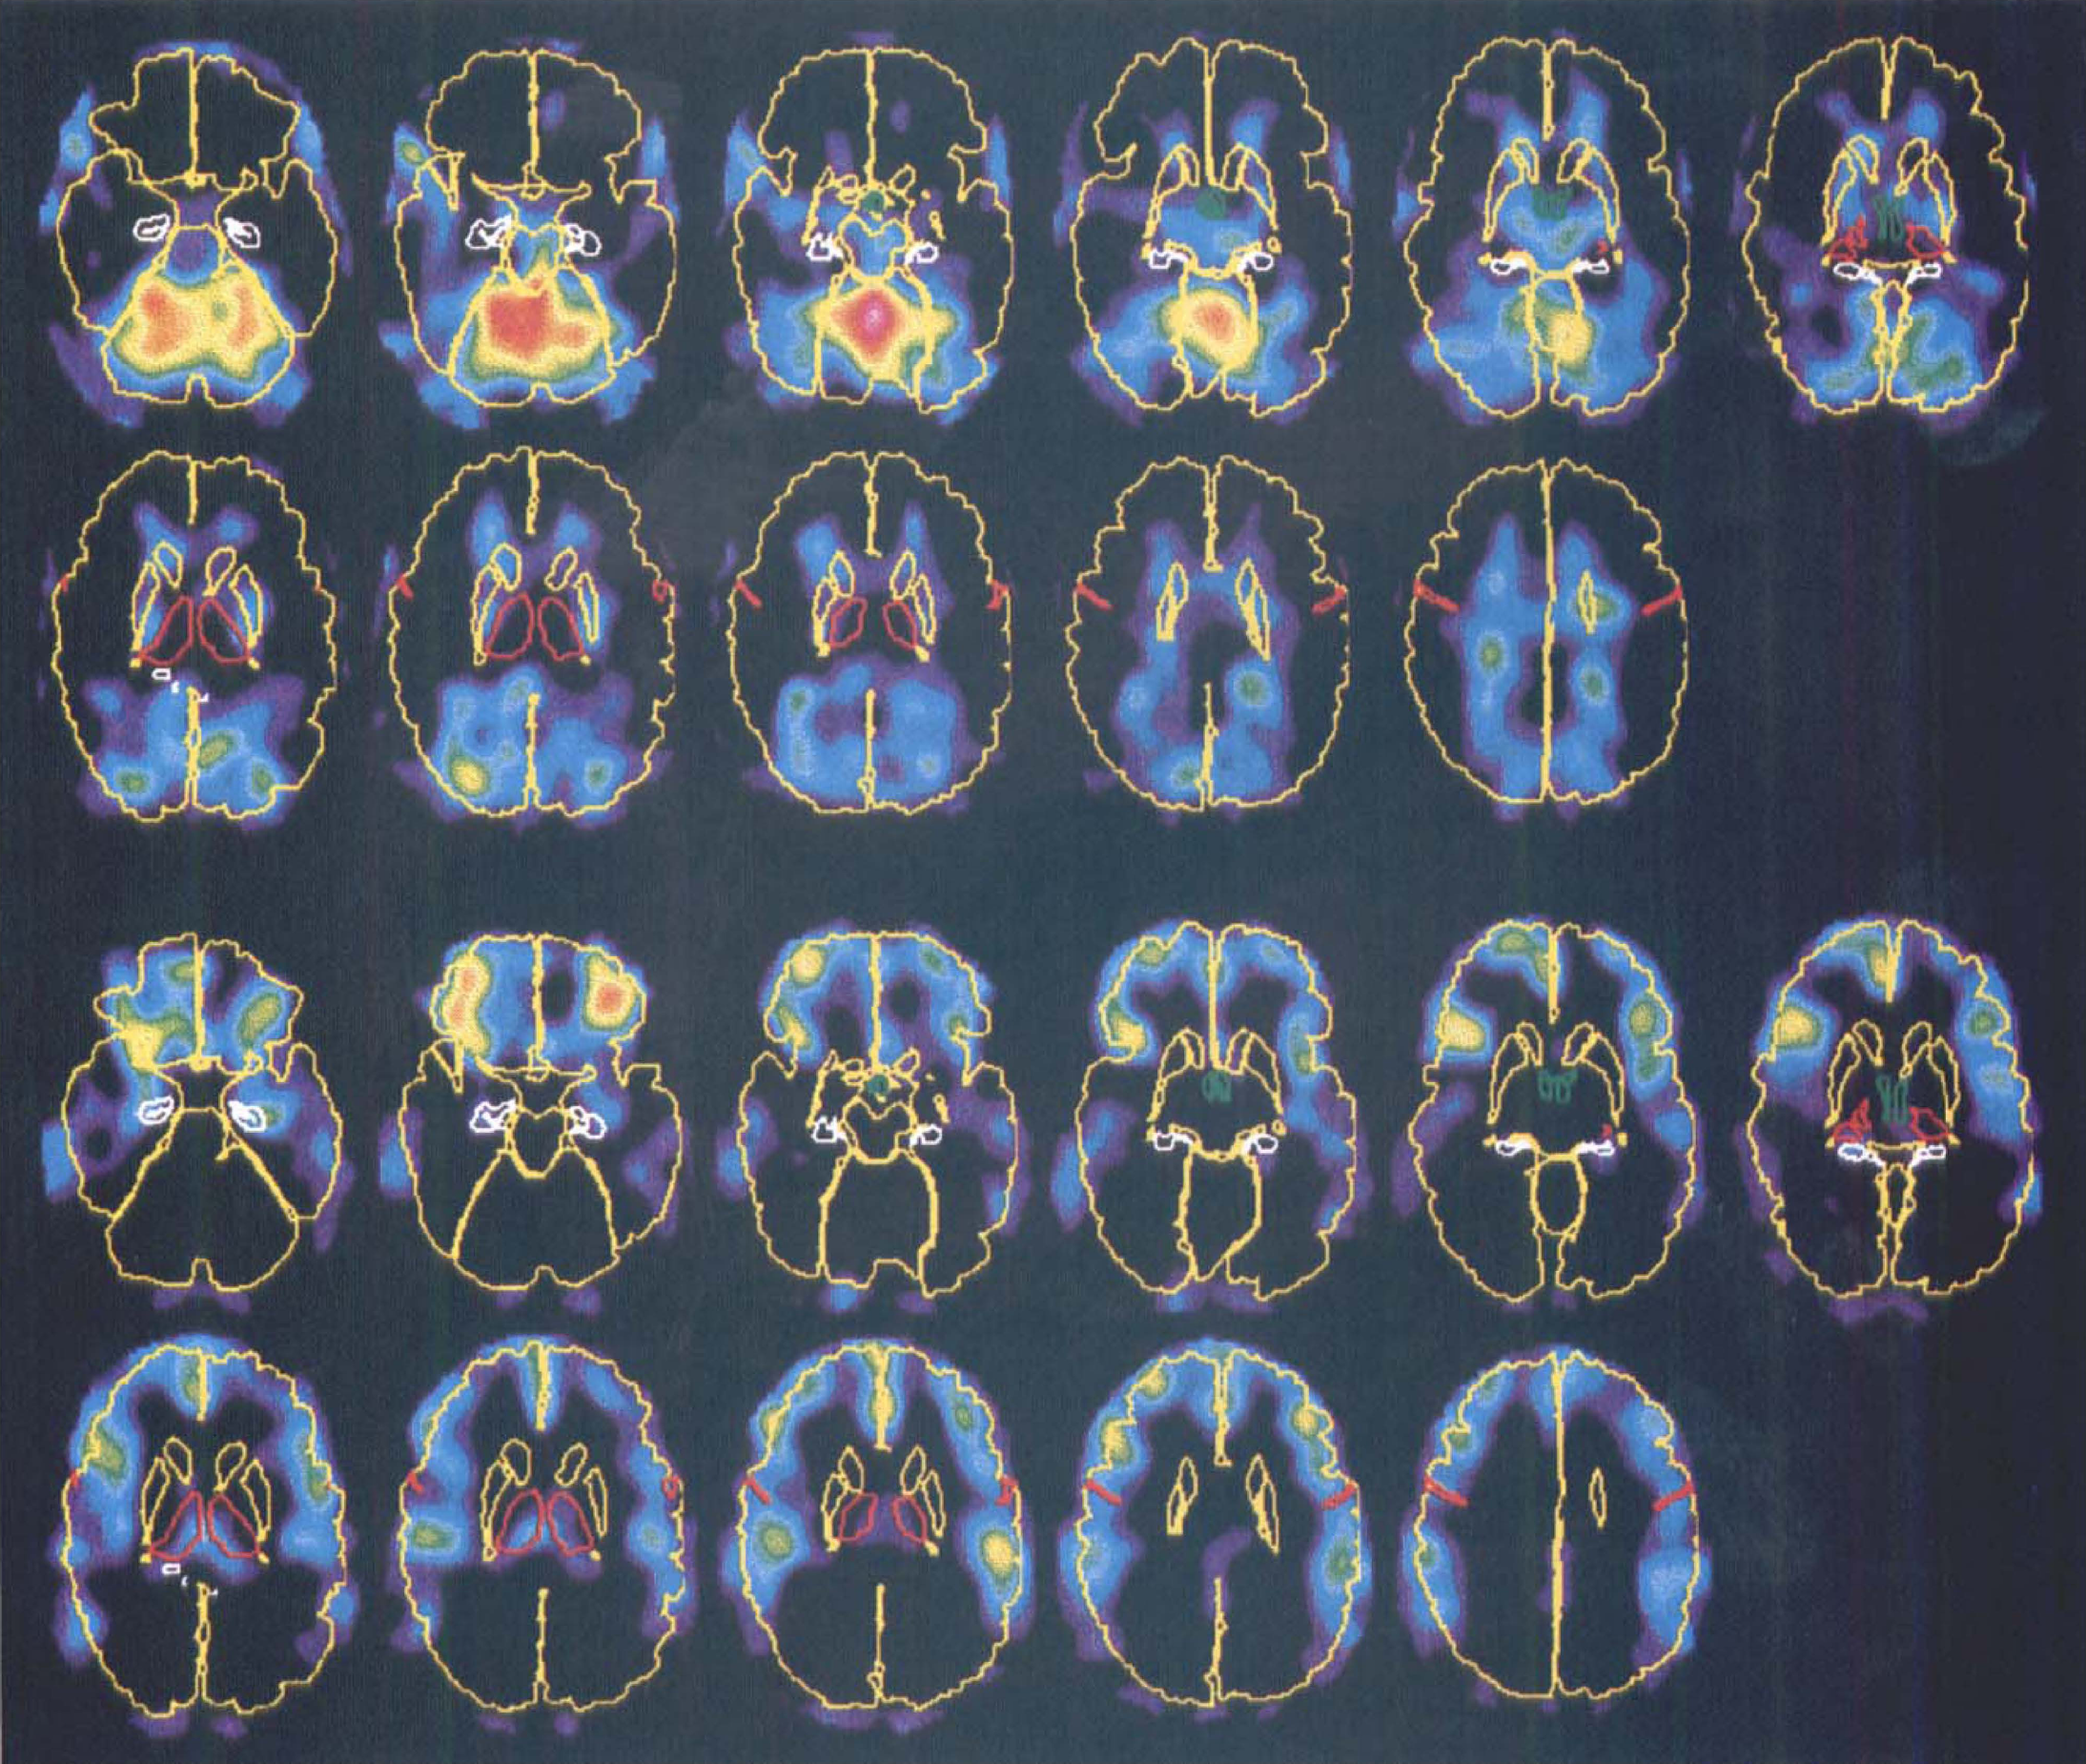
Eigenimages for principal component (PC) 2 showing areas of increased (upper two rows) and decreased (lower two rows) flow during sleep compared with wakefulness. Both sets of images are mapped into the same, arbitrary color scale. To facilitate the anatomic orientation, the brain surface, caudate, and putamen are shown in yellow, the thalamus and central sulcus in red, hippocampus in white, and hypothalamus in green. The images are viewed from below so that the right of the images correspond to the left of the brain.
Principal component 3. Principal component 3 shows no correlation with sleep (F1,18 = 0.51, P = 0.486), explains 6.3% of the total variance, and indicates a system with counter-directed changes in the primary visual cortex and lateral temporal cortex. The largest positive and negative scores for this PC was found in the two scans performed during wakefulness in the same subject (ja). This subject was unique because he exhibited singularly large changes between scans, changes that were readily visible to the bare eye before any processing.
Principal component 4. The scores for PC 4 did not differ significantly between sleep and wakefulness (F1,18 = 3.76, P = 0.068). The eigenimages show high loadings only for the medial orbitofrontal cortex that exhibit a tendency toward increased flow during light sleep compared with wakefulness. The PC scores show a pattern that deviates from that of PCs 2 and 5, where there are increased effects with deeper sleep (Figs. 5 and 7), because the scores differ between light sleep and wakefulness but not between wakefulness and deep sleep.
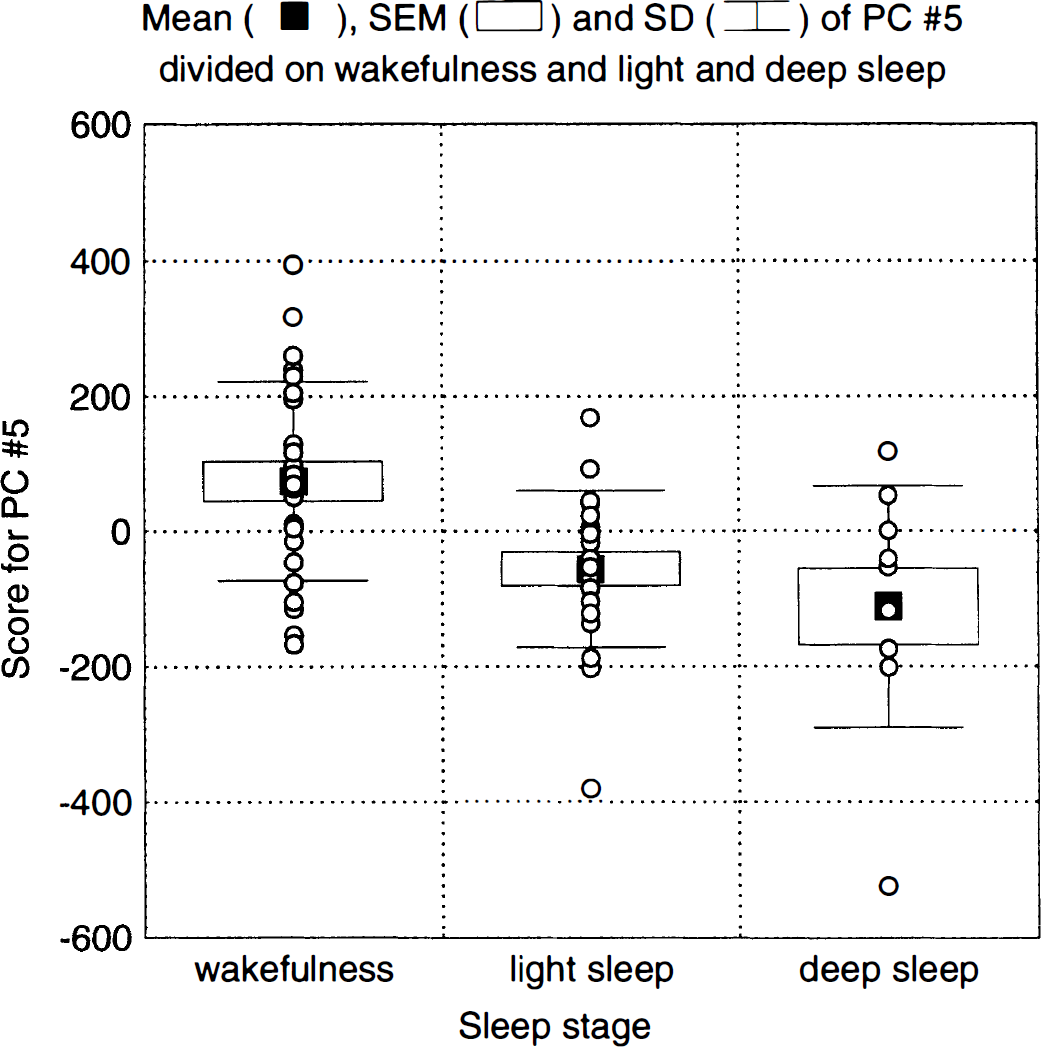
Scores for principal component (PC) 5 divided into wakefulness and light and deep sleep.
Principal component 5. Principal component 5, explaining 4.6% of the variance, is the second of the two that correlated significantly to sleep (F1,18 = 19.13, P = 0.0004). The eigenimages (Fig. 8) show decreases during sleep for the thalamus and for a structure that coincides with the transversal and inferior sagittal sinus. The scores reveal a high correlation to sleep (Fig. 7) and larger effects for deep than for light sleep. There was a significant subject-by-task interaction (P = 0.0035) for this PC, indicating large intersubject differences in sleep-related changes in the implicated structures.
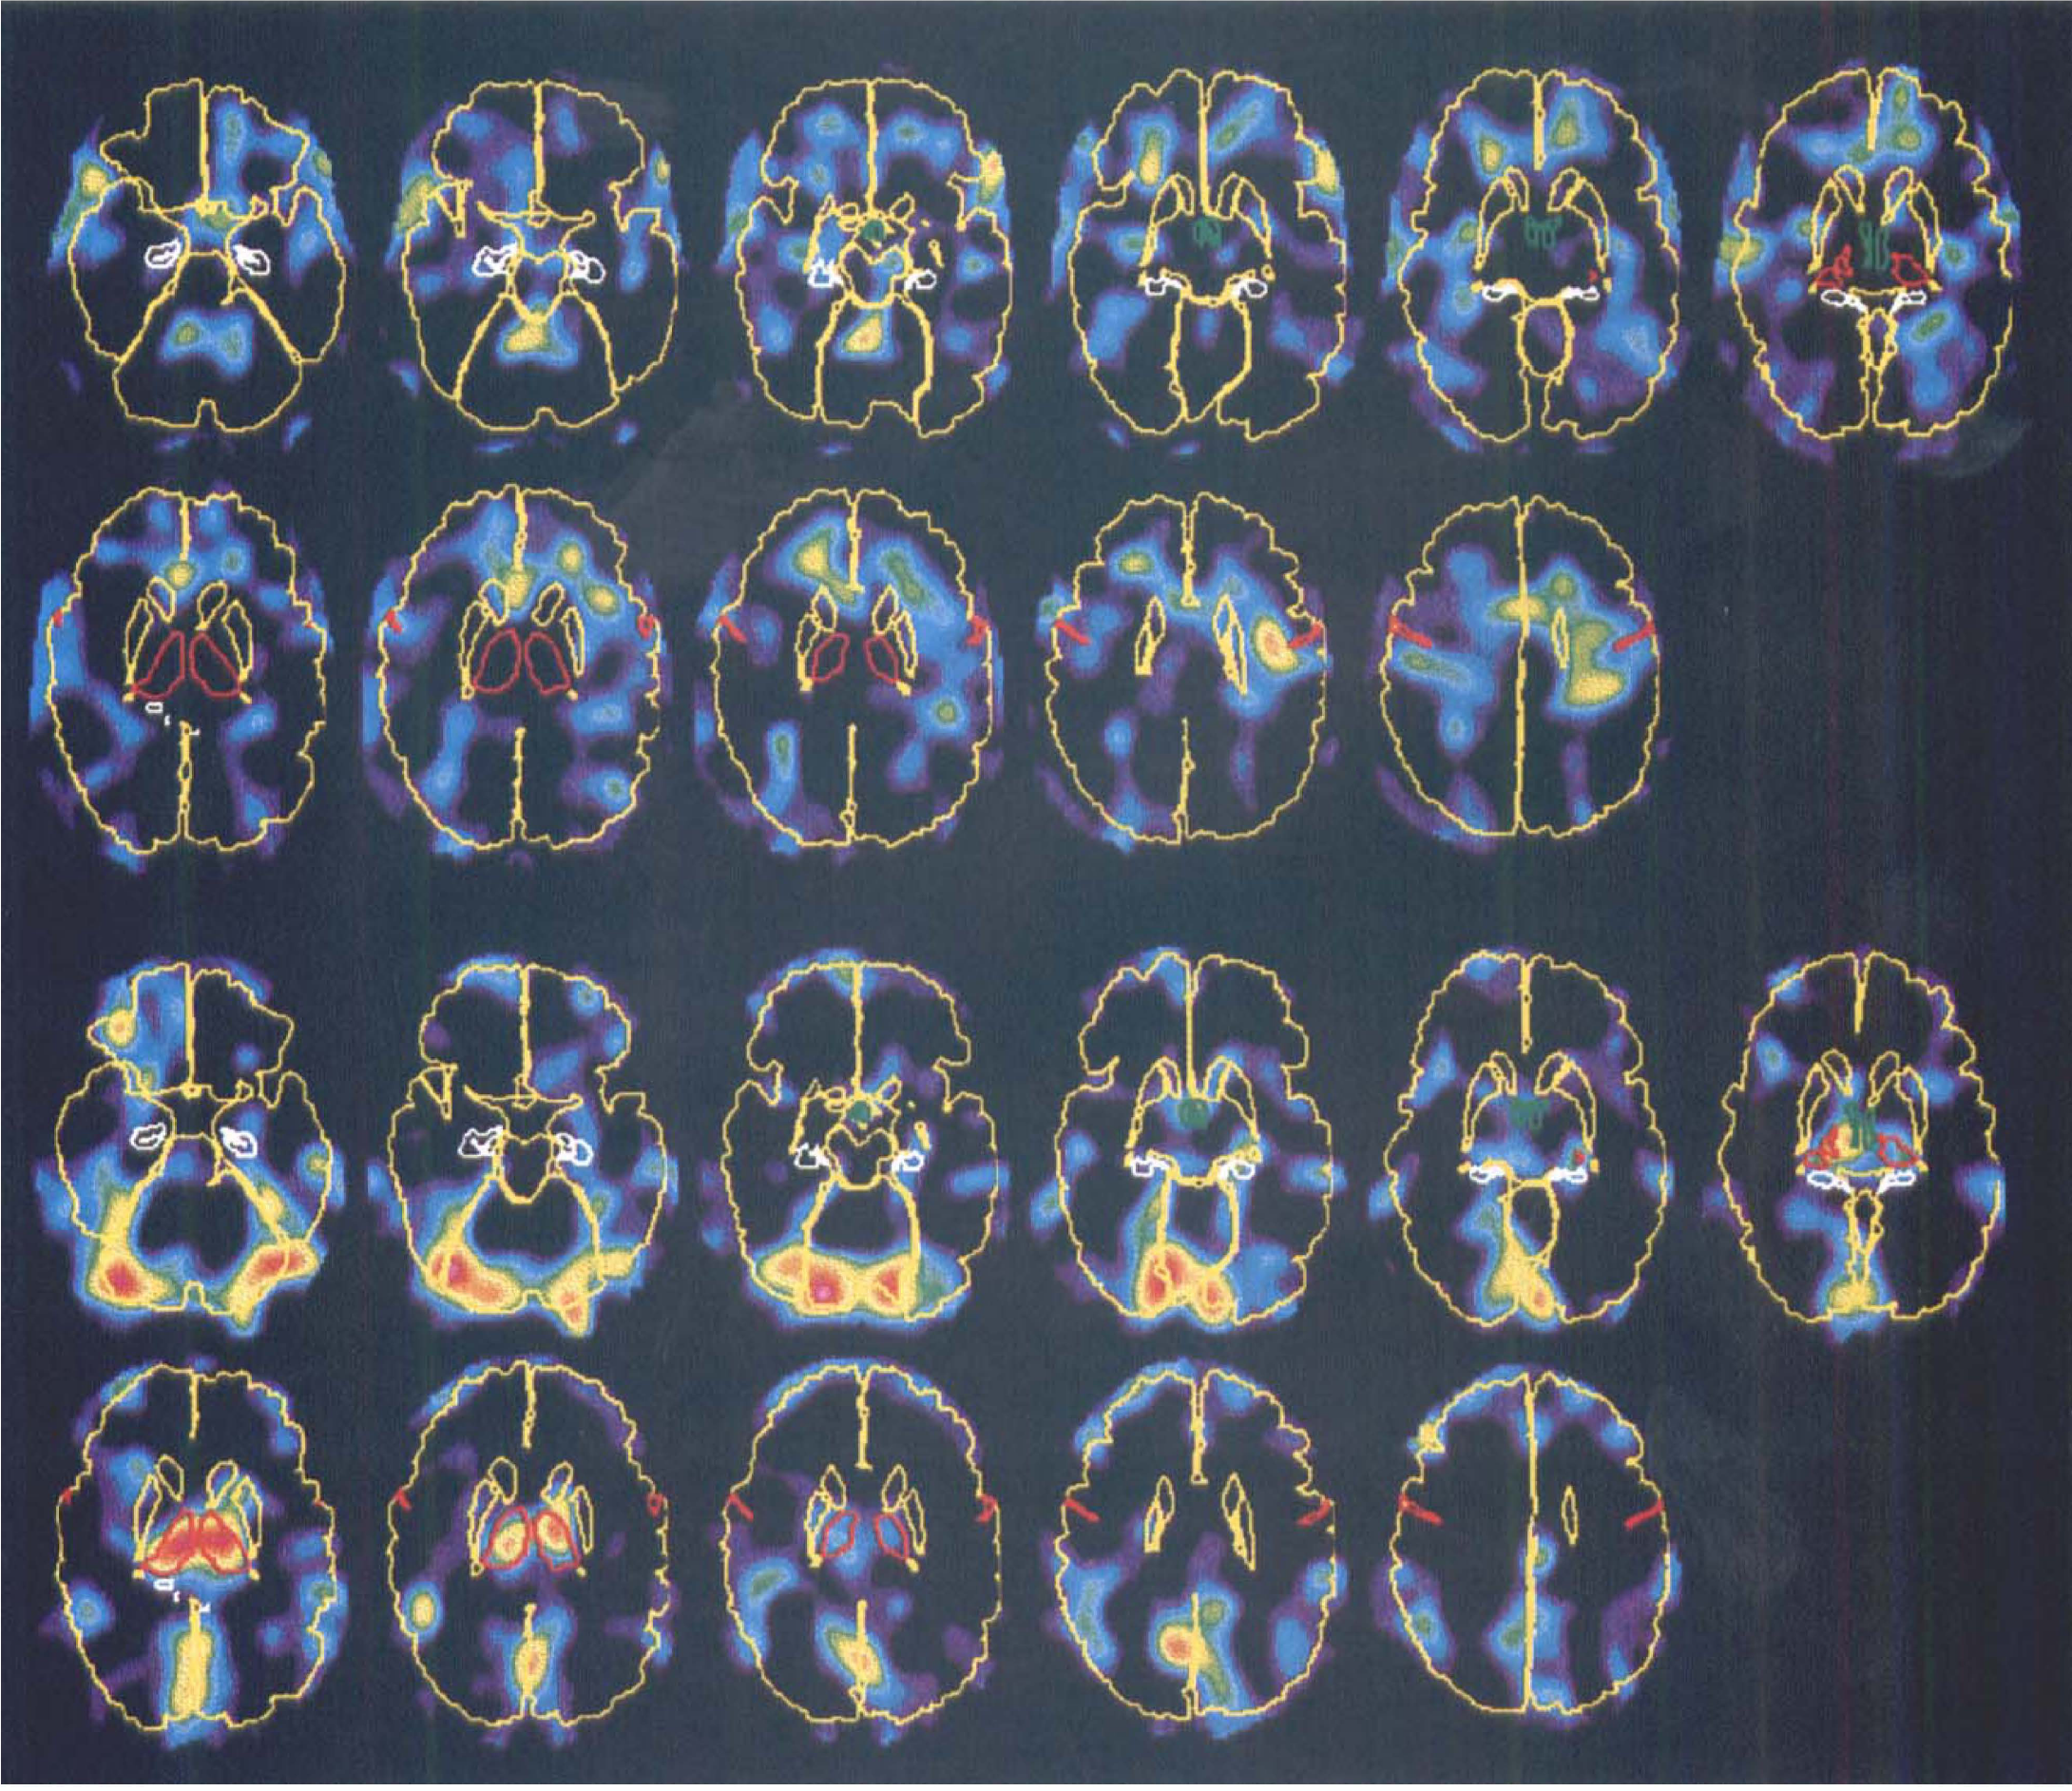
Eigenimages for principal component (PC) 5 showing areas of increased (upper two rows) and decreased (lower two rows) flow during sleep compared with wakefulness. Both sets of images are mapped into the same, arbitrary color scale. To facilitate the anatomic orientation, the brain surface, caudate, and putamen are shown in yellow, the thalamus and central sulcus in red, hippocampus in white, and hypothalamus in green. The images are viewed from below so that the right of the images correspond to the left of the brain.
General. It seems that the PC analysis has revealed two distinct systems, one consisting of cerebellar structures and large areas of association cortex and another consisting of the thalamus. In Fig. 9, the scores for PC 5 have been plotted versus those for PC 2, divided on wakefulness and light and deep sleep. Data fall into diagonal bands with a fairly good separation between the three states. The subjects fall into categories where the cerebellar-cortical system is affected in some subjects (e.g., js and nh), the thalamic system in some (e.g., jc and pl), both systems in some (e.g., rj and nd), and none of them in others (e.g., cl and mb).
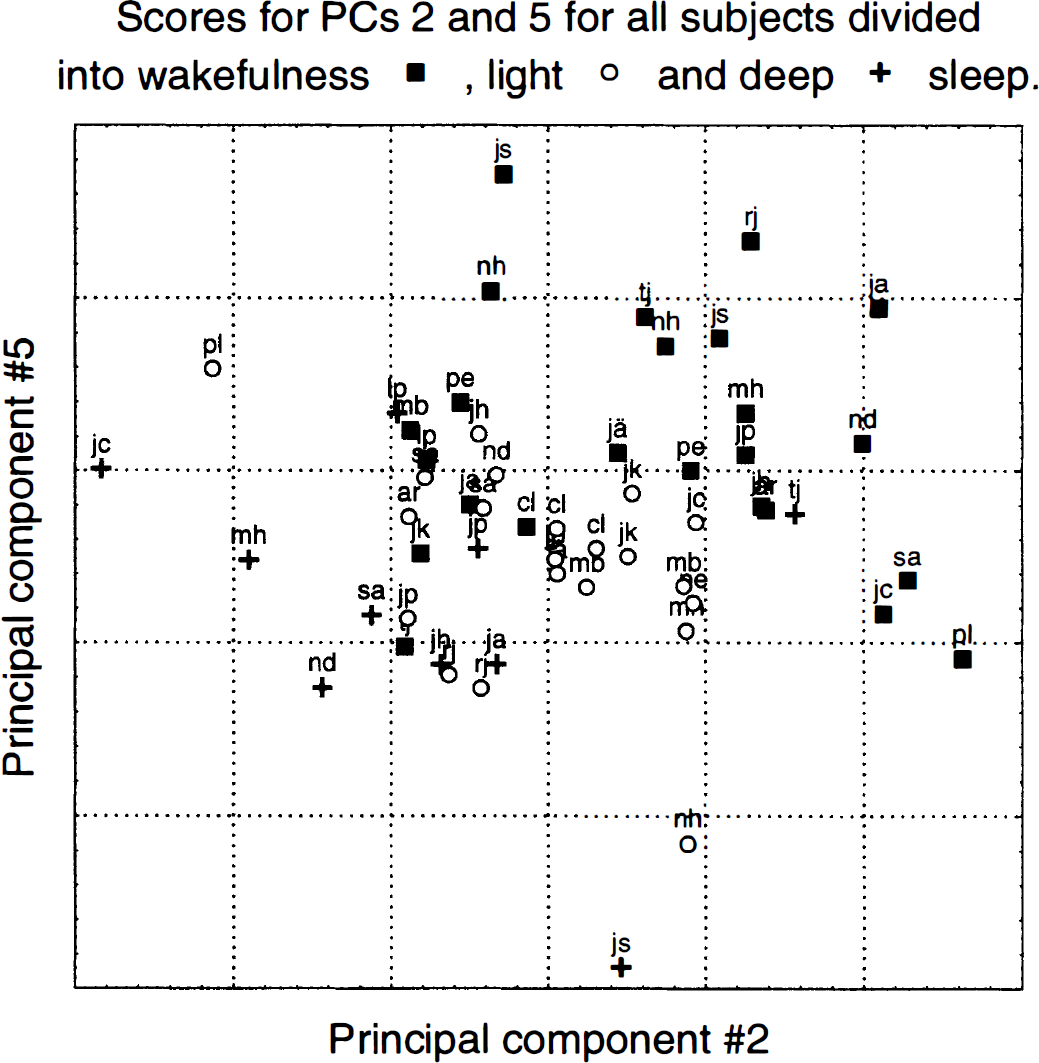
Scores for principal component (PC) 5 versus scores for PC 2 divided into wakefulness and light and deep sleep for all subjects and scans. Each point represents one scan, and the subject and state associated with it are denoted with the initials and marker type, respectively. Note the good separation between the states that is achieved with only two dimensions remaining of the original 50,000. Note also how in some subjects (e.g., jc and pl) only the network identified by eigenimage 2 is affected, in some subjects (e.g., js and nh) only the network identified by eigenimage 5 is affected, whereas in others (e.g., nd and rj) both networks are involved.
DISCUSSION
General
The present study, along with other recently reported studies (Maquet et al., 1997; Braun et al., 1997), demonstrates the feasibility of using PET to map regional CBF during sleep. It has been noted that single photon emission computed tomography CBF markers, such as 99mTc-dl-hexamethyl-propyleneamine (99mTc-HMPAO), where the compound may be injected during the condition of interest and the scanning performed afterward, are an advantage when studying processes such as sleep (Madsen et al, 1991c) or migraine (Friberg, 1991) that may not readily be produced on command. However, we were able to obtain data from 19 subjects who were only lightly sleep deprived and still managed to fall asleep under the somewhat awkward conditions that are offered on the couch of a PET scanner.
Because subjects are able to sleep in the scanner, the high sensitivity of PET and the short duration and high repetition rate of H215O scans are highly desirable traits. The high sensitivity of the PET technique in comparison to that of single photon emission computed tomography enables multiple injections in healthy volunteers. The short duration of scans increases the possibility to obtain data during a well-defined state, and the high repetition rate makes it feasible to obtain data during several stages and over a wide range of delta scores in each subject, which facilitates statistical analysis.
In the present study, the EEG signal was monitored continuously for signs of a specific stage of sleep, and when detected, production of H215O commenced, followed approximately 5 minutes later by injection. This design caused relatively long periods of inactivity, waiting for the appropriate sleep stage, and still did not result in a balanced design because sleep depth frequently changed during the 5-minute delay. From this experience, a better strategy for future studies would be to perform two injections during wakefulness, wait for onset of sleep, and perform injections at 10-minute intervals until the subject awakes or until the permitted radiation dose is exhausted.
Validity of flow as marker of neuronal activity during sleep
Cerebral blood flow has been used as a marker for neuronal activity since the initial discoveries in the previous century (Roy and Sherrington, 1890), and a substantial number of activation studies using this principle have been performed during the last 10 years. The underlying idea is that the mean firing rate of the neurons increase in an area involved in a given process, and that the blood flow to that area increases in approximate proportion to the firing rate. If we define “involvement” in sleep processes as a transition from relay mode to burst mode (defined by regular bursts of firing with no activity between bursts, Steriade et al., 1990) firing, with a resulting synchronization of the cortical EEG signal, there are strong indications that the mean firing rate actually decreases (Steriade and Hobson, 1976), albeit not very much. Hence, there is a reason to assume that a region “involved” in sleep would exhibit decreased, rather than increased, flow.
Further support for this assumption may be obtained from extrapolation of data where there are strong indications that global metabolism and perfusion decrease as a result of sleep (Madsen et al., 1991a; Madsen et al., 1991b). Furthermore, studies unrelated to sleep have indicated that both oxidative metabolism and perfusion are related to resting-state EEG such that a lower mean EEG frequency was associated with lower hemisphere cerebral metallic rate for oxygen (CMRO2) and CBF (Ingvar et al., 1965; Ingvar et al., 1976).
However, the picture is complicated by indications that CBF is determined not only by sleep stage, and hence EEG frequency, but that it also is correlated to time since onset of sleep (Ryan et al., 1989; Hajak et al, 1994; Klinglhöfer et al., 1995) and by indications of a decoupling of flow and metabolism during sleep (Hoshi et al., 1994).
Despite that, in the remainder of this discussion, local blood flow will be discussed as if a decrease in flow indicates an increased synchronization, and hence, an involvement in sleep-related processes.
Global flow
In contrast to many (Townsend et al., 1973; Sakai et al., 1980; Madsen et al., 1991a; Madsen et al., 1991b; Boyle et al., 1994, Braun et al., 1997) but in accordance with others (Reivich et al., 1968; Lenzi et al., 1987; Balkin et al., 1991; Onoe et al., 1991), we did not encounter any global decrease in CBF during either light or deep sleep. Although in some of these studies (Madsen et al., 1991a) significant reductions of CBF were not found per se, but rather increased Pa
The reason for our negative findings is not completely clear, especially because there is not even a trend toward decreased flow. A large experimental error due to technical factors might be an explanation, but the spread in CBF values during wakefulness is no larger in this study than in others (Madsen et al., 1991a; Madsen et al., 1991b). Furthermore, the increased spread during sleep conditions compared with wakefulness in the present study may hardly be attributed to technical factors. Findings that B-waves (waves of intracranial pressure changes) are more abundant during stage II and REM sleep than during wakefulness (Droste et al., 1993) and that short-term variations in middle cerebral artery velocity are larger during sleep than wakefulness (Bode and Puglia, 1992), albeit in children, indicate that this may be a valid observation.
Local flow
Methodologic aspects. Both the subtraction analysis and the regression versus delta score revealed left—right symmetrical decreases in cortical, thalamic, and possibly hippocampal regions. Although only a few separate clusters within this pattern of widespread cortical changes reached statistical significance, the pattern as a whole was highly significant. This may be attributed to the relative insensitivity of the cluster approach (Friston et al. 1994) to nonfocal changes, whereas a recently developed method for testing of diffuse and widespread changes indicated highly significant changes (Worsley et al., 1995). Furthermore, the observed pattern with a high degree of left—right symmetry is unlikely to occur by chance only, a factor that is not taken into account by any published methods to test for significance.
The observed increases along the ventricular system are likely to be artifacts of the global scaling. When performing the scaling, it is assumed implicitly that local changes are independent of global changes. This is never completely true, but in the case of focal changes serves as a useful approximation. When changes are more widespread, as in the present case, a bias in the opposite direction will be introduced in areas changing in the opposite direction or not at all (Strother et al., 1996).
The differences compared with the PC analysis, where the changes in the thalamus and in the cerebellum are considerably more prominent, are explained by the eigenimage structure of the first PC identifying a system with large variability in, among others, the thalamus and the cerebellum. The subtraction analysis partitions the variance in only three ways: that explained by experimental design (wakefulness vs. sleep), that explained by subject differences, and that explained by residual error. Thus, because the scores of PC 1 do not correlate to sleep, a majority of its variance will be assigned to residual error, thereby reducing the ratio between experimental variance and residual error in those areas.
Principal component analysis of the adjusted voxel—voxel covariance matrix has been suggested as a means of detecting functional connectivity in the brain based on the covariance of perfusion changes in areas distributed throughout the brain (Friston et al., 1993). The interpretation in terms of functional connectivity may be questioned when the analysis is applied to data containing state-dependent changes (e.g., wakefulness vs. sleep) because different areas in the brain might correlate independently to the state without necessarily being connected to one another. The following, rather drastic, hypothetical example might serve to illustrate that concern. Consider performing a visual stimulation of the entire visual field in a subject in whom the corpus callosum and the optic chiasm have been cut. A PC analysis (of the type we have performed) of the resulting data then would indicate a strong functional connectivity between the visual cortices of the two hemispheres, which obviously is not correct.
However, our main finding is quite the opposite. We have obtained two distinct sets of eigenimages that both correlate to the task, but not to each other. Considering then the methods bias toward finding incidental functional connectivity when applied to data containing state-dependent changes, our finding must be considered a strong indication of an actual decoupling between the processes occurring 1) in the cerebellum and the association cortices and 2) in the thalamus.
Previous indications of non-REM sleep as a multidimensional process come from principal component analysis of multichannel magnetoencephalogram recordings during sleep, where several (4-6) sources often were needed to explain the recorded pattern of spindle activity (Lu et al., 1992). When discussing functional connectivity, the time scale of the measurements must be considered. Sources that are distinct on a millisecond time scale may not be so on the PET time scale of tens of seconds, where all cortical changes were attributed to the same PC.
Although the functional separation between the thalamus and the association cortices indicated by the PC analysis is hard to understand in view of the prevailing theories on sleep (see the following section), our results still indicate that multivariate techniques are highly valuable in neuroimaging studies of processes that are not easily and completely isolated by the experimental setup.
Physiologic aspects. Many neuroimaging studies both in animals (Ramm and Frost, 1983; Ramm and Frost, 1986) and humans (Buchsbaum et al., 1989; Maquet et al., 1990; Balkin et al., 1991, Maquet et al., 1997; Braun et al., 1997) indicate the thalamus to be of consequence in the sleep process. Furthermore, a wealth of experimental evidence implicates the thalamus as a site of rhythmic activity in the brain (Andersen and Andersson 1968; Steriade et al., 1990) and as an important structure for the generation of sleep (Akert et al., 1952). The thalamic spindle activity is relayed via the thalamocortical projections and faithfully reproduced at corresponding cortical sites (Andersen et al., 1967). Although the resolution of the PET technique is such that no specific thalamic nuclei could be implicated in the present study, studies of patients with fatal familial insomnia indicate that the insomnia correlates strongly to destruction of the anterior ventral and the dorsomedial thalamus (Lugaresi et al., 1986; Manetto et al. 1992). Furthermore, the use of glucose by dorsomedial thalamic nuclei has been shown to correlate negatively with slow wave sleep in cats (Ramm and Frost, 1986).
Although the anterior ventral thalamus projects mainly to the premotor cortex, which was outside the field of view in the present study, the dorsomedial thalamus is known to project to the prefrontal cortex (Kelly, 1991), which also was implicated strongly in the present study. Other evidence for the role of the prefrontal cortex in sleep comes from reports on the topography of the generation of sleep spindles, indicating frontal areas as one prominent source (Jobert et al., 1992; Broughton and Hasan, 1995). In both of these studies (Jobert et al., 1992; Broughton and Hasan, 1995), an additional source was located in the parietal cortex which is also in agreement with our findings.
Observations that psychological functions associated with the frontal lobes are more affected by sleep deprivation than mere motor skills or reaction times (Home, 1988) also would be in accordance with our findings. Well-known adverse effects of sleep deprivation, such as speech impediments, degradation of short-term memory, and social capabilities, all are known to be served by the frontal lobes (Petersen et al., 1988; Fletcher et al., 1997; Damasio et al., 1994). The parietal cortex often is lumped with the frontal cortex as “association cortex” (Kupfermann, 1991), and together they are believed to be responsible for the integration of multimodal sensory input and for higher cognitive functions. Hence, data would support an interpretation of sleep as an electrical rest period for these areas, associated with a reduced metabolic demand, and possibly also with an elevated protein synthesis (Adam and Oswald, 1977).
Maquet et al. (1997) discussed the relevance of sleep for frontal lobe functions in a similar manner, although they found only decreased flow in orbitofrontal areas and not in the entire frontal and parietal lobes, as in the present study. However, from their description, it would appear that they have subtracted a mixture of scans obtained during wakefulness and REM sleep from those obtained during slow-wave sleep, thereby confounding the effects of REM and slow-wave sleep. We would propose this different choice of contrast as a tentative explanation for these differences.
The perfusion changes in frontal and parietal areas during slow-wave sleep reported by Braun et al. (1997) correspond well with our findings. Additional points of convergence are the decreases in the thalamus, the invariance in primary sensory areas, and the increases in the cerebellar vermis, which may correspond to the increases we observe in the eigenimages for the second PC. However, in addition, those authors found large decreases throughout the basal ganglia, changes that we did not observe. Their study was conducted and results analyzed in a manner similar to the present study, and it would seem that the main difference between the studies was the considerably more severe sleep deprivation employed by them. Their non-REM sleep consisted only of stages III and IV and was preceded by 2 days of REM sleep deprivation and 1 day of total sleep deprivation. In contrast, our data contain a mixture of sleep stages I through IV, with the majority of scans being in stages I and II.
Another interesting finding is the “graded response” evident in Figs. 5 and 7, where, in terms of its effects on perfusion, deep sleep seems to affect the same regions as light sleep, albeit to a higher degree. Previous studies have shown that the relation of deep sleep to light sleep increases after sleep deprivation and that people who habitually sleep fewer hours than average exhibit a larger proportion of deep sleep than subjects who sleep longer hours (Benoit et al., 1980). Together these findings indicate that light sleep is qualitatively the same but quantitatively less efficient compared with deep sleep.
In a review by Steriade and Hobson (1976), it was shown that the mean firing rate of almost all areas of the brain examined with single-unit recordings exhibited a decreased rate during synchronized sleep compared with wakefulness. However, of all the areas tabulated, the ones that exhibited the largest changes were the parietal association cortex and the lateral ventral (situated next to the anterior ventral) part of the thalamus, as reported by Desiraju (1972) and Lamarre et al. (1971), respectively. Except for the frontal cortex, which was not included in that review, this coincides well with the findings in the present study.
The role of the afferent input from sensory cortical areas, irrespective of modality, to the thalamus seems to be to desynchronize the thalamic activity (Andersson and Wolpow, 1964; Steriade et al., 1987). With this in mind, note that the primary and secondary sensory areas do not change between wakefulness and sleep, indicating no further downregulation beyond that achieved by the sensory deprivation (closed eyes, dark and quiet room) employed for the scanning. Reports that processing of external stimuli beyond that of the primary areas continue during sleep (Nielsen-Bohlman et al., 1991; Bastuji et al., 1995) lend further support to this. Hence, data may be interpreted such that primary and secondary processing of external events still occurs during synchronized sleep, but that the information never reaches consciousness because of the burst mode state of the frontal and parietal association cortices.
Why do we encounter the thalamus on one hand and the association cortices and the cerebellum on the other hand in different principal components, indicating that these systems are not functionally connected (Friston et al., 1993)? Clearly there is a functional coupling between the thalamus and the cortex during sleep; the present data simply suggest that there is a functional decoupling of the processes that is detected as a decreased blood flow. Hence, a possible explanation would be that the slow-wave activity, being at least partially of cortical origin, is picked up mainly by the second PC, and that the thalamic spindle activity is accounted for mainly by the fifth PC. Support for a cortical origin of the slow-wave oscillations comes from reports of slow-wave activity in cortical areas deprived of thalamic input (Henry, 1949) and slow-wave activity in the cortex of athalamic animals (Villablanca, 1974). From this perspective, the presence of a subject by task interaction for the fifth PC could be explained by the very slow (0.1–0.2 Hz) component in the occurrence of the sleep spindles (Steriade et al., 1990). It has been demonstrated that H215O PET data are highly sensitive to the timing of stimulation in relation to the injection of tracer (Silbersweig et al., 1994). Thus, the exact timing of the occurrence of a sleep spindle, lasting for 1 to 2 seconds, in relation to the injection of tracer may determine to which extent it may be detected in the resulting images. Unfortunately, the accuracy of the synchronization of our EEG signal in relation to the injection of tracer does not permit us to test this hypothesis on our data.
If the interpretation that the changes detected by the second and fifth PC are related to delta and spindle activity, respectively, is correct, why are they found in areas known to be heavily connected? One possible explanation would be that spindle activity transmitted from the thalamus to the frontal and parietal cortices triggers the cortical sources of delta activity. This explanation, however, must be considered as highly speculative, and our finding of two independent sleep-related networks would need to be confirmed in an additional material.
CONCLUSION
Our data indicate two systems relating to synchronized sleep—one consisting of the cerebellum and large areas of prefrontal and parietal association cortex, and one consisting of the thalamus—that are functionally disconnected on the time scale of the PET studies. For a given subject, one or both of these systems may be affected during slow-wave sleep.