
Abstract
We describe the implementation and validation of a combined dynamic–autoradiographic approach for measuring the regional cerebral blood flow (rCBF) with 15O-butanol. From arterial blood data sampled at a rate of 1 s and list mode data of the cerebral radioactivity accumulated over 100 s, the time shift between blood and tissue curves, the dispersion constant DC, the partition coefficient p, and the CBF were estimated by least squares fitting. Using the fit results, a pixel-by-pixel parametrization of rCBF was computed for a single 40-s (autoradiographic) 15O-butanol uptake image. The mean global CBF found in 27 healthy subjects was 49 ± 8 ml 100 g−1 min−1. Gray and white matter rCBF were 83 ± 20 and 16 ± 3 ml 100 g−1 min−1, respectively, with a corresponding partition coefficient p of 0.77 ± 0.18 and 0.77 ± 0.29 ml/g in both compartments. The quantitative images resulted in a significantly higher gray matter rCBF than the autoradiographic images.
Butanol is freely diffusible across the blood–brain barrier (Raichle et al., 1976; Schaefer et al., 1976; van Uitert et al., 1981; Dischino et al., 1983) and has been found suitable for measuring rCBF with positron emission tomography (PET) after labeling with 11C or 15O (Herscovitch et al., 1987; Berridge et al., 1990; Berridge et al., 1991). Due to its complete extraction, 15O-butanol should yield a favorable signal, particularly in areas with high rCBF (Quarles et al., 1993).
Here we describe the implementation and validation of an approach for quantitation of rCBF using 15O-butanol, which combines the tracer dynamics in blood and cerebral tissue and a single autoradiographic uptake scan. We will demonstrate that this approach yields quantitative rCBF images that are suitable for neurophysiological activation studies.
MATERIALS AND METHODS
Subject Preparations
Twenty-seven normal subjects (20 men, 7 women, 26.4 ± 3.6 years) were enrolled in this study approved by the ethical commitee of the Heinrich-Heine-University Düsseldorf. Informed consent was given by each subject.
Prior to the examination, venous and arterial catheters were inserted. The subjects' eyes were patched. The scanner room was totally quiet.
rCBF Measurements
On each subject, six measurements were performed, each 15 min apart, after intravenous bolus injection of ∼1,500 MBq 15O-butanol automatically prepared as described previously (Crouzel et al., 1993; Herzog et al., 1994). The first and last scans in each subject were acquired during resting wakefulness. During the other scans, different stimuli were applied, which are not detailed here.
Using the camera PC4096–15WB (Rota Kops et al., 1990), emission data were acquired in list mode for 3 min postinjection. Simultaneously, arterial blood was continuously measured at 1-s intervals using an automatic measurement system (Eriksson et al., 1980) cross-calibrated to the PET camera. The list mode data was framed (a) into 90 sequential frames of 2 s each for two planes at the level of the basal ganglia and the centrum semiovale and (b) into a single (autoradiographic) frame of 40 s starting at the tracer's entry into the brain comprising all 15 image planes. Using measured attenuation correction, the emission data were reconstructed with filtered backprojection [image resolution = 9 mm (full width half maximum)].
In each subject, the rCBF was adjusted to the Pco2 of the first scan by linear scaling applying a relative change of rCBF of 4% per 1 mm Hg of change in Pco2 (Zijlstra, 1981). The exact procedure is detailed elsewhere (Seitz and Roland, 1992).
Data Analysis
Decay-corrected time-activity curves of 15O-butanol were calculated at the level of the basal ganglia for three regions of interest (ROI): an ROI comprising the whole brain slice and considered as representative for whole brain (WB); all areas above 50% of the image maximum, including the cortical ribbon with adjacent white matter, thus representing mixed tissue (MT); two areas bilateral in the temporal operculum at a 60% isocontour level regarded as representative for pure gray matter (GM). In addition, an ROI at the level of semiovale center was drawn manually representing white matter (WM). The average data given in the following are taken from all examinations. The stimuli applied in the 27 subjects had no primary activation center in those planes where the WB-, MT-, and GM-ROIs were defined.
Model
The kinetics of the freely diffusible 15O-butanol can be described by the single-compartment model as introduced by Kety (1960) and Kety and Schmidt (1948) and the equation:
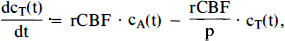
with the tissue activity concentration cT, the arterial blood activity cA, and the partition coefficient p between tissue and blood.
The solution of this equation yields:

with k = rCBF/p. cT is directly accessible by the dynamic PET measurement (cTm). Compared to the input function cA in the carotid arteries, cAm as measured by the blood measurement system is dispersed and time-delayed (Greitz, 1956; Iida et al, 1986, 1989). The dispersion can be modeled by a convolution with the function exp(−t/DC) (Kanno et al., 1987; Meyer, 1989), with DC as dispersion constant. To correct for dispersion and delay t, cA is substituted:

where the right-hand side is the inversion of the convolution with the exponential function.
The model approach tested here for 15O-butanol combines Eqs. 2 and 3 as follows: A nonlinear regression method (Marquardt, 1963) fitted cT of Eq. 2 to cTm with rCBF, p, and t as fit parameters. DC was used as fixed, and the fitting was repeated for different DC. That fit was considered as optimum, which yielded the minimum absolute summed squared discrepancy between cT and cTm. The fitting of the tissue curves comprised a period of 100 s after tracer injection, in this way avoiding contamination with metabolites of 15O-butanol (Pawlik et al., 1993). The fitting procedure was performed for the time-activity curves for WB, WM, MT, and GM.
The autoradiographic uptake image of 15O-butanol recorded from T1 to T2 is related to rCBF, p, and cA by
as shown previously (Herscovitch et al., 1983; Raichle et al., 1983). This equation was used by Herscovitch et al. (1983), with a fixed p and not considering dispersion and delay. In our approach, the measured cA curve was corrected for dispersion and delay as found by fitting the tissue curve of the MT-ROI. Then a look-up table was constructed: cT(T1, T2) was calculated for rCBF values of 0–300 ml 100 g−1 min−1 in steps of 0.5 ml 100 g−1 min−1 applying the fitted p found for the MT-ROI. The use of this ROI mainly comprising cortical tissue is justified, because the cortex is the area of neuronal activation, and the evaluation of this region provided less variance than that of the GM-ROI (Fig. 1). Using the look-up table, the 40-s 15O-butanol uptake images were converted pixel-by-pixel into quantitative images of rCBF.
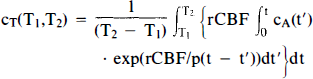
Measured decay-corrected (straight lines) and fitted (dotted lines) time–activity curves of 15O-butanol in the ROIs of whole brain (WB), mixed tissue (MT), gray matter (GM), and white matter (WM).
RESULTS
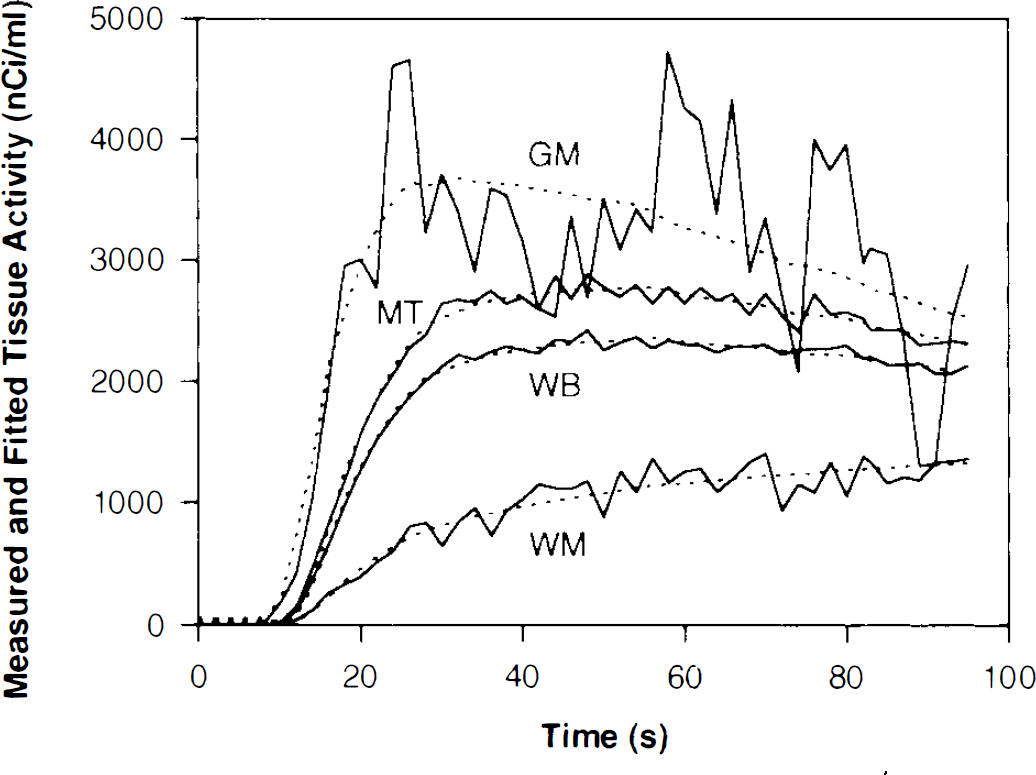
Using Eqs. 2 and 3, satisfying fits were obtained for measured tissue curves of 15O-butanol in the different regions (Fig. 1). The values of rCBF, p, DC, and t that resulted from the fitting procedure are summarized in Table 1. The mean p found in GM and WM were virtually identical at ∼0.77 ml/g, whereas in heterogenous ROIs, including gray and white matter, a lower p was found, e.g., only 0.63 ± 0.11 ml/g for WB. When quantitative rCBF images were calculated using a p of 0.77 ml/g, a mean rCBF of 86 ± 17 ml 100 g−1 min−1 was obtained for GM and of 16 ± 3 ml 100 g−1 min−1 for WM.
Results of dynamic fitting analysis of time-activity curves in different cerebral ROIs obtained in 27 subjects with six measurements each a
WB, whole brain slice at the level of the basal ganglia; WM, a white matter ROI in a plane at the level of semiovale center; MT, a mixed tissue ROI at an isocontour level of 50% in the plane of the basal ganglia including the cortical ribbon and adjacent white matter; GM, a bilateral ROI with an isocontour level of 60% in the temporal opercular cortex representing gray matter; rCBF, regional cerebral blood flow; p, partition coefficient; DC, constant for dispersion correction (according to Eq. 3); Δt, time shift between tissue and blood curves.
The sensitivity of fitted rCBF and p in respect to errors of DC was tested by the variation of DC in a range ± 1 s around the optimimum DC using six data of different individuals. The mean change of rCBF was up to −10% and that of p up to 43%, when DC was offset by 1 s (Fig. 2A). Similarly, variations of rCBF and DC were examined when p deviated from the fitted p. The errors of rCBF and DC were in opposite direction. An underestimation of p by −0.2 ml/g resulted in an underestimation of rCBF by 15% and an overestimation of DC by 35%. rCBF was altered by up to +25% and DC by −17%, when p was offset by +0.2 ml/g (Fig. 2B).
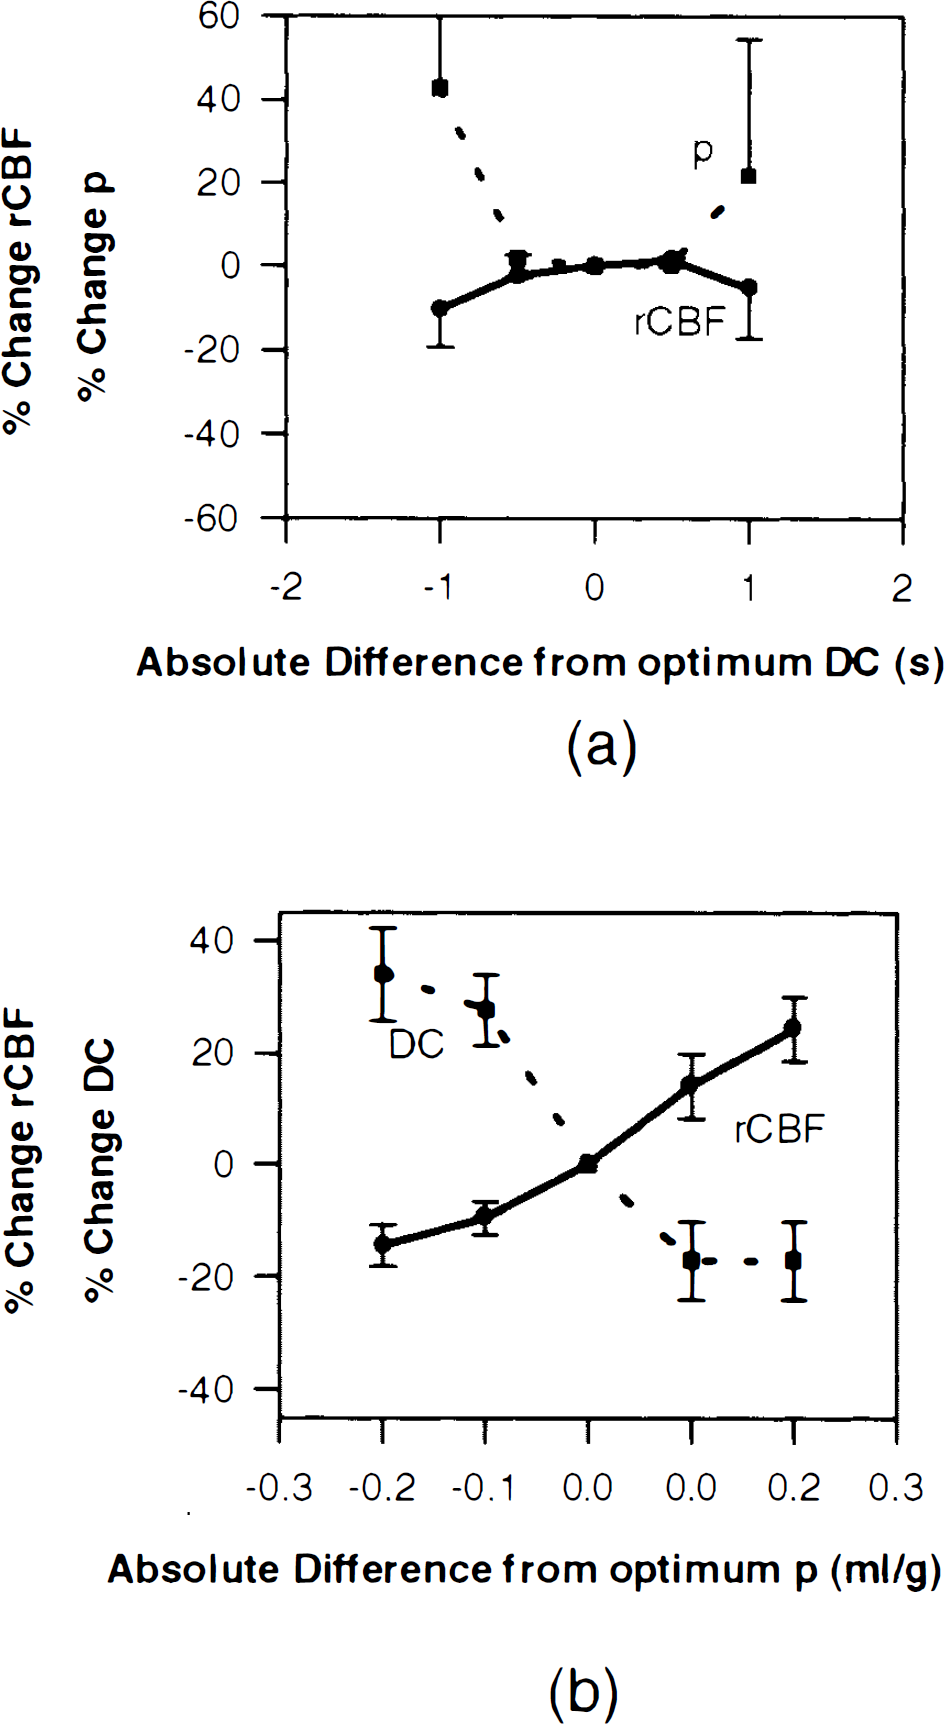
Changes of fitted rCBF and p or DC, relative to their values for the optimum fit, when DC (
Table 2 compares gray matter rCBF, resulting in quantitative rCBF images with those in autoradiographic uptake images in which the average whole brain radioactivity was set to a global flow value of 50 ml 100 g−1 min−1 (Lassen, 1985). The quantitation produces higher signals than autoradiographic images in the well-perfused gray matter; e.g., the mean rCBF in the gray matter ROI was 29% higher in the quantitative images compared to the autoradiographic images. On the other hand, the variance of the resulting rCBF is increased.
Comparison of autoradiographic and quantitative rCBF data
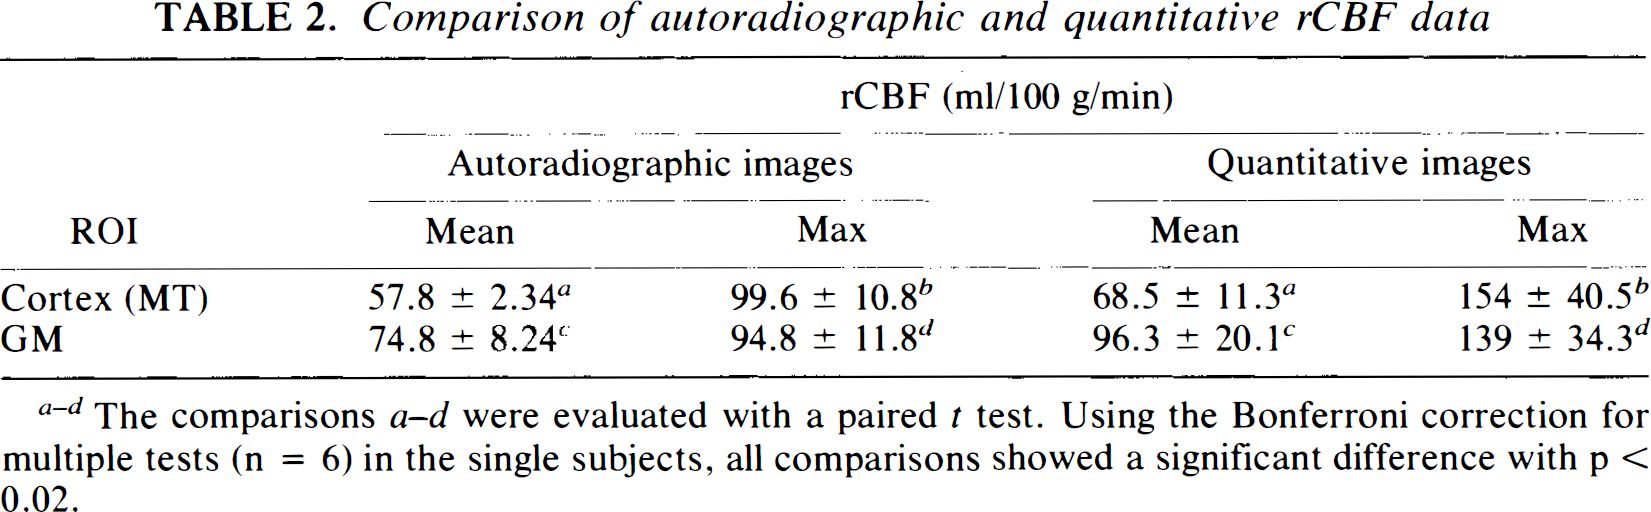
The comparisons a–d were evaluated with a paired t test. Using the Bonferroni correction for multiple tests (n = 6) in the single subjects, all comparisons showed a significant difference with p < 0.02.
DISCUSSION
Our approach for quantitation of rCBF with 15O-butanol combines the advantages of kinetic parameter estimation with the computationally easy and fast autoradiographic imaging technique.
The kinetic analysis taking into account the individual time shift and dispersion provided a global brain CBF of 49 ± 8 ml 100 g−1 min−1, which agrees with values found by others (for example, see Lassen 1985; Berridge et al., 1991). The ratio of gray matter rCBF (83 ± 20 ml 100 g−1 min−1) and white matter rCBF (16 ± 3 ml 100 g−1 min−1) was 5.04:1, exceeding former estimations using H215O (Frackowiak et al, 1980; Baron et al., 1981; Lenzi et al., 1981; Kanno et al., 1987), but being consistent with recent data reported by Berridge et al. (1991) for 15O-butanol and Lammertsma et al. (1992) for H215O. The gray/white matter ratio obtained in our study is still <5.7:1, which results from a rCBF of 131 ml 100 g−1 min−1 in gray matter and 23 ml 100 g−1 min−1 in white matter measured with 131I-labeled CF3I in concious rats (Sokoloff, 1961).
Our average p found in GM and WM were practically identical, being 0.77 ml/g. The same values were obtained by Gjedde et al. (1980) in rats. The lower values found in mixed tissue can be explained by the effect of applying a single compartment model to heterogenous tissue (Iida et al., 1989; Lammertsma et al., 1990; Herzog et al., 1993).
Greater signals of gray matter rCBF were found in quantitative rCBF images compared to autoradiographic uptake images scaled linearly to a whole brain activity of 50 ml 100 g−1 min−1 (Table 2). This is of considerable importance for neurophysiological activation studies, as a better delineation of activated areas could be expected in quantitative rCBF images. We observed that, in spite of the increased variance of the rCBF data in the quantitative rCBF images (Table 2), the specifically activated cortical and subcortical areas were significant in quantitated images, whereas they failed in autoradiographic images. For example, simple finger flexion movements were not found by t-map analysis using autoradiographic image data (Seitz et al., 1993), whereas the quantitated images of the same experiment rendered significant activation areas in the contralateral motor cortex, frontomesial cortex, and ipsilateral cerebellum (Seitz et al., 1995).
Footnotes
Acknowledgment:
We thank W. Hamkens for routine production of 15O-butanol and C. Tarras and E. Theelen for their technical assistance during the studies. We appreciate the help of Dr. S. M. Qaim in preparing the manuscript of this article. This study was supported by the Deutsche Forschungsgemeinschaft (DFG), SFB 194.