
Abstract
The central nervous system (CNS) evokes a complex inflammatory response to injury. Inflammatory cascades are present in traumatic, infectious, and noninfectious disorders affecting the brain. It contains a mixture of pro- and anti-inflammatory reactions involving well-known proteins, but also numerous proteins less explored in these processes. The aim of this study was to explore the distinct inflammatory response in traumatic brain injury (TBI) compared with other CNS injuries by utilization of mass-spectrometry. In total, 46 patients had their cerebrospinal fluid (CSF) analyzed with the use of mass-spectrometry. Among these, CSF was collected via an external ventricular drain (EVD) from n = 12 patients with acute TBI. The resulting protein findings were then compared with CSF obtained by lumbar puncture from n = 14 patients with noninfectious CNS disorders comprising relapsing–remitting multiple sclerosis, anti-N-methyl-
Introduction
The central nervous system (CNS) mounts a complex inflammatory response to injury. Following both CNS traumatic and nontraumatic insults, resident immune cells, such as microglia and astrocytes, become activated. 1 This activation triggers the release of proinflammatory mediators, including cytokines, chemokines, and reactive oxygen species. The immune response serves to clear damaged cells, debris, and pathogens, and to initiate and sustain a process of tissue repair. However, dysregulation of this inflammatory process can contribute to secondary tissue damage and neurodegeneration. 2 Trauma triggers inflammation via dying cells and leaking intracellular material by so-called damage-associated molecular patterns, DAMPs, which are potent triggers of the innate immune system. 3 In contrast, both CNS infections and autoimmune disorders are also characterized by prominent involvement of the adaptive immune system, with involvement of both cellular and humoral immune components.4,5 Detailed mapping of the characteristics of inflammatory responses being mounted in different contexts has implications for understanding the diverse pathological processes and designing targeted therapeutic interventions.6–9
Cerebrospinal fluid (CSF) biomarkers have long played an important diagnostic role in autoimmune conditions such as multiple sclerosis (MS), but more lately also serving as markers of disease activity. Hence, studies have shown that interleukin (IL-) 10 and C-X-C motif chemokine ligand (CXCL) 13 levels are predictive of further disease activity in relapsing–remitting MS (RRMS),10,11 while CSF CC chemokine ligand (CCL)11 becomes upregulated in secondary progressive multiple sclerosis, 12 while also being correlated to cognitive decline and psychiatric disorder.13,14 Levels of IL-6 predict both age of onset of MS and exhibit increased levels in MS patients’ serum. 15 CSF biomarker studies in herpes simplex encephalitis (HSE) show an association between extensive CNS inflammation and long-term neurocognitive outcomes.16–18 Moreover, a longitudinal study demonstrated that while some proinflammatory and anti-inflammatory cytokines such as interferon-gamma, tumor necrosis factor-alpha, IL-6, IL-1β, and IL-10 became upregulated early, other cytokines (e.g., CCL17, CCL21-27, and CXCL12-13) peaked later, thus indicating a temporal dependency of the inflammatory response. 18 Taken together, several biomarkers, for example, IL-6, IL-10, and CXCL-13 can be found and have sparked interest in all the abovementioned inflammatory disorders, and also notably in TBI.19–22 In fact, IL-6 is also pivotal in neurotrauma. IL-6 mediates the acute-phase response 23 and regulates lymphocyte and monocyte differentiation processes. 24 In experimental neurotrauma, IL-6 depletion yields a subdued glial cell response and diminishes sequelae, 25 and conversely, IL-6 overexpression precipitates neurodegenerative consequences.26,27 Clinically, IL-6 levels correlate proportionately with the gravity of the traumatic insult 28 and seem to be an indicator of clinical outcome. 29 In the clinical domain, a recurrent motif emerges—the ascent of IL-6 aligns with the exacerbation of TBI. In contrast, the temporal dynamics of IL-10 in clinical studies on TBI remain inconclusive21,22,30 and despite numerous attempts no consistent link between IL-10 levels and clinical outcomes has been established.31–33 Broadly, IL-10 enhancement emerges as a promising therapeutic target, enhancing neurological outcomes following TBI. 34 TBI research related to the complement system and its inhibition in the early phases after trauma might have neuroprotective benefits,35,36 while others show increased blood–brain barrier (BBB) damage with activation. 37 Taken together, discernment of the inflammatory response for each separate disorder has been made, but there is still a gap in the knowledge about similarities and dissimilarities between various inflammatory CNS disorders.
Above, we highlight shared inflammatory cues across various types of CNS insults, indicating that various CNS disorders share common neuroinflammatory response pathways, while each disorder also holds a distinct neuroinflammatory phenotype. This could tentatively be of importance for improved pathophysiological understanding and disease-specific treatment development. To study this, we sought to utilize mass spectrometry to delineate and compare fluid proteomic expressions in the CSF and blood across nontraumatic inflammatory disorders of infectious and noninfectious origin and compare these with the inflammatory response in TBI patients. Specifically, we compared noninfectious inflammatory disorders RRMS, anti-N-methyl-
Methods
This was a prospective, observational investigation undertaken among patients at the Karolinska University Hospital and Karolinska Institutet in Stockholm, Sweden, between 2003 and 2018. In total, n = 46 patients were included in this study. Of these, n = 12 patients had suffered a TBI. In contrast, n = 14 patients, including n = 6 with RRMS, n = 4 with NMDAE, and n = 4 with ADEM, had suffered a noninfectious inflammatory disease of the CNS. In total, n = 13 patients were categorized as CNS infections, specifically n = 5 patients with PML, n = 6 patients with HSE, and n = 2 patients with viral meningitis. In total, n = 7 healthy controls (HC) were included.
The study was approved by the Swedish Ethics Review Authority 2005/1526/31/2, 2014/1201–31-1 and 2009/2107–31/2. Written informed consent was obtained by all patients or, during neurointensive care (NIC), patient relatives.
Group Division
We divided the data set into n = 4 analytical groups. Group 1 constituted patients suffering from TBI. Group 2 entailed noninfectious acute neuroinflammatory disorders such as RRMS, NDMAE, and ADEM. Group 3 was utilized as a control group and consisted of healthy persons. Group 4 comprised patients suffering from acute CNS infections (PML, HSE, and other types of viral meningitis).
Patient population, management, and sample acquisition from the TBI-group
TBI patients were included if they were adult subjects (18–75 years) who had sustained a severe TBI (classified as Glasgow Coma Scale [GCS] 3–8 upon hospital admission or else GCS >8 score, but with a clinically deemed strong risk of deterioration) in need of neurointensive care unit (NICU) treatment at the Karolinska University Hospital with implantation of invasive intracranial monitoring. The following four factors constituted the exclusion criteria: (i) devastating prognosis before NICU arrival, (ii) penetrating head injury, (iii) comatose due to other factors than TBI, (iv) a preexisting chronic condition that precluded subsequent follow-up or other reasons precluding adequate follow-up. The local NICU management protocol of severe TBI has been detailed elsewhere. 38 In summary, the Karolinska University Hospital follows an intracranial pressure (ICP)-driven strategy, aligning with the guidelines set forth by the Brain Trauma Foundation. 39 ICP is monitored either through a closed external ventricular drain (EVD) (Medtronic, USA), or an intraparenchymal pressure monitor (Codman & Shurtleff Inc. Raynham, MA, USA, or Rehau AG+CO, Rehay, Germany). Data obtained from monitors were retrieved via the TBI database at the Karolinska University Hospital. Additional clinical variables, radiological variables, as well as outcome score data were collected prospectively. 40 Glasgow outcome score (GOS) was collected at 6–12 months following hospital discharge via a questionnaire or a physical meeting at the outpatient clinic. CSF sample collection from the TBI patients was collected from an EVD. The median time for acquiring the CSF samples in this group was around 3 days and the mean time was 3.8 ± 2.6 SD days, with the longest sampling collecting time being 10 days and the shortest 1 day. Samples were stored locally at 4°C in median 1 day (0–1), until delivery to a local biobank, where samples were vertically incubated for 30 min before centrifugation for 15 min at 2000 g, aliquoted, and stored at −80°C until further analysis.
Patient population, management, and sample acquisition from groups 2, 3, and 4
The patients constituting groups 2, 3, and 4 were recruited during the time frame described above and samples were handled in a similar manner as outlined above, with the difference that the primary caretaking clinic was the Neurology Department at Karolinska University Hospital. Importantly, the CSF in these groups was obtained via lumbar punctures. The cohort with MS was, during the sampling time, not treated with any immune-modulation treatment, which could affect proteomic analysis. Notably, one of the patients suffering from NMDAE (group 2) had received rituximab, and one patient was treated with corticosteroids before sampling. Also, all patients with ADEM were on corticosteroids during the time of sampling.
Proteomic analysis
Aliquots corresponding to 150 µL of initial CSF samples were taken out for analyzing. Before analyzing, the whole volume of each CSF sample (150 µL) was filtered through a 0.22 μm cellulose acetate spin filter (Agilent Technologies, Palo Alto, CA, USA) by centrifugation at 14 000 × g for 2 min. Afterward, an aliquot of 145 µL of each CSF sample was loaded onto the Multiple Affinity Removal System (MARS Hu-14) (Agilent Technologies, Palo Alto, CA) cartridge and the flow-through (FT) fraction was collected by centrifugation for 2 min at 100 × g. Two successive wash steps with 400 µL of MARS-7 Buffer A were carried out to obtain maximum yield. The FT and wash (W) fractions were combined. The spin cartridge was washed with 2.5 ml of MARS-7 Buffer B to remove bound proteins and was then re-equilibrated with Buffer A. The remaining fractions (FT+W) were dried using SpeedVac (Thermo Fisher Scientific, Waltham, MA). The proteins were reduced, alkylated, and in-solution digested by trypsin according to the standard operating procedure. The collected peptide filtrate was cleaned by C18-spin columns (Thermo Fisher) and then vacuum centrifuged to dryness using a SpeedVac system. Dried peptides were resolved in 30 μL of 0.1% formic acid and further diluted 2 times, nano-LC-MS/MS. The peptides were separated in reverse phase on a C18-column with a 90-min gradient and electrosprayed on-line to a Q-Exactive Plus mass spectrometer (Thermo Finnigan). Tandem mass spectrometry was performed applying HCD.
Protein Characterization
Database searches were performed using the software Proteome Discoverer ver. 1.4. The search was set toward proteins from the Homo sapiens proteome extracted from UniProt in 2020. The search parameters were set to Taxonomy: Homo sapiens, Enzyme: Trypsin. Fixed modification was carbamidomethyl (C), and variable modifications were oxidation (M) and deamidated (NQ). The search criteria for protein identification were set to at least 2 matching peptides. With the use of the websites UniProt and GeneCards, the regulated group of proteins was scanned and conveniently distributed according to their main function in the following groups: Cell adhesion, Enzymatic, Hormone-related proteins, Metabolism, Immune response, and Miscellaneous.
Data and statistical analysis
For demographic and clinical data, continuous variables are presented as mean (standard deviation) if normally distributed and else median (interquartile range). For mass spectrometry data, further raw-data processing was necessary. The RAW-data files were quantitatively analyzed by the quantification software MaxQuant 1.5.3.30 (Max-Planck Institute of Biochemistry). The results of all fractions were combined to a total label-free intensity analysis for each sample, which was multiple testing corrected using the false discovery rate. Next, peptides without missing observations were examined across groups 1–4. As group 1 was the study group of interest (TBI patients), calculations were done as a series of Student’s t tests between group 1 and group n, where n could take the value 2, 3, or 4. No multiple-testing correction was done after this, but proteins were only considered significant/regulated if they exhibited a p value ≤0.05 and an absolute and relative difference of ∼Δ20% compared with group n.
Graphical presentation was conducted using R (The Comprehensive R Archive Network, version 4.3.1) 41 via the interface RStudio (2023.9.0.463). In addition to base R, we also utilized the packages tidyverse, 42 gridExtra, 43 and magrittr. 44
Results
Group 1 (TBI)
The cohort of severe TBI patients consisted of 12 patients (10 males and 2 females), with a mean age of 51 ± 9 SD years (Table 1). All patients except n = 1 had an admission GCS score of less than 8, and 5 of the admitted patients did not have a free airway.
Demography, Admission Variables, and Clinical Outcome in Group 1 (TBI)
The table includes characteristics of the 12 patients. Age span reached from 38-64 years. Glasgow Coma Scale (GCS) was noted at admission (3–15). Pupils (0–2, 0 normal, 1 unilateral unresponsive, 2 bilateral unresponsive). Rotterdam CT Score (1–6). Marshall CT Classification (1–6). Head-Abbreviated Injury Scale (AIS) (1–6). New Injury Severity Score (NISS) (Max 75). Glasgow Outcome Score (GOS) was recorded at follow-up at around 6–12 months after the time of injury (1–5). Abbreviations: NA = Not Applicable.
Group 2 (RRMS, NMDAE, and ADEM), Group 3 (HC), Group 4 (PML, HSE, and other viral meningitis)
We entitle noninfectious CNS inflammations (entailing RRMS, NMDAE, and ADEM) “Group 2.” Group 2 consisted of 14 patients (6 males and 8 females), with a mean age of 45 (range, 18–64). Group 3 here defined as a control group consisted of 7 healthy individuals (3 males and 4 females), with a mean age of 41 ± 5 SD. Group 4, that is, infectious, nontraumatic CNS neuroinflammations, constituted 13 patients (3 males and 10 females) of mean age 49 (range, 26–70).
Identified biomarkers and regulations between groups
The number of identified proteins in the samples against the Homo sapiens proteome is given in Tables 2–4. In total, we identified n = 1416 proteins identified in all 56 samples. The label free quantitation (LFQ) intensity is shown for a selected group of biomarkers (FGA, GSN, TIMP1, C3), in Figure 1, to illustrate the level of homo- and heterogeneity across neuroinflammation. The displayed proteins were chosen because they have created interest in previous research as well as being on the list of regulated proteins. Figures 2, 3, and 4 display all the regulated proteins in the three different group comparisons, their LFQ intensity, and their respective protein classification.
Regulated Proteins Between Group 1 and Group 2
Regulated proteins between Group 1 and Group 2. 1 plus: Upregulated between one- and twofold. 2 plus: Upregulated more than twofold. 1 minus: Downregulated between one- and twofold. 2 minus: Downregulated more than twofold. For convenience, the proteins are divided into 6 different groups regarding their classification: Cell adhesion, Enzymatic, Hormone related proteins, Immunity, Metabolism, Miscellaneous.

Representative proteins illustrating protein level homo- and heterogeneity across neuroinflammatory diagnoses. The figure depicts 4 selected proteins (FGA, C3, TIMP1, and GSN). The X-axis constitutes the different groups (TBI, non-infectious, healthy controls, infectious), while the Y-axis shows the joule intensity. Each dot represents one patient, and the coloring is unique for each group. Abbreviations: FGA = Fibrinogen alpha chain, C3 = Complement C3, GSN = Gelsolin, TIMP1 = Metalloproteinase inhibitor 1.

Visual display of the regulated proteins in the comparison of TBI (Group 1) versus the non-infectious acute neuroinflammatory disorders (Group 2), their LFQ intensity and their respective protein classification. The X-axis illustrates the Log2 Fold change, both positive and negative numbers. The Y-axis depicts the list of proteins with their corresponding abbreviated name. The color coding is based on the protein group classification made in this study.
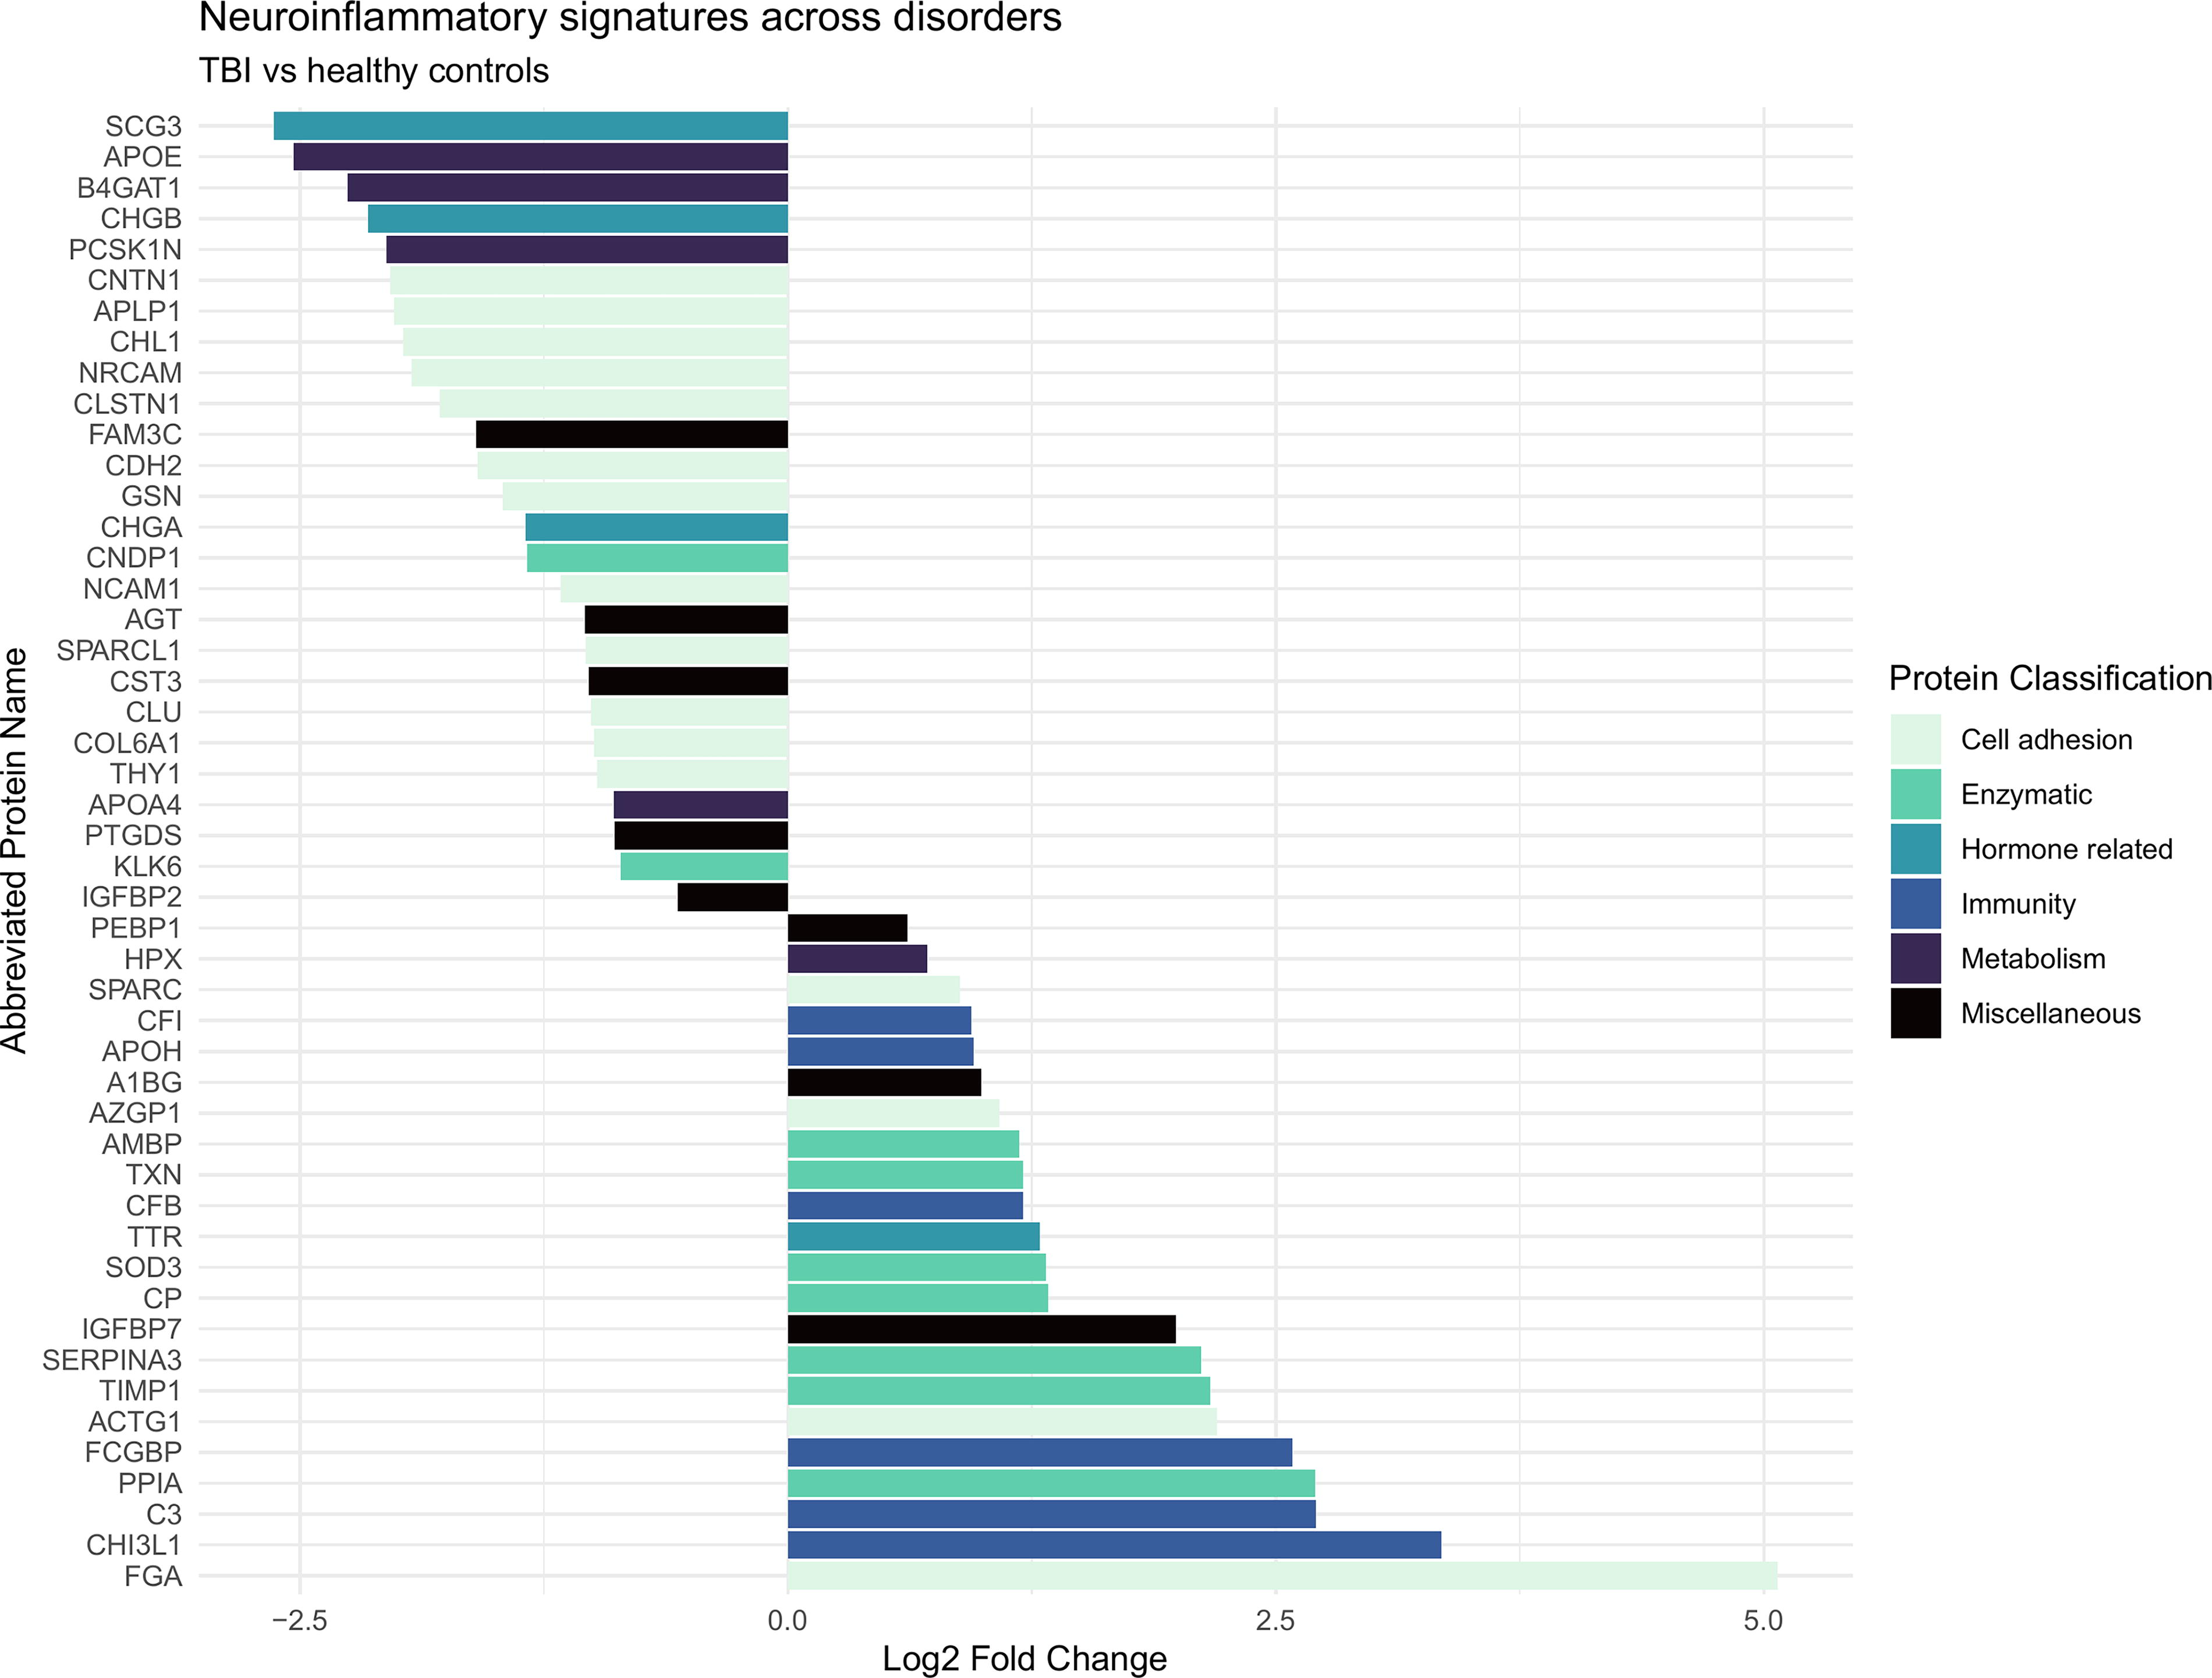
Visual display of the regulated proteins in the comparison of TBI (Group 1) versus the healthy controls group (Group 3), their LFQ intensity and their respective protein classification. The X-axis illustrates the Log2 Fold change, both positive and negative numbers. The Y-axis depicts the list of proteins with their corresponding abbreviated name. The color coding is based on the protein group classification made in this study.

Visual display of the regulated proteins in the comparison of TBI (Group 1) versus the acute CNS infections group (Group 4), their LFQ intensity and their respective protein classification. The X-axis illustrates the Log2 Fold change, both positive and negative numbers. The Y-axis depicts the list of proteins with their corresponding abbreviated name. The color coding is based on the protein group classification made in this study.
Comparison Group 1 (TBI) versus Group 2 (RRMS, NMDAE, and ADEM)
In total, we quantified 97 proteins, of which 57 proteins were differentially expressed between the groups. Among these, 20 proteins were upregulated among TBI patients and 37 proteins were downregulated (Table 2). Five proteins were uniquely identified in all 14 samples of Group 2 and no proteins were uniquely identified in all 12 samples of the TBI group (Supplementary Table 1).
Among the 20 upregulated proteins, 12 proteins were upregulated more than twofold. Cell adhesion: FGA 9.47 and IGFBP7 3.83. Enzymatic: TIMP1 2.74, SOD3 2.38, and SERPINA3 2.04. Hormone related: TTR 2.35. Immunity: CHI3L1 2.13, C3 3.53 (Table 2).
Among the 37 downregulated proteins, 28 proteins were downregulated more than twofold. Cell adhesion: Gelsolin 0.26. Hormone related: CHGA 0.34. Metabolism: APOE 0.11 (Table 2).
Comparison of Group 1 (TBI) versus Group 3 (HC)
In total, we quantified n = 98 proteins, of which n = 55 were significantly altered between groups 1 and 3. Among these, 24 proteins were upregulated and 31 proteins were downregulated in the TBI-group (Table 3). 39 proteins were uniquely identified in all 7 samples of Group 3 and 4 proteins were uniquely identified in all 12 samples of the TBI group (Supplementary Table 1).
Among the upregulated proteins, 19 were being upregulated more than twofold. Cell adhesion: FGA 31.46 and IGFBP7 3.67. Enzymatic: TIMP1 4.95, SOD3 2.49, and SERPINA3 3.99. Hormone related: TTR 2.40. Immunity: CFB 2.21, and FCGBP 3.75 (Table 3).
Regulated Proteins Between Groups 1 and 3
Regulated proteins between Group 1 and 3. 1 plus: Upregulated between one- and twofold. 2 plus: Upregulated more than twofold. 1 minus: Downregulated between one- and twofold. 2 minus: Downregulated more than twofold. For convenience, the proteins are divided into 6 different groups regarding their classification: Cell adhesion, Enzymatic, Hormone related proteins, Immunity, Metabolism, Miscellaneous.
Among the downregulated proteins, 27 proteins were downregulated at least twofold. Cell adhesion: Gelsolin 0.30. Hormone related: CHGA 0.39. Metabolism: APOE 0.11 (Table 3).
Comparison of Group 1 (TBI) versus Group 4 (PML, HSE, and other viral meningitis)
In total 98 proteins were quantified, 57 proteins were significantly regulated between groups 1 and 4. Among them, 17 proteins were upregulated and 32 proteins were downregulated in the TBI-group (Table 4). 1 protein was uniquely identified in all 13 samples of Group 4 and no proteins were uniquely identified in all 12 samples of the TBI group (Supplementary Table 1).
Three peptides could not be categorized. 17 proteins were upregulated, with 10 of them being upregulated more than twofold. Cell adhesion: FGA 5.10, and IGFBP7 3.80. Enzymatic: TIMP1 3.25, SOD3 2.34, and SERPINA3 1.80. Hormone related: TTR 2.05. Immunity: FCGBP 2.61 (Table 4).
40 proteins were downregulated, with 24 of them being downregulated more than twofold. Cell adhesion: Gelsolin 0.30. Hormone related: CHGA 0.43. Metabolism: APOE 0.13 (Table 4).
Regulated Proteins Between Group 1 and Group 4
Regulated proteins between Group 1 and Group 4. 1 plus: Upregulated between one- and twofold. 2 plus: Upregulated more than twofold. 1 minus: Downregulated between one- and twofold. 2 minus: Downregulated more than twofold. For convenience, the proteins are divided into 6 different groups regarding their classification: Cell adhesion, Enzymatic, Hormone related proteins, Immunity, Metabolism, Miscellaneous.
Discussion
Unlike most existing TBI proteomic studies in the literature, this work leveraged multiple comparator disease control groups, aside of HCs, to address features specific for neurotrauma. Interestingly, several protein biomarkers showed a distinct up-/downregulation in both infectious and noninfectious CNS disorders compared with TBI. This included, for example FGA, IGFBP7, and APOE. In contrast, other proteins were uniquely found in merely 1 of the group comparisons, such as FGG, HBA1, TKT, CA1. Collectively, these findings demonstrate a unique TBI proteomic fingerprint compared with traditional conditions characterized by CNS neuroinflammation. The pattern detected for different protein group domains and the suggested relevance for understanding of underlying disease processes are discussed in the following sections.
Cell adhesion
The precursor protein fibrinogen alpha chain (FGA) was the most upregulated biomarker in all three group comparisons. FGA is a subunit of the coagulation factor fibrinogen and involved in coagulation. Following BBB disruption, fibrinogen gains access to the brain, but there is also a smaller amount of intrinsic CNS production. 45 Fibrinogen, which precedes fibrin formation, interacts with the neurovascular unit’s various cellular elements. This interaction directly impacts inflammatory, degenerative, and regenerative mechanisms in cases of neurological injury, as it binds to receptors on neuronal cells.46,47 Importantly, TBI patients are expected to have larger amounts of blood intracranially due to structural BBB damage. In 2 randomized controlled trials (CRASH-2 and CRASH-3), findings indicate that the antifibrinolytic agent tranexamic acid has properties that might lower mortality rates in some TBI patients.48,49 This reduction is achieved by inhibiting hyperfibrinolytic disseminated intravascular coagulation, particularly in cases characterized by elevated levels of fibrin degradation products (FDP) and D-dimer.47,49 The findings with much higher levels in the TBI group point to a much more disrupted BBB in these patients.
The involvement of insulin-like growth factor binding protein, IGFBP7, in the pathogenesis of brain injury is unclear. When endothelial cells (ECs) are exposed to IGFBP7, it triggers the formation of stress fibers and disrupts VE-cadherin-mediated junctions. This disruption culminates in heightened vascular permeability, as demonstrated by increased breakdown of the BBB, suggesting a potential role of IGFBP7 in this process. 50 Furthermore, when brain ECs are stimulated with IGFBP7, there is an upregulation of E-selectin—a pivotal molecule in the recruitment of immune cells. 51 This observation suggests that IGFBP7 potentially plays a role in regulating neuroinflammation in response to brain injury.
A study conducted by Wang et al. unveils significant molecular changes in ECs and highlights IGFBP7 as a potential biomarker for vasculature in the context of brain injury. The contradictory impact of IGFBP7 on angiogenesis in various systems might be contingent upon environmental cues within the microenvironment, including the unique regional composition of the extracellular matrix. 52 This study found that IGFBP7 upregulated about 4 times in each of our group comparisons, highlighting the role of angiogenesis particularly in TBI-related injury.
Gelsolin (GSN), calcium-dependent actin-binding, mediating cell shape and motility, was significantly downregulated in TBI patients compared with all other groups. A study showed that GSN had a biphasic decreasing trend during the first 7 days and a multivariate analysis showed it to be a predictor of 1-month mortality 53 and 1-year morbidity/mortality. 54 Studies have demonstrated a similar pattern in various organs during acute illness or trauma, but this was not observed in our study. 55
Enzymatic
Metalloproteinase inhibitor 1 (TIMP1), a metallopeptidase, was markedly elevated in the 3 comparisons, about 4 times when compared with HCs. The protein is believed to exert a protective role for the BBB and vascular integrity. 56 The findings in our study show a marked increase for the TBI group pointing out a more extensive BBB damage where TIMP1 is upregulated to protect the integrity of damaged BBB. Exploring treatments directed at TIMP1 and its associated downstream elements holds promise as an innovative approach to safeguard the integrity of the BBB in disorders affecting the CNS, particularly in the context of TBI. 56
We observed around 2.5 times upregulation of the antioxidant, superoxide dismutase (SOD3), in TBI patients. It is a main antioxidant enzyme and proven to protect from brain injury in ischemic stroke. 57 In rat models, SOD3 overexpression has shown to prevent ischemic–reperfusion injury as well help with regeneration of tissue. 58
Protease inhibitor, alpha-1-antichymotrypsin (SERPINA3), was upregulated 1.6 times, with the maximum number seen in comparison with the control group. Although serine proteases play a role in normal cellular function, they have been attributed to cell death and apoptosis in the CNS and by inhibiting lead to protective properties.59,60 Serine protease and its inhibition have been targeted with virus-derived immune modulators in rats in response to CNS injury, but more research is needed. 61 Another study administering the SERPINA3 therapeutic agent pointed to interesting effects on inhibiting neuronal death after cerebral ischemia. 62 Serine protease inhibitors were significantly upregulated in our study.
Hormone-related proteins and metabolism
Transthyretin (TTR) transport protein is a protein produced in the liver and CSF, carrying retinol and thyroxine as well as causing amyloidosis when misfolding. 63 TTR was upregulated about 2–2.5 times in the TBI group compared with all other groups. It is a marker of BBB disruption. 64 This may point to a more extensive damage of the BBB in the TBI patients compared with the other disorders.
Chromogranin A (CHGA) is distributed in secretory vesicles in neurons and neuroendocrine cells. In the presence of microglia shown to induce an inflammatory and neurodegenerative environment. 65 It also plays a role in reducing BBB damage in septic brain injury. 66 CHGA was downregulated in TBI patients in comparison with all other groups, why it might be of more importance as a neuroendocrine-immune system component in more infectious-related inflammations in the CNS.67,68
Apolipoprotein, APOE, is postulated to play a crucial role in lipid transport within the cerebral environment, contributing to the preservation of microtubular structural integrity within neurons. 69 In addition, it is involved in neural transmission. 70 Recent findings from TBI models involving transgenic animals further substantiate the significance of APOE in modulating both the inflammatory response and neuronal repair mechanisms subsequent to TBI. 69 APOE protein was significantly downregulated about 10fold in all comparisons, suggesting a dramatic decrease in especially traumatic inflammation disorders. In the cerebrum, astrocyte-sourced APOE assumes a critical function in governing cerebral cholesterol metabolism and facilitating the clearance of β-amyloid. 71 Noteworthy is that research has revealed an inverse correlation, where reduced concentrations of plasma APOE are concomitant with an escalated susceptibility to dementia.72,73 Studies have shown a link between BBB integrity and APOE-protein e4 allele, 74 but it is not clear in what way and which role the other different polymorphs of the proteins play. One group of researchers discovered an inverse relationship between soluble APOE and BBB leakage, demonstrating a decrease in BBB leakage as APOE levels increase postinjury. 75 Their cortical punch analysis in mice showed a drastic decrease in local APOE the first day and that it increased after time due to suspected reasons being return of pericytes, decreased matrix-metallopeptidase-9 (MMP-9) expression, and stabilization of tight junctions. 75
Immune response
Reactive astrogliosis in TBI has been shown to have both beneficial and problematic effects on the damage exposure to neural tissue. 76 Identified in astrocytes localized to the traumatic penumbra post-experimental brain contusion, there is an observed upregulation of the glycoprotein, chitinase-3-like protein 1 (CHI3L1). Furthermore, CHI3L1 knockout (KO) mice present with severe astrocytosis and increased microglial/macrophage activity following TBI. 77 We found Two times upregulated levels of CHI3L1 in TBI patients compared with the other groups. In recent years, CHI3L1 has garnered attention as an increasingly proposed biomarker with sensitivity and significance, playing a crucial role in the astrocytic response that modulates neuroinflammation. 78
C3 complement protein showed marked increase in the TBI group compared with the noninfectious inflammatory group (3.5 times), but even higher compared with the control group. The complement system constitutes a component of the innate immune system, serving as a pivotal player in upholding tissue equilibrium and contributing to the host’s protection against pathogens. 79 Notably, CSF analyses from TBI patients, spanning various degrees of severity and parenchymal damage, have consistently revealed heightened levels of C3. This elevation exhibits substantial variability both temporally and among patients. Furthermore, a subset of patients displayed intrathecal synthesis of C3. 80
In contrast, elevated levels of complement factor B (CFB) were observed in the TBI group in comparison with the control group. CFB is part of the alternative complement pathway and the amplification loop. 81 Postmortem studies on human TBI cases have identified heightened expression of C3 and CFB in both brain tissue and CSF. 83 CFB knockout mice demonstrated a decrease in cell death following TBI. This was accompanied by an elevation in antiapoptotic markers and a decrease in proapoptotic markers. 82 Complement inhibition thus might be a tentative treatment target across various inflammatory disorders. Interestingly, a randomized controlled trial aimed at complement component C1q inhibition following TBI is currently recruiting. 83
Mucin-like protein IgGFc-binding protein’s (FCGBP) molecular role is still unclear, various studies have revealed that it may be connected to the body’s innate immunity. 84 In ulcerative colitis, its levels have shown to be downregulated prompting a thinking that it keeps the inflammatory response under control. 84 On the contrary, a study on gliomas showed high levels of FCGBP to be a poor prognostic factor, and further research is ongoing. 85 It has been shown that when the FCGBP gene is downregulated, cancer risk is heightened, and FCGBP being a tumor suppressor gene has been suggested. 86 Of particular significance, elevated concentrations of FCGBP have been identified as contributory factors in the pathogenesis of several neurological disorders characterized by the interplay between inflammation and intestinal dysfunction. Specifically, FCGBP has been associated with amyotrophic lateral sclerosis, where its involvement extends to the facilitation of autoimmune and neuroinflammatory responses. 87 Furthermore, heightened levels of FCGBP have been observed in Parkinson’s disease, also emphasizing its role as a pertinent neuroinflammatory marker. 88 In this study, we detected upregulated levels in two out of three comparisons (3.7 times vs. HC and 2.6 vs. infectious inflammatory group). To our knowledge, this protein has not before been described in a TBI context.
Limitations
For all protein quantifications, we utilized mass spectrometry, a method acclaimed for its comprehensive detection of nearly all proteins within samples. 89 However, a potential limitation lies in the method’s capacity to overshadow less prevalent proteins in normal states, particularly when more abundant counterparts dominate. 90 Moreover, the number of included patients was modest across all groups, in themselves marked by substantial heterogeneity. In addition, the TBI patients had their CSF drawn from an EVD, while it was obtained by lumbar puncture in controls. It is known that the concentration of some biomarkers differs between the compartments (e.g., S100B, T-tau, and P-tau). 91 Although this may introduce a potential bias, the procedure of obtaining CSF by lumbar puncture in individuals with an EVD is usually contraindicated. Furthermore, the time point at which the CSF was collected in relation to timing of the trauma was not the same across the groups, although in most cases the time window was restricted to 3 to 7 days. For the groups with inflammatory diseases, drugs given may influence the biomarker concentration. In the Methods section, it is noted if patients received steroids or other immunomodulators.
Conclusion
In conclusion, contrasting the CSF proteomic profile of victims of TBI recovered in the NICU with HC and individuals suffering from infectious or autoimmune neuroinflammation, we identified unique protein profiles being present in TBI in relation to all comparator groups. The nature of these protein profiles may help identify and classify relevant cellular processes triggered by neurotrauma, and in turn, aid in identifying potential future therapeutic targets.
Footnotes
Acknowledgments
The authors thank all the staff at the ICU for the great work with this group of patients and to all the authors and people who have helped with gathering of data and analysis.
Authors’ Contributions
Conceptualization and study design: E.R. and F.A.N. Supervision: E.R. Data acquisition: A.W., J.B., F.A.N., and F.P. Data analysis: A.W., J.B., and C.L. Data interpretation: P.D., C.L., and E.R. Article draft: P.D., C.L., and E.R. Article revision and approval of article: all authors.
Author Disclosure Statement
No competing financial interests exist.
Funding Information
Elham Rostami is supported by SciLifeLab/KAW, Wallenberg Clinical Fellow, the Swedish government and the County Councils, and Kjell and Märta Beijer Foundation; Caroline Lindblad has received support from the Uppsala Research Residency Program, the Swedish Society of Medicine’s visiting researcher’s grant, and the Uppsala University Med-fak grant.
Abbreviations Used
References
Supplementary Material
Please find the following supplemental material available below.
For Open Access articles published under a Creative Commons License, all supplemental material carries the same license as the article it is associated with.
For non-Open Access articles published, all supplemental material carries a non-exclusive license, and permission requests for re-use of supplemental material or any part of supplemental material shall be sent directly to the copyright owner as specified in the copyright notice associated with the article.