
Abstract
Functional connectivity (FC) after traumatic brain injury (TBI) is affected by an altered excitatory-inhibitory balance due to neuronal dysfunction, and the mechanistic changes observed could be reflected differently by contrasting methods. Local gamma event coupling FC (GEC-FC) is believed to represent multiunit fluctuations due to inhibitory dysfunction, and we hypothesized that FC derived from widespread, broadband amplitude signal (BBA-FC) would be different, reflecting broader mechanisms of functional disconnection. We tested this during sleep and active periods defined by high delta and theta electroencephalographic activity, respectively, at 1, 7, and 28 d after rat fluid-percussion-injury or sham injury (n = 6/group) using 10 indwelling, bilateral cortical, and hippocampal electrodes. We also measured seizure and high-frequency oscillatory activity (HFOs) as markers of electrophysiological burden. BBA-FC analysis showed early hyperconnectivity constrained to ipsilateral sensory-cortex-to-CA1-hippocampus that transformed to mainly ipsilateral FC deficits by 28 d compared with shams. These changes were conserved over active epochs, except at 28 d when there were no differences to shams. In comparison, GEC-FC analysis showed large regions of hyperconnectivity early after injury within similar ipsilateral and intra-hemispheric networks. GEC-FC weakened with time, but hyperconnectivity persisted at 28 d compared with sham. Edge and global connectivity measures revealed injury-related differences across time in GEC-FC as compared with BBA-FC, demonstrating greater sensitivity to FC changes post-injury. There was no significant association between sleep fragmentation, HFOs, or seizures with FC changes. The within-animal, spatial-temporal differences in BBA-FC and GEC-FC after injury may represent different mechanisms driving FC changes as a result of primary disconnection and interneuron loss.
Significance statement
The present study adds to the understanding of functional connectivity (FC) changes in preclinical models of traumatic brain injury. In previously reported literature, there is heterogeneity in the directionality of connectivity changes after injury, resulting from factors such as severity of injury, frequency band studied, and methodology used to calculate FC. This study aims to further clarify differential mechanisms that result in altered network topography after injury, by using broadband amplitude-derived FC and gamma event coupling-derived FC in electroencephalographic. We found post-injury changes that differ in complexity and directionality between measures at and across timepoints. In conjunction with known results and future studies identifying different neural drivers underlying these changes, measures derived from this study could provide useful means from which to minimally-invasively study temporally evolving pathology after traumatic brain injury.
Introduction
Traumatic brain injury (TBI) causes large-scale circuit reorganization with increased local input and disconnect from distant regions. 1 Existing methods to measure FC derived from electroencephalographic (EEG) measurements have used phase coupling described by phase coherence, amplitude synchrony described by power of neuronal firing, and cross-frequency coupling between different spectral frequencies. 2 These methods have been applied to EEG and some imaging readouts to generate measures of global and regional connectivity changes after TBI.3–5 Despite evidence of sensitivity of EEG measures reflecting altered connectivity, few preclinical studies have used EEG after TBI to examine spatial changes in FC.6–7 Therefore, we designed this study to further clarify neuronal alterations after TBI in the rat fluid percussion model using an EEG network-based approach.
In this study, two methods of FC were used to evaluate cortical network changes: Broadband amplitude-derived FC (BBA-FC) at 0–60 Hz to reflect broader multiunit activity within the corresponding region, and gamma event coupling-derived FC (GEC-FC) to reflect local connectivity measured using the low gamma band (30–55 Hz). 2 GEC-FC reflects gamma activity as a series of gamma events driven by the multiunit firing of excitatory and inhibitory neurons, calculating the synchronicity between regions as a measure of FC. 8 Physiological alterations occurring after TBI, including altered levels of GABA and interneuron axotomy as a result of metabolic stress, have been hypothesized to interfere with normal gamma oscillations.9–10 Interneurons are also known to be particularly vulnerable to loss or damage after injury, where the resulting alterations in excitatory-inhibitory balance are potentially implicated in gamma oscillatory changes.10–12
TBI has additionally been associated with altered sleep structure, particularly EEG power and timing of stage transitions, as well as increased sleep fragmentation.13–15 Both preclinical and clinical studies have demonstrated correlations between sleep fragmentation and regional connectivity, where disrupted correlations in theta-delta coupling occur after TBI.15–17 This study aims to further examine whether sleep has a modulatory effect on FC changes post-injury.
Although it is known that TBI results in altered network connectivity, there is heterogeneity in reported local and global changes over time. The method of evaluating connectivity could further reflect different mechanistic changes that occur in response to injury. In this exploratory study, we hypothesized that measurement of local GEC-FC and widespread BBA-FC in rats after fluid percussion injury would produce different patterns of connectivity, reflecting broader mechanisms that result in altered network topography related to the primary injury. We also aimed to investigate the relationship between the clinical biomarker of sleep–wake disturbances and FC. These hypotheses were tested during sleep and active periods defined by high delta and theta EEG activity at 1, 7, and 28 days post injury after adult rat, fluid-percussion injury.
Materials and Methods
Experimental protocol
Continuous EEG recordings (24 hours/day) were captured at 1, 7, and 28 days in a lateral fluid percussion injury (LFPI) model of TBI in adult rats (n = 6/group), for use in calculations of FC. Adult male Sprague-Dawley rats (300–350 g at the time of TBI) obtained from Charles River Sprague Dawley, USA, were housed in pairs under controlled environmental conditions (temperature of 22 ± 1°C, humidity 30–70%, lights on 06:00–18:00 h) and with pellet food and water provided ad libitum (LabDiet, 5001, USA). All experimental procedures involving rats were conducted in accordance with the guidelines and regulations set forth by the University of California Los Angeles Institutional Animal Care and Use Committee.
Surgical procedure for TBI induction and electrode implantation
TBI was induced using the lateral fluid percussion animal model. 18 Briefly, rats were anesthetized using 5% isoflurane vaporized in room air and then maintained at 1.9% throughout the surgery. Following a longitudinal skin incision and clearance of the periosteum, a 5-mm diameter craniectomy was made using a hand-held trephine, centered at −4.5 mm behind bregma, and 2.5 mm from the midline over the left cortex, keeping the dura intact. A modified Luer–Lock syringe cap was placed inside the craniectomy and anchored in place with dental acrylate and anchor screw. Injury was induced using a fluid-percussion device equipped with a straight-tip attachment (AmScien Instruments, Model FP 302, Richmond, VA, USA). The pressure level was adjusted to produce a severe TBI with a target mortality between 20 and 30% within the first 48 h (n = 6). 19 Sham-operated experimental controls (n = 6) underwent the same surgical procedures as the TBI rats except for injury induction. The rat was removed from the device and placed on a heating pad immediately after the impact.
A combination of paired intracerebral microwires and epidural screw electrodes was implanted after injury during the same surgery session. Bipolar electrodes with tip separation of 0.5 mm were implanted through a burr hole into the perilesional cortex frontoparietal (AP = −1.7, ML = 4.0 and D = −1.8) and posterior to the craniectomy (AP = −7.6, ML = 4.0, and D = −1.8). An additional bipolar electrode with tip separation of 1.0 mm was implanted in the anterior ipsilateral hippocampus, aiming at the distal CA1 (AP = −3.0, ML = 1.4 and D = −3.6). Four epidural screw electrodes were implanted into ipsilateral fronto-parietal (AP: −1.7; ML: 2.5), contralateral fronto-parietal (AP: 1.7; ML: 2.5), ipsilateral occipital, (AP: −7. 6; ML: 2.5), and contralateral occipital (AP: −7.6; ML: 2.5) area. 20 Ground and reference electrodes (stainless steel screws) were inserted in the skull bone overlying the cerebellum (Fig. 2).
EEG acquisition
Immediately following surgery, rats were placed in a recovery cage with homoeothermic monitoring for recovery. EEG recording began within an hour after completion of the surgery (about 2 h following impact) and was performed continuously 24 h/day for the first week after TBI and at 28 days post-injury, with recordings captured at 1, 7, and 28 days post-injury (dpi). EEG was sampled at a minimum of 2 kHz per channel and minimum passband between 0.1 Hz and 1 kHz. EEG was recorded referentially to a screw electrode positioned in the skull overlying the right cerebellar cortex.
Gamma event coupling and broadband amplitude FC analysis
The broader 0–60 Hz frequency band was used in BBA-FC analysis, whereas the low gamma frequency band 30–55 Hz was used in GEC-FC analysis, corresponding with existing literature8,21,22 (Fig. 1). Before artifact detection, the EEG data underwent two preprocessing steps to ensure accurate analysis. First, the mean signal across all channels was removed to eliminate any baseline drift or offset, and a notch filter was applied to eliminate powerline noise at 60 Hz. The signal was segmented into shorter windows, typically 0.25 s long across all channel to compute, the power in the frequency band of interest (200–600 Hz). This frequency band was chosen due to its relevance in capturing fast artifact activity commonly observed in EEG recordings. Subsequently, the power values were normalized and thresholds are determined based upon the standard deviation of the signal and the percentage of samples above the mean. Artifacts were then identified based on these threshold criteria. Specifically, segments exhibiting power levels above the calculated thresholds were flagged as containing artifacts. In addition, a zero-crossing criterion was applied to detect rapid changes in the EEG signal, which can be indicative of artifact presence. Segments failing to meet both threshold and zero-crossing criteria were marked as artifacts. To enhance the efficiency of artifact detection, channels were grouped based on their standard deviation. This grouping strategy allows for the identification of artifacts that were present across multiple channels within the same group. Finally, common artifacts detected within the same group were combined and added to the common artifacts in all other groups. This combination method improves the robustness of artifact detection and reduces the risk of false positives or missed detections. The code used for artifact detection is freely available: https://github.com/MohamadShamas/Artifact-Detector.git. For the TBI group, the algorithm removed an average of 17.3 ± 7.9 minutes, corresponding to 39 ± 18.4% of the total raw data file duration. For the Sham group, the artifact removal pipeline reduced an average of 15.6 ± 8.5 minutes, corresponding to 38 ± 20.5% of the total raw data file duration. EEG signal data were then divided into 30 s epochs, and sleep-stage scored for the 24-hour period at 1, 7, and 28 dpi. To maintain consistency between subjects, the first 20 minutes of recordings predominantly defined by theta frequencies for active states or delta frequencies for sleep states at 1, 7, and 28 dpi from each of the light and dark periods was used in BBA-FC and GEC-FC calculations and mapped onto a rat brain surface. (Fig. 2A). GEC-FC was computed using prior published methods8,21 and implemented in Matlab (The Math Works, Inc. MATLAB. Version 2020a).
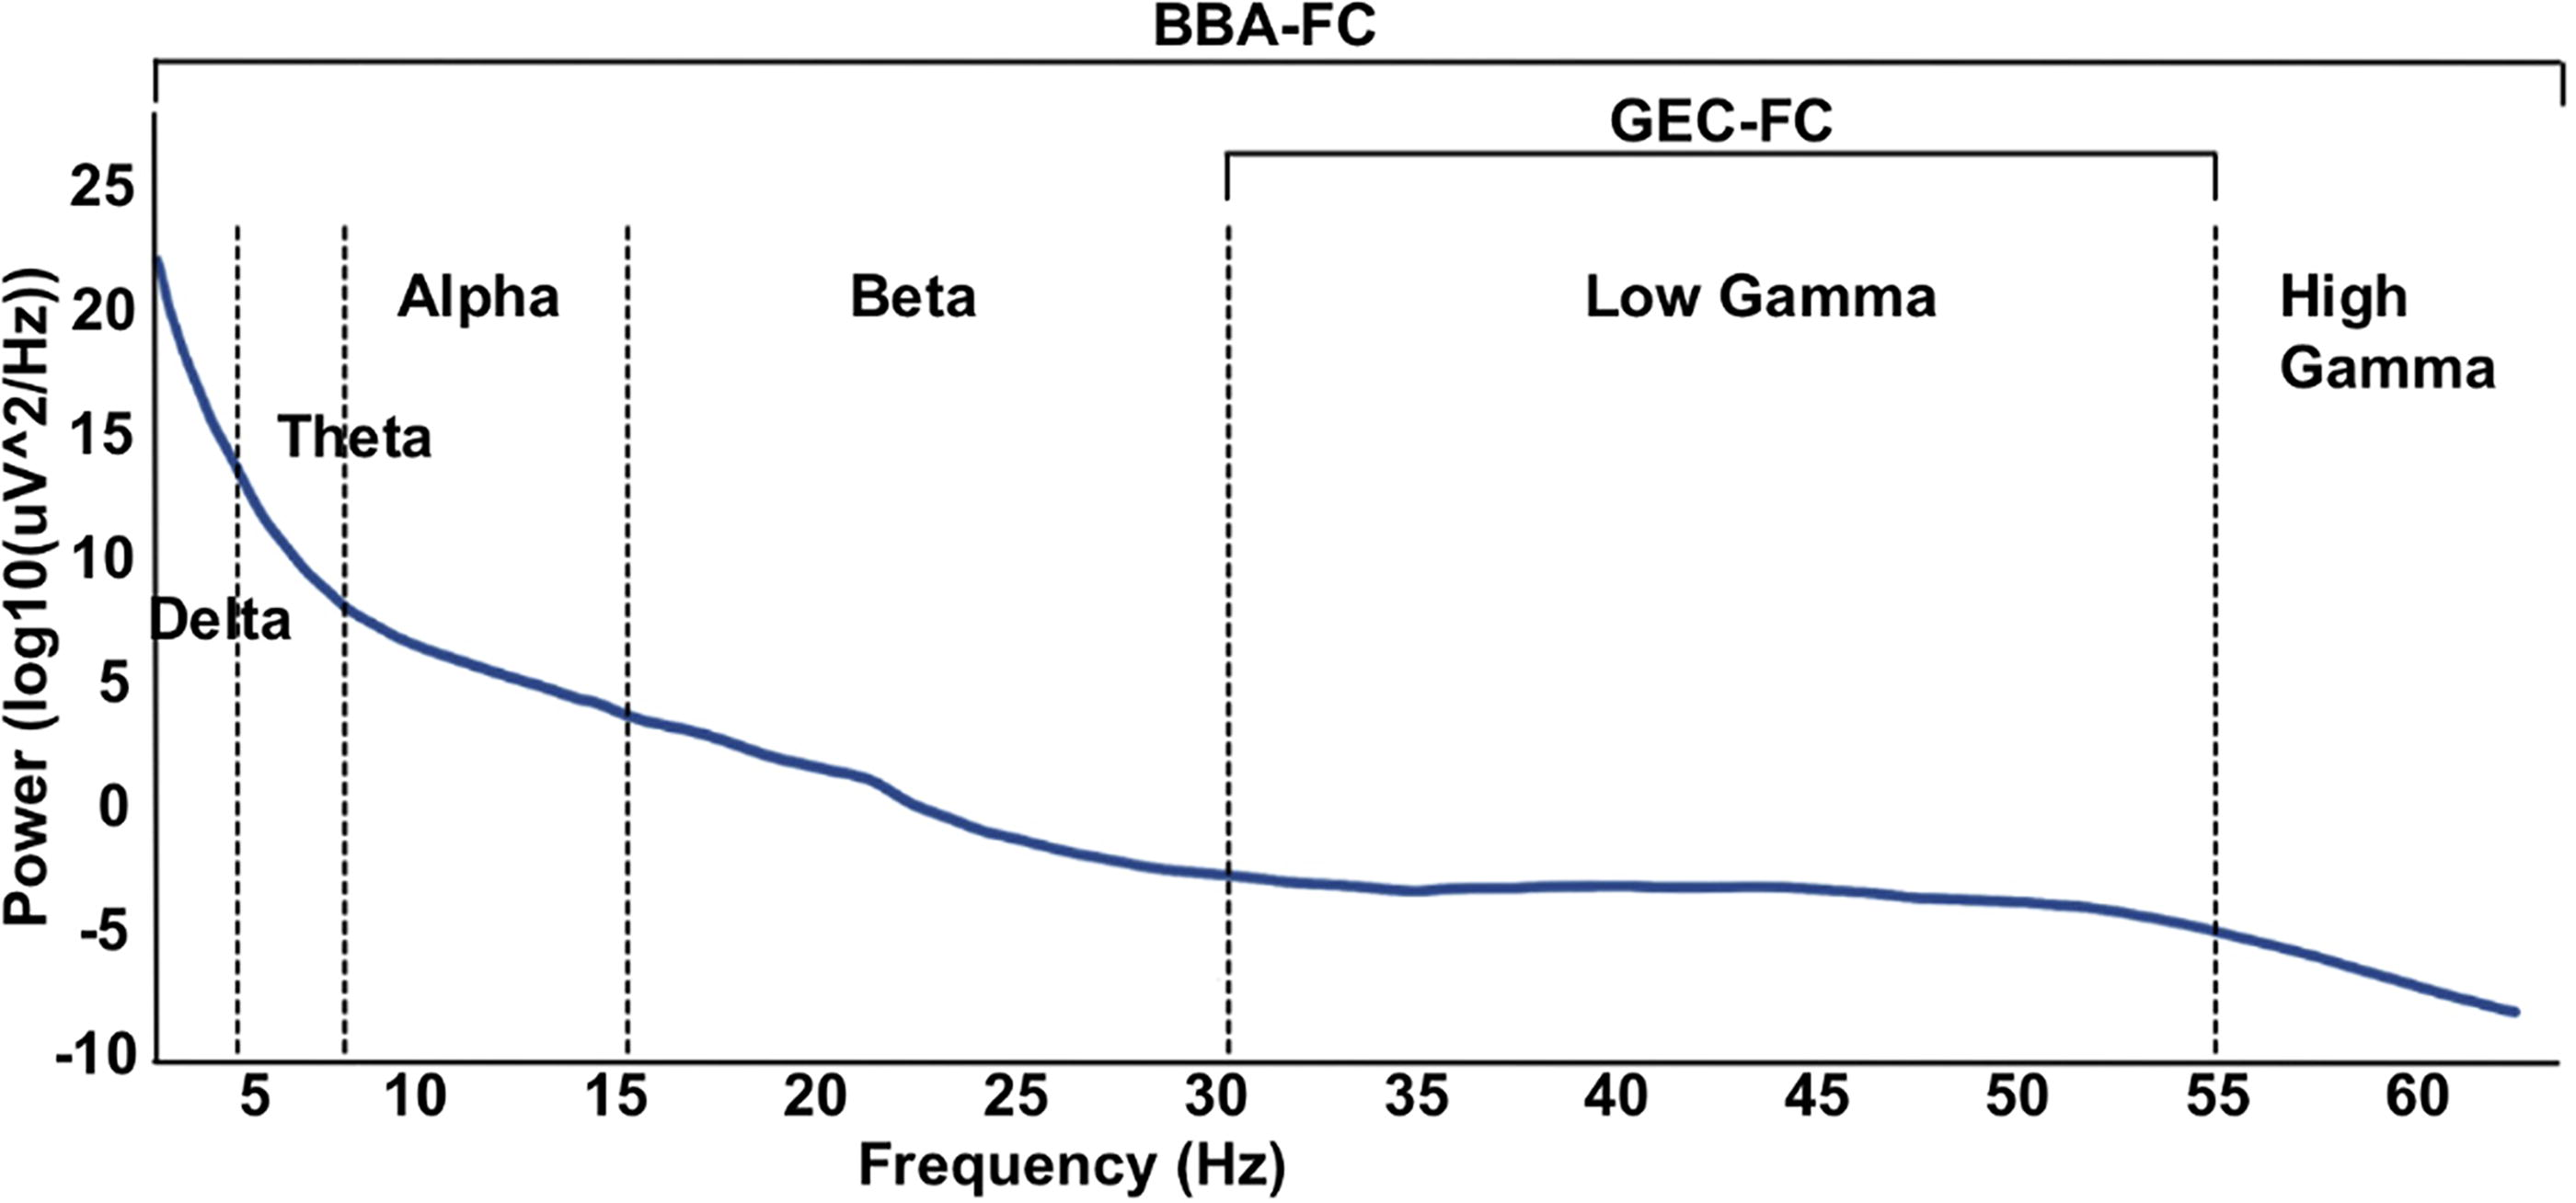
Representative diagram of EEG power spectrum with labeled frequency subset used for broadband amplitude-derived functional connectivity (BBA-FC, 0-60Hz) and gamma event coupling-derived functional connectivity (GEC-FC, 30-55Hz). EEG, electroencephalographic; GEC-FC, gamma event coupling functional connectivity.

Representative electrode placement, EEG traces, and HFO analysis: [
FC was assessed through the calculation of peri-event histograms, which depicted the rate and timing of events relative to each other. Gamma event coupling is stable across behavioral states, and unlike other phase-amplitude coupling methods, does not have a prior assumption of a predefined model. Each event in the reference channel was analyzed for the occurrence of events in the target channel within a 630-millisecond window. This process was repeated for all detected events in the reference channel, generating a time histogram. To ensure accurate representation, a time resolution of 2 milliseconds was chosen, based on the Nyquist rate principle. The time window for related events was determined as 1 divided by the minimum frequency in the selected frequency band, resulting in a window of less than 34 milliseconds for a minimum frequency of 30 Hz. To generate reliable histograms, a minimum of 30 data points per bin interval was required, necessitating the collection of at least 1020 events within a file of minimum duration of 24 seconds.
FC between two channels was inferred when a significant peak was observed in the peri-event histogram. The strength of this peak was quantified using Shannon entropy (S), where lower S values indicated greater certainty and stronger connectivity between the channels involved. A connectivity index (hij) ranging from 0 to 1 was defined to represent the strength of connectivity between two recording channels, with 1 indicating full connectivity and 0 indicating complete disconnection. This index was calculated by subtracting the Shannon entropy of the peri-event histogram between the channels (sij) from its maximum (Smax), then dividing by Smax.
All connectivity indexes were organized into a symmetric connectivity matrix, where each component reflected the connectivity index between different recording sites. This matrix, with dimensions MxM for M recording channels, provided a comprehensive overview of the strength of connectivity between all pairs of recording channels. While GEC-FC was derived from the value of entropy resulting from the peri-event histogram between the peaks of local gamma (30–55 Hz) recorded from each pair of electrodes, BBA-FC was derived from the Pearson correlation coefficient between broadband signals (0.1–60 Hz) recorded from pairs of electrodes.
Sleep fragmentation and high-frequency oscillatory activity (HFO) analysis
Sleep fragmentation (SF), which is hypothesized to be a clinical biomarker of recovery after TBI, is measured by the sleep fragmentation index, representing the total number of awakenings and sleep stage shifts divided by total sleep time.23–24 24-hour EEG recordings from 1, 7, and 28 dpi were manually scored for wakefulness, high delta, and theta activity using the AASM Sleep-Scoring Guidelines 25 (Fig. 2B). SF was compared across groups and time using a linear mixed model analysis (SPSS Statistical Software, version 29.0). To determine if local network activity had an effect on observed FC changes, 30 minutes/day of artifact-free EEG slow activity during the light period across each of the first 7 days post injury were selected for HFO detection. A computer-based analysis of HFOs was performed on cleaned data using the Matlab-based RippleLab software. 26 The short-time energy (STE) algorithm was used to detect ripples and fast ripples with the following parameters: bandpass filter 80–200 Hz (ripples) and 200–500 Hz (fast ripples), successive root mean square values >5 standard deviations above the overall root mean square mean within the 3 millisecond window, and minimum duration of 6 milliseconds with more than 8 peaks greater than 2 standard-deviations above the mean value of the band-passed signal. 27 After the automated HFO detection process, all detected events were reviewed manually with ripples or fast ripples centered within a 500 msec duration window with unfiltered EEG signal above the bandpass filtered signal and in adjacent panel, a spectrogram reflecting power of ripples (80–200 Hz) or fast ripples (200–500 Hz) with respect to time. The only events removed were those corresponding with residual artifact (i.e., brief episodes of low-amplitude, high-frequency muscle activity) that were missed during the artifact removal stage. (Fig. 2C and D).
EEG seizure detection
Continuous EEG recordings from each day were manually reviewed for the presence EEG seizure patterns, defined by Kane et al. for the International Federation of Clinical Neurophysiology as “repetitive epileptiform EEG discharges >2 Hz and/or characteristic pattern with quasi-rhythmic spatiotemporal evolution (i.e., gradual change in frequency, amplitude, morphology, and location), lasting at least several seconds (usually >10 sec).” 28
Sham-operated rats undergo a craniotomy, a procedure known to potentially induce injury,29–31 and subsequently receive an electrode implantation. Despite the meticulous execution of these surgical procedures, the trigger of acute seizures has been reported in Sham-operated experimental controls equipped with both epidural and intracerebral electrodes, and even in previously Naïve animals with the same electrodes. 32 However, unlike TBI rats in sham conditions, the seizure incidence is markedly low, and seizures typically subside within 72 hours of injury, and almost never develop PTE. The occurrence of post-implantation seizures remains largely unexplored, possibly due to the fact that most studies delay electrographic recordings until 1 week after implantation to minimize the potential effects of surgical stress on EEG.
Statistics
Group differences in edge connectivity graph measures were calculated using network-based statistics (NBS), which is based on the principles of cluster-based thresholding by treating links within networks as connected components. 33 Alterations in FC were determined using the strength of edge differences between electrodes, as calculated by mean differences of connectivity at each pairwise region of the connectivity matrix. This was evaluated at p < 0.01, 2-tailed, using nonparametric permutation testing over 1000 iterations under GraphVar 34 (version 2.03a). Calculation of persistence of FC differences across time was conducted using linear mixed model analysis of variance (ANOVA) to test for the effect of time, correcting for multiple comparisons, with rat number as a random effect. Preliminary analysis demonstrated no significant difference between FC at delta and theta states, so these periods were combined for all analyzes. NBS generally resulted in 1–3 different subnetworks in the different statistical contrasts run. These results were displayed over a brain mesh using the BrainNet Viewer toolbox 35 (version 1.7). Measures of global connectivity (global efficiency, clustering coefficient, and characteristic path) were derived from the NBS results and compared between TBI and Sham using a 1-way repeated-measures ANOVA with post hoc testing for group differences at each level of time corrected for multiple comparisons.
Results
Differences in cross-sectional functional connectivity by BBA and GEC analysis
Cross-sectional analysis of FC metrics at 1, 7, and 28 days post-injury compared with sham revealed only minor significant changes in BBA-derived connectivity. This was composed of ipsilateral sensory-cortex-to-CA1 hippocampus hyperconnectivity at 1 and 7 d that transformed to ipsilateral deficits within the ipsilateral visual cortex and bilateral sensory cortex at 28 dpi (Fig. 3A). There was not a significant effect of time on BBA-FC connections (p > 0.05, mixed model repeated measures). In comparison, GEC analysis demonstrated much larger regions of early and persistent ipsilateral hyperconnectivity that weakened over time (p < 0.05, mixed model repeated measures ANOVA after correcting for multiple comparisons), but remained significantly hyperconnected within the contralateral sensory-cortex-CA1 and ipsilateral visual cortex compared with shams (Fig. 3B). Furthermore, the number of significant edges was greater in GEC-FC compared with BBA-FC at 1 and 7 dpi. The average percent difference in FC for significant edges between TBI and Sham was greater in GEC-FC at 1 and 28 dpi (100%, 15%, and 153% increase for GEC-FC and 56%, 35% and −4% changes for BBA-FC at 1, 7, 28 dpi, respectively, two tailed t-test, p < 0.05). The difference in directionality of FC changes due to injury could indicate increased sensitivity to underlying pathobiology.

Statistically different edge connectivity between electrodes comparing TBI and sham groups at 1, 7, and 28 dpi for: [
Graph-based network analysis at each time point demonstrated a significant effect of day post-injury for the global connectivity metrics characteristic path, clustering path, and global efficiency (1-way repeated measures ANOVA). Post hoc tests corrected for multiple comparisons revealed significant group-level differences only in clustering coefficient measured by GEC-FC at 1 dpi (Fig. 4). Although the magnitude of the BBA-FC global connectivity differences was larger than for GEC-FC, the variance of these group-level differences was greater, possibly contributing to the nonsignificant differences observed.

Global connectivity measures: Global connectivity measures of characteristic path, clustering coefficient, and global efficiency measured for [
Temporal changes in functional connectivity by BBA and GEC analysis
In order to compare the difference in the magnitude of FC change over time between TBI and sham rats, a longitudinal analysis was conducted for each time point combination (Fig. 5A and B). FC within the Sham group did not differ significantly across time (p > 0.05), but there was a significant change of FC in the TBI group across all time points for both GEC-FC and BBA-FC as compared with Sham (p < 0.01). The number of significantly different edges due to injury obtained by GEC-FC analysis was greater than for BBA-FC for all time points, both within and between hemispheres, demonstrating a persistence in the extent of network complexity from GEC-FC (Fig. 5A and B). The percent change in FC in TBI rats over time using GEC-FC was significantly greater between 1 and 7 dpi and 1–28 dpi than BBA-FC analysis, but not between 7 and 28 dpi (317%, 275%, and 511% increase for GEC-FC, versus 208%, −348%, and 87% for BBA-FC, respectively for 1–7, 7–28, and 1-28 dpi, two tailed t-test, p < 0.05). The temporal decrease in BBA-FC due to injury between days 7–28 corresponded to persistent hypoconnectivity seen at 28 dpi obtained by cross-sectional analysis (Fig. 3A).

Longitudinal analysis of the strength of FC over time post-injury. The magnitude of [
Graph-based network analysis of this data revealed a significant injury-related temporal change in GEC-FC-derived global clustering coefficient (two-tailed t-test, p < 0.05; Fig. 4), but no change in any other measures. There were no significant injury-related temporal changes in any of the network measures derived from the BBA-FC data.
Sleep analysis and electrographic measures of local network activity
Sleep fragmentation index (SFI) was calculated to test for an association between sleep–wake disturbances and FC. First, we used a linear mixed model analysis with fixed effects and found a significant effect of time and group x time on SFI (p < 0.001), but not an effect of group when collapsing across time (Fig. 5D). Pairwise comparisons over time revealed significantly higher SFI in TBI compared with sham rats only at 7 dpi (p < 0.05). We directly tested for a relationship between SFI and FC using SFI as a covariate of interest within the general linear model framework. We found no association between SFI and FC computed with both methods.
HFO ripples, fast ripples, and number of seizures were calculated between 1 and 7 dpi to determine if high-frequency activity was present and related to FC changes. Five of the 6 TBI animals developed seizures during the first 7 days after injury, compared with 3 of 6 animals from the Sham group. Although TBI rats had a total of 123 seizures during the acute period as compared with 8 in the sham group, there was no significant difference in seizure count as a result of injury, due to the large variance from one TBI rat with 61 and another with 41 of those 123 seizures. There were also no significant differences in HFO ripples and fast ripples between TBI and sham, suggesting that the FC changes tested for were unconfounded by local network activity or surgery-related effects. Observed FC changes in these data were therefore more likely to be related to the effect of injury alone.
Discussion
In this study, we found that EEG-derived FC is altered after TBI in the direction of hyperconnectivity at acute time points, especially for GEC-derived FC. Significant hyperconnectivity persisted for GEC-FC, while hypoconnectivity was indicated at 28 dpi for BBA-FC. Sham FC remained stable over time for both measures adding credence to the injury-related findings.
Altered structural FC after TBI is generally accepted as hallmark findings of the spectrum of TBI injuries. Hyperconnectedness has been electrographically associated with a decrease in inhibitory synaptic input, increased spiking activity in the gamma band, and increased local synchrony.21,36–38 Previous studies have similarly described increased connectivity in the perilesional cortex after injury, namely in regions that were found to undergo structural and circuit reorganization.12,39 However, other studies have reported heterogeneity in connectivity after TBI, hypothesized to be explained by mechanisms such as variation in injury severity, compensatory reorganization to offset functional loss, and nonuniform expression of hyperconnectivity within subnetworks.39–42 In this study, GEC-FC captured greater injury-related differences than BBA-FC, as indicated in global connectivity measures across time, a higher number of local subnetwork edges compared with sham, and a smaller variance between subjects. Mechanisms underlying GEC-FC and BBA-FC changes have been hypothesized to be related to axonal injury leading to suppression of inhibition. 43 However, the very different temporal changes in GEC-FC and BBA-FC described herein point to the existence of different underlying neural substrates. Broadband power reflects multiunit activity from overall circuitry, as measured by the Pearson correlation of EEG power over the 0–60 Hz frequency band.44–45 In contrast, GEC reflects rhythmic synchronization of neural activity and is calculated using temporal relationships between maxima gamma wave activity between regions.2,46 Decreased BBA-FC-specific sensitivity for detecting injury-related differences could therefore result from measuring the much wider 0–60 Hz spectrum compared with the much narrower range for GEC-FC due to frequency-band specific differences. 47
GEC-FC has been shown to reflect interneuronal activity, where FC changes are related to interneuron-mediated transfer within the cortex. 48 Fast-spiking interneurons contribute to temporal narrow-band gamma oscillations as well as increased gamma oscillation amplitude.43–44 Parvalbumin-positive GABAergic interneurons are particularly essential for generating gamma rhythms and long-range connections.49–50 TBI-induced damage to fast-spiking interneurons results in increase in cortical excitability while promoting compensatory reorganization.11,44 Inhibitory interneuronal dysfunction can therefore disrupt gamma oscillations as well as the rhythmic inhibition and synchrony necessary for short- and long-range connectivity. 51 Following TBI in rodents, injury-related loss of inhibitory interneurons and inhibitory transmission drives an increased excitatory: inhibitory ratio of activity that ultimately favors hyperexcitatory activity.10,52 Although we found no effect of acute seizures and HFOs on FC, which would have corresponded to this expected increased excitatory: inhibitory ratio, it is possible that GEC-FC-driven interneuronal changes could be different from those that support seizures and HFOs. GEC-FC could be therefore used as a method to discern cellular causes of network reorganization that is more specific to interneuronal changes. Although interneurons are a suggested contributor to FC changes after TBI, future work is necessary to determine whether a causal association is present.
The small sample size used in this study makes this work exploratory only. The statistical permutation method used enables only a determination of subnetwork-level alterations and not electrode-to-electrode specific changes. Although sleep fragmentation was not revealed as a significant modulator of FC, there were significant variations in SF scores between individual subjects, so it is possible that all effects were not captured due to this limited group size.
In summary, BBA-FC and GEC-FC reveal initial interhemispheric hyperconnectivity after TBI, but display different trajectories of FC abnormalities toward more chronic post-injury timepoints. Evidence points to different neural drivers underlying these changes, suggesting that these measures may provide a useful means by which to minimally invasively study temporally evolving pathology after TBI.
Footnotes
Authors’ Contributions
R.F.: Formal analysis, visualization, and writing. C.S.-G.: Data curation and methodology, M.S.: Data curation and software, A.P.: data curation, R.S.: project administration, writing, and funding N.G.H.: Conceptualization, writing, project administration, and funding.
Author Disclosures Statement
The authors have nothing to disclose.
Funding Information
This work was supported by the