
Abstract
We performed a clinical-radiographic association study investigating the hypothesis that paroxysmal sympathetic hyperactivity (PSH) occurs in traumatic brain injury (TBI) patients with structural damage to the central autonomic network (CAN). To this end, we identified critically ill acute TBI patients who underwent magnetic resonance imaging (MRI) of the brain between January 2016 and July 2018. All patients were scored retrospectively according to the PSH-Assessment Measure (PSH-AM), which provides a clinical feature score, a diagnosis likelihood score, and a total score. All MRIs were reviewed for lesions within a priori CAN regions of interest, including the brainstem, ventral diencephalon, thalamus, medial temporal lobes, insula, anterior cingulate/medial prefrontal cortex, corpus callosum, and bilateral hemispheric white matter, on diffusion-weighted imaging (DWI), fluid attenuated inversion recovery (FLAIR), and susceptibility-weighted imaging (SWI) sequences. PSH-AM scores were compared using non-parametric tests according to lesion presence in each region and sequence. Imaging features independently associated with PSH-AM scores were ascertained from multivariable linear regression models using backwards elimination feature selection. The strongest predictive models were adjusted for known PSH risk factors including age, sex, and Glasgow Coma Scale (GCS), to determine the independent contribution of imaging features to PSH-AM scores. We found that of 128 patients meeting inclusion criteria, 60 (47%) were clinically diagnosed with PSH. PSH-AM diagnosis likelihood and total scores and clinical diagnosis were strongly associated with CAN lesions. The strongest multivariable model, adjusted for age, sex, and GCS, identified SWI lesions in the corpus callosum and medial temporal lobes as independent imaging predictors of PSH diagnosis likelihood. This exploratory study supports the hypothesis that structural damage to CAN regions is associated with the clinical syndrome of PSH after TBI, and provides foundational evidence for future data-driven studies.
Introduction
Paroxysmal sympathetic hyperactivity (PSH) is an incompletely understood syndrome occurring after acute brain injury characterized by recurrent episodes of tachycardia, tachypnea, fever, hypertension, sweating, and posturing. 1 The majority of PSH cases reported in the literature occur following traumatic brain injury (TBI), 2 in which its prevalence has been reported to be between 8% and 37%.3,4 In this setting, PSH has been associated with worse outcomes, including longer intensive care unit (ICU) stays, systemic complications, and poor injury recovery.3–9 Effective treatment and prevention may mitigate the negative impact of PSH on outcomes. Decisions to treat depend on clinical index of suspicion; clarifying the pathoanatomical correlations observed from clinical neuroimaging studies may improve clinical risk stratification for PSH and also identify mechanistic treatment targets.
The excitatory:inhibitory ratio model of PSH proposes that functional disconnection within the central autonomic network (CAN) leads to a loss of higher control over brainstem and spinal cord autonomic centers, which in turn become hyperexcitable to afferent stimulation. 10 The CAN includes orbital and medial pre-frontal, anterior cingulate, and insular cortices, medial temporal lobe (MTL) structures, the hypothalamus, thalamus, and multiple brainstem areas.11–14 Following TBI, structural injury to CAN nodes and connecting white matter (WM) fiber tracts may be visualized on clinical neuroimaging studies including computed tomography (CT) and magnetic resonance imaging (MRI), but no studies to date have explicitly evaluated for damage to CAN structures in relation to PSH.
Previous structural neuroimaging studies of PSH have been limited by sample size and technique, with most focusing on CT findings.4,15 MRI studies have suggested an association with conventional lesions involving the diencephalon, brainstem, corpus callosum (CC), and periventricular white matter 9 and with white matter disruption detected by diffusion tensor imaging (DTI) within the right posterior internal capsule and CC. 16 However, none of these studies used a standard, validated diagnostic tool as part of neuroimaging analyses, which may more reliably elucidate PSH pathophysiology.
The PSH Assessment Measure (PSH-AM), an expert consensus-based method for quantifying PSH symptom severity and diagnosis likelihood, was introduced in 2014 as a way to standardize research and clinical practice. 1 It includes two subscores: the Clinical Feature Scale (CFS), which grades the severity of physiological derangements, and the Diagnosis Likelihood Tool (DLT), which tabulates defining criteria for the syndrome, such as simultaneity of paroxysmal symptoms and exclusion of other causes. 1
To test the hypothesis that structural damage to brain regions involved in autonomic nervous system modulation are associated with PSH, we performed an exploratory study evaluating the relationships between clinical MRI pathology within a priori CAN regions of interest and validated PSH metrics including the PSH-AM and its subscores. 1 By identifying MR pathology associated with PSH metrics, we also aimed to improve upon a pathophysiological understanding of post-TBI PSH.
Methods
Patient identification
We included critically ill, acute TBI patients admitted to the R. Adams Cowley Shock Trauma Center between January 1, 2016 and July 1, 2018, for whom a brain MRI scan was performed as part of clinical care (Fig. 1). Patients were identified via the institutional trauma registry, by a Head Acute Injury Scale (AIS) >0. We excluded mild uncomplicated TBI (GCS >12 and negative initial head CT). All patients were admitted from the trauma resuscitation unit (TRU) to a trauma ICU, where they remained for at least 72 h. A 2-week hospital length of stay was further required in order to allow sufficient time for PSH symptoms to emerge and to improve upon PSH diagnostic certainty and PSH-AM scoring accuracy. 1

Patient flow diagram. TBI, traumatic brain injury; ICU, intensive care unit; LOS, length of stay; MRI, magnetic resonance imaging; PSH, paroxysmal sympathetic hyperactivity.
Clinical/demographic data collection
Presenting demographic and injury data were obtained via the institutional trauma registry. This included mechanism of injury, type of injury (blunt or penetrating), Head AIS, total Injury Severity Score (ISS), 17 Trauma ISS, 18 and post-resuscitation GCS, defined as the GCS following resuscitation and upon discharge from the TRU and transfer to the ICU. Inpatient clinical course and outcomes of interest were collected via review of the electronic health record (EHR). This information included neurosurgical procedures performed, timing of PSH diagnosis and MRI scans, medications administered, duration of mechanical ventilation, ICU length of stay, hospital length of stay, hospital mortality, and discharge GCS.
PSH characterization
All patients were retrospectively characterized according to a modified version of the PSH-AM 1 (Table 1). The PSH-AM is an expert consensus-based method for quantifying PSH symptom severity and diagnosis likelihood that was introduced in 2014 as a way to standardize research and clinical practice. 1 It includes the CFS, which grades the severity of physiological derangements based on set thresholds for vital signs and specific descriptors for sweating and posturing, and the DLT, which tabulates defining criteria for the syndrome, such as simultaneity, frequency, and duration of symptoms, and exclusion of other causes. 1 Our method for obtaining a daily PSH-AM score has been previously reported in detail. 4 In brief, we tabulated a daily score by summating the daily modified CFS score and DLT score for the first 14 days of hospitalization. Sweating and posturing components of the CFS were omitted because of incomplete and inconsistent EHR documentation. Components of the DLT were considered absent if there was not enough information to make a reasonable judgment. The scores used for neuroimaging analyses included the DLT, mean CFS, and mean total PSH-AM (sum of mean CFS and DLT).
Modified Paroxysmal Sympathetic Hyperactivity Assessment Measure (PSH-AM)
We also noted whether a clinical diagnosis of PSH was made by treating physicians based on institutional first-line maintenance medication (bromocriptine or propranolol) administration for at least 3 days with a documented indication of PSH (or alternative term such as “storming,” “autonomic dysfunction,” “diencephalic seizures/storms,” “paroxysmal autonomic instability with dystonia [PAID]”). 4
Radiographic data collection
All patients underwent neuroimaging with CT and MRI. Primary injuries were characterized by initial head CT Marshall 19 and Rotterdam 20 scores.
All MRI scans were performed on either a 1.5 T Siemens Avanto or 3 T Siemens Tim Trio Scanner (Siemens Medical Solutions; Erlangen, Germany) with parallel imaging capability. All participants received an MRI scan according to our standard institutional protocol for TBI patients. The protocol on 1.5 T scanner for specific sequences consisted of axial fluid attenuated inversion recovery (FLAIR) (effective echo time [TEeff]/inversion time [TI]/repetition time [TR]/echo train length [ETL] = 102/2500/8000/13 ms, 5 mm slices with 1 mm inter-slice gap, 1.2 × 0.9 mm in-plane resolution), susceptibility-weighted imaging (SWI) (TE/TR = 40/50 ms with 25 degree flip angle, 0.5 × 0.5 × 2 mm voxels). The imaging protocol on 3T scanner included FLAIR (TE = 77 ms, TR = 8000 ms, TI = 2500 ms, field of view [FOV] = 230 mm, resolution = 1.2 × 0.9 × 5 mm3, and 26 axial slices with 20% gap), SWI (TE = 20 ms, TR = 28 ms, flip angle = 15 degrees, FOV = 230 mm, resolution = 0.8 × 0.7 × 2 mm3, and 72 axial slices). Diffusion-weighted imaging (DWI) was obtained in the axial plane by using a dual spin-echo echo-planar imaging method with diffusion-weighting in three orthogonal directions with b-values of 0, 500, 1000 sec/mm2. The TE for the DWI was 86 ms with a TR of 5400 ms. A section thickness of 5 mm and an FOV of 220 x 220 mm at an acquisition matrix of 134 x 192 pixels were used.
For the main analyses of CAN structural pathology, all included patient MRI images were reviewed by a board-certified neuroradiologist (U.K.B.) for identification of lesions on SWI, T2 FLAIR, and DWI sequences. These sequences were chosen in order to capture both hemorrhagic and non-hemorrhagic (focal edema) pathology associated with traumatic injuries, as in other MRI studies of TBI-related pathology.21–24 Regions of interest included the brainstem, ventral diencephalon, thalamus, MTL, insula, medial pre-frontal/anterior cingulate cortex (mPFC/ACC), CC, and bilateral hemispheric white matter (HWM) (Fig. 2). The neuroradiologist was blinded to clinical data, including PSH clinical diagnosis and PSH-AM scores.
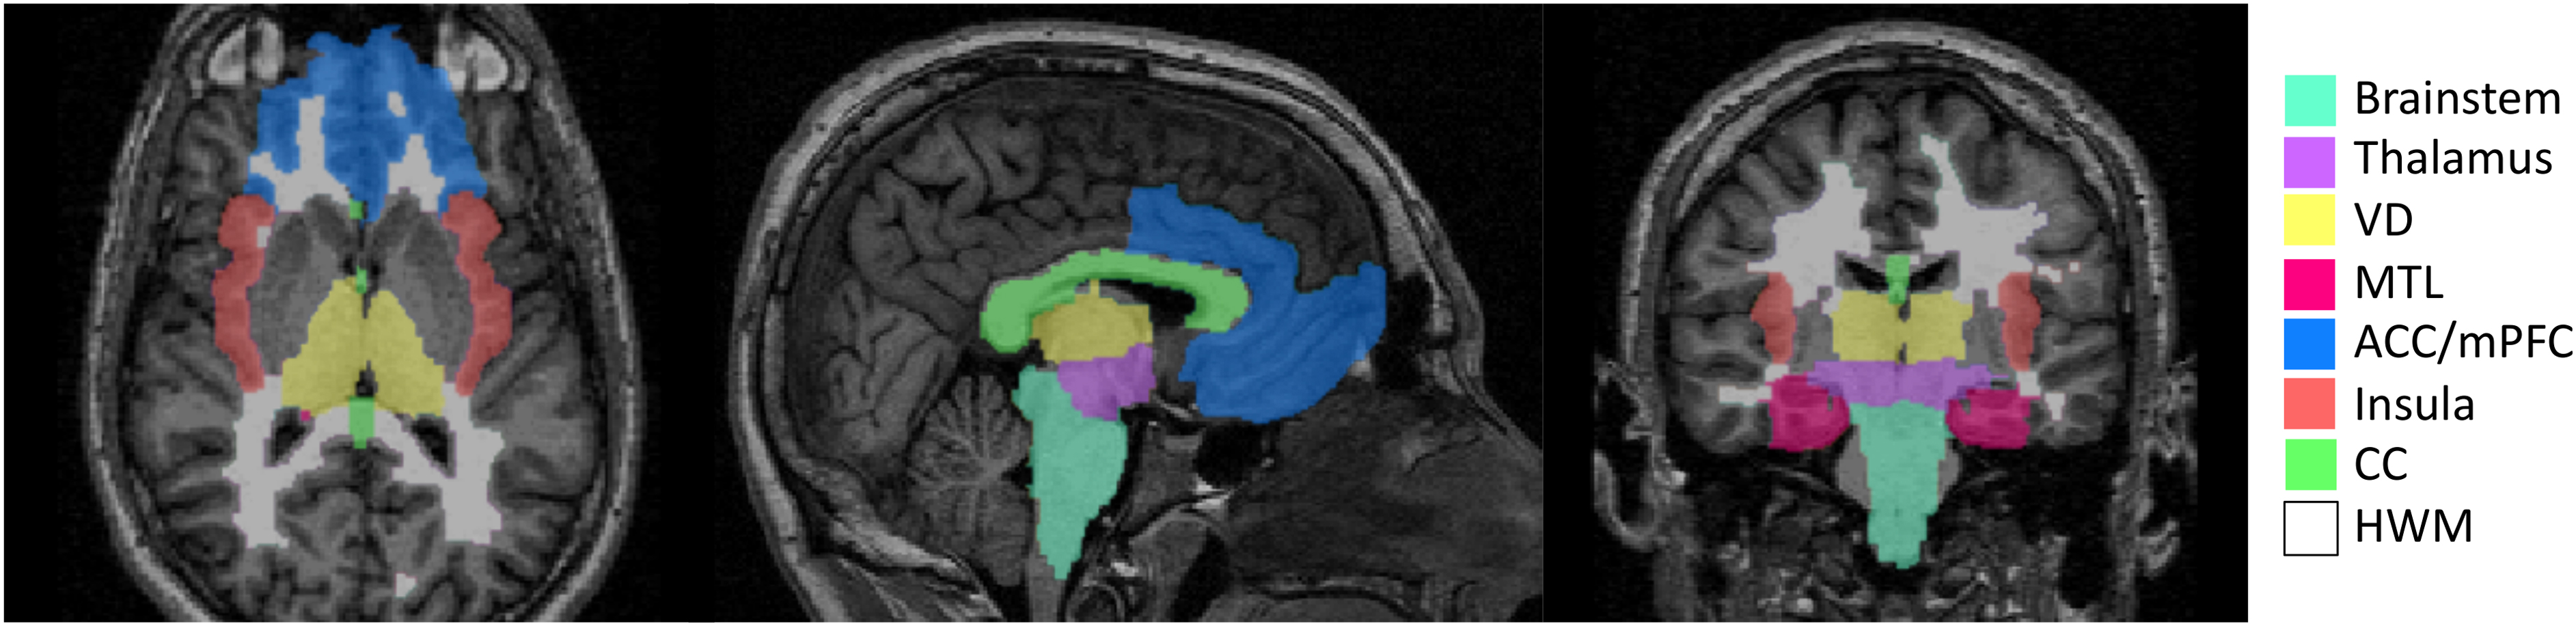
Central autonomic network regions of interest. VD, ventral diencephalon; MTL, medial temporal lobe; ACC/mPFC, anterior cingulate/medial prefrontal cortex, CC, corpus callosum; HWM, hemispheric white matter.
To summarize overall pathology, secondary MRI analyses based on clinical radiology reports were performed. To this end, reports signed by trauma neuroradiologists were extracted from the EHR and coded for presence of contusion, diffuse axonal injury (DAI), edema, global anoxic injury, infarct, intraparenchymal hemorrhage (further characterized as macro or micro hemorrhages), and subdural, subarachnoid, and intraventricular hemorrhages. If reports were ambiguous regarding any of the above features of interest, the images were manually reviewed by the primary author (J.E.P.) to make a determination. A size cutoff of 10 mm was used to distinguish micro from macro hemorrhages based on literature descriptions of traumatic and non-traumatic cerebral microbleeds.25,26
Statistical analysis
We summarized patients' demographic, injury, and inpatient clinical characteristics using descriptive statistics with frequency (%) for categorical variables, mean (standard deviation) for continuous and normally distributed variables, and median (25th, 75th percentiles) for ordinal or continuous, non-normally distributed variables. These characteristics were described for the whole cohort and also compared across patients with and without a PSH clinical diagnosis. Statistical comparisons were made using two-sample t tests for continuous and normally distributed variables, Wilcoxon rank sum tests for ordinal or continuous non-normally distributed variables, and χ 2 or Fisher's Exact tests for categorical variables.
For our main analyses, we described the number of patients with lesions in each region of interest on each sequence and then compared median DLT, CFS, and total PSH-AM scores by presence or absence of lesions using Wilcoxon rank sum tests. To corroborate our findings, we performed analogous analyses with PSH clinical diagnosis as a binary outcome variable. Specifically, the prevalence of lesions in each region of interest and each MRI sequence was compared across PSH positive and negative patients using χ 2 tests. We used a Bonferroni-corrected p value of <0.001 for statistical significance to correct for multiple comparisons.
In order to determine specific regional pathology independently associated with PSH-AM metrics, we performed multivariable linear regressions for each MRI sequence and each PSH metric, including regions that reached p < 0.05 in univariate analysis, selected using a stepwise backward elimination method.27,28 For the strongest prediction model, we then controlled for known PSH risk factors, confirmed in our database, including age, sex, and post-resuscitation GCS. 4 We also performed supplementary multivariable analyses to explore whether other imaging severity scores including DAI grade, Marshall, and Rotterdam scores significantly contribute to PASH-AM prediction models. All statistical analyses were performed using R software (Version 1.2.5001; R Foundation, Vienna, Austria). 27
Results
We identified 472 acute TBI patients meeting length of stay and severity criteria during the study period. Of these, 137 (29%) had a brain MRI performed as part of clinical care during their admission. Five patients were excluded for concomitant spinal cord injury and four were excluded for poor MR quality precluding lesion analysis, leading to a final sample size of 128 patients (Fig. 2). All MRIs included T2 FLAIR and DWI sequences. SWI was performed in 121 patients. For the remaining seven, gradient echo (GRE) was instead performed and was substituted. A 3T MRI scanner was used to obtain head imaging for 16 patients (13%), and a 1.5T scanner was used for the remainder (n = 112, 88%).
Basic demographic, injury, clinical, initial CT, and outcome data are described in Table 2. MRI was performed on median hospital day 5 (25th, 75th quartiles: 3, 11). Clinicians diagnosed PSH in 59 (46%) of included patients, and this diagnosis was made on median hospital day 5 (4, 8).
Demographic, Injury, and Clinical Features
Ordinal and continuous variables are shown as median (25th, 75th percentile). Categorical variables are shown as frequency, n (prevalence, %).
ICU, intensive care unit; GCS, Glasgow Coma Scale; MCC, motorcycle collision; MVC, motor vehicle collision; AIS, Abbreviated Injury Score; ISS, Injury Severity Score; TRISS, Trauma Injury Severity Score; ICP, intracranial pressure; PSH, paroxysmal sympathetic hyperactivity; DLT, Diagnostic Likelihood Tool; MRI, magnetic resonance imaging; LOS, length of stay, DI, diffuse injury; EVM, evacuated mass lesion; NEVM, non-evacuated mass lesion; MLS, midline shift; IVH, intraventricular hemorrhage; SAH, subarachnoid hemorrhage.
Clinical radiology reports of MRI findings are summarized in Table 3. DAI and microhemorrhages were associated with higher DLT scores, and subdural hematoma was associated with lower DLT and PSH-AM total scores. Imaging features suggestive of anoxic brain injury (in addition to TBI) were rare but were associated with higher CFS and PSH-AM total scores.
Magnetic Resonance Imaging Clinical Radiology Report Findings
Ordinal and continuous variables are shown as median (25th, 75th percentile). Categorical variables are shown as frequency, n (prevalence, %).
DLT, Diagnosis Likelihood Tool; CFS, Clinical Feature Scale; PSH-AM, Paroxysmal Sympathetic Hyperactivity Assessment Method; DAI, diffuse axonal injury; SDH, subdural hematoma; SAH, subarachnoid hemorrhage.
Results of PSH metric associations with regional pathology on all MRI sequences of interest are listed in Table 4. On SWI, MTL, mPFC/ACC, CC, and HWM lesions were associated with higher DLT and PSH-AM total scores and with a clinical diagnosis of PSH. On FLAIR, CC lesions were associated with higher DLT and PSH-AM total scores, and MTL and mPFC/ACC lesions were associated with higher PSH-AM total scores. On DWI, mPFC/ACC lesions were associated with higher PSH-AM total scores and insular lesions were associated with clinical diagnosis of PSH. No lesions were significantly associated with CFS scores using the Bonferroni-corrected p value. Multivariable linear regression model results are listed in Table 5. The strongest model predicted DLT scores based on SWI lesions in the CC, MTL, and mPFC/ACC. After controlling for age, sex, and post-resuscitation GCS, SWI lesions in the CC and MTL remained independently predictive of higher PSH DLT scores (Table 6). Supplemental multivariable linear regression analyses incorporating other imaging markers of severity into the aforementioned models (including Marshall and Rotterdam scores and DAI grade) did not improve model performance and were not independently predictive of PSH metrics.
Associations Between MRI Lesions within Regions of Interest and PSH Measures
Ordinal and continuous variables are shown as median (25th, 75th percentile). Categorical variables are shown as frequency, n (prevalence, %).
MRI, magnetic resonance imaging; DLT, Diagnosis Likelihood Tool; CFS, Clinical Feature Scale; PSH-AM, Paroxysmal Sympathetic Hyperactivity Assessment Method; SWI, susceptibility weighted imaging; FLAIR, fluid attenuated inversion recovery; DWI, diffusion weighted imaging; VD, ventral diencephalon; MTL, medial temporal lobe; mPFC/ACC, medial prefrontal cortex/anterior cingulate cortex; CC, corpus callosum; HWM, hemispheric white matter.
Multivariable Linear Regression Models of MRI Lesions Independently Associated With PSH-AM Scores
Results are based on multivariable linear regression models.
PSH, paroxysmal sympathetic hyperactivity; MRI, magnetic resonance imaging; DLT, Diagnosis Likelihood Tool; CFS, Clinical Feature Scale; PSH-AM, Paroxysmal Sympathetic Hyperactivity Assessment Method; SWI, susceptibility weighted imaging; FLAIR, fluid attenuated inversion recovery; DWI, diffusion weighted imaging; MTL, medial temporal lobe; mPFC/ACC, medial prefrontal cortex/anterior cingulate cortex; CC, corpus callosum.
Multivariable Linear Regression Models of MRI Lesions Independently Associated With PSH-AM Scores, Adjusted for Known PSH Risk Factors
Possible predictor variables included regional lesions, age, sex, and Glasgow Coma Scale (GCS). Non-contributing predictor variables were eliminated from models using a stepwise backward elimination method.
PSH, paroxysmal sympathetic hyperactivity; MRI, magnetic resonance imaging; DLT, Diagnosis Likelihood Tool; CFS, Clinical Feature Scale; PSH-AM, Paroxysmal Sympathetic Hyperactivity Assessment Method; SWI, susceptibility weighted imaging; FLAIR, fluid attenuated inversion recovery; MTL, medial temporal lobe, CC, corpus callosum.
Discussion
In a large sample of critically ill TBI patients who underwent MRI, we observed that lesions within a priori CAN regions of interest were correlated with higher likelihood of PSH. SWI lesions within the CC and MTL were the strongest features independently associated with PSH diagnostic likelihood when controlling for known PSH risk factors including, age, sex, and GCS. This exploratory work contributes to a fundamental understanding of the structural brain pathology associated with the clinical syndrome, supporting the hypothesis that the pathophysiology of PSH may involve functional disruption of components of the CAN.
Consistent with previous studies, we found strong associations between DAI and PSH. As the name suggests, DAI disrupts WM tracts of distributed neural networks. Higher DAI grades involve deeper and more diffuse pathology with increasing overlap on the CAN. 29 SWI sequences represent the most sensitive imaging modality for diagnosing DAI and traumatic microhemorrhages in TBI. 30 Accordingly, we found that SWI sequences identifying CAN lesions generated the strongest predictive PSH models. Additionally, traumatic lesions of the CC (pathognomonic for grade 2 DAI 29 ) visualized by any of the three sequences, were independently associated with higher PSH-AM total and DLT scores. Further, in our analysis of MRI pathology based on clinical radiology reports not limited to CAN regions of interest, we found that DAI and microhemorrhages, but not ischemia, edema, contusions, parenchymal macrohemorrhages, or subdural hematomas, were associated with increased likelihood of PSH. Therefore, DAI's predilection for both diffuse WM injury and deep gray matter lesions with CAN overlap may explain the strong associations between DAI and PSH here and elsewhere.9,16,31,32 However, neither brainstem lesions nor higher DAI grade were independently predictive of PSH in any of our multivariable models. A possible explanation is that, analogous to disorders of consciousness literature,21,33 the location and extent of lesions within the brainstem may differentially affect functional neural networks, with lesions to some tracts or nuclei profoundly affecting autonomic function and others not at all. Although this study was neither designed nor powered to detect specific brainstem regional effects, future quantitative lesion symptom mapping studies may address this possibility.
Although previous work has implicated DAI and the CC in PSH,1,6 our MTL finding is more novel. As the largest MRI study of post-TBI PSH to date, there was more power to detect effects outside of the commonly lesioned CC. In spite of its relative novelty, there is mechanistic validity and indirect support for MTL and limbic system involvement in the CAN. 12 For example, severe autonomic dysfunction is often reported in the setting of limbic encephalitis. 34 Beyond the MTL, we also observed limbic system lesion associations in mPFC/ACC regions. Interestingly, MTL and ACC/mPFC regions are particularly susceptible to contusional trauma, with most contusions occurring in frontal and temporal lobes.22,35 Discrepant findings of the impact of contusional pathology on risk for PSH has been reported in the past.4,15 Our secondary analysis of overall pathology based on MRI reports demonstrated no association between presence of contusion and PSH metrics, suggesting that it is the specific location of contusions that confers risk for PSH. High prevalence of frontotemporal contusions and DAI may explain why PSH is most commonly observed after TBI. 2
In this study, we found that the PSH-AM may indirectly measure anatomical injury to CAN components, with some limitations. Lesioned brain regions of interest most strongly corresponded with clinical suspicion for PSH (as measured by the DLT component of the PSH-AM and clinical diagnosis) rather than to clinical feature severity (as measured by the CFS). The DLT captures primarily subjective criteria that gauge the clinician's certainty of PSH diagnosis (Table 1). The CFS tracks the severity of physiologic PSH features. Whereas the CFS may be more objective than the DLT, there are drawbacks both intrinsically to the CFS and to its application herein, which may have contributed to the observed lack of robust imaging-CFS associations. An inherent shortcoming of the CFS includes its one-size-fits-all approach to thresholding physiological data without attention to personalized baselines. Retrospective CFS tabulation relies on charted hourly vital signs, which may not capture extreme physiological fluctuations associated with PSH paroxysms; the scores obtained here may have lacked sensitivity for identifying extreme paroxysms. Although the sensitivity of total PSH-AM scores has been reported at 94%, its specificity for PSH clinical diagnosis is just 35%. 36 A number of alternative etiologies could lead to similar physiological derangements measured by the CFS, and its specificity is further reduced in this retrospective study where we omitted sweating and posturing components because they are not routinely documented in the EHR. The CFS is also susceptible to treatment effects, as clinicians will aim to maintain physiological homeostasis during the acute TBI period, tightly maintaining blood pressure and temperature within acceptable ranges, for example. Tabulated CFS scores do not account for these treatment effects. We summarized the use of treatments likely impacting CFS scores for our cohort during the time frame of interest in Table 2. The CFS is also dynamic and was meant to be tabulated daily. We devised a single summary metric as overall 14-day mean CFS score, equivalent to a time-scaled burden, after exploring other possibilities including maximum and median. Trajectory group analysis that accounts for dynamic changes in the CFS over time may represent a more robust means of summarizing a patient's overall CFS. 37
The hypothesis-driven a priori CAN regions of interest utilized here represent a major limitation of this study and may account for the overall modest regression model strength. These regions of interest may not encompass all brain regions involved in central autonomic processing generally or PSH specifically. For example, recent work has identified involvement of the precuneus and the mid cingulate cortex in the CAN, 11 but we did not consider these foci within our analyses. Another limitation includes a lack of assessment of lesion laterality. Findings regarding hemispheric effects on autonomic function have overall been mixed and nuanced.38–41 Additionally, the use of a single expert rater does not allow for an assessment of the reproducibility of our findings. Future, more quantitative, studies utilizing regional segmentation to identify volumetric lesion burden in partitioned brain regions may yield more nuanced and objectively reproducible results regarding laterality and regions of interest not considered here. New techniques utilizing population-based connectome data are capable of predicting neural network disfunction associated with structural lesions. 42 Such techniques may be applied to identify a PSH-specific neural network, which may consist of a component of the CAN or include new interconnected regions of interest.
This was a retrospective study of a convenience sample of patients who were selected by clinicians to undergo MRI. Results may have been biased by a limited population (e.g., patients who had poor examinations out of proportion with CT imaging findings). Additionally, there was variability among image acquisition in terms of timing, the scanner and sequences used, and the magnetic field strength. Both 1.5 and 3T magnets were used in this study, which differ in sensitivity to detect traumatic microbleeds.43,44 In general, variability in image acquisition was a function of scanner availability, which should have affected the sample at random. However, as we did find higher 3T utilization among patients clinically diagnosed with PSH, we performed a subgroup analysis of SWI CAN lesion associations with PSH metrics with overall similar results (Table S1). Several studies have suggested that SWI lesion visibility on MRI may depend on scan timing, with lesions less frequently observed between 24 and 72 h post-injury.45–47 Importantly, variable scan timing limits our ability to infer causality regarding the emergence of PSH symptomatology and to identify whether lesions represent primary or secondary injuries. Future prospective studies should control for post-injury imaging timing. Functional MRI (fMRI) may more directly assess functional neural network disconnection but is not routinely performed as part of clinical care for acute TBI patients.
Beyond our main findings of radiographic pathology associated with PSH, we replicated previous work identifying younger age as an independent predictor of PSH in adults following TBI. 48 We speculate that normal aging is associated with changes in baseline autonomic nervous system function, affecting individual susceptibility to PSH. Integrating this idea with the excitatory:inhibitory ratio model of PSH, others have proposed that younger patients may generate a stronger autonomic response to external stimulation and are therefore more likely to manifest PSH following damage to central autonomic inhibitory pathways. 32 Additionally, younger patients are more prone to high velocity mechanisms of injury predisposing to DAI and associated microhemorrhages that may mediate risk for PSH than are older adults who are more likely to sustain fall-related injuries. 49 More work is needed to clarify the mechanistic relationship between age and brain injury-related dysautonomia.
Conclusion
In summary, here we describe structural MRI lesions within the CAN associated with standard PSH metrics and clinical diagnosis in a large sample of critically ill TBI patients from a single level I trauma center. Among a priori CAN regions of interest, we found that hemorrhagic lesions of the CC and MTL were strongly independently associated with PSH diagnostic likelihood. These results contribute toward a more fundamental understanding of the neuroanatomical basis of PSH, which may support clinical diagnostic suspicion for PSH following acute TBI and may guide targeted therapeutic interventions.
Footnotes
Authors' Contributions
J.E.P., P.H., L.K.C., N.A.M., G.P., N.B.: conception and design of the study; J.E.P., U.K.B., M.P., L.M.S., P.H., G.T.S., B.A., N.B.: acquisition and analysis of data; J.E.P., E.W.M.: drafting a significant portion of the manuscript or figures.
Funding Information
Research funding for this work was provided by the University of Maryland Baltimore, Institute for Clinical & Translational Research (ICTR), grant number 1UL1TR003098, to the institutions of Dr. Podell and Dr. Chen.
Author Disclosure Statement
No competing financial interests exist.
Abbreviations Used
References
Supplementary Material
Please find the following supplemental material available below.
For Open Access articles published under a Creative Commons License, all supplemental material carries the same license as the article it is associated with.
For non-Open Access articles published, all supplemental material carries a non-exclusive license, and permission requests for re-use of supplemental material or any part of supplemental material shall be sent directly to the copyright owner as specified in the copyright notice associated with the article.