
Abstract
Computed tomography (CT) is an important imaging modality for guiding prognostication in patients with traumatic brain injury (TBI). However, because of the specialized expertise necessary, timely and dependable TBI prognostication based on CT imaging remains challenging. This study aimed to enhance the efficiency and reliability of TBI prognostication by employing machine learning (ML) techniques on CT images. A retrospective analysis was conducted on the Collaborative European NeuroTrauma Effectiveness Research in TBI (CENTER-TBI) data set (n = 1016). An ML-driven binary classifier was developed to predict favorable or unfavorable outcomes at 6 months post-injury. The prognostic performance was assessed using the area under the curve (AUC) over fivefold cross-validation and compared with conventional models that depend on clinical variables and CT scoring systems. An external validation was performed using the Comparative Indian Neurotrauma Effectiveness Research in Traumatic Brain Injury (CINTER-TBI) data set (n = 348). The developed model achieved superior performance without the necessity for manual CT assessments (AUC = 0.846 [95% CI: 0.843–0.849]) compared with the model based on the clinical and laboratory variables (AUC = 0.817 [95% CI: 0.814–0.820]) and established CT scoring systems requiring manual interpretations (AUC = 0.829 [95% CI: 0.826–0.832] for Marshall and 0.838 [95% CI: 0.835–0.841] for International Mission for Prognosis and Analysis of Clinical Trials in TBI [IMPACT]). The external validation demonstrated the prognostic capacity of the developed model to be significantly better (AUC = 0.859 [95% CI: 0.857–0.862]) than the model using clinical variables (AUC = 0.809 [95% CI: 0.798–0.820]). This study established an ML-based model that provides efficient and reliable TBI prognosis based on CT scans, with potential implications for earlier intervention and improved patient outcomes.
Introduction
Traumatic brain injury (TBI), characterized by a disruption in brain function from external forces to the head, ranks as is a primary cause of death and disability in trauma patients globally. 1,2 Annually, a significant number of TBI patients undergo initial evaluation at emergency departments. Healthcare professionals must depend on precise prognostication to provide tailored treatment and guidance for patients and their families. Computed tomography (CT) plays a crucial role in guiding prognostication, as CT findings delineate a wide range of structural effects of TBI. Although magnetic resonance imaging (MRI) may be more sensitive in detecting small white-matter lesions in later TBI stages or for follow-ups, CT remains the imaging modality of choice for initial TBI assessment because of its wider availability, cost effectiveness, and faster imaging process. 3 However, manually interpreting CT scans of head trauma can be complex and time intensive, necessitating specialized expertise. 4 Additionally, manual assessment may result in inconsistent predictions of outcomes. According to a study led by Sarigul and coworkers, discordant prognostic perspectives among clinicians are common, with >70% reporting occasional to frequent differences in prognostic viewpoints with their colleagues. 5
Several CT scoring systems – Marshall, 6 Rotterdam, 7 International Mission for Prognosis and Analysis of Clinical Trials in TBI (IMPACT), 8 and Helsinki 9 – have been proposed for a more efficient CT assessment. Yet, these systems can be demanding for some clinicians because of the requirement for manual measurements and meticulous classification of CT findings. This aligns with previous literature indicating that these systems are rarely used in medical practice. 5 The time required for measuring CT findings and variability in outcomes among clinicians often lead to non-standardized prognostications.
Machine learning (ML) techniques applied to CT imaging have recently garnered significant interest for TBI prognostication. 10 –12 However, most existing approaches rely on CT imaging features obtainable only through manual assessments, necessitating extensive clinical experience. 4 Consequently, there is a pressing need for an ML-based model capable of automatically predicting long-term outcomes using CT and clinical data to support clinicians of all expertise levels.
Recently, the Vision Transformer (ViT) 13 has emerged as a prominent ML advancement, offering a competitive alternative to convolutional neural networks. ViT has been successfully applied to various ML tasks, including classification, segmentation, and reconstruction, for two-dimensional (2D) images and three-dimensional (3D) data, such as videos. 14 This success has spurred efforts to adapt ViT for 3D medical imaging analysis, such as CT, by considering a video to be analogous to a patient's CT scan: each video frame corresponds to a CT slice capturing a section of the patient's body. 15
Nonetheless, merely substituting a video for a patient's CT scan does not suffice for creating ML-based TBI prognostic models. As indicated in prior research, 9 both CT imaging and clinical variables are needed as input data, rather than using either one exclusively. This finding suggests that a novel 3D ViT architecture accommodating multimodal inputs is needed, as opposed to conventional ViT architectures limited to single-modal inputs.
This study aims to develop a rapid and reliable prognostic model for TBI patients utilizing raw CT imaging data. We hypothesize that our proposed algorithm can predict long-term outcomes for TBI patients without manual CT assessments and yield superior prognoses compared with conventional models requiring manual CT interpretations.
The contributions of this study are as follows: (1) introduction of an ML-based model to predict 6-month outcomes using raw CT imaging and clinical data, without the need for manual CT assessments; (2) proposal of an effective method for multimodal inputs, substantially improving prognostic performance within the efficient 3D ViT architecture; (3) verification of our method's efficacy using the Collaborative European NeuroTrauma Effectiveness Research in TBI (CENTER-TBI), an international prospective TBI database; and (4) external validation to confirm our method's generalizability and applicability in clinical practice.
Methods
This investigation adhered to the Transparent Reporting of a Multivariable Prediction Model for Individual Prognosis or Diagnosis (TRIPOD) guidelines 16 for transparent reporting of studies.
Study population and data set
The CENTER-TBI and Comparative Indian Neurotrauma Effectiveness Research in Traumatic Brain Injury (CINTER-TBI) data sets were employed for model development and external validation, respectively.
CENTER-TBI data set
To construct a prognostic model, we incorporated data from a CENTER-TBI (version Core 3.0) study. 17 The data for the CENTER-TBI study have been collected through the Quesgen e-CRF (Quesgen Systems Inc., USA), hosted on the INCF platform and extracted via the INCF Neurobot tool (INCF, Sweden). The CENTER-TBI database consists of patients who were prospectively enrolled at >60 participating centers throughout Europe and Israel from December 19, 2014, to December 17, 2017. Inclusion criteria encompassed a clinical TBI diagnosis, CT scan indication, admission to the study center within 24 h of injury, and informed consent acquisition in accordance with local and national regulations. Exclusion criteria involved severe pre-existing neurological disorders that could confound outcome assessments. The CENTER-TBI study 18 prospectively designated patients to one of the following care pathways: emergency room assessment and discharge, hospital ward admission, or primary intensive care unit (ICU) admission. At 6 months post-injury, patient outcomes were assessed using the Glasgow Outcome Scale-Extended (GOSE), 19 a widely accepted instrument for evaluating disability and recovery following TBI. The clinical research team of CENTER-TBI conducted neuropsychological assessments and structured interviews/questionnaires to determine GOSE scores.
We utilized the following data from the CENTER-TBI database as predictors in our analyses: clinical variables (age, pupillary reactivity, and Glasgow Coma Scale [GCS] motor score); laboratory variables (glucose [mmol/L] and hemoglobin [g/dL]); and initial non-contrast brain CT scans obtained at a study hospital following injury.
CINTER -TBI data set
After developing a prognostic model utilizing the CENTER-TBI data set, we conducted an external validation using the CINTER-TBI data set, which encompasses data from 1046 patients with TBI admitted to two major trauma centers in New Delhi, India between July 2016 and December 2017. The CINTER-TBI study adhered to the same inclusion and exclusion criteria as the CENTER-TBI study. The key difference between these studies resides in the GOSE scoring methodology. Investigators in the CINTER-TBI study employed questionnaires, as opposed to the structured interviews used in CENTER-TBI, to inquire about patients' quality of life and subjective feelings. The final GOSE rating was determined based on the clinical judgment of the CINTER-TBI investigators. Moreover, whereas the CENTER-TBI study collected both clinical and laboratory variables, the CINTER-TBI data set only contained clinical variables. To address this discrepancy, we developed a model that did not depend on laboratory variables for external validation using the CINTER-TBI data set.
Outcome scale
All prognostic models examined in this study serve as binary classifiers for the dichotomized 6-month GOSE, distinguishing unfavorable outcomes (GOSE 1–4: death, vegetative state, severe disability) from favorable ones (GOSE 5–8: moderate disability, good recovery), a classification method that has been widely employed in previous research. 20,21 The binary classifier produces a probability of an unfavorable outcome at 6 months post-injury. Consequently, the model's prediction is anticipated to be high for patients with unfavorable outcomes and low for those with favorable outcomes. The ground truth 6-month GOSE for training the classifier were retrieved from the actual patient outcomes recorded in the CENTER-TBI data set. The potential expansion from binary to a multi-class classifier for predicting more detailed GOSE categories will be addressed later in the Discussion.
Baseline models
Several baseline models were introduced to compare their prognostic performance with our proposed model (Table 1).
Flow Chart Illustrating the Patient Selection Process
CT, computed tomography; IMPACT, International Mission for Prognosis and Analysis of Clinical Trials in Traumatic Brain Injury.
The first category of baseline models features a scalar predictor, also referred to as the IMPACT core model, 8 which is computed by summing up three clinical variables (age, pupillary reactivity, and motor score from GCS). Another baseline model, known as the IMPACT laboratory model, 8 incorporates both clinical and laboratory variables (glucose and hemoglobin) and employs a scalar predictor on a scale of 0–7 to estimate the 6-month outcome. In alignment with the IMPACT study paper, 8 which employs a scalar for TBI outcome prediction, we similarly used scalar values for clinical and laboratory variables. Although it is technically feasible to treat these variables separately and form a vector, using scalar input was chosen for an equitable comparison of prognostic abilities between our algorithm and the IMPACT-based models.
In the second category, the baseline models are established on CT scoring systems that systematically quantify CT findings pertinent to TBI prognostication. The systems considered in this study include Marshall, 6 Rotterdam, 7 IMPACT, 8 and Helsinki. 9 They offer scalar indicators, relying on the presence or absence of typical CT findings among TBI patients (e.g., traumatic subarachnoid hemorrhage, subdural hematoma, midline shift). Notably, these systems do not generate prognoses automatically. Manual interpretation and measurement are mandatory to assess CT findings and calculate CT scores. The manually calculated, verified, and recorded CT scores in the CENTER-TBI database were used in our analyses.
The third category of baseline models relies on both clinical variables and CT scoring systems. The predictor is a 2D vector, with one component representing a score from one of the CT scoring systems (Marshall, Rotterdam, or Helsinki) and the other component derived from the IMPACT core model. For the IMPACT-based CT scoring system, we employed an extended model proposed in the literature 8 that combined scores of clinical variables and CT findings to produce a scalar predictor.
The fourth category incorporates CT findings, clinical variables, and laboratory variables, using 2D vectorized predictors. The first element is the sum of the IMPACT core or IMPACT laboratory models, and the second element is a score from one of the CT scoring systems (Marshall, Rotterdam, or Helsinki). An IMPACT extended model was utilized, combining clinical variables, CT findings, and laboratory variables to produce a scalar predictor. The IMPACT extended model's prior adoption in the context of TBI prognostication is well noted in the literature. 9
Each of the four baseline models inputs either a single scalar or a two-element vector into the 3D-ViT model's classification head (refer to Document S1 for more details), functioning comparably to a logistical regression classifier. The output from this classification head is expressed as a probability, ranging from zero to one, predicting the likelihood of an unfavorable outcome 6 months post-injury. It is important to note that the original IMPACT study did not explicitly propose a prognostic model based solely on laboratory variables or CT findings. These models were introduced in our study as baselines to illustrate the potential of single-modality-based predictions and their comparison with our proposed algorithm. The methodology for calculating the input values for these baseline models was adapted from the calculator presented in the IMPACT study. 8
The clinical variables, scores from the CT scoring systems, and laboratory variables used for these baseline models were all extracted from the CENTER-TBI data set. Detailed information on the clinical and laboratory variables, as well as data curation conducted in the CENTER-TBI data set, can be found in previous CENTER-TBI studies. 17,18
Algorithm design
Current CT scoring systems necessitate manual assessments to identify and quantify CT findings for calculating prognostic scores. This makes timely and reliable TBI prognostication using these systems challenging. We sought to develop an ML algorithm that can interpret CT imaging data automatically, thus eliminating manual assessments. This method provides end-to-end prognostication, allowing direct prognosis computation from raw CT data without human intervention, and the ML algorithm was anticipated to identify imaging features relevant to TBI prognostication.
More importantly, our model does not merely input raw CT images into pre-existing ML models. Instead, we leveraged a 3D ViT-based model, originally for video recognition, for CT imaging. The original 3D ViT model accepted only single-modal input (primarily video data) and did not accommodate multimodal predictors (such as clinical variables, laboratory variables, and CT images). Several studies have explored multimodal inputs within the medical imaging field, a concept known as early fusion techniques. 22 However, as subsequently demonstrated, the conventional early fusion approach underperformed in the context of TBI prognostication. To address this limitation, we proposed an augmented early fusion technique as a simple and effective solution for TBI prognostication, suitable for implementation within the 3D ViT-based architecture. The details of input data, pre-processing, 3D ViT architecture, and the augmented early fusion technique can be found in the supplementary material (Documents S1 and S2).
All ML models were implemented with the PyTorch framework on a workstation with two NVIDIA GeForce 3090 GPU cards, each with 24 GB of memory.
Algorithm evaluation
We developed a model that predicts the probability of unfavorable outcomes for each CT scan. Ideally, the model's predictions should be one for patients with unfavorable outcomes and zero for patients with favorable outcomes. We assessed the performance of our proposed algorithm and baseline models using a fivefold cross-validation on the CENTER-TBI data set, based on the following metrics: area under the curve (AUC), sensitivity, and specificity. Following internal validation, we performed external validation by calculating the evaluation metrics on the CINTER-TBI data set using models pre-trained on the CENTER-TBI data set.
To dichotomize predictions (unfavorable vs. favorable), we employed the Youden index 23 for determining cutoff points. The Youden index (or Youden's J statistic) is quantified as J = sensitivity + specificity – 1. 24 We chose the threshold at which the maximum Youden index was observed, which is a common practice in determining optimal cutoff points in medical literature. 25
Subgroup analysis
We further evaluated our algorithm's performance within specific subgroups by comparing it with one of the baseline models. Participants were divided into three severity subgroups based on the GCS: mild (GCS = 3–8), moderate (GCS = 9–12), and severe (GCS = 13–15). GCS scores were available for all patients in the CENTER- and CINTER-TBI data sets. We calculated the evaluation metrics for each severity subgroup to determine the proposed method's applicability across different severity levels.
Discordant case analysis
We investigated discordant cases in which baseline and developed model predictions differed, categorizing them as: (1) true predictions by the baseline model and false predictions by the developed model, or (2) false predictions by the baseline model and true predictions by the developed model. The ground truth values for 6-month GOSE were drawn from actual patient outcomes in the CENTER-TBI data set. We designated the first category as “degraded cases” and the second category as “improved cases.” We tallied and compared these cases between the developed and a baseline model trained on the CENTER-TBI data set.
Statistical analysis
To assess the prognostic performance between the baseline and the developed models, we calculated a 95% confidence interval (CI) of AUC utilizing a non-parametric bootstrapping method. 26 Fifty non-training data points were randomly selected with replacement, and the bootstrapping procedures were repeated 2000 times. In subgroup analysis, we reported 95% CI for both sensitivity and specificity, applying the same bootstrapping method to each subgroup. The bootstrapping CI was computed using Bstrap, a Python package for CIs with the bootstrapping method.
In the discordant analysis, we investigated the distribution of each CT finding in both degraded and improved cases to identify specific CT findings that contributed to prediction discrepancies (degraded vs. improved). This aimed to assess the effect of particular CT findings on prediction discrepancies. A χ 2 independence test with a null hypothesis of no association between patient CT finding and prediction discrepancy was conducted. CT findings typical among TBI patients were examined, including traumatic subarachnoid hemorrhage, acute subdural hematoma, intraparenchymal hemorrhage, skull fracture, mass lesion, cisternal compression, ventricular compression, intraventricular hemorrhage, midline shift, cortical sulcus effacement, brain herniation, diffuse axonal injury (traumatic axonal injury), and epidural hematoma. The analysis was conducted using R (version 4.2.2).
Results
Patient characteristics
From 4510 patients in the CENTER-TBI data set, we excluded: (1) those missing clinical variables, laboratory variables, or CT scans (n = 3056), (2) those with inadequate CT scans; that is, blank or not encompassing the brain (n = 412), and (3) pediatric patients, meaning those <15 years of age (n = 26), leaving 1016 patients (median age 53.0 [32–68], 69.4% male) for analysis. Included were 49.7% with mild trauma and 35.4% with severe conditions. The supplementary material includes a flow chart depicting the patient selection process (Fig. S1).
By using identical criteria for the CINTER-TBI data set, we included 348 patients (median age 32 [23–45], 80.2% male) for external validation. Favorable outcomes at 6 months were 88.2% in the CINTER-TBI data set, and >63.4% in the CENTER-TBI data set. The CINTER-TBI study did not collect laboratory variables.
A summary of patient characteristics in the CENTER-TBI and CINTER-TBI data sets represents a wide spectrum of TBI (Table 2). A summary of characteristics for all patients, including those excluded from the CENTER-TBI data set, is available in the supplementary material (Table S1). Despite minor disparities, parallel trends were observed in both included and excluded patients regarding their attributes. Table S2 details patient characteristics in the CENTER-TBI data set, including other clinical presentations (GCS values, presence/absence of hypoxia and hypotension), and CT interpretations (Marshall, Rotterdam, Helsinki, lesions in radiological reports) concerning 6-month outcomes.
Patient Characteristics in CENTER- and CINTER-TBI Data Sets
Median values are shown with interquartile ranges (IQRs) for continuous variables, and frequencies and percentages are provided for categorical variables.
Prognostic performance using CT scans
To evaluate the capacity of CT interpretation, we initially assessed the performance of existing CT scoring systems and our developed model using only CT scans, without reliance on clinical and/or laboratory variables. The AUC for the previously established CT scoring systems was 0.720 (95% CI: 0.717–0.723), 0.732 (95% CI: 0.729–0.735), 0.762 (95% CI: 0.758–0.766), and 0.775 (95% CI: 0.771–0.779) for Marshall, Rotterdam, IMPACT, and Helsinki, respectively. Our proposed method, employing raw CT scans without the need for manual CT findings, as required by traditional CT scoring systems, achieved an AUC of 0.788 (95% CI: 0.785–0.791), significantly outperforming all existing CT scoring systems. This result indicates that our model effectively extracted imaging features crucial for prognosticating TBI patients, akin to the information provided by manual CT assessments in the CT scoring systems. We will explore the details of the extracted imaging features and the model's interpretability in the Discussion section.
Prognostic performance utilizing clinical and laboratory variables and CT scans
We assessed prognostic performance by integrating clinical and laboratory variables (Table 3). A model relying solely on clinical and laboratory variables had an AUC of 0.817 (95% CI: 0.814–0.820). With the inclusion of Marshall, Rotterdam, IMPACT, and Helsinki CT scores, the AUC increased to 0.829 (95% CI: 0.826–0.832), 0.830 (95% CI: 0.826–0.833), 0.838 (95% CI: 0.835–0.841), and 0.842 (95% CI: 0.839–0.845), respectively. These results align with a previous study, 9 emphasizing that CT findings enhance AUC when combined with clinical and laboratory variables. Our model employing the augmented early fusion (AEF) technique achieved an AUC of 0.846 (95% CI: 0.843–0.849), significantly outperforming models utilizing Marshall, Rotterdam, and IMPACT, but not significantly differing from the Helsinki-based models. Although our model did not require manual CT analysis, conventional CT scoring systems did. Nevertheless, our proposed algorithm matched or exceeded the performance of existing CT scoring systems in AUC.
Prognostic Performance of Baseline Models and our Developed Models
The performance of the developed model is shown when augmented early fusion was applied with the optimal parameter (k = 784).
CT, computed tomography; AUC, area under the curve; IMPACT, International Mission for Prognosis and Analysis of Clinical Trials in Traumatic Brain Injury.
When incorporating clinical and laboratory variables with CT scans (Table 3), our developed model exhibited a sensitivity and specificity of 0.774 (95% CI: 0.768–0.781) and 0.777 (95% CI: 0.770–0.783), respectively, significantly surpassing the baseline model utilizing variables alone (0.673 [95% CI: 0.667–0.679] and 0.762 [95% CI: 0.756–0.784]). Enhanced performance was also observed when adding clinical variables (Table 3). These findings demonstrate the effectiveness of our proposed automated TBI prognostication framework.
Subgroup analysis
Evaluation metrics are depicted for severity-based subgroups, using a baseline model incorporating clinical and laboratory variables (Table 4). The developed model's AUC surpassed the baseline model's AUC across all subgroups (0.780 [95% CI: 0.776–0.784] and 0.804 [95% CI: 0.800–0.809] for mild , 0.786 [95% CI: 0.783–0.790] and 0.855 [95% CI: 0.853–0.857] for moderate, and 0.745 [95% CI: 0.742–0.748] and 0.795 [95% CI: 0.792–0.798] for severe cases, respectively). Sensitivity improvement was notably significant in severe cases (0.547 [95% CI: 0.539–0.556] for the baseline and 0.727 [95% CI: 0.722–0.732] for the developed model). In terms of specificity, the developed model significantly outperformed the baseline model in moderate cases (0.517 [95% CI: 0.506–0.527] for the baseline and 0.762 [95% CI: 0.722–0.732] for the developed model) and mild cases (0.676 [95% CI: 0.671–0.682] for the baseline and 0.783 [95% CI: 0.778–0.789] for the developed model).
Prognostic Performance in Relation to Glasgow Coma Scale (GCS)-Based Severities
The baseline model utilized clinical and laboratory variables, whereas the developed model incorporated these variables and computed tomography scans as predictors. Augmented early fusion was applied to the developed model with the optimal parameter (k = 784).
AUC, area under the curve.
Discordant case analysis
In this analysis, we compared two models that had comparable AUC: one combining clinical and laboratory variables with the Helsinki CT score, and the other employing our algorithm, using CT scans with these variables. Of 186 discordant cases (18.3%), 94 were degraded (9.3%) and 92 were improved cases (9.1%) throughout fivefold cross-validation. Ground truth outcomes were 61 (64.9%) favorable and 33 (35.1%) unfavorable for degraded cases, and 68 (73.9%) favorable and 24 (26.1%) unfavorable for improved cases. A statistically significant association between CT findings and prediction discrepancies was observed when the following CT findings were present: traumatic subarachnoid hemorrhage (p = 0.023), intraparenchymal hemorrhage (p = 0.022), cisternal compression (p < 0.01), ventricular compression (p < 0.01), intraventricular hemorrhage (p = 0.018), midline shift (p = 0.027), brain herniation (p = 0.038), and diffuse axonal injury (p < 0.01). Figure S2 shows distributions of all these CT findings for degraded and improved cases.
External validation
The prognostic ability was evaluated on the CINTER-TBI data set (Table 3) utilizing only clinical variables as laboratory variables were absent. The AUC for the baseline and our model were 0.809 (95% CI: 0.798–0.820) and 0.802 (95% CI: 0.798–0.805) respectively. With the inclusion of CT scans, the AUC increased to 0.859 (95% CI: 0.857–0.862), significantly outperforming the baseline model that utilized only clinical variables. This AUC value (0.859) is even higher than the 0.846 achieved in the CENTER-TBI data set. Specificity was significantly improved; 0.539 (95% CI: 0.527–0.552) for baseline and 0.874 (95% CI: 0.871–0.877) for the developed model. No significant difference was detected between the baseline and developed models in terms of sensitivity (0.703 [95% CI: 0.692–0.713] and 0.708 [95% CI: 0.707–0.708]). These findings corroborate the prognostic performance seen in the model development using the CENTER-TBI data set, verifying the generalizability of our algorithm.
Multi-class GOSE prediction
Up to this point, our investigation of TBI prognostication has focused on binary classification; specifically, distinguishing between unfavorable (GOSE = 1–4) and favorable (GOSE = 5–8) outcomes. Nevertheless, the original purpose of the GOSE scale was to categorize patient outcomes into eight distinct categories: (1) dead, (2) vegetative state, (3) lower severe disability, (4) upper severe disability, (5) lower moderate disability, (6) upper moderate disability, (7) lower good recovery, and (8) upper good recovery. 1 Consequently, in this subsection, we extend our proposed algorithm to multi-class classification tasks and explore multi-class GOSE prognostic models.
Initially, we performed a four-class GOSE prediction using the CENTER-TBI data set, with the following categories: dead (GOSE = 1), vegetative state or severe disability (GOSE = 2–4), moderate disability (GOSE = 5–6), and good recovery (GOSE = 7–8). Subsequently, we trained and evaluated a seven-class GOSE prediction; GOSE = 1, GOSE = 2 or 3, GOSE = 4, … , GOSE = 8. We note that the original CENTER-TBI data set did not distinguish between GOSE = 2 and 3, so these classes were merged. The experimental settings remained the same as for binary classification, with the exception that the binary classification head of TimeSformer with a sigmoid activation function was replaced by a multi-class head with a softmax activation function.
The AUC for a baseline model using clinical and laboratory variables and the developed model was 0.713 and 0.758 for the four-class task, and 0.651 and 0.688 for the seven-class prediction, respectively.
Discussion
In this study, we developed a novel ML-based prognostic model that exhibits superior predictive ability for 6-month outcomes compared with existing models utilizing CT scores. Our method's enhanced prognostic performance was further corroborated through external validation. Unlike previous studies, our model removes the need for manual CT assessments, possibly mitigating accessor bias. 27 The development of clinical decision support software founded on our algorithm might help clinicians to promptly and accurately prognosticate TBI patients, regardless of clinician's expertise level, thus contributing to timely treatment and enhanced patient outcomes.
Predictive ability
The predictive ability of our proposed model surpasses most baseline models in AUC, even without manual assessments (Table 3). Notably, this enhanced prognostic performance was preserved during external validation, suggesting that our algorithm is applicable to a diverse population of TBI patients. The AUC of the developed model (0.859) in external validation exceeded the AUC of 0.846 from internal validation using the CENTER-TBI data set. This improvement is noteworthy, as the predictive ability of ML models often decreases during external validation. Such increased generalizability likely arises from training on the CENTER-TBI data set, comprising data from >60 centers across Europe and encompassing a broad range of CT imaging conditions. Therefore, the model trained on CENTER-TBI data is expected to learn diverse imaging features that can generalize to CT scans in other clinical facilities, including those in which the CINTER-TBI study was conducted.
Our model demonstrated a significant improvement in sensitivity within the severe subgroup compared with the baseline model (Table 4). This improvement may be the result of critical CT findings in severe cases that characterize patient outcomes. The developed algorithm appeared to focus more on these findings in severe cases, enhancing severity in this group. Such improvement could reduce treatment failures among less-seasoned trainees or clinicians not specializing in TBI by minimizing the likelihood of overlooking severe patients who may experience unfavorable outcomes. Additionally, a substantial increase in specificity was noted among mild and moderate cases, potentially leading to reduced unnecessary clinical intervention for those expected to have favorable outcomes.
Both the Helsinki-based and our developed models displayed comparable AUC using clinical and laboratory variables. The discordant analysis indicated that prediction discrepancies between these models correlated with certain CT findings, contributing to more improved cases. Notably, many of these CT findings, including traumatic subarachnoid hemorrhage, intraparenchymal hemorrhage, and midline shift, were not components of the Helsinki CT score. This suggests that our model enhanced prognostic prediction when Helsinki CT score components were absent. Conversely, when some CT findings in the Helsinki CT score, such as subdural hematoma, mass lesion, and epidural hematoma, were present, the association between these findings and prediction discrepancy was not statistically meaningful. It implies that the performance of our proposed model and the Helsinki-based model were equivalent when Helsinki's components were present, showing that our approach, focusing on raw CT imaging, considers not only the Helsinki CT score's components but also various TBI-related CT findings.
Visualization of extracted imaging features
The lower AUC in multi-class predictions, compared with binary class prediction, likely stem from the blurred boundaries within the GOSE scale. To investigate this, imaging features were extracted from one of the middle layers in the pre-trained TimeSformer model (Fig. 1). We utilized UMAP, 28 a well-known non-linear dimension reduction algorithm, to visualize the multi-dimensional extracted features on a 2D plane. Two hyper-parameters in UMAP, local neighborhood size and minimum distance apart, were set at 15 and 0.1, respectively. If the ground truth GOSE had clear boundaries among each class, several clusters would be identifiable. However, no distinct clusters were observed for four- and seven-class predictions, unlike the binary classification task (Fig. 1). This indicates that the weaker prognostic performance in multi-class prediction is not the result of our proposed ML-driven approach's limitations, but rather of the blurred boundaries inherent in the GOSE scale, an imperfection noted in prior studies. 21,29 Therefore, binary classification seems a reasonable approach as long as ML uses GOSE as ground truth data.
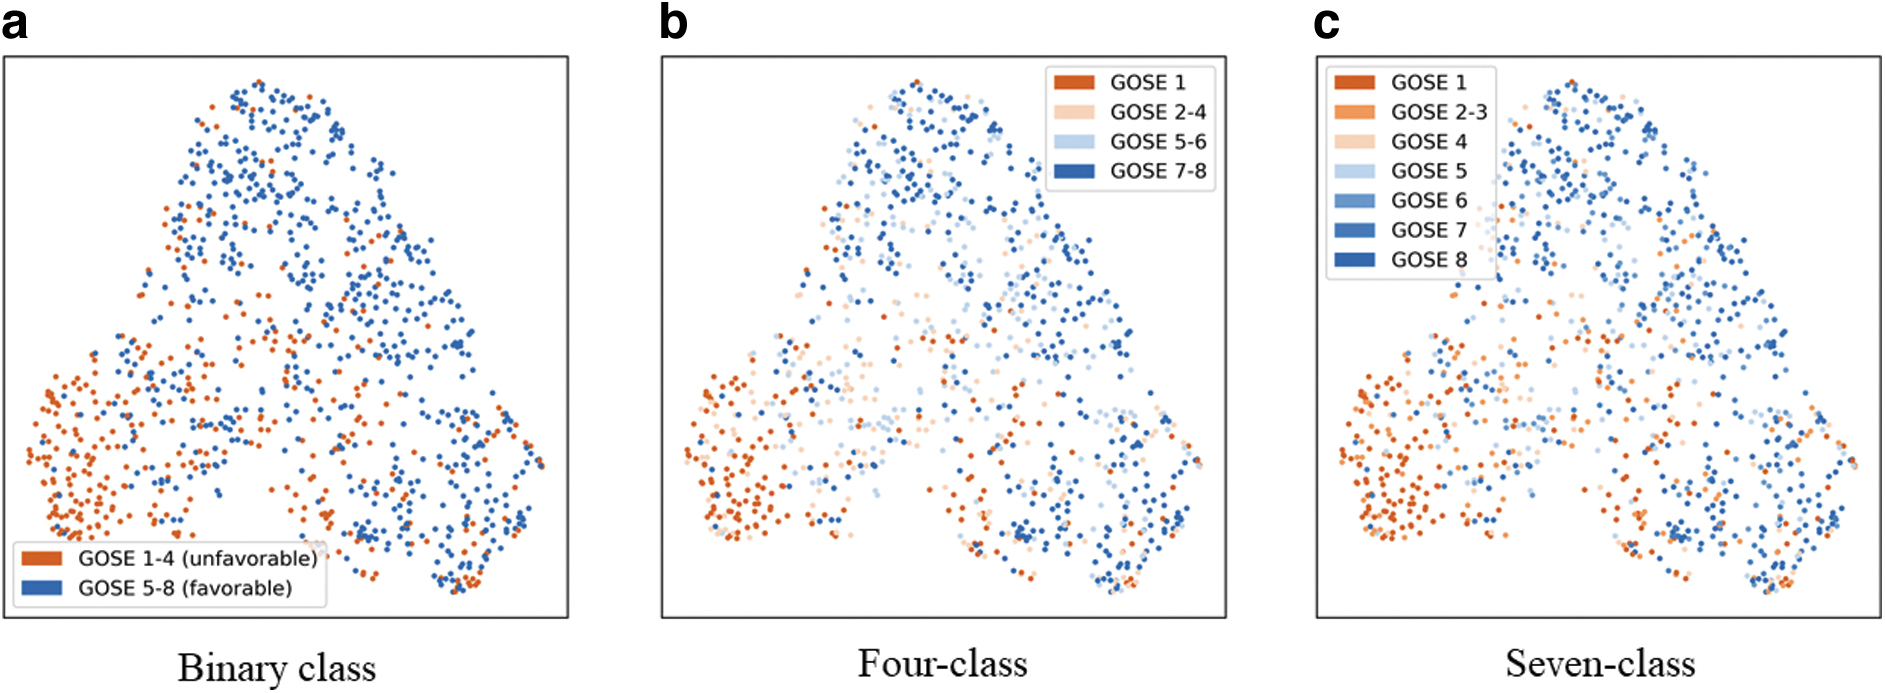
Two-dimensional representation of imaging features extracted from a pre-trained TimeSformer model.
Visualization through saliency map
We present a saliency map obtained by applying our developed model to the CENTER-TBI data set (Fig. 2). The saliency map delineates the degree of influence on prediction, signifying the areas that the ML model pays attention to during the prediction phase. We employed the attention rollout scheme, 30 a technique for quantifying information flow by utilizing attention weights in 3D ViT, to visualize the regions that our model focused on during prediction. Figure displays the saliency map for a CT slice without any TBI-related abnormalities, indicating that the model primarily attended to the interior of the brain uniformly, whereas areas outside the brain exhibited minimal association with decision making. Figure 2b and c depict the saliency maps for CT slices with skull fracture and intraparenchymal hemorrhage, respectively: typical abnormalities observed in CT scans of TBI patients. 1 These findings suggest that our model was trained to prioritize attention on TBI-related lesions over normal brain regions during the prognostication process, akin to how clinicians perform manual assessments. 1
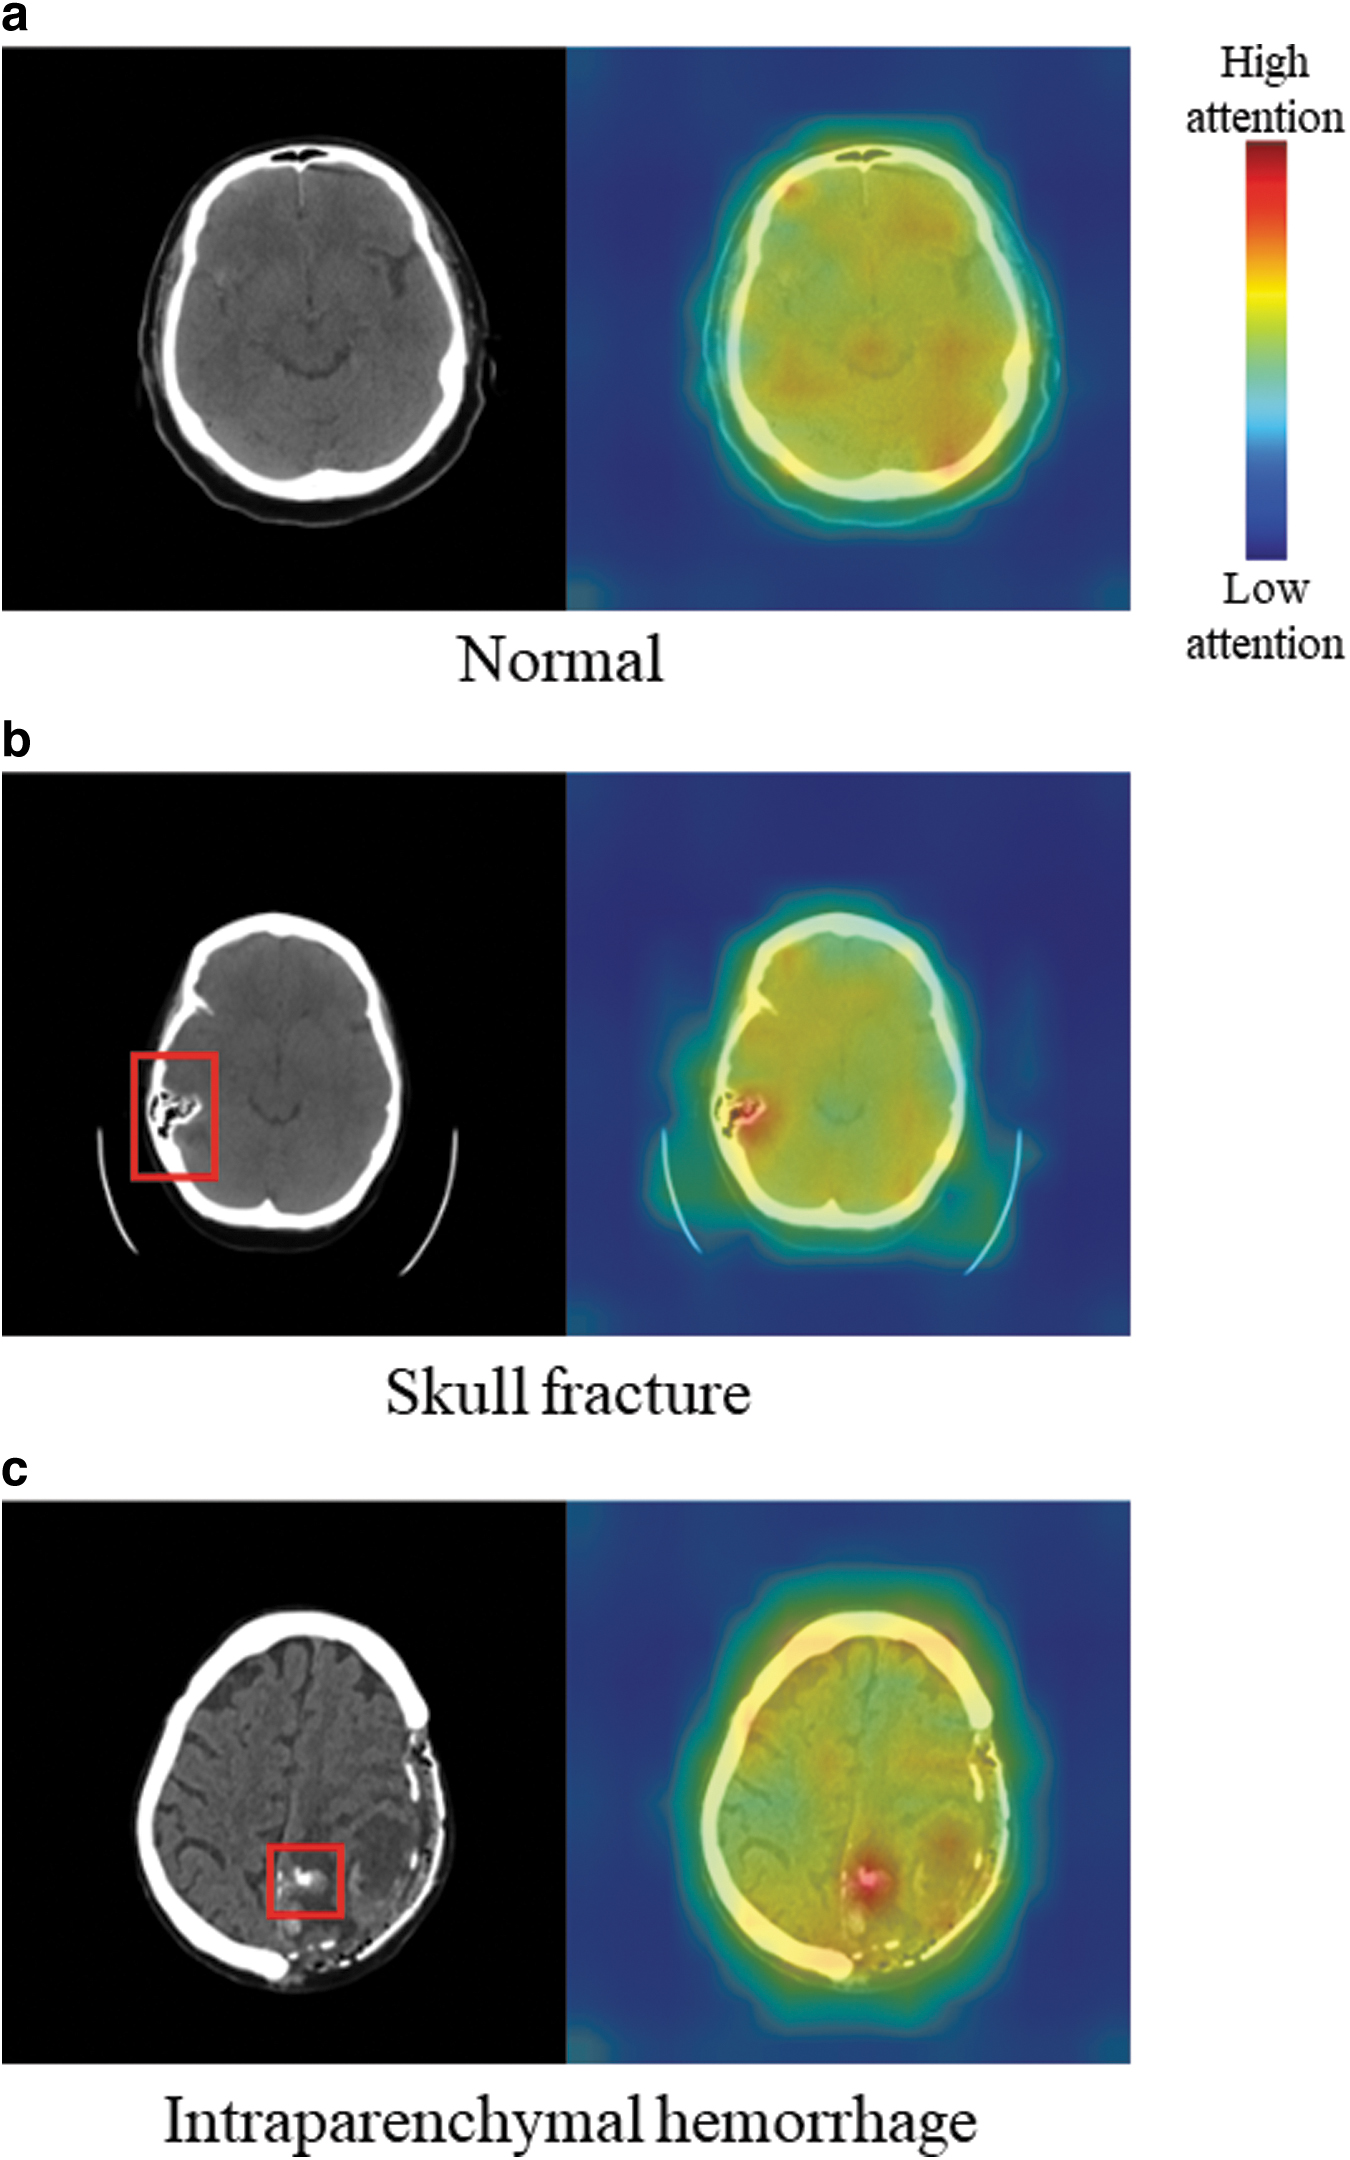
Visualization of the regions where the developed model allocated attention. Left: input computed tomography (CT) slices with
The CENTER-TBI data set's diversity, featuring scans from >60 centers, allowed our model to learn from a wide range of imaging conditions, including different scanners and quality variations. This broad learning base suggests that the saliency map generated by our model can be more generalizable than those from models trained on more homogeneous data sets. However, it is important to note that the saliency map's role is to illustrate our model's reasoning for providing explainability, not for clinical decision making. The map simply highlights the model's focus on relevant brain regions and avoidance of non-pertinent areas, underscoring the effectiveness of our training process.
Related studies
Several significant prior studies on TBI prognostication are relevant to our work. Yao and coworkers 12 proposed an ML-based approach for predicting mortality among TBI patients, employing imaging features related to the shape and volume of segmented hematoma as predictors. However, this method required hematoma segmentation before mortality prediction and used hand-crafted features, thereby limiting the number of contributing imaging features. In contrast, our model offers a fully end-to-end prediction of long-term outcomes, enabling prognostication to be directly computed from CT scans and clinical variables. Moreover, as the extracted features are automatically acquired during model training, a greater number of valuable imaging features can be expected to contribute to prognostication. Pease and coworkers 31 constructed an ML-based prognostic model utilizing CT images and clinical variables. Although their study appears analogous to our multimodal approach, key differences are evident in the requirement for manual interpretations. Pease's methodology necessitates expert manual selection of representative CT slices for input data. In contrast to this earlier work, our model eliminates the need for manual CT evaluations, facilitating prompt prognostication of TBI patients by clinicians, irrespective of their expertise level.
Another important study by Tehrani and coworkers 32 proposed a method for COVID-19 mortality prediction using 3D ViT with inputs of CT scans and clinical variables. They generated an imaginary 2D image comprising clinical variables and positioned it after the final CT slice as an additional channel. However, this approach lacks clinical validity in treating clinical variables as a spatially continuous CT slice. In contrast, our study merged clinical variables with an imaging feature vector using the AEF approach, a method consistent with previous medical literature 9 in fusing multimodal medical data.
Limitations
This study presents several limitations. First, a restricted set of clinical and laboratory variables were utilized as predictors, including core clinical variables (age, pupil reactivity, and motor score) and laboratory variables (glucose and hemoglobin). These were chosen because a prior study of TBI prognostication 8 showed that they have critical importance. Incorporating a broader array of predictors, such as biomarkers, pathological data, and genomic information, could enhance performance and enable more accurate identification of patients with favorable versus unfavorable prognoses.
Second, the data set employed for external validation was not fully balanced with respect to long-term outcomes and age distribution. Approximately 88% of patients in the CINTER-TBI data set exhibited favorable outcomes, with younger patients predominantly represented (Table 2). Further external validation using balanced data would reinforce the assessment of our proposed algorithm's applicability and generalizability. An additional limitation is that not all layers of our developed model were trained to update internal weights. We adopted a computationally efficient 3D ViT architecture and fine-tuned it to accommodate large-capacity CT data. Although large computational resources, such as >30 GPUs, may be recommended, 14 training the entire TimeSformer architecture could capture more imaging features characterizing TBI patients' long-term outcomes. This enhancement may also improve saliency maps, as there were instances in which the developed model did not fully consider presenting hematomas.
Future research directions
Our study employed a dichotomized GOSE prediction with a fixed threshold (cutoff point) among the eight recovery levels, but lacks empirical justification for an ideal GOSE threshold. 21 Further, because the current GOSE's eight classes may have subtle and overlapping boundaries, dichotomization could potentially discard valuable information on varying levels of patient recovery. 29 This notion is supported by our observations (Fig. 1), which showed that extracted imaging features from patients with different GOSE scores were not distinctly clustered. Investigating a new ordinal measure with clear boundaries for describing long-term outcomes could contribute to more reliable TBI prognostic models. This study primarily focuses on CT imaging for TBI prognostication, yet other modalities, such as MRI, are also important in assessing patient outcomes. Investigating the inclusion of multiple imaging types is a promising avenue for future research.
Conclusion
This study developed an innovative TBI prognostic model that significantly outperforms many existing models in predicting 6-month outcomes. The effectiveness of our proposed method was further substantiated through external validation. Unlike previous models that require manual CT assessments and clinical expertise, our developed model autonomously extracts critical imaging features and estimates patient outcomes regardless of the assessor's experience. By delivering rapid and reliable prognostications, the developed model holds potential to support clinical decision-making processes related to the treatment of TBI patients.
Transparency, Rigor, and Reproducibility Summary
We conducted a retrospective analysis on the CENTER-TBI dataset to develop an ML-based binary classifier for predicting 6-month post-injury outcomes, using a sample size of 1016 participants from the primary data set and 348 participants from the CINTER-TBI data set for external validation. The prognostic performance, assessed over fivefold cross-validation, demonstrated our ML model's superiority with an AUC of 0.846 (95% CI: 0.843–0.849), further confirmed in external validation with an AUC of 0.859 (95% CI: 0.857–0.862). CENTER-TBI's data sharing policy, detailed at CENTER-TBI's Web site, ensures post-publication accessibility of individual participant data to researchers with approved study proposals, adhering to the original study's regulatory restrictions.
Footnotes
Acknowledgments
We gratefully thank all CENTER-TBI and CINTER-TBI participants and investigators.
CENTER-TBI and CINTER-TBI Participants and Investigators
Cecilia Åkerlund, Krisztina Amrein, Nada Andelic, Lasse Andreassen, Audny Anke, Anna Antoni, Gérard Audibert, Philippe Azouvi, Maria Luisa Azzolini, Ronald Bartels, Pál Barzó, Romuald Beauvais, Ronny Beer, Bo-Michael Bellander, Antonio Belli, Habib Benali, Maurizio Berardino, Luigi Beretta, Morten Blaabjerg, Peter Bragge, Alexandra Brazinova, Vibeke Brinck, Joanne Brooker, Camilla Brorsson, Andras Buki, Monika Bullinger, Manuel Cabeleira, Alessio Caccioppola, Emiliana Calappi, Maria Rosa Calvi, Peter Cameron, Guillermo Carbayo Lozano, Marco Carbonara, Simona Cavallo, Giorgio Chevallard, Arturo Chieregato, Ajay Choudhary, Giuseppe Citerio, Hans Clusmann, Mark Coburn, Jonathan Coles, Jamie D. Cooper, Marta Correia, Amra Čović, Nicola Curry, Endre Czeiter, Marek Czosnyka, Claire Dahyot-Fizelier, Paul Dark, Helen Dawes, Vincent Degos, Véronique De Keyser, Francesco Della Corte, Hugo den Boogert, Bart Depreitere, Đula Đilvesi, Abhishek Dixit, Emma Donoghue, Jens Dreier, Guy-Loup Dulière, Ari Ercole, Patrick Esser, Erzsébet Ezer, Martin Fabricius, Valery L. Feigin, Kelly Foks, Shirin Frisvold, Alex Furmanov, Pablo Gagliardo, Damien Galanaud, Dashiell Gantner, Guoyi Gao, Pradeep George, Alexandre Ghuysen, Lelde Giga, Ben Glocker, Jagoš Golubovic, Pedro A. Gomez , Johannes Gratz, Benjamin Gravesteijn, Francesca Grossi, Russell L. Gruen, Deepak Gupta, Juanita A. Haagsma, Iain Haitsma, Raimund Helbok, Eirik Helseth, Lindsay Horton, Jilske Huijben, Peter J. Hutchinson, Bram Jacobs, Stefan Jankowski, Mike Jarrett, Ji-yao Jiang, Faye Johnson, Kelly Jones, Mladen Karan, Angelos G. Kolias, Erwin Kompanje, Daniel Kondziella, Evgenios Kornaropoulos, Lars-Owe Koskinen, Noémi Kovács, Ana Kowark, Alfonso Lagares, Linda Lanyon, Steven Laureys, Fiona Lecky, Didier Ledoux, Rolf Lefering, Valerie Legrand, Aurelie Lejeune, Leon Levi, Roger Lightfoot, Hester Lingsma, Andrew I.R. Maas, Ana M. Castaño-León, Marc Maegele, Marek Majdan, Alex Manara, Geoffrey Manley, Costanza Martino, Hugues Maréchal, Julia Mattern, Catherine McMahon, Béla Melegh, David Menon, Tomas Menovsky, Ana Mikolic, Benoit Misset, Visakh Muraleedharan, Lynnette Murray, Ancuta Negru, David Nelson, Virginia Newcombe, Daan Nieboer, József Nyirádi, Otesile Olubukola 7 , Matej Oresic, Fabrizio Ortolano, Aarno Palotie, Paul M. Parizel, Jean-François Payen, Natascha Perera, Vincent Perlbarg, Paolo Persona, Wilco Peul, Anna Piippo-Karjalainen, Matti Pirinen, Dana Pisica, Horia Ples, Suzanne Polinder, Inigo Pomposo, Jussi P. Posti, Louis Puybasset, Andreea Radoi, Arminas Ragauskas, Rahul Raj, Malinka Rambadagalla, Isabel Retel Helmrich, Jonathan Rhodes, Sylvia Richardson, Sophie Richter, Samuli Ripatti, Saulius Rocka, Cecilie Roe, Olav Roise, Jonathan Rosand, Jeffrey V. Rosenfeld, Christina Rosenlund, Guy Rosenthal, Rolf Rossaint, Sandra Rossi, Daniel Rueckert, Martin Rusnák, Juan Sahuquillo, Oliver Sakowitz, Renan Sanchez-Porras, Janos Sandor, Nadine Schäfer, Silke Schmidt, Herbert Schoechl, Guus Schoonman, Rico Frederik Schou, Elisabeth Schwendenwein, Charlie Sewalt, Ranjit D. Singh, V. D. Sinha,Toril Skandsen, Peter Smielewski, Abayomi Sorinola, Emmanuel Stamatakis, Simon Stanworth, Robert Stevens, William Stewart, Ewout W. Steyerberg, Nino Stocchetti, Nina Sundström, Riikka Takala, Viktória Tamás, Tomas Tamosuitis, Mark Steven Taylor, Aurore Thibaut, Braden Te Ao, Olli Tenovuo, Alice Theadom, Matt Thomas, Dick Tibboel, Marjolein Timmers, Christos Tolias, Tony Trapani, Cristina Maria Tudora, Andreas Unterberg, Peter Vajkoczy, Shirley Vallance, Egils Valeinis, Zoltán Vámos, Mathieu van der Jagt, Joukje van der Naalt, Gregory Van der Steen, Thijs Vande Vyvere, Jeroen T.J.M. van Dijck, Inge A. M. van Erp, Thomas A. van Essen, Wim Van Hecke, Caroline van Heugten, Ernest van Veen, Roel P. J. van Wijk, Alessia Vargiolu, Emmanuel Vega, Kimberley Velt, Jan Verheyden, Paul M. Vespa, Anne Vik, Rimantas Vilcinis, Victor Volovici, Nicole von Steinbüchel, Daphne Voormolen, Petar Vulekovic, Kevin K.W. Wang, Daniel Whitehouse, Eveline Wiegers, Guy Williams, Lindsay Wilson, Stefan Winzeck, Stefan Wolf, Zhihui Yang, Peter Ylén, Alexander Younsi, Frederick A. Zeiler, Veronika Zelinkova, Agate Ziverte, and Tommaso Zoerle
Ethical Approval
This study was approved by the Unity Health Toronto Research Ethics Board (approval number: 23-161). The CENTER-TBI study (EC grant 602150) has been conducted in accordance with all relevant laws of the European Union if directly applicable or of direct effect, and with all relevant laws of the country where the recruiting sites were located, including but not limited to, the relevant privacy and data protection laws and regulations (the “Privacy Law”), the relevant laws and regulations on the use of human materials, and all relevant guidance relating to clinical studies from time to time in force including, but not limited to, the International Council for Harmonisation of Technical Requirements for Pharmaceuticals for Human Use Harmonised Tripartite Guideline for Good Clinical Practice (CPMP/ICH/135/95) (“ICH GCP”) and the World Medical Association Declaration of Helsinki entitled “Ethical Principles for Medical Research Involving Human Subjects.” Informed consent by the patient and/or the legal representative/next of kin was obtained, according to the local legislations, for all patients recruited in the core data set of CENTER-TBI and documented in the electronic case report forms (e-CRF). Ethical approval was obtained for each recruiting site. The list of sites, ethical committees, approval numbers and approval dates can be found online. 33
Authors' Contributions
A.H. and P.N.T. contributed to the study conception and design. A.H. implemented the algorithm and analyzed experimental results. A.H. wrote the first draft of the manuscript. M.D.C., A.B., and R.G.K. interpreted data and critically revised the manuscript. All authors read and approved the final manuscript.
Funding Information
Data used in preparation of this manuscript were obtained in the context of CENTER-TBI, a large collaborative project with the support of the European Union 7th Framework program (EC grant 602150). Additional funding was obtained from the Hannelore Kohl Stiftung (Germany), OneMind (USA), and Integra LifeSciences Corporation (USA). None of these funding sources for CENTER-TBI had any role in the writing of the manuscript or the decision to submit it for publication. This work was supported by a research grant from Nippon Steel Corporation (fund number 509533).
Data Sharing
CENTER-TBI encourages data sharing, and there is a data sharing statement published: https://center-tbi.eu/data/sharing. Individual participant data, including data dictionary and analysis scripts will be available immediately following publication, conditional to approved study proposal. Data will be available to researchers who provide a methodologically sound study proposal that is approved by the management committee to achieve the aims in the approved proposal. Proposals can be submitted online at https://www.center-tbi.eu/data. A data access agreement is required, and all access must comply with regulatory restrictions imposed on the original study. The code supporting this study will become publicly accessible following its publication at ![]() .
.
Author Disclosure Statement
A.H. is supported by a PhD funding award from Nippon Steel Corporation. A.B. is a Co-Founder & Co-CEO of 16 Bit Inc., and a member of the Scientific Advisory Committee of Osteoporosis Canada. R.G.K. is on the Scientific Advisory Board of Iterative Scopes. P.N.T. is an investigator and consultant of Novo Nordisk, an officer, director and shareholder of SofTx Innovations Inc., an advisory board member of Demeter Innovation Lab, and an advisory board member of Pulsar Music Inc. M.D.C. is a recipient of grants from the Canadian Institutes of Health Research (grant number 471164, 471342, and 486664). The authors report no conflict of interest concerning the materials or methods used in this study or the findings specified in this article.
Supplementary Material
Supplementary Figure S1
Supplementary Figure S2
Supplementary Table S1
Supplementary Table S2
Supplementary Document S1
Supplementary Document S2
References
Supplementary Material
Please find the following supplemental material available below.
For Open Access articles published under a Creative Commons License, all supplemental material carries the same license as the article it is associated with.
For non-Open Access articles published, all supplemental material carries a non-exclusive license, and permission requests for re-use of supplemental material or any part of supplemental material shall be sent directly to the copyright owner as specified in the copyright notice associated with the article.