
Abstract
Mild traumatic brain injury (TBI) sustained in a deployment environment (deployment TBI) can be associated with increased severity of long-term symptom presentation, despite the general expectation of full recovery from a single mild TBI. The heterogeneity in the effects of deployment TBI on the brain can be difficult for a case–control design to capture. The functional connectome of the brain is an approach robust to heterogeneity that allows global measurement of effects using a common set of outcomes. The present study evaluates how differences in the functional connectome relate to remote symptom presentation following combat deployment and determines if deployment TBI, blast exposure, or post-traumatic stress disorder (PTSD) are associated with these neurological differences. Participants included 181 Iraq and Afghanistan combat-exposed Veterans, approximately 9.4 years since deployment. Structured clinical interviews provided diagnoses and characterizations of TBI, blast exposure, and PTSD. Self-report measures provided characterization of long-term symptoms (psychiatric, behavioral health, and quality of life). Resting-state magnetoencephalography was used to characterize the functional connectome of the brain individually for each participant. Linear regression identified factors contributing to symptom presentation including relevant covariates, connectome metrics, deployment TBI, blast exposure PTSD, and conditional relationships. Results identified unique contributions of aspects of the connectome to symptom presentation. Furthermore, several conditional relationships were identified, demonstrating that the connectome was related to outcomes in the presence of only deployment-related TBI (including blast-related TBI, primary blast TBI, and blast exposure). No conditional relationships were identified for PTSD; however, the main effect of PTSD on symptom presentation was significant for all models. These results demonstrate that the connectome captures aspects of brain function relevant to long-term symptom presentation, highlighting that deployment-related TBI influences symptom outcomes through a neurological pathway. These findings demonstrate that changes in the functional connectome associated with deployment-related TBI are relevant to symptom presentation over a decade past the injury event, providing a clear demonstration of a brain-based mechanism of influence.
Introduction
Many service members who deployed in support of the wars in Iraq and Afghanistan experienced mild traumatic brain injury (TBI), blast exposure, and/or traumatic events. These events can lead to the development of numerous psychiatric outcomes, including post-traumatic stress disorder (PTSD). 1 –3 A growing body of work has highlighted that mild TBI incurred in a deployment environment (deployment TBI) can be associated with increased severity of symptom presentation despite the general expectation of full recovery from a single mild TBI. 4 –8 However, not every individual who sustains a deployment TBI experiences ongoing negative symptoms or develops long-term negative outcomes. 9 The discrepancy in outcomes could be due to a number of factors including different mechanisms of injury, poorer recovery as a result of the environment, increased levels of physiological stress, or delayed access to care and other interventions to mitigate the effects of the injury. However, each of these factors ultimately influences how the brain is affected by, and recovers from, the injury.
Recent studies have demonstrated alterations in brain structure and function following deployment TBI. 10 –13 TBI generally poses a unique analytic challenge due to the heterogeneity of injury characteristics. Specifically, most analytic approaches to neuroimaging data are based on finding alterations to common areas of the brain across a disease or injury. These approaches are likely affected by the heterogeneity of mild TBI, such as differences in presence or length of loss of consciousness. One robust analytic approach that is able to capture this heterogeneity is using network science to study the brain’s connectome. 14,15 The connectome consists of the connections among active brain regions occurring in a specific context (e.g., resting-state) that is established on an individual basis. 16 The connectome can be reduced to specific subnetworks 17,18 such as the default mode (DMN) 19 and salience networks 20 ; however, examining the full connectome across the whole brain offers a way to capture variability across both individuals and injury characteristics. 21 This is especially important when studying mild TBI due to the highly variable nature of injuries across individuals. Graph theoretical approaches allow the calculation of metrics to describe the communication, topology, and structure of the functional connectome or subnetworks. 22 These aspects of the connectome may be altered by disruption to activity at any involved location or communication between any involved regions, offering a robust platform to capture the spatially heterogeneous effects of mild TBI. 23 –27
In addition to deployment TBI, exposure to blasts and explosions is common throughout military careers. 28 With few exceptions (e.g., avalanches and construction crews), blast exposure is a relatively unique experience for service members. The severity of these exposures and the resulting consequences vary significantly, from multiple subconcussive exposures as a result of heavy weapons training to larger exposures from explosive munitions training (e.g., breaching) or missions, as well as incoming fire, such as improvised explosive devices that may or may not result in a TBI. Although current pre-clinical evidence supports the effect of blast overpressure on brain function and structure, 29,30 evidence in humans is limited, especially analyses examining the influence of both blast exposure and mild TBI. 12,31 –33 Available evidence from human studies, primarily in military breachers, is supportive of alterations to brain function as a result of exposure to low-level blasts. 34 –36
Like mild TBI and blast exposure, PTSD is a highly relevant condition to the service member and Veteran population. Chronic symptoms attributed to TBI or PTSD often overlap. Considering the frequent co-occurrence of both conditions, it is often difficult to attribute the etiology of symptom complaints based solely on the clinical presentation. Differences in brain structure and function between individuals with and without PTSD have been identified; however, these differences are hypothesized to be either premorbid or a result of chronic stress due to symptoms of the condition. 37 –41 In contrast, mild TBI is believed to create alterations to brain structure and function that produce associated symptoms, particularly during the acute stage (≤3 months) of injury. 42 Work in the acute stage of mild TBI has demonstrated direct relationships between alterations to brain structure and function with symptom presentation, as well as resolution of symptoms as those alterations resolve. 43 –46 However, similar work is sparse in the chronic or long-term stage of injury. 47 Together, this evidence suggests that TBI and PTSD likely affect symptom presentation through different pathways. PTSD is hypothesized to act through a “psychological pathway,” altering existing processes such as conditioned learning, attributions, memories, and physiological arousal. 37,48 –51 In contrast, TBI is hypothesized to act through a “neurological pathway,” causing direct changes to the structure or function of the brain that disrupt or impair emotional, cognitive, and physiological processes. 43 –46 The possibility remains that symptom overlap across the conditions is the result of impairments to common processes resulting from these two pathways.
The purpose of the present study was to evaluate how differences in the functional connectome may relate to remote symptom presentation following combat deployment and to determine if deployment mild TBI, blast exposure, or PTSD is associated with these neurological differences. We hypothesized that connectome structure would be related to symptom presentation. Further, we hypothesized the presence of interactions between deployment mild TBI and blast exposure with connectome structure related to symptom presentation, such that differences in connectome structure associated with deployment TBI and blast exposure will be related to symptom outcomes. Finally, we hypothesized that blast (1) as a mechanism of mild TBI and (2) as a military exposure independent of mild TBI would interact with the connectome to influence symptom presentation, suggesting that the observed effects of deployment TBI are primarily related to blast exposure associated with the concussive event.
Materials and Methods
This project was reviewed and approved by the Institutional Review Board at the W. G. (Bill) Hefner VA Healthcare System in Salisbury, North Carolina, USA. The welfare and privacy of human subjects were protected. Participants voluntarily provided verbal and written informed consent prior to the initiation of study activities. As part of this study, participants completed cognitive testing, self-report measures, and clinical interviews (administered in that order). The current analysis includes data from the clinical interviews and self-report measures.
Participants
Data were collected as part of the Chronic Effects of Neurotrauma Consortium Study 34. Eligibility criteria were as follows: at least one combat deployment in support of the wars in Iraq and/or Afghanistan, combat exposure, English fluency, 18 years of age or older, and ability to provide informed consent. Exclusion criteria were as follows: history of moderate or severe TBI, TBI history outside of deployment involving loss of consciousness, neurological disorder, severe mental illness (e.g., schizophrenia or bipolar disorder), current substance use disorder, current psychotic symptoms, or contraindication for neuroimaging. Following the screening visit, participants were also excluded if they failed symptom validity testing (Structured Inventory of Malingered Symptoms 52 ) or performance validity testing (Medical Symptom Validity Test 53 ; b Test 54 ).
Of the 201 participants who completed neuroimaging, usable data for both magnetoencephalography (MEG) and magnetic resonance imaging (MRI) were acquired for 181 (did not provide MRI, n = 6; did not provide MEG, n = 7; data quality issues [i.e., excessive motion, artifacts], n = 7). The final sample size for analyses was 181.
Interviews
The Clinician Administered PTSD Scale–5 55 was administered to evaluate PTSD diagnosis per DSM-5 criteria. This clinical interview was administered by masters- or doctoral-level staff to evaluate the presence of lifetime and current PTSD diagnosis. The current PTSD diagnosis was used in the analyses (coded 0 = absent, 1 = present).
The Mid-Atlantic MIRECC Assessment of Traumatic Brain Injury (MMA-TBI) 56 provided a characterization of TBI history across the lifespan according to VA/DOD guidelines. 57 The MMA-TBI is a well-validated TBI interview developed for use with the Veteran population. For the current analysis, deployment TBI was operationalized as the presence or absence of a history of mild TBI occurring in a deployment context. Deployment TBI was coded 0 = absent, 1 = present. Prior work has shown that deployment TBI has a greater effect on outcomes in this population than non-deployment TBI; therefore, TBI occurring outside of the deployment context was not considered in the current analyses. 4 –6,8,58 Blast TBI was operationalized as a history of a mild TBI that included blast as a potential mechanism of injury (coded 0 = absent, 1 = present). A history of primary blast TBI was operationalized as the presence of a mild TBI that only involved blast as a potential mechanism of injury (coded 0 = absent, 1 = present). The difference between primary blast TBI and blast TBI is that the mechanism of injury for primary blast TBI is known to be blast, whereas the mechanism of injury in blast TBI could be a nonblast force, a combination of blast and nonblast forces, or blast alone.
The Salisbury Blast Interview (SBI) provided a characterization of exposure to blast. The SBI evaluates lifetime exposure to blast, regardless of whether a TBI occurred. Information about each blast event is collected (i.e., a narrative, munition, date, distance, environment, protective factors, and physical injury) and can be paired with a TBI interview if there are additional symptoms congruent with a TBI. Consistent with the original investigation, 28 maximum pressure experienced was used in analyses to represent blast exposure severity. This variable is scored on a behaviorally anchored Likert scale from 0 (none) to 5 (strongly, resulted in greater than minor injury).
Self-report measures
Participants completed several self-report measures to characterize symptom presentation. The PTSD Checklist for DSM-5 (PCL-5 59 ) evaluates how affected someone has been by post-traumatic stress symptoms over the past month. Scores range from 0 to 80, with higher scores indicative of greater symptoms. The nine-item Patient Health Questionnaire (PHQ-9 60 ) evaluates depressive symptoms over the previous 14 days. Scores range from 0 to 17, with higher scores indicating greater symptom report. The Neurobehavioral Symptom Inventory (NSI 61 ) evaluates symptoms that may be present following a TBI. Scores range from 0 to 88, with greater scores reflecting worse symptoms. The Pittsburgh Sleep Quality Index (PSQI 62 ) evaluates sleep quality over the past 30 days. Scores range from 0 to 21, with higher scores indicating poorer sleep quality. The Patient Reported Outcomes Measurement Information System Pain Interference (PROMIS-PI 63 ) evaluates the consequences of pain on aspects of an individual’s life over the past week. t-Scores were used for analyses. Higher scores reflect greater functional interference. The Distress Tolerance Scale (DTS 64 ) evaluates emotional distress tolerance. After reverse-scoring key items, scores range from 15 to 75, with lower scores reflecting poorer distress tolerance.
The Quality of Life after Brain Injury scale (QOLIBRI 65 ) evaluates quality of life in the past week. Because not all participants in this sample experienced a TBI and those with TBI were in chronic stages, two minor alterations were made to this scale. First, reference to since your brain injury was removed from instructions to make the scale applicable to all participants. Second, two items that specifically referenced a TBI event were removed, resulting in 35 response items with a possible range of 0–40. Because the QOLIBRI uses linear transformations that do not affect variability, the total raw score (sample range = 10–138) was used in analyses with indicated reverse scoring. Higher scores reflect better quality of life. The Deployment Risk and Resiliency Inventory-2 (DRRI-2) Section D was administered to measure level of combat exposure. Participants completed the DRRI-2 Section D in reference to their collective Operation Enduring Freedom, Operation Iraqi Freedom, Operation New Dawn (OEF/OIF/OND) deployments. Participant characteristics and demographics were obtained using a structured interview.
MEG recordings
Data were acquired using a whole head CTF Systems Inc. MEG 2005 neuromagnetometer system equipped with 275 first-order axial gradiometer coils. Head localization was achieved using a conventional three-point fiducial system. Resting-state recording was conducted with the participant seated upright, sitting quietly, with eyes open for 5 min. Data were sampled at 1200 Hz over a DC-300 Hz bandwidth and preprocessed using synthetic third-order gradient balancing, whole trial DC offsetting, and band pass filtering from DC-80 Hz with a 60 Hz notch filter. Data were visually inspected for obvious muscle artifacts, and such epochs were discarded from further analyses. All study visits were conducted during normal business hours, beginning between 9:00 AM and 3:00 PM. Following MEG recording, a T1-weighted MRI scan was obtained for each participant for co-registration and source localization.
Connectomes
Data processing has been previously described in detail. 12,15 Connectomes were created by identifying areas of brain activity and then quantifying communication among those areas. Graph theory was applied to resulting adjacency matrices producing metrics describing characteristics of the functional connectome.
Node identification
Nodes (areas of significant brain activity) were identified by applying a well-validated beamformer, synthetic aperture magnetometry 66,67 (voxel size of 5 × 5 × 5 mm, lead fields for equivalent current dipoles, maximizing noise-normalized power) using a three-spherical shell and multiple local spheres head model 68 based on each participant’s MRI.
Estimating functional connectivity between nodes
The weighted phase lag index (wPLI) 69 was calculated between all pairs of nodes between 1 and 80 Hz. A distribution of phase-randomized surrogate data (10,000 samples) was created for each participant using their own data. 70 For each node pair, connectivity was operationalized at the frequency with the greatest difference (using standard deviations [SDs]) in wPLI between the real and surrogate data. To ensure connectivity exceeded that expected in noise, node pairs with real-surrogate connection differences <2.5 SD were labeled as unconnected. The resulting connectomes were then binarized and thresholded to achieve appropriate levels of sparsity by satisfying the following equation: S = log(N)/log(K), where N represents the number of nodes in the network and K represents the average degree using S = 2.5. 71 This approach maintains a constant proportion of connections across participants.
Metrics
Clustering Coefficient 72 indicates how likely the neighbors of a node are to also be connected with one another. Global Efficiency indicates the efficiency of information transfer within the connectome. Modularity 73 indicates how many cohesive subnetworks can be identified within the larger network. Following the recommendations of the Brain Connectivity Toolbox, 74 the analysis was conducted 500 times, using the average Q (Modularity) and average number of modules (Number Modules) as outcome variables. K-core Degree and K-core Nodes were calculated at the maximum K-core value 75 in the network. The Rich Club is a subset of highly connected and interconnected nodes that form the basis of the broader network. Rich Club metrics were calculated 76 using 500 independently generated random networks. The value of the Rich Club Coefficient (Rich Club Coefficient) represents the interconnectivity among Rich Club nodes. The difference between the maximum value of the Rich Club Coefficient and the initial value of the Rich Club coefficient (Rich Club Diff) indicates how much greater the interconnectivity of the Rich Club is over the network as a whole. The number of nodes (Rich Club Nodes) within the Rich Club and the minimum degree of those nodes (Rich Club Degree) were also used as outcome variables. The proportion of connections within canonical frequency bands was calculated (Delta Connections, Theta Connections, Alpha Connections, Beta Connections, and Gamma Connections) as the number of connections in that frequency band (e.g., Delta) divided by the total number of connections present. Other metrics included the average strength of connections within the network (Connection Strength), the average frequency at which connections occur (Average Frequency), the mode frequency at which connections occur (Mode Frequency), and the number of nodes within the network (Nodes). Connectome metrics have been shown to have test-retest reliability in the good to excellent range depending on variables such as the inter-scan interval, the duration of scan, the functional connectivity metric, and the frequency band examined. 77 –80
Materials
Beamforming and source series construction were completed using software provided by CTF MEG International Services LP (Coquitlam). Further analyses of source series data were conducted using Matlab 2022b (MathWorks Inc.). Metrics were calculated using the Brain Connectivity Toolbox74. Statistical analyses were conducted in SAS Enterprise Guide version 8.3 (SAS Institute Inc.) within the VA Informatics and Computing Infrastructure 81 environment.
Analyses
Linear regression was used to evaluate associations of connectome topology with symptom presentation, as well as the interaction effects between TBI classifications, blast exposure, and PTSD on these relationships. Bivariate correlations were conducted initially to identify relevant relationships between connectome metrics and symptom outcomes (PCL-5 Total, PHQ-9 Total, NSI Total, PSQI Global Sleep Quality, PROMIS Pain Interference Total, DTS Total, QOLIBRI scales: Cognition, Self, Daily Life and Autonomy, Social Relationships, Emotions, and Physical Problems). Any significant correlation (uncorrected for multiple comparisons) was included in the subsequent regression analyses. There were 45 significant correlations to be evaluated using regression analyses. Covariates were identified based on prior work as well as an examination of bivariate relationships between outcomes with demographic characteristics and other potentially related variables. Age and combat exposure (DRRI-2-D total score) were identified as relevant covariates for analyses.
Regression analyses first examined the main effects including categorical variables indicating the presence or the absence of current PTSD and deployment mild TBI, as well as the relevant connectome metric (continuous variable; see Table 1). These variables were entered into the models after covariates. Identical regression analyses were used to examine blast TBI and primary blast TBI, replacing deployment mild TBI with each of these variables in separate models. Finally, blast exposure severity was included as an additional variable in the deployment mild TBI model, retaining deployment TBI as a variable in the model. The PROCESS 82 macro v.4.2 was used to calculate interaction effects to identify conditional relationships. Initially, PROCESS model 2 was selected to determine the presence of connectome metric × deployment TBI and connectome metric × PTSD interactions. False discovery rate (FDR) 83 was applied at the model level to correct results of the main effects only analyses (n = 45) and the conditional effect analyses (n = 45) for multiple comparisons. There were no significant interactions between PTSD and connectome metrics across analyses. Therefore, subsequent analyses examining blast variables used PROCESS model 1 to evaluate the interaction effects between connectome metrics with blast TBI, primary blast TBI, and blast exposure severity. FDR was applied to each of these analyses at the model level to correct for multiple comparisons (n = 45 for each blast variable). Data were reprocessed, and these analyses were repeated at three additional thresholding levels (values of S) to determine how the density of connectomes may have affected results.
Parameter Estimates from Regression Models Including Only Main Effects
Note. n = 181; * p < 0.05; all models are significant after false discovery rate correction for multiple comparisons.
PCL-5, PTSD Checklist for DSM 5; PHQ-9, Patient Health Questionnaire-9; NSI, Neurobehavioral Symptom Inventory; PSQI, Pittsburgh Sleep Quality Index; DTS, Distress Tolerance Scale.
Results
Participant characteristics are reported in Table 2. Veterans with deployment TBI were significantly more likely to have a current diagnosis of PTSD, χ2(1) = 4.27, p = 0.039, and to have experienced more severe blast exposure, F(1,179) = 65.95, p < 0.0001. There were no other significant group differences in any demographic or characteristic variables. Relationships between clinical characteristics and connectome metrics in this sample have been described previously. 12,15
Participant Characteristics Presented as M (SD) or n (%)
Note. n = 181, *p < 0.05.
PTSD, post-traumatic stress disorder; TBI, traumatic brain injury; IQ, intelligence quotient.
Results of regression models examining the main effects of connectome metrics, PTSD diagnosis, and deployment TBI can be seen in Tables 1 and 3. PTSD explained significant unique variance in every model. Deployment TBI also explained significant unique variance for most outcomes; however, it did not contribute to models for the PCL-5, QOLIBRI Social Relationships, QOLIBRI Emotions, or the DTS. Aspects of the connectome explained significant unique variance for all outcome variables except QOLIBRI Daily Life and Autonomy, QOLIBRI Social Relationships, and the DTS. These results were generally consistent across various threshold levels.
Parameter Estimates From Regression Models for the QOLIBRI Including Only Main Effects
Note. n = 181; *p < 0.05; all models are significant after false discovery rate correction for multiple comparisons.
QOLIBRI, Quality of Life After Brain Injury.
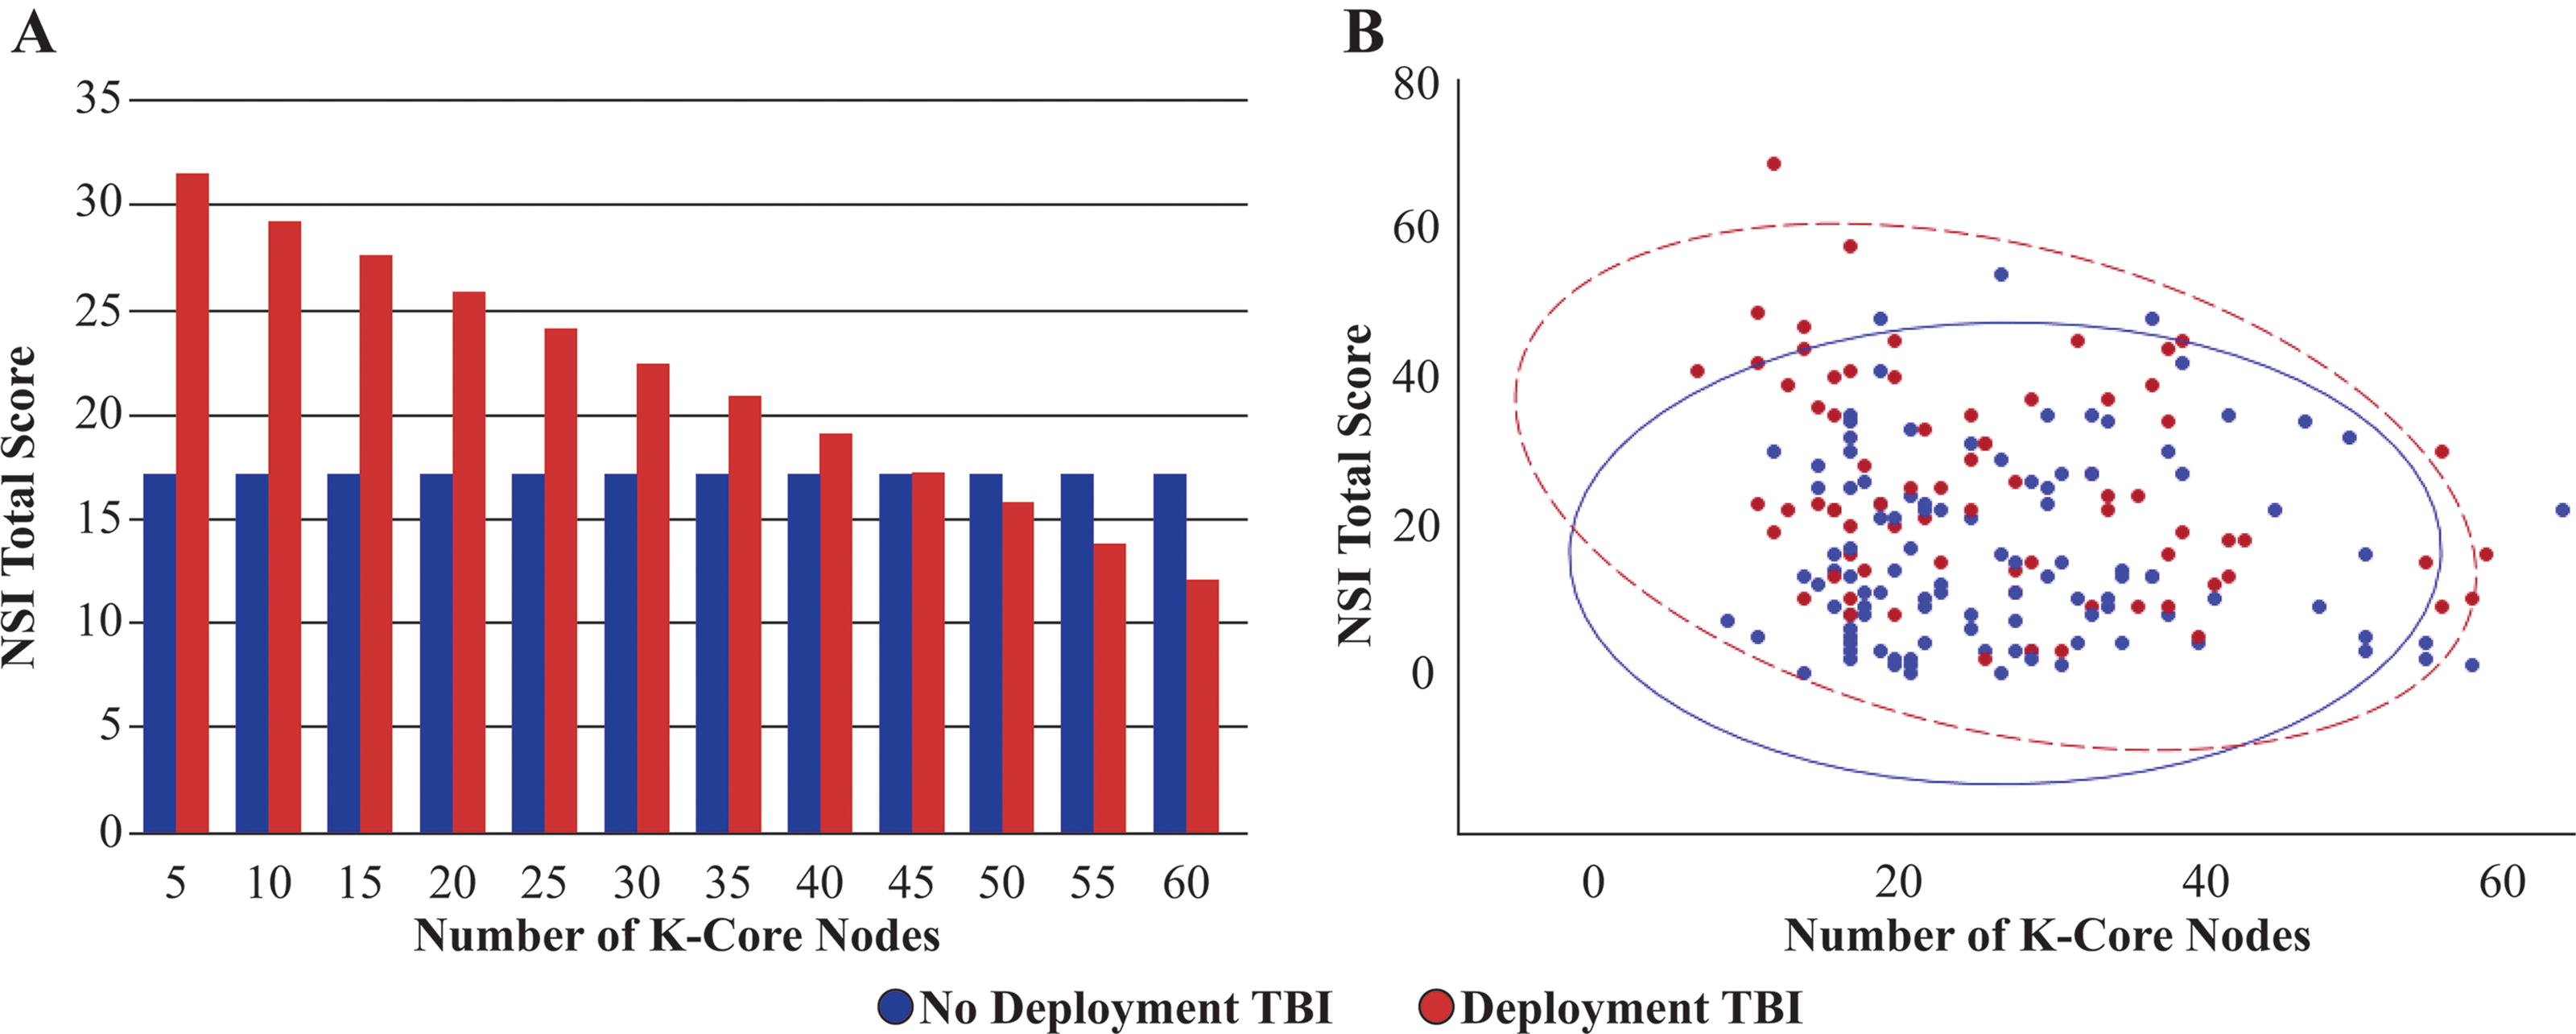
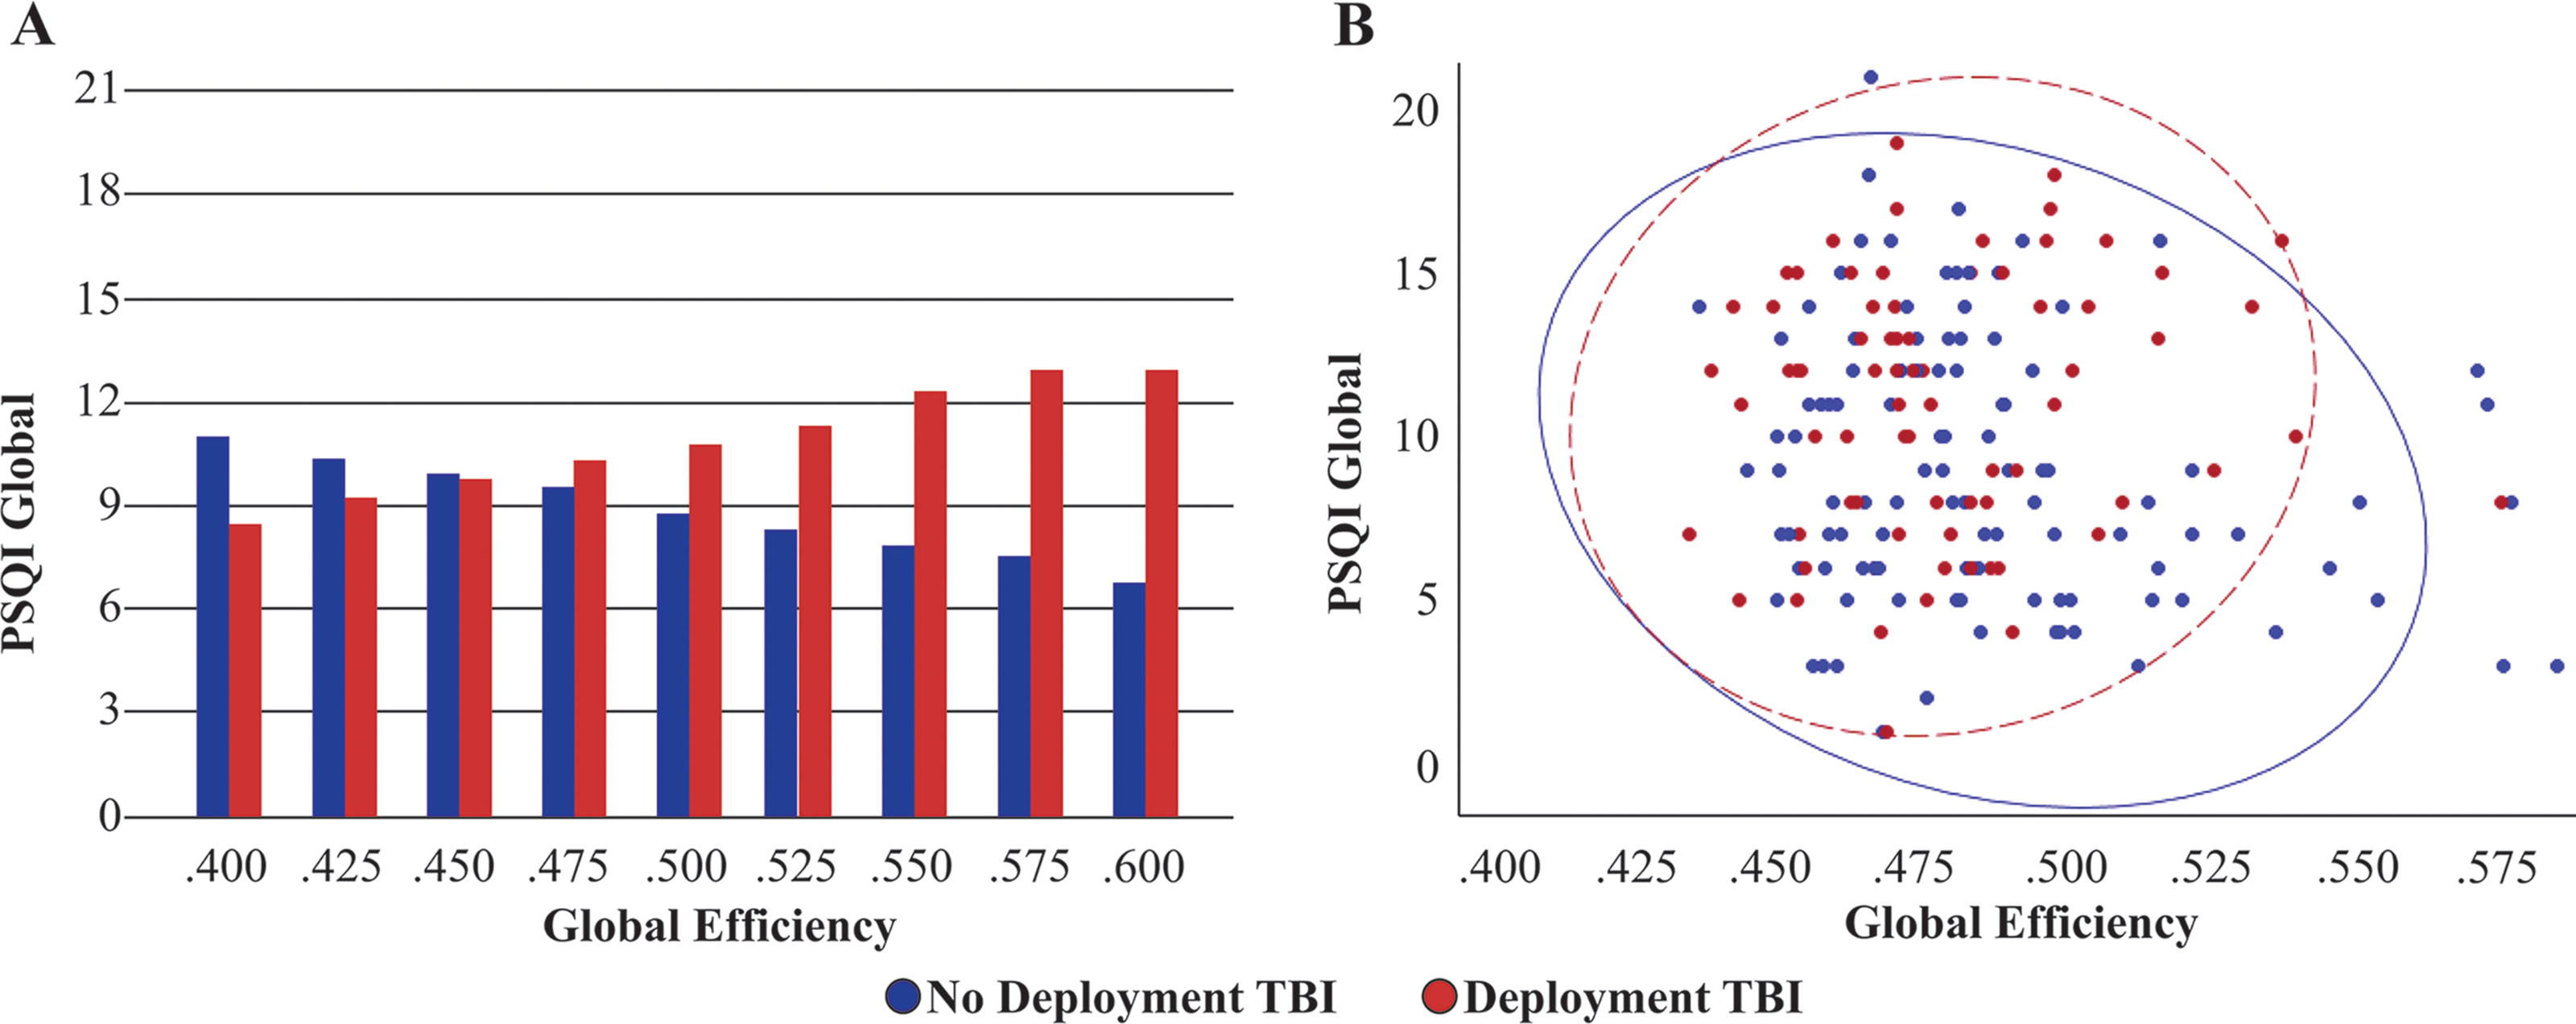
Significant interactions between aspects of the connectome and deployment TBI were identified for three outcomes (Table 4). Deployment TBI interacted significantly with the number of K-core nodes for the NSI (Fig. 1), with Global Efficiency for the PSQI (Fig. 2), and with both the Average Frequency of Connectivity and the Proportion of Connections in Gamma for QOLIBRI Cognition. For the NSI and QOLIBRI models, the relationship between the connectome and outcome was only significant in the presence of deployment TBI history. In the absence of deployment TBI history, there was no relationship. The relationship between the connectome and PSQI changed from negative in the absence of deployment TBI to positive in the presence of deployment TBI. There were no significant interactions between the connectome and PTSD for any outcome.
Parameter Estimates from Conditional Analyses
Only significant interactions are presented.
Note. n = 181; all interactions are significant p < 0.05; all models are significant after false discovery rate correction for multiple comparisons (n = 45).
PHQ-9, Patient Health Questionnaire-9; NSI, Neurobehavioral Symptom Inventory; PSQI, Pittsburgh Sleep Quality Index; DTS, Distress Tolerance Scale QOLIBRI, Quality of Life After Brain Injury.
(
(
The results of regressions examining the main effects of the different blast variables can be seen in Tables 5 and 6. Only outcomes of blast variables are presented in these tables, and effects of PTSD and connectome metrics remained essentially unchanged from the results presented in Tables 1 and 3. Blast variables were each evaluated in separate regressions and were not included within a single model simultaneously (see Analyses above). Results for blast TBI largely resembled the results for deployment TBI and were in the expected directions (see Supplementary Table S1 for the complete list of parameter estimates for these models). Primary blast TBI explained significant variance for all outcomes except the PSQI, DTS, and QOLIBRI Social Relationships, all in the expected directions (see Supplementary Table S2 for a complete list of parameter estimates for these models). Similarly, blast exposure severity explained significant unique variance in all symptom outcomes except the PSQI and DTS (in the expected directions); however, blast exposure severity did not explain significant variance for any QOLIBRI outcome beyond PTSD, deployment TBI, and other covariates in the models (see Supplementary Table S3 for a complete list of parameter estimates for these models). These results were highly consistent across threshold levels, with primary blast TBI and blast severity each changing significance for a single model.
Parameter Estimates From Regression Models of Blast Characterizations Predicting Symptom Outcomes
Note. n = 181; *p < 0.05; all models are significant after false discovery rate correction for multiple comparisons.
Blast TBI and Primary Blast TBI models adjust for the same variables as the deployment TBI models presented in 3. The Blast model also includes deployment TBI as a covariate.
PCL-5, PTSD Checklist for DSM 5; PHQ-9, Patient Health Questionnaire-9; NSI, Neurobehavioral Symptom Inventory; PSQI, Pittsburgh Sleep Quality Index; DTS, Distress Tolerance Scale.
Parameter Estimates From Regression Models of Blast Characterizations Predicting Quality of Life Outcomes
Note. n = 181; *p < 0.05; all models are significant after false discovery rate correction for multiple comparisons.
Blast TBI and Primary Blast TBI models adjust for the same variables as the deployment TBI models presented in 3. The Blast model also includes deployment TBI as a covariate.
QOLIBRI, Quality of Life After Brain Injury.
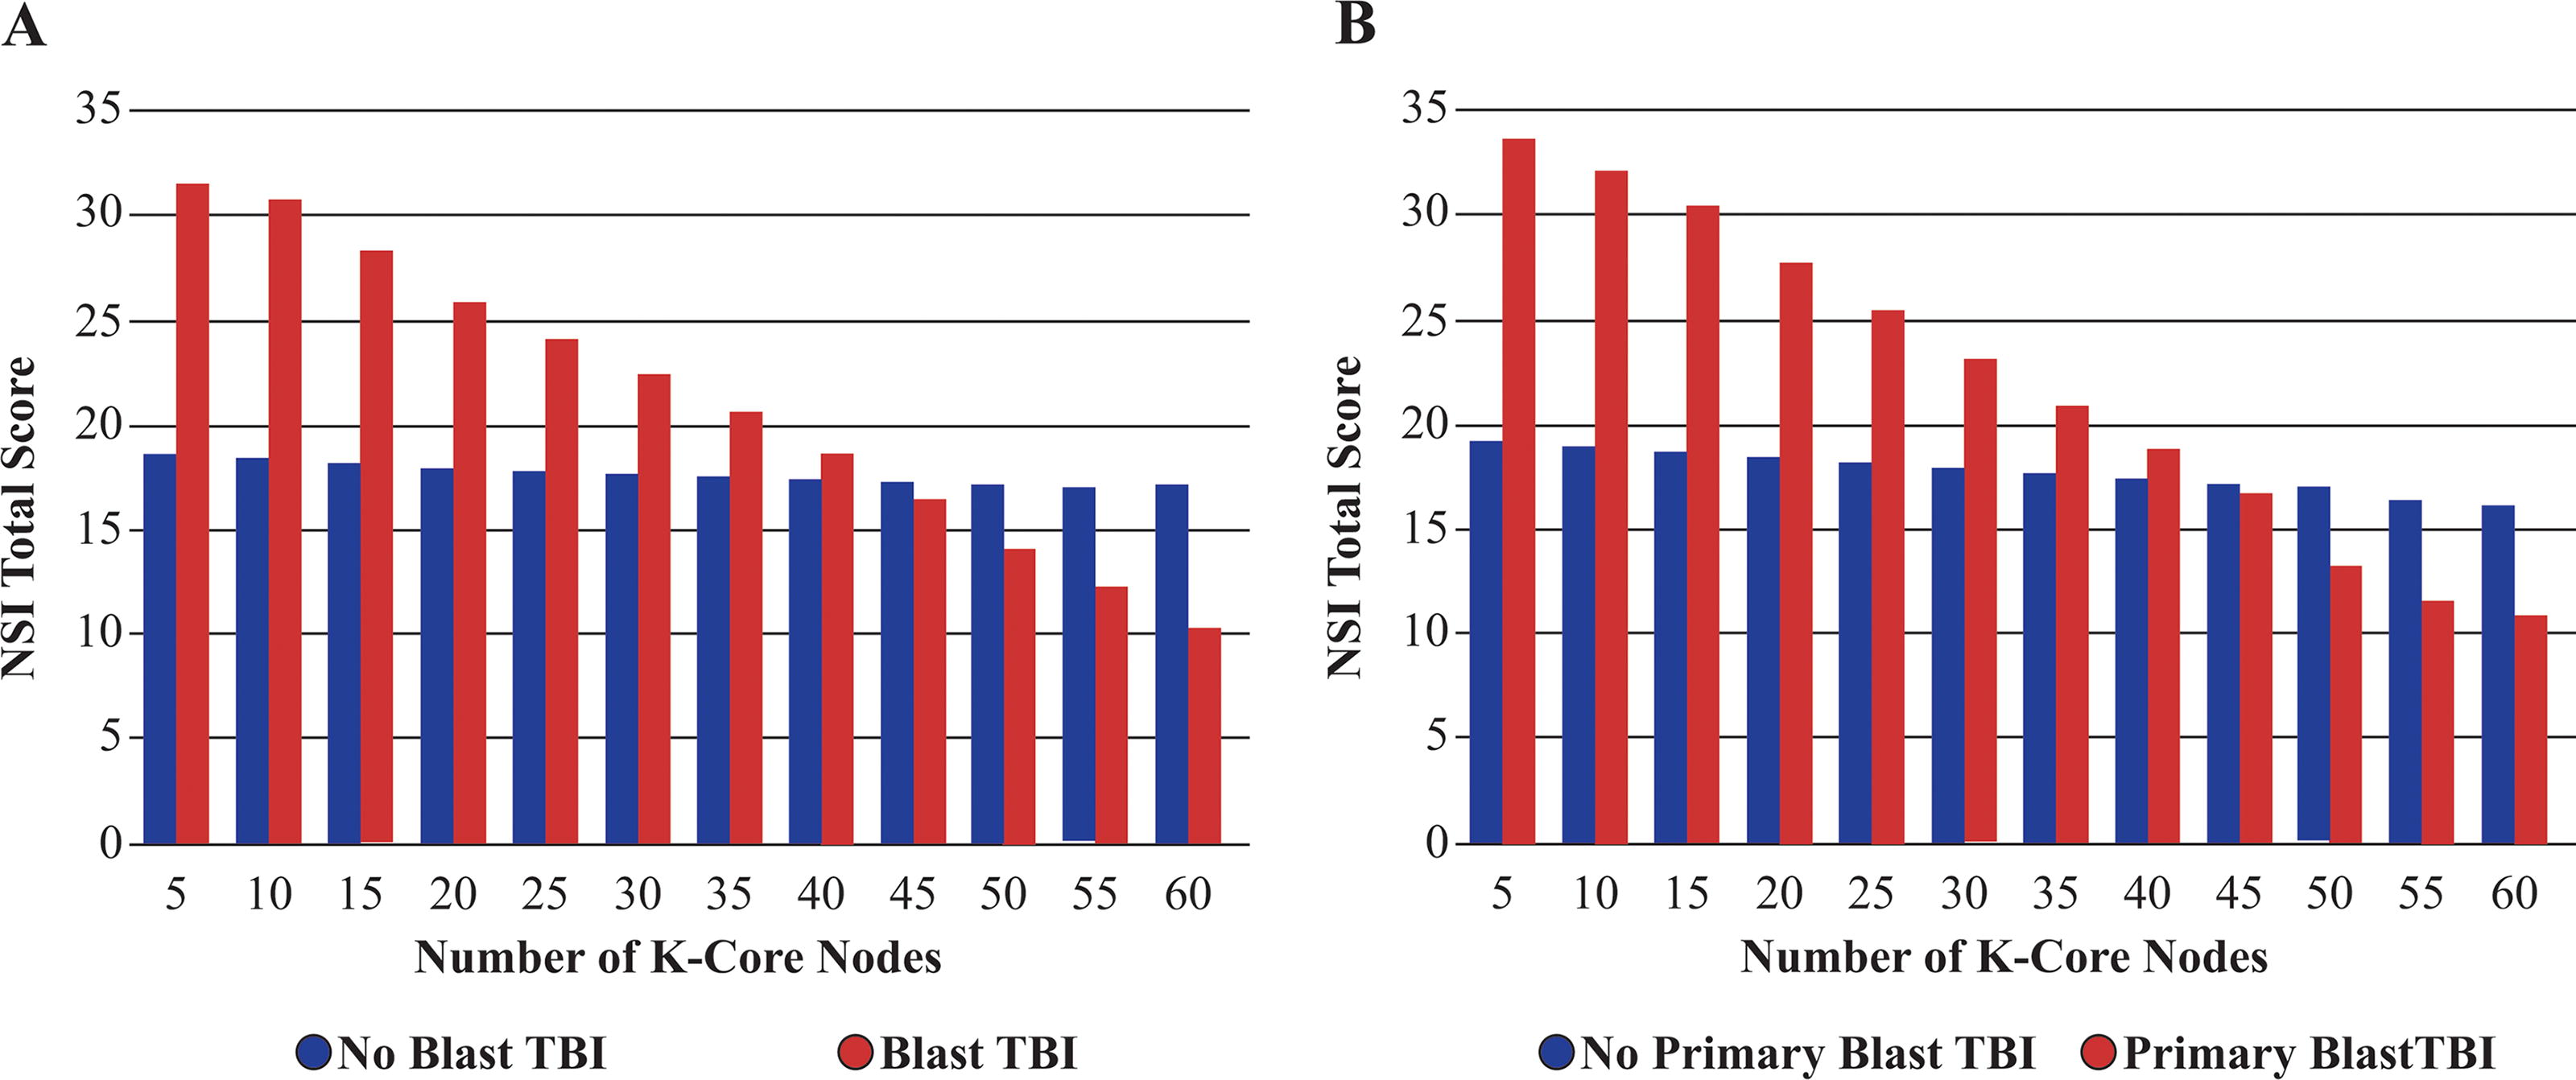
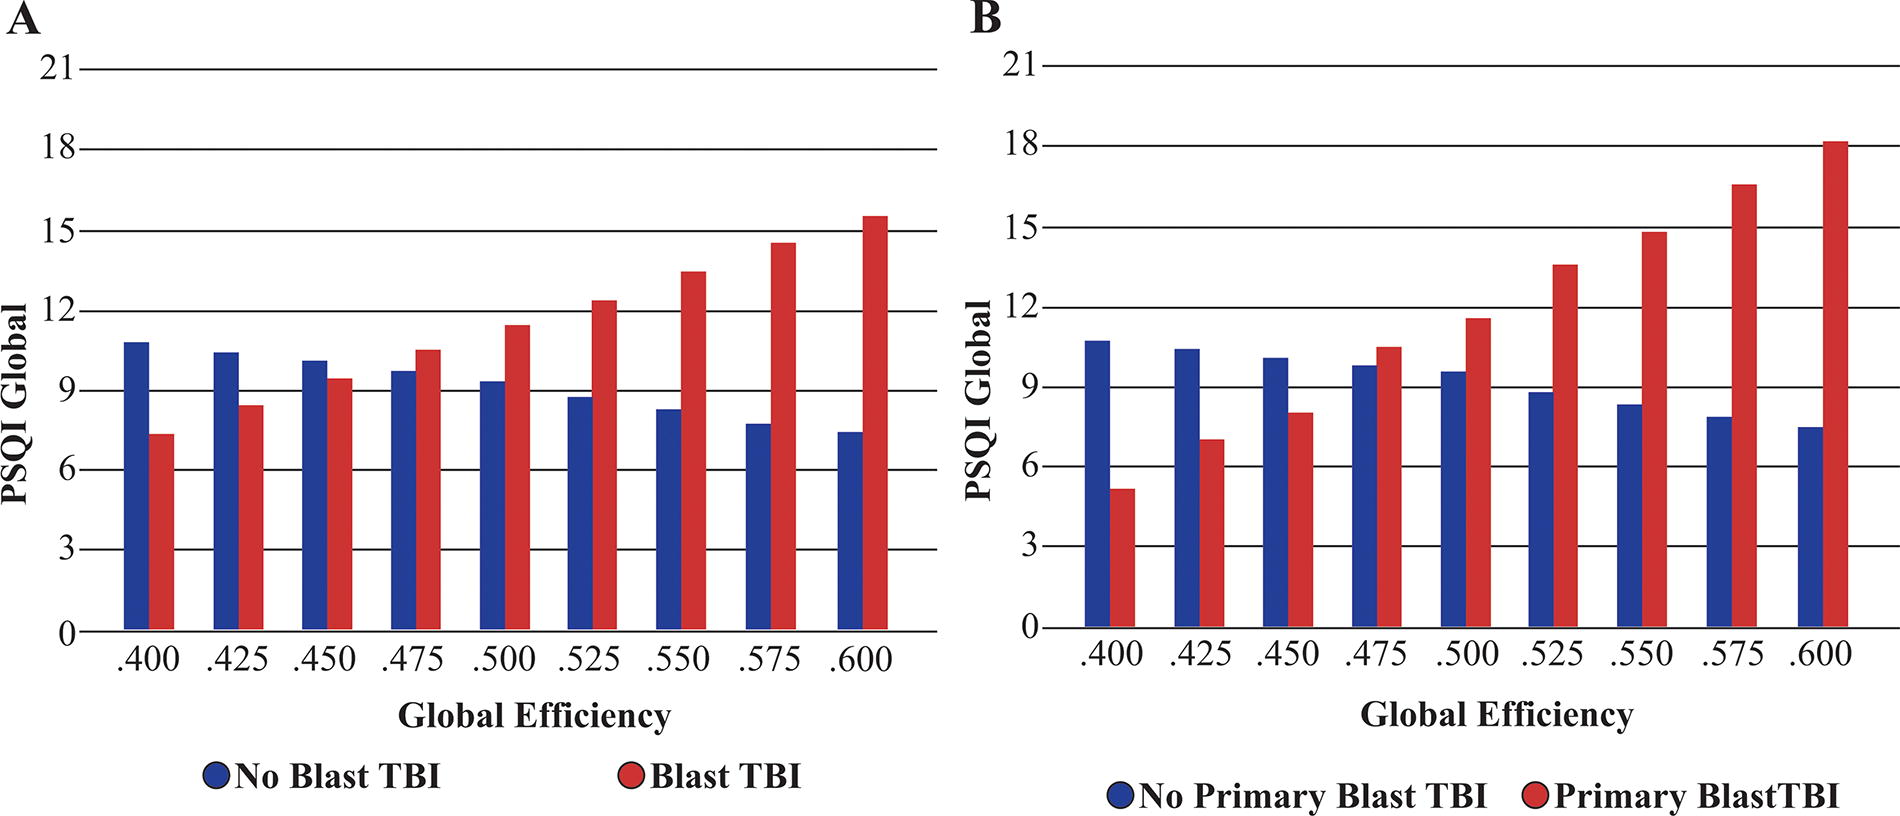
There were several significant interaction effects between blast and connectome metrics for both symptom presentation and quality of life, as shown in Table 4. For blast TBI, interactions indicated either effects only in the presence of blast TBI history or contrasting effects based on the presence or absence of blast TBI history (see Figs. 3 and 4). For primary blast TBI, interactions typically indicated effects only in the presence of primary blast TBI history (see Figs. 3 and 4). Finally, as both blast exposure severity and connectome metrics increased, post-concussive symptoms increased and quality of life decreased.
(
(
The results of the conditional analyses across additional threshold values are presented in Supplementary tables S7, S8, table and S9. The results of conditional analyses were less consistent across threshold values than other results. Across threshold values, results were highly consistent for conditional analyses involving frequency-based aspects of the connectome such as the average frequency at which connections occur or the proportion of connections in a given frequency band. Results were next most consistent for analyses involving global efficiency. Finally, results involving the number of K-core Nodes were the least consistent. Additionally, results were the most consistent for deployment TBI and blast severity, and the least consistent for blast TBI and primary blast TBI.
Discussion
The current study demonstrates the importance of brain function for understanding chronic or late-developing post-deployment symptom outcomes, particularly as a pathway of influence for deployment-related TBI and blast exposure. These analyses demonstrate that characteristics of the connectome contributed unique variance beyond PTSD diagnosis, deployment TBI, blast TBI, primary blast TBI, and blast exposure to many common post-deployment symptoms. Furthermore, the current study identified that the relationship of the connectome to symptom outcomes is conditional upon the presence or absence of deployment-related TBI history (deployment TBI, blast TBI, and primary blast TBI) or blast exposure but not PTSD diagnosis. This demonstrates a brain-based pathway through which deployment-related TBI history and blast exposure affect post-deployment symptom presentation beyond the effects of other factors. Importantly, this interaction was not present for PTSD diagnosis, suggesting PTSD and deployment TBI affect symptom presentation through different mechanisms. Participants in this sample were seen on average 11 years after their most recent injury event, suggesting these effects are chronic and unlikely to spontaneously resolve as would be expected of acute symptoms.
It has been difficult to disentangle the long-term effects of deployment-related TBI and blast exposure on symptom presentation from those of PTSD due to the significant overlap in resulting symptoms as well as the potential for an injury event to also be considered traumatic. In addition, deployment TBI has been identified as a significant risk factor for the subsequent development of PTSD. 6,8 The current results demonstrate that deployment-related TBI (including blast-related or blast-induced TBI) influences symptom outcomes through a neurological pathway that is not present for PTSD. Identification of this pathway highlights that both TBI and PTSD can lead to the development of similar symptom outcomes; however, the mechanism leading to those symptoms differs across conditions. These results imply that the relationship between deployment-related TBI and symptom presentation does not always represent a “psychological” effect. Rather, changes in brain function specific to individuals with deployment-related TBI history can result in increased symptom prevalence and severity.
These findings should not be interpreted to suggest that PTSD has no biological basis. Instead, these results demonstrate a brain-based mechanism of action that differentiates deployment-related TBI and blast exposure from PTSD. Of note, many differences in brain structure and function have been identified between individuals with and without PTSD. 40,84 –86 Several of these differences have been shown to be present prior to the onset of PTSD, representing risk factors for developing the disorder. 51,87 Other differences may be a result of chronic elevated stress levels associated with PTSD rather than the causes of that stress. In contrast, differences in brain structure and function following deployment-related TBI and blast exposure are likely associated with the injury, and current results demonstrate that these differences directly influence symptom presentations.
These results provide key insights into the relationship between blast exposure and symptom outcomes following deployment-related TBI. Furthermore, these results are consistent with prior work demonstrating the importance of blast exposure to both symptom outcomes 88 –90 and the functional connectome of the brain. 12,91 The current analysis extends our knowledge in two specific ways. First, findings demonstrate that the effect of blast exposure on symptom outcomes is due, at least in part, to a neurological pathway. The existence of this pathway indicates that symptom outcomes associated with blast exposure are related to alterations in the functional connectome of the brain. Second, our results suggest that the relationship between blast exposure, brain function, and symptom outcomes extends beyond blast events that result in TBI. Although primary blast TBI had the most robust relationship to symptom outcomes, blast severity was similarly and uniquely related to symptom outcomes beyond the effects of TBI. This indicates that non-concussive blast exposure may still result in chronic symptoms through a neurological pathway. Overall, these results highlight that blast exposure severity (including resulting TBI) is an important factor to consider when examining symptom outcomes in combat-exposed Veterans and service members. Further, they highlight a key role of the functional connectome of the brain in understanding who will experience ongoing symptoms following deployment-related TBI and blast exposure.
In combination with prior findings, 12,15,88,91 –94 the current results suggest that the effect of deployment-related TBI on long-term symptom outcomes is heavily influenced by the role of blast as a mechanism of injury. In the current results, there is strong similarity between the main effects and conditional relationships when examining deployment TBI, blast TBI, or primary blast TBI across models, with effect sizes increasing as blast becomes a clearer mechanism of injury (contrasting Table 1 with Table 5 or Table 3 with Table 6, and contrast conditional effects in Table 4). However, these results do not suggest that blast completely explains the relationship between deployment-related TBI and outcomes. When blast severity is included in models alongside deployment TBI, there is strong resemblance for symptom outcomes (see Table 5) but not for quality of life outcomes (see Table 6). In addition, deployment TBI remained a significant contributor to many symptom outcomes, alongside the significant contribution of blast severity (see Supplementary Table S5). The current results improve our understanding of the relationship among deployment-related TBI, blast exposure, and brain function with long-term symptoms. However, given the lack of a clear definition for clinically relevant blast exposure and that as blast exposure severity increases, the likelihood of a resulting TBI also increases, and significant future effort will be required to fully understand these complex relationships and the potential for intervention and treatment.
The current results demonstrate that even mild TBI can be associated with changes in brain function over a very long timeframe. However, not all individuals experience ongoing symptoms following blast exposure or TBI, especially those that are mild in severity. These results provide insight into some of the reasons for variability in outcomes, by identifying changes in the connectome that are present for individuals who experience chronic or long-term symptoms following mild TBI that occurred in a deployment context, particularly those involving blast exposure. The connectome represents the unique communication profile among active brain regions for a given individual and is expected to differ from person to person. In addition, the connectome is a complex and multifaceted construct that is not well described by a single number or metric. The metrics used to characterize the connectome capture a wide range of attributes and functionality. Application of connectome metrics to the study of TBI is ideal due to the variability across individuals and injuries. Every TBI is unique, caused by a unique force, enacted in a unique location, occurring in unique directions, and ultimately uniquely affecting brain function and structure. The connectome provides a robust and powerful method to characterize the variety of potential outcomes that occur across individuals following TBI.
Changes to the connectome represent potential treatment targets for symptoms following deployment-related TBI and blast exposure. There is currently a marked effort to identify efficacious nonpharmacological and noninvasive methods of neuromodulation (e.g., transcranial magnetic stimulation, transcranial direct current stimulation, and ultrasound). 95 The promising results of these endeavors suggest that it is possible to alter specific aspects of function or communication in targeted brain areas. The current results suggest that the ability to induce alterations that normalize connectome structure and function in a patient-specific manner is a promising modality for addressing chronic and late-developing symptom presentation following deployment-related TBI.
Limitations
There are several considerations when interpreting or generalizing these results. This work was conducted on combat-exposed Veterans of the wars in Iraq and Afghanistan and may not generalize to civilians, Veterans of other wars, or noncombat-exposed Veterans. Prior work has shown different effects of TBI on the connectome in military samples compared with civilian samples. 23,26,96,97 It is possible that more complex interactions across connectome metrics and deployment-related TBI are present but cannot be observed without larger datasets. There are known relationships among aspects of the connectome (e.g., metrics change in a predictable manner as the number of nodes increases) that could produce relationships of increasing complexity, such as changes are only relevant in connectomes of a particular size, with a specific level of hierarchy, or with core subnetworks of a specific density. The approach to connectome creation utilized in this study focuses on areas of the brain active at rest and does not incorporate the possibility of brain regions becoming inactive as a result of pathology. The method also uses a density thresholding approach to partially address the differing numbers of nodes across participants. This limits the ability to see change over time in connections that are present or absent. Results were examined across several densities to determine if the thresholding level affected outcomes. The relationship between connectome metrics and participant TBI history with outcomes was relatively resilient to changing densities. However, the results of the conditional analyses for some metrics were altered at different densities. Overall, this suggests that some aspects of the connectome (frequency-based outcomes) may be more resilient to the effects of threshold than other metrics (those describing the topology of the connectome), and future work should consider these effects when designing analyses. The study relied on self-report of historical events to diagnose TBI, which can be subject to recall bias. In addition, assessment of current symptoms utilized self-report measures, which can also be subject to recall and attribution bias. The analyses only examined the effects of a current PTSD diagnosis. Given the previously discussed risk factors for the development of PTSD, it is possible that including individuals who experienced PTSD at any point in their lives may alter results. Strengths of the study include the sample size, utilization of well-validated interviews to determine TBI history, blast exposure, and PTSD diagnosis; MEG offers a direct measure of brain function; and the use of validity measures ensures symptom exaggeration and fabrication were not present.
Conclusions
The current results demonstrate that deployment-related TBI influences long-term symptom presentation through a unique neurological pathway that can be characterized using the brain’s functional connectome. This finding helps clarify the individuals most likely to experience long-term symptoms following a deployment-related TBI and differentiates these symptoms from those attributed to other common post-deployment conditions, such as PTSD. These results support treatment approaches like neuromodulation as promising future directions for intervention.
Transparency, rigor, and reproducibility
This study was not formally registered because it was not a requirement of the funding source. The analysis plan was not formally pre-registered. A sample size of 200 participants was planned to identify a medium effect of TBI on connectome metrics in a regression analysis adjusting for at least six covariates. In total, 341 potential participants were screened and 201 completed neuroimaging. The actual sample size was 181 participants, following removal of participants with poor quality or missing MRI or MEG data. Imaging acquisition and analyses were performed by team members blind to relevant characteristics of participants, and clinical outcomes were assessed prior to imaging acquisition. All MRI and MEG data were obtained using the same devices across participants. Complete imaging parameters and processing steps are presented in the Materials and Methods section. All neuroimaging data acquisition was conducted using software provided by the manufacturer, following standard procedures. Software and code to conduct analyses are widely available and described in the Materials and Methods section. The primary clinical outcome measures are well validated and represent standards in the field. 55,56 Assessors completed training and evaluation until performance met pre-specified benchmarks before acquiring data. Data were acquired outside of clinical activities, and results were not available to providers. Acute abnormalities noted by neuroradiologists conducting clinical reads were reported to participants (one arachnoid cyst, two pineal region cyst, four possible multiple sclerosis, one cerebellar tonsillar ectopia consistent with Chiari 1, one focal cystic frontal lobe lesion, and one prominent pituitary gland requiring focused study). Chronic findings were noted including old infarcts (n = 3), FLAIR white matter abnormalities (n = 80), or volume loss (n = 8), and participants were notified of these when suggested by the neuroradiologist. De-identified data from this study are publicly available in FITBIR. Examining models across various aspects of the connectome resulted in multiple comparisons. Results were adjusted for multiple comparisons using the FDR. 83 These results have not been replicated in an independent sample. This article will be published under a Creative Commons Open Access License and will be freely available upon publication.
Footnotes
Acknowledgments
The authors thank the Veterans and service members who contributed their time and effort. The authors also thank Mary Peoples, David J. Curry, MSW, Christine Sortino, MS, and Alana M. Higgins, MA, for their contributions.
Authors’ Contributions
J.A.R., PhD: Conceptualization, data curation, formal analysis, funding acquisition, investigation, methodology, project administration, resources, software, supervision, visualization, and writing–original draft. J.R.S.-K., PhD: Conceptualization, data curation, formal analysis, methodology, resources, software, supervision, and writing—review and editing; D.W.G., PhD: Conceptualization, resources, supervision, and writing—review and editing; C.A.H., PhD: Data curation, formal analysis, methodology, software, supervision, and writing—review and editing; S.L.M., PhD: Conceptualization, data curation, formal analysis, funding acquisition, investigation, methodology, project administration, resources, supervision, and writing—original draft.
Disclaimer
The views, opinions, and/or findings contained in this article are those of the authors and should not be construed as an official Veterans Affairs or Department of Defense position, policy, or decision, unless so designated by other official documentation.
Author Disclosure Statement
No competing financial interests exist. The authors declare no conflicts of interest for this work.
Funding Information
This work was supported by funding from Department of Defense, Chronic Effects of Neurotrauma Consortium (CENC) Award W81XWH-13-2-0095 and Department of Veterans Affairs CENC Award
Supplementary Material
Supplementary Table S1
Supplementary Table S2
Supplementary Table S3
Supplementary Table S4
Supplementary Table S5
Supplementary Table S6
Supplementary Table S7
Supplementary Table S8
Supplementary Table S9
References
Supplementary Material
Please find the following supplemental material available below.
For Open Access articles published under a Creative Commons License, all supplemental material carries the same license as the article it is associated with.
For non-Open Access articles published, all supplemental material carries a non-exclusive license, and permission requests for re-use of supplemental material or any part of supplemental material shall be sent directly to the copyright owner as specified in the copyright notice associated with the article.