
Abstract
Spinal cord injury (SCI) is a debilitating condition with an estimated 18,000 new cases annually in the United States. The field has accepted and adopted standardized databases such as the Open Data Commons for Spinal Cord Injury (ODC-SCI) to aid in broader analyses, but these currently lack high-throughput data despite the availability of nearly 6000 samples from over 90 studies available in the Sequence Read Archive. This limits the potential for large datasets to enhance our understanding of SCI-related mechanisms at the molecular and cellular level. Therefore, we have developed a protocol for processing RNA-Seq samples from high-throughput sequencing experiments related to SCI resulting in both raw and normalized data that can be efficiently mined for comparisons across studies, as well as homologous discovery across species. We have processed 1196 publicly available RNA-Seq samples from 50 bulk RNA-Seq studies across nine different species, resulting in an SQLite database that can be used by the SCI research community for further discovery. We provide both the database as well as a web-based front-end that can be used to query the database for genes of interest, differential gene expression, genes with high variance, and gene set enrichments.
Introduction
Spinal cord injury (SCI) is a debilitating condition with an estimated 18,000 new cases annually in the United States, with over 80% of the cases caused by auto accident, fall, gunshot wound, motorcycle accident, or diving. 1 -3 Approximately 1.4 million Americans are living with SCI. 4 Over the last 30 years, significant strides have been made in understanding the systems-wide pathophysiology and behavioral components affected by SCI, including axon growth, 5 –10 compensatory sprouting, 11 –17 glial cell roles, 18 –22 gut dysbiosis, 23 –26 and the role exercise plays in recovery. 27 –36 However, physical activity and training remains the only approved recovery therapy, and the complexity of molecular and cellular-level responses impedes successful translation of potential therapies. 37 To capture and understand the heterogeneity of SCI and recovery from injury, researchers created the Open Data Commons for Spinal Cord Injury (odc-sci.org ) 38 in 2017 to provide a platform for sharing SCI-related data adhering to the FAIR principles of Findable, Accessible, Interoperable, and Resuable. 39 As of September 28, 2022, a total of 176 complex datasets from 95 labs had been uploaded to ODC-SCI, and the structured data dictionaries that accompany each data set allow the data to be easily accessible and interoperable. While ODC-SCI contains a vast amount of data, one component that is rarely cataloged 40 is transcriptomic data associated with RNA-Seq studies, largely because this data is generally easily accessible in resources such as the Gene Expression Omnibus (GEO) 41 or the Sequence Read Archive (SRA). 42 While data from SRA and GEO are accessible, they are not generally interoperable to the average researcher to perform meta-analysis comparisons across experiments.
High-throughput datasets
The expansion in the utilization of high-throughput methodologies such as next generation sequencing, along with numerous behavioral studies, has led to the public availability of sets of data across the genome-to-phenome spectrum. Efforts to make these data usable to the larger scientific community have pushed for the data to adhere to be FAIR compliant. 39 The issue of making these data available was first recognized in a formal manner with microarray experiments, leading to the creation of the Minimum Information About a Microarray Experiment (MIAME). 43 The MIAME standards led to guidelines for submission of high-throughput datasets to publicly available repositories such as the GEO, 41 the SRA, 42 ArrayExpress, 44 and the Database of Genotypes and Phenotypes (dbGAP). 45 More specifically, for SCI research, standards were created for describing the minimal information about a spinal cord injury experiment (MIASCI). 46
Since the first RNA-Seq dataset related to spinal cord injury was made available in 2013, 47 the number of high-throughput sequencing SCI datasets (including RNA-Seq) has increased almost yearly since 2016, from five data sets submitted in 2016 to 27 submitted in 2022. More recently, efforts to make sequencing data interoperable has extended into disease-specific domains, with cancer leading the way through The Cancer Genome Atlas (TCGA) 48 and Genomics Data Commons (GDC). 49 Other efforts have been made to do this at tissue and gene levels through the Gene Tissue Expression (GTEx) database. 50 However, these projects typically classify samples in a binary fashion, into healthy or diseased states. This excludes other potentially pertinent characteristics. In the case of SCI, these additional characteristics may include organism (e.g., rat, mouse, zebrafish), injury type (e.g., contusion, transection, sham), injury force (e.g., 60 kdyn, 200 kdyn, 25 g/cm), injury level (e.g., C5, 5th cervical segment; T10, 10th thoracic segment), tissue type (e.g. spinal cord tissue at epicenter, spinal cord tissue below injury, isolated astrocytes from injured spinal cord, dorsal root ganglion), and time since injury (e.g., 1 h post-injury, 24 h post-injury, 60 days post-injury). Given the shortcomings with the interoperability of SCI transcriptomic data, we have developed a pipeline for preparing publicly available datasets for comparison across studies as well as across model organisms, resulting in both an SQLite database for the raw data, as well as a web interface for integrative analysis across studies.
Methods
Data selection and preparation
Samples were located within the SRA 42 using the search term “Spinal Cord Injury” OR SCI. From these, a total of 90 potential studies of interest were identified (Supplementary Table S1). Three additional SRA records related to neuropathic pain (SRP173586), nerve injury (SRP13362), and central nervous system (CNS) injury (SRP094587) were manually added, as were additional samples from the identified SRA studies that were not automatically included, due to differences in the specific search terms. A total of 5891 samples were identified from these 93 studies, falling into one of 12 categories. The number of samples is artificially inflated, due to one single-cell RNA-Seq (scRNA-Seq) study (SRP239303) where each of the 3687 cells sequenced is represented as its own sample. Those samples corresponding to an RNA-Seq assay were manually reclassified to the most appropriate assay type as RNA-Seq (bulk), scRNA-Seq, ribosomal-associated RNA-Seq (RAM-seq), and transplanted RNA-Seq. A handful of assay types were not consistently labeled and were reclassified from RNA-Seq to microRNA (miRNA-Seq) or noncoding RNA-Seq (ncRNA-Seq). The final filtered data for each of these classifications is shown in Table 1. The 50 bulk RNA-Seq studies (Table 2) were selected for further processing, representing 1196 samples from nine different species, the majority being mouse, rat, frog, and human (Table 3). RNA-Seq samples were downloaded from SRA using the sratoolkit 51 :
Classification of Samples Identified
SRA RNA-Seq Studies Included—Species Codes Are Listed in Table 3
Samples by Species
Eleven rat samples were omitted (SRR13562711-SRR13562722) due to issues with obtaining the samples with sratoolkit. Samples were then processed for quality assurance and quality control (QA/QC) using fastQC. 52
Sequencing reads were aligned to the respective reference genomes guided by known transcriptomes (Table 4) using STAR. 53 Raw read counts were determined using the featureCounts R package. 54 Counts were extracted using three separate stranded settings, including –s 0 (unstranded), -s 1 (forward stranded), and –s 2 (reverse stranded). This step was performed to infer the most likely strandedness of the original library construction kit. Strandedness was also calculated using the infer_experiment.py script from the RSeqC package. 55 The resulting feature counts were reformatted to the same format of htSeqCount 56 using a custom script. The count information was then parsed to create a tab-delimited file of raw gene counts and TPM (transcripts per million) normalized counts. 57 Since TPM normalizes to both the library size and the transcript size, we utilized the R GenomicFeatures package 58 to determine gene lengths. The exception to this was the axolotl data, where a known transcriptome description is not currently available. In this case, those samples were constructed into de novo transcriptomes using Trinity. 59
Reference Genomes and Gene Description Files Used
SQLite database construction
Tab-delimited files representing data for 10 SQLite tables were constructed, and then parsed into the SQLite database. Each table was connected to other tables via foreign keys, including the organism, gene identifier, SRA study identifier, and SRA sample identifier.
Data exploration
When a user chooses the data exploration option (described below), the samples of interest are filtered by species using the raw sequencing reads determined by featureCounts. If samples from at least one of the groups mouse and human, mouse and rat, human and rat, or mouse, human, and rat are selected, then the genes are filtered for homologous genes across species using the NCBI Homologene identifiers. 60 Differential gene expression is calculated for the samples within each species individually, as well as for homologous genes across species using DESeq2. 61 The resulting data is sorted by q-value (Storey's false discovery rate correction) from smallest to largest and parsed for up-regulated genes (those with a positive logFC) and down-regulated genes (those with a negative logFC). Heatmaps for the top 250 differentially expressed and top 250 variance genes are constructed, using a gene-wise z-score. Enriched GeneOntology Biological Processes (GO:BP) 62 and KEGG pathway 63 are determined using ClusterProfiler. 64
Results
RNA-Seq data
A total of 1196 samples from 50 bulk RNA-Seq studies were processed for inclusion in the SQLite database, with the majority originating from either spinal cord or dorsal root ganglion tissue (Fig. 1). The injury site for these studies was varied, with the most common location thoracic—in particular, thoracic vertebrae 8 (T8) and T10 (Supplementary Fig. S1). The time since injury was varied, with the majority occurring within the first 2 weeks, although a number of studies extended the time, all the way up to 24 weeks (Supplementary Fig. S2). Over 30 unique injury types are represented (Supplementary Fig. S3), with the most frequent being complete transection, contusion, and various controls, including sham and laminectomy. In many cases, the exact control type could not be extracted from the GEO entry and any associated publication, and is therefore listed as uninjured or control. The number of human samples is limited, in part due to the controlled nature of human samples and in part due to the scarcity of tissue (spinal cord and dorsal root ganglion [DRG]) from individuals with spinal cord injuries. A search of dbGaP 65 results in only one study with spinal cord injury samples, with four studies with spinal cord tissue and three with DRG, mainly in the context of pain.
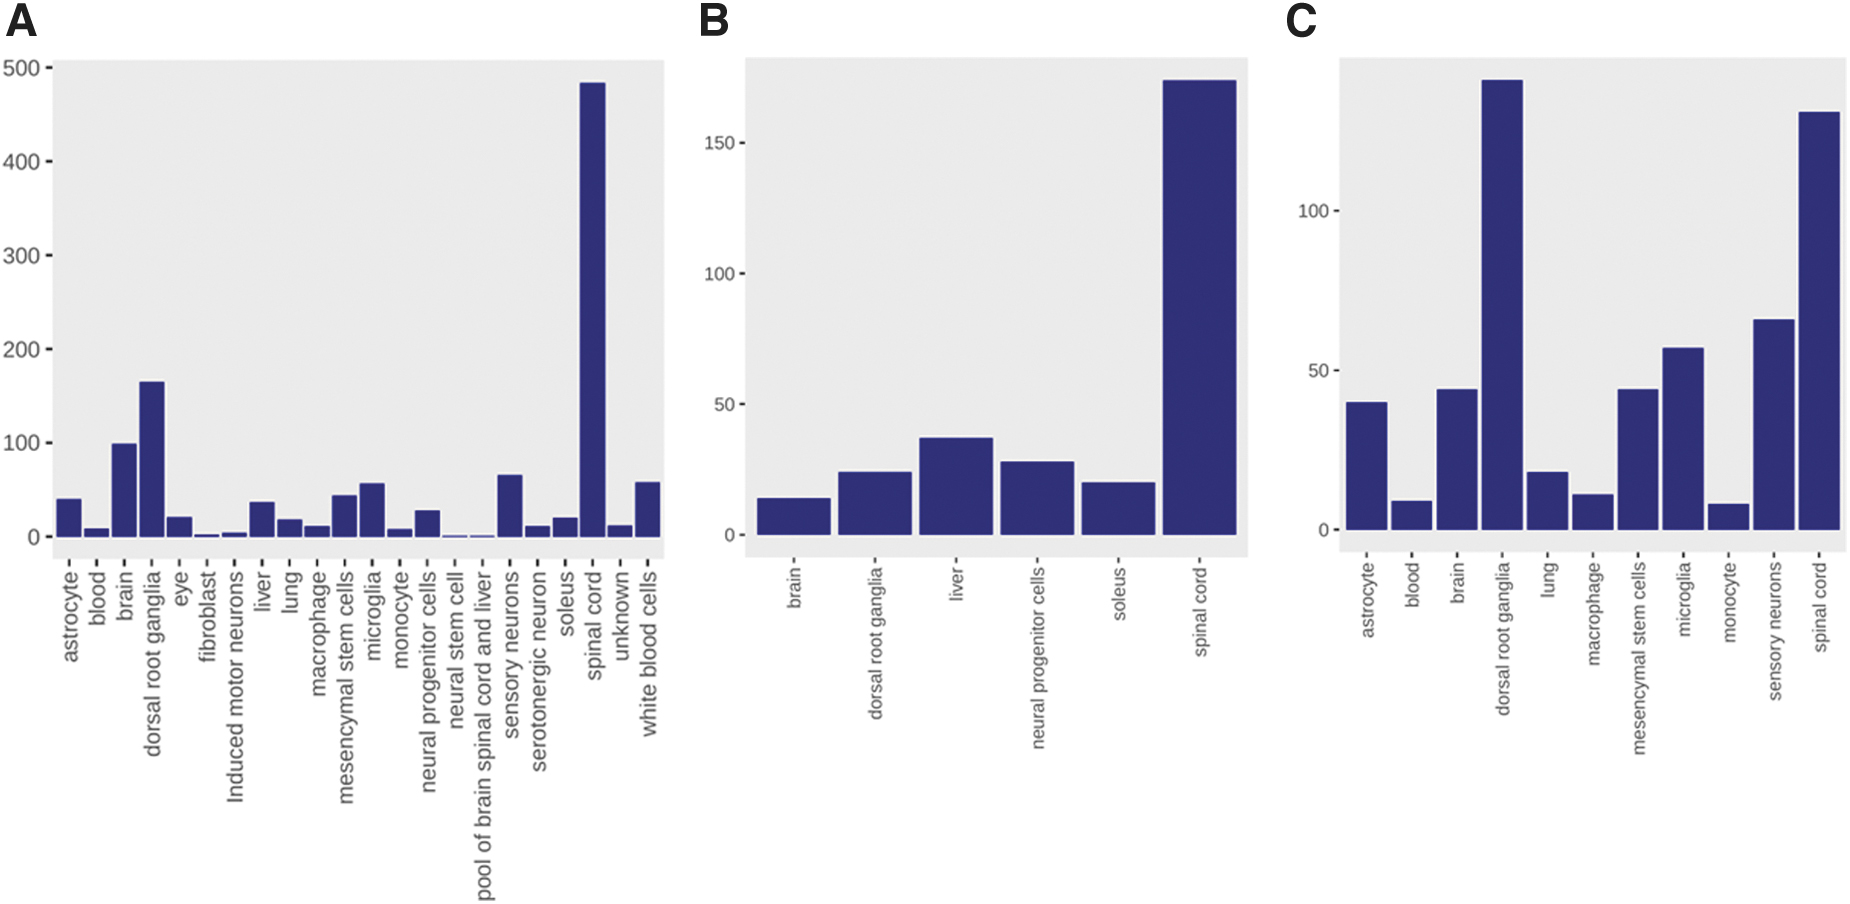
Tissue types studied in filtered RNA-Seq experiments. Shown are
SQLite database
After the studies and their corresponding samples were processed, the resulting information was structured into an SQLite relational database consisting of 10 tables, as shown in the entity-relationship (ER) diagram in Figure 2. The total database size is just under 2.5 Gb. Web front-end. Utilization of the SQLite database was performed using a web-based application for querying the data. Presented on the web page is information about the constructed database (Supplementary Fig. S4), links and summaries for included studies (Supplementary Fig. S5), downloadable files (Supplementary Fig. S6), and database exploration (Fig. 3).
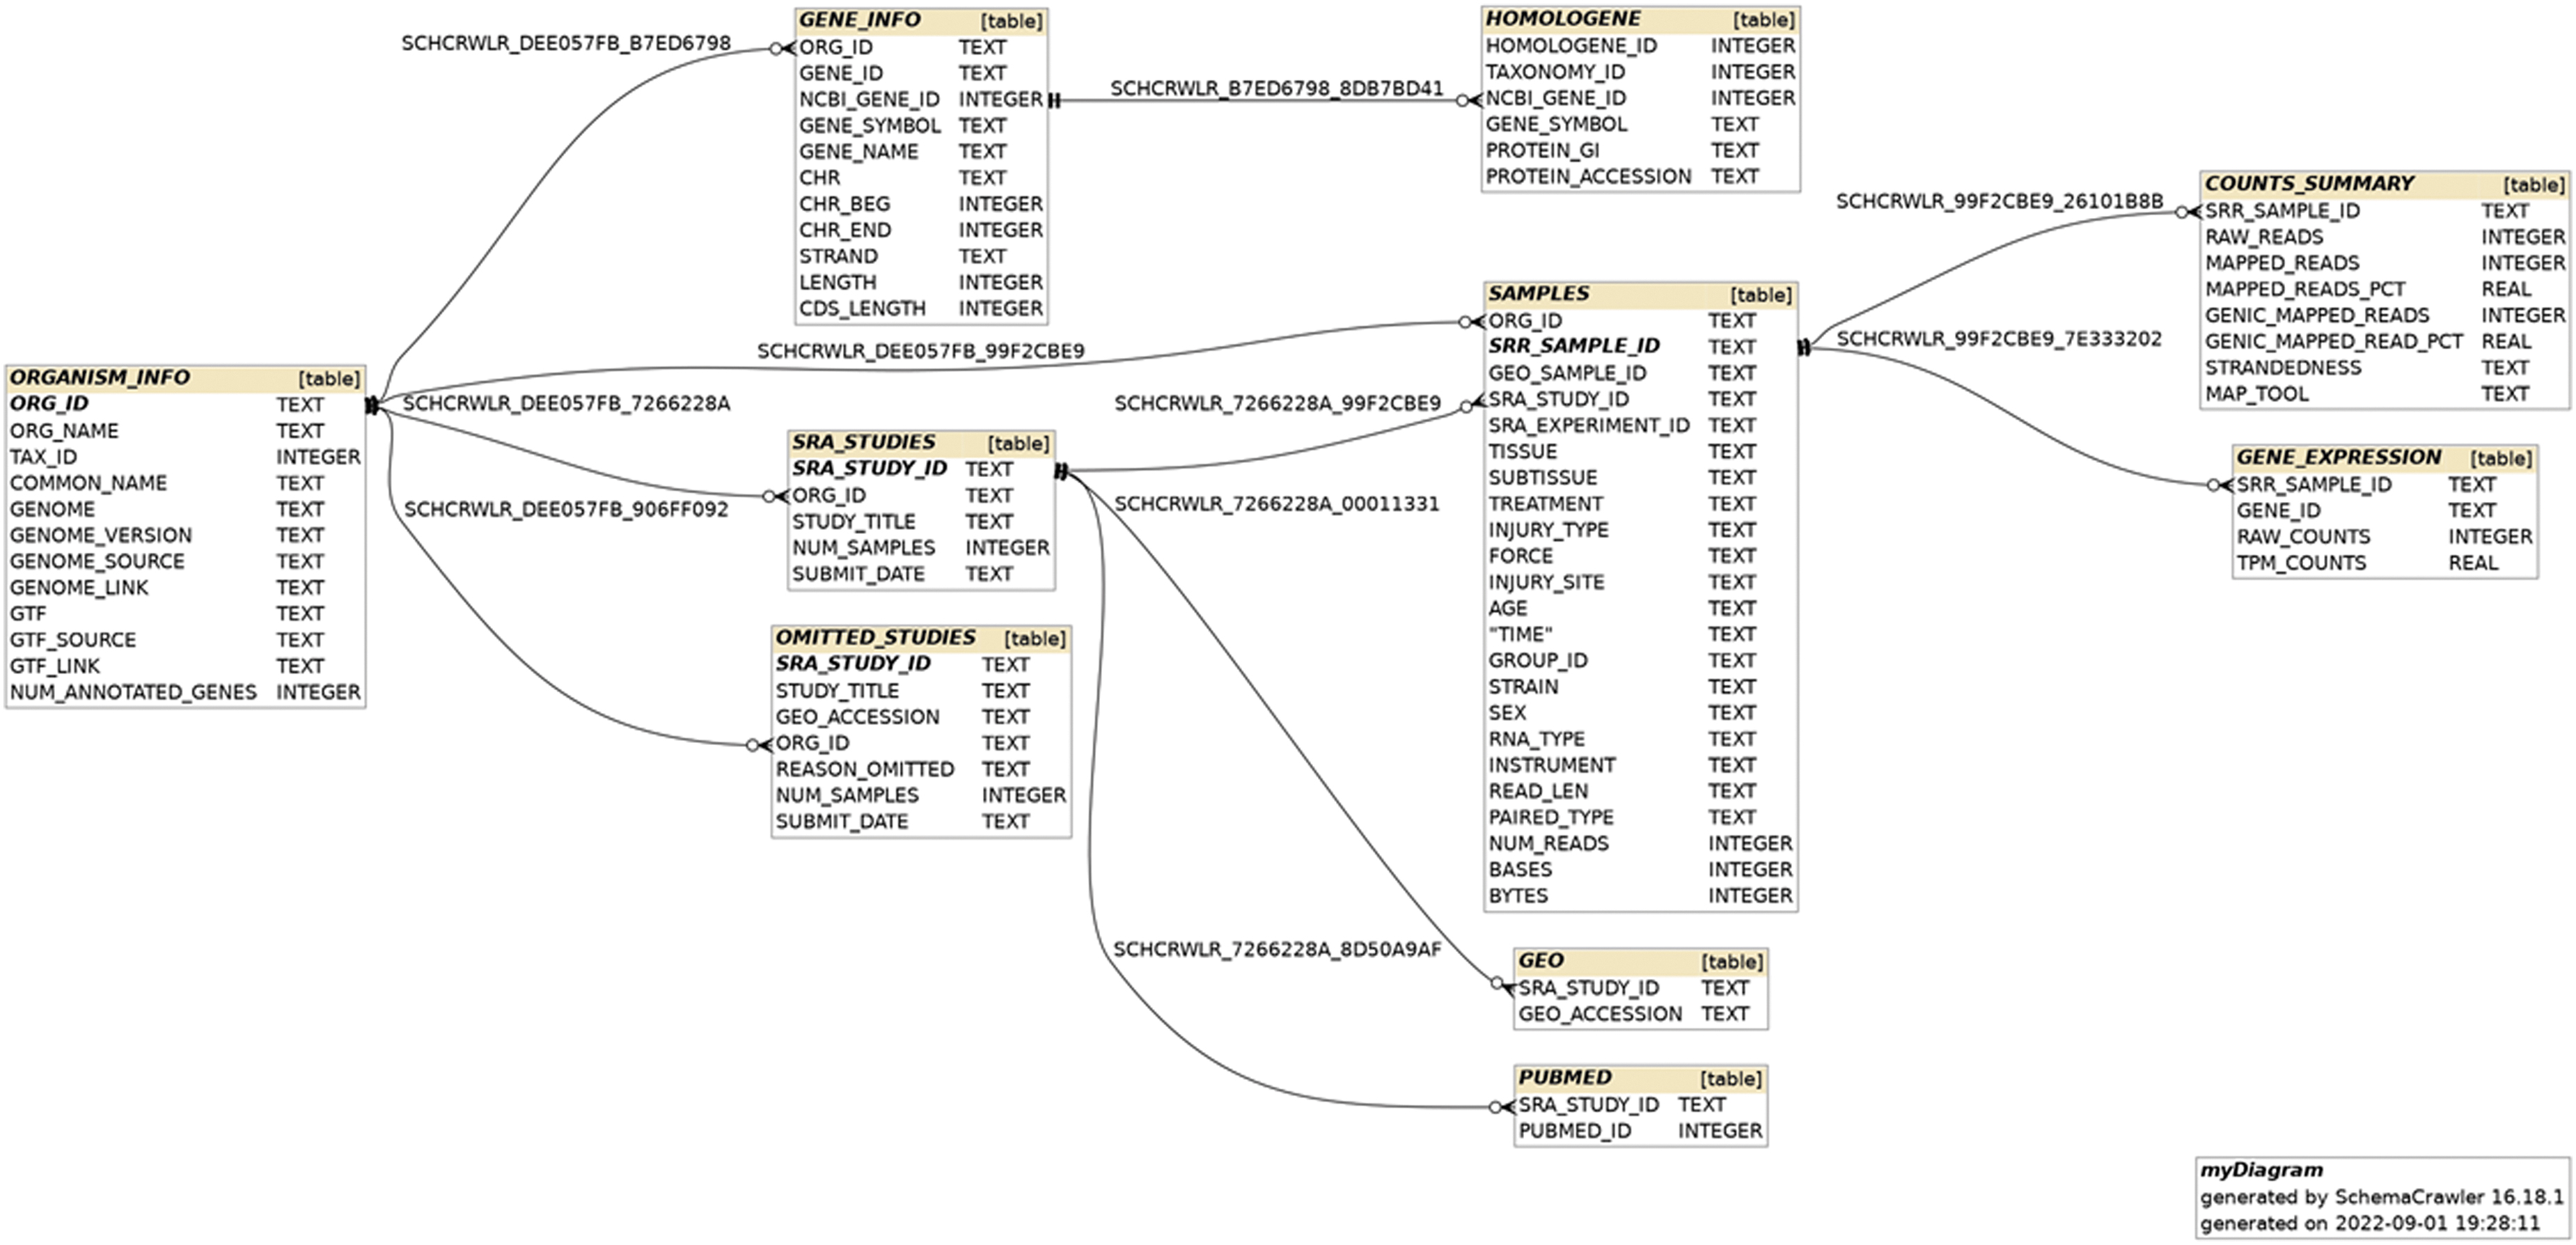
Entity-relationship (ER) model for the SQLite database.
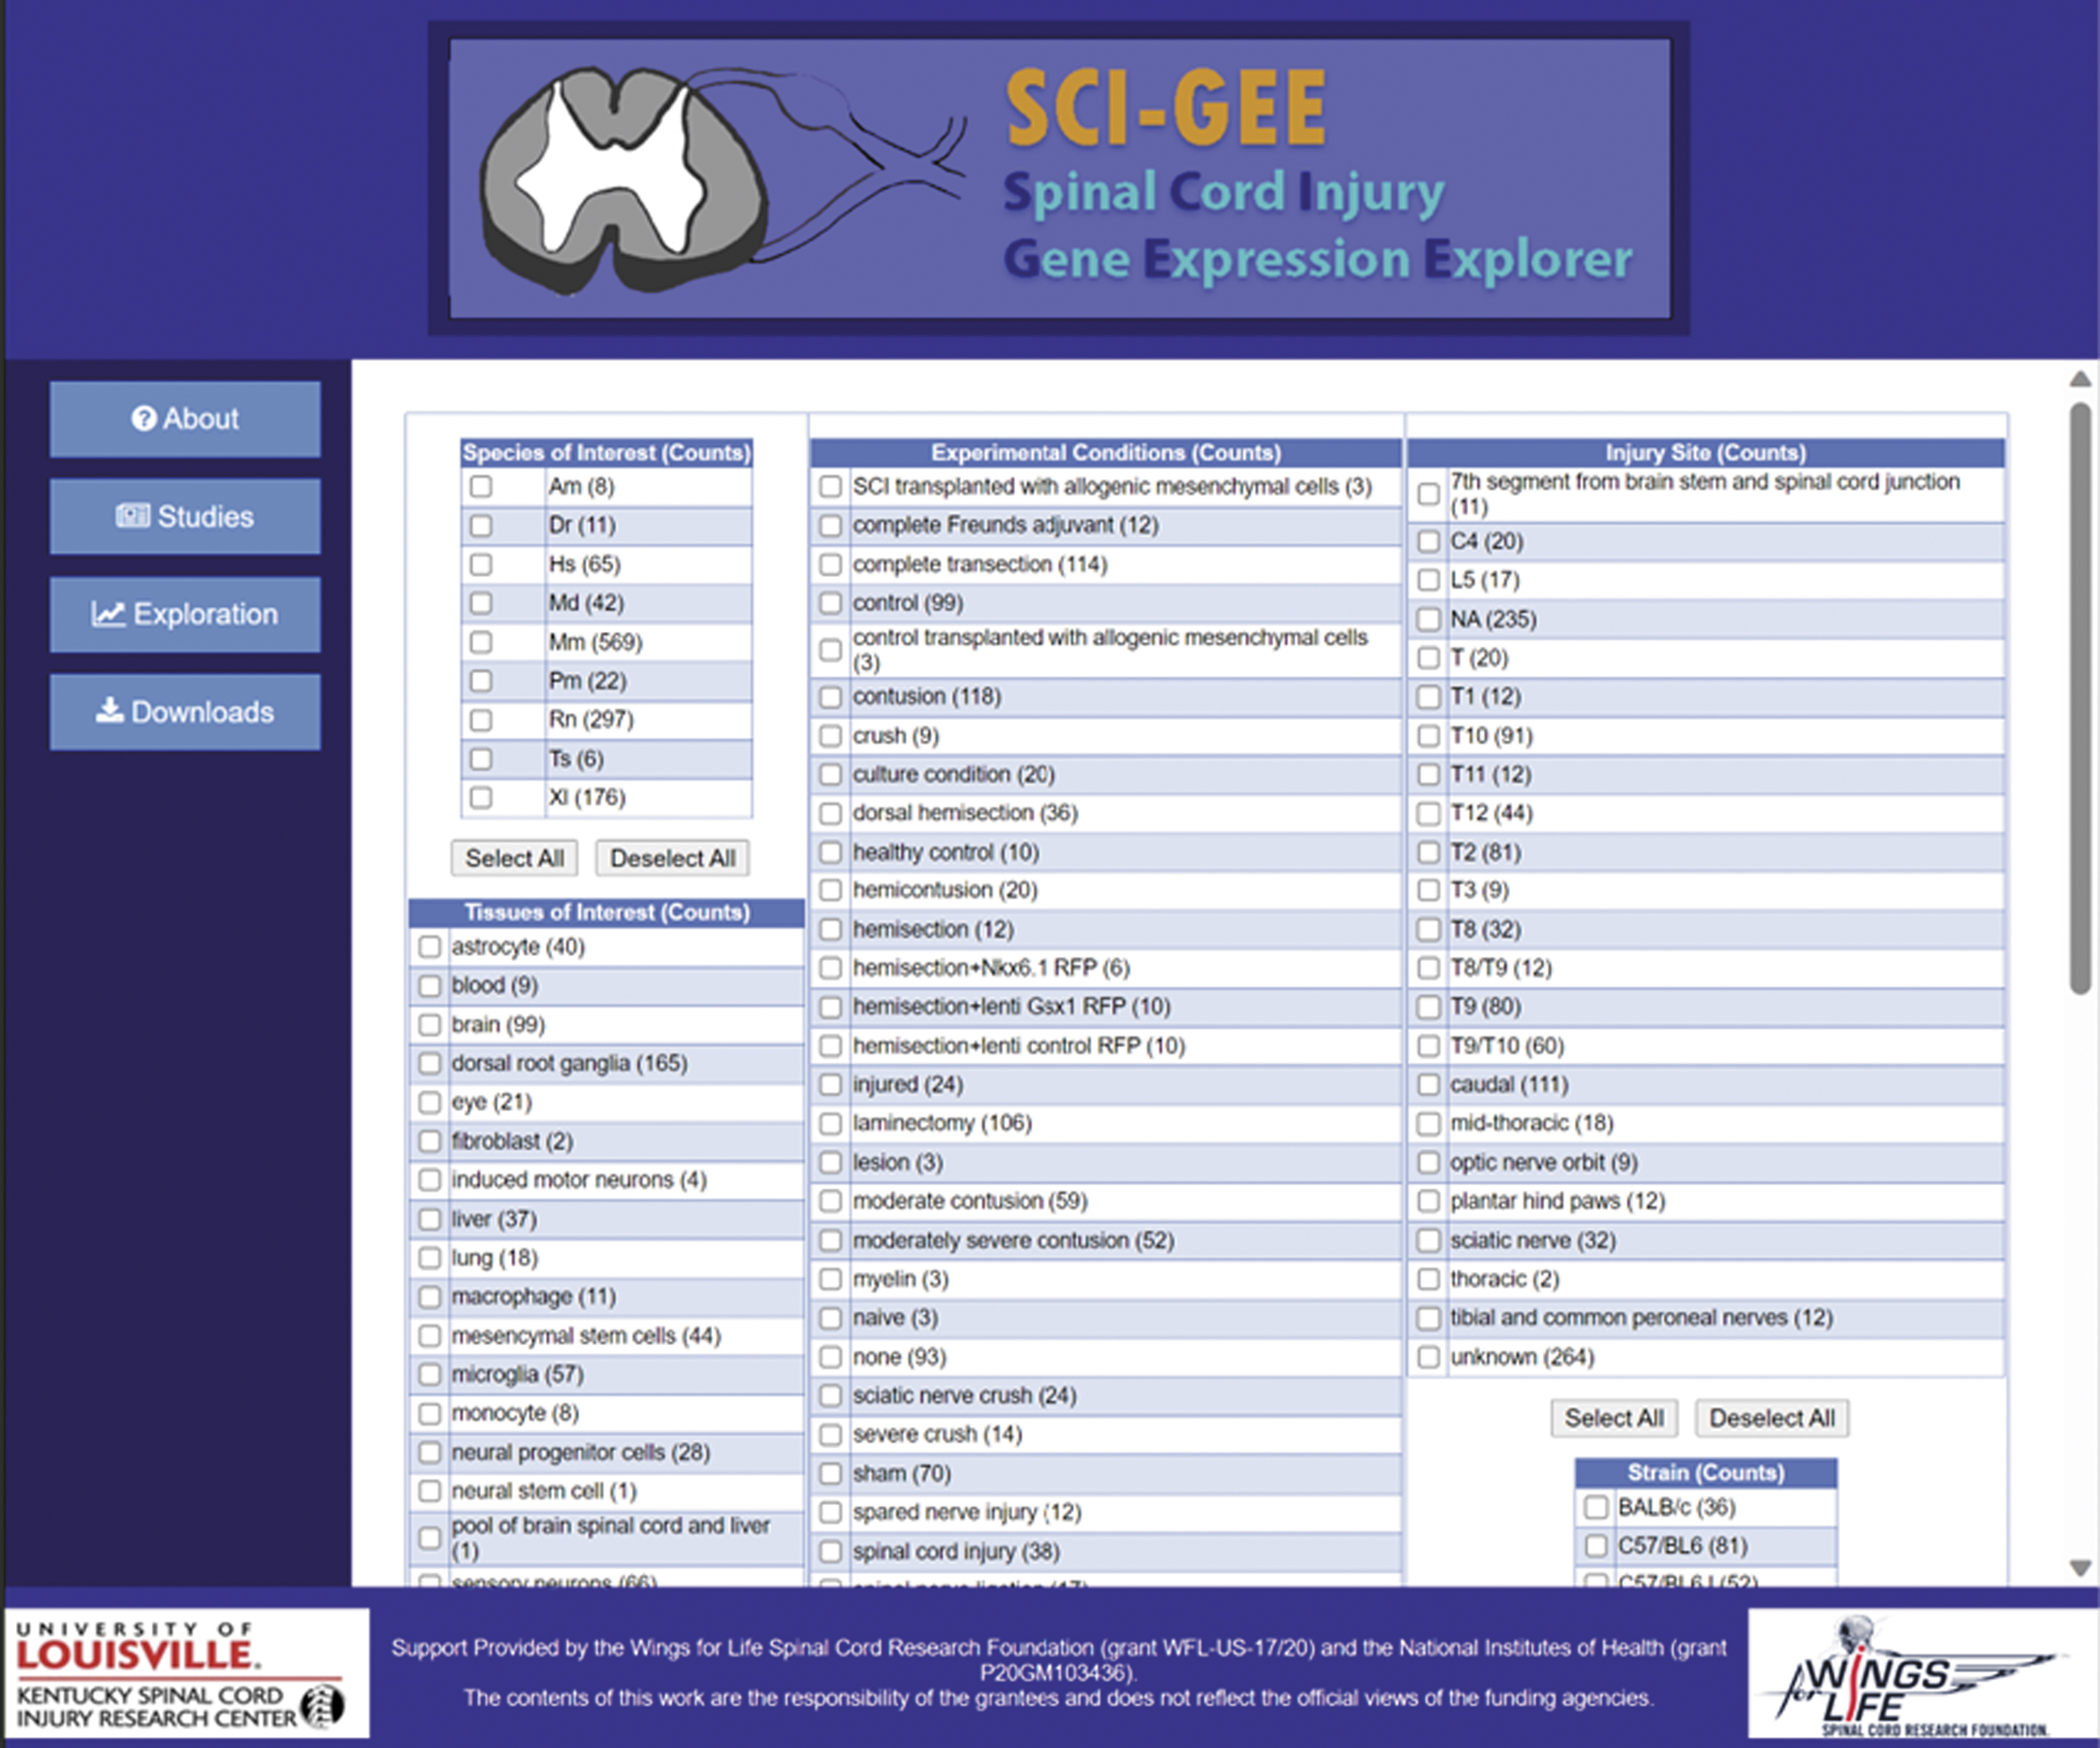
Data exploration page. SCI-GEE users are presented with choices for species of interest, tissues of interest, injury of interest, and injury site of interest.
Data exploration
The user begins a data exploration by first selecting the organisms, tissues, injury types, injury locations, sex, strain, and specific genes of interest. They are then presented with the resulting sample groups that can be selected for a pairwise analysis (Supplementary Fig. S7). Once the differential expression analysis is complete, the user is returned a set of results, including the top 25 up- and down-regulated genes (Supplementary Fig. S8), heatmaps for the top 250 differentially expressed genes (Supplementary Fig. S9) and genes with the highest variance, principal component analysis (PCA) plot, volcano plot, heatmap for genes of interest, and GO:BP and KEGG pathway enriched categories.
Discussion
Case usage studies
Demonstration of the utility of SCI-GEE was performed with two usage studies in mouse and rat: 1) analysis of DRG in spinal cord injured versus uninjured samples across all available injury sites; and 2) spinal cord tissue in spinal cord injured versus uninjured samples. Mouse and rat were selected since they have the highest representation in the database. For both studies, results were available for three groups, including mouse and rat homologs; mouse genes only; and rat genes only. In the case of mouse and rat homologs, a total of 16,529 genes were compared based on shared homologene IDs, 60 while the mouse samples were compared using 55,487 genes (including both protein coding and noncoding genes), and 32,883 rat genes were utilized for that comparison. While the data analyzed in SCI-GEE is available for download and utilization in other analytical workflows of interest, the results presented here are fully contained within the website functionality. For both tissue sets, the control and injured samples separated as illustrated by the PCA plots for DRG (Fig. 4A) and spinal cord (Fig. 4B), although a high degree of variance was found in the injured samples due to variability in other experimental factors, including injury type, severity, and time since injury.
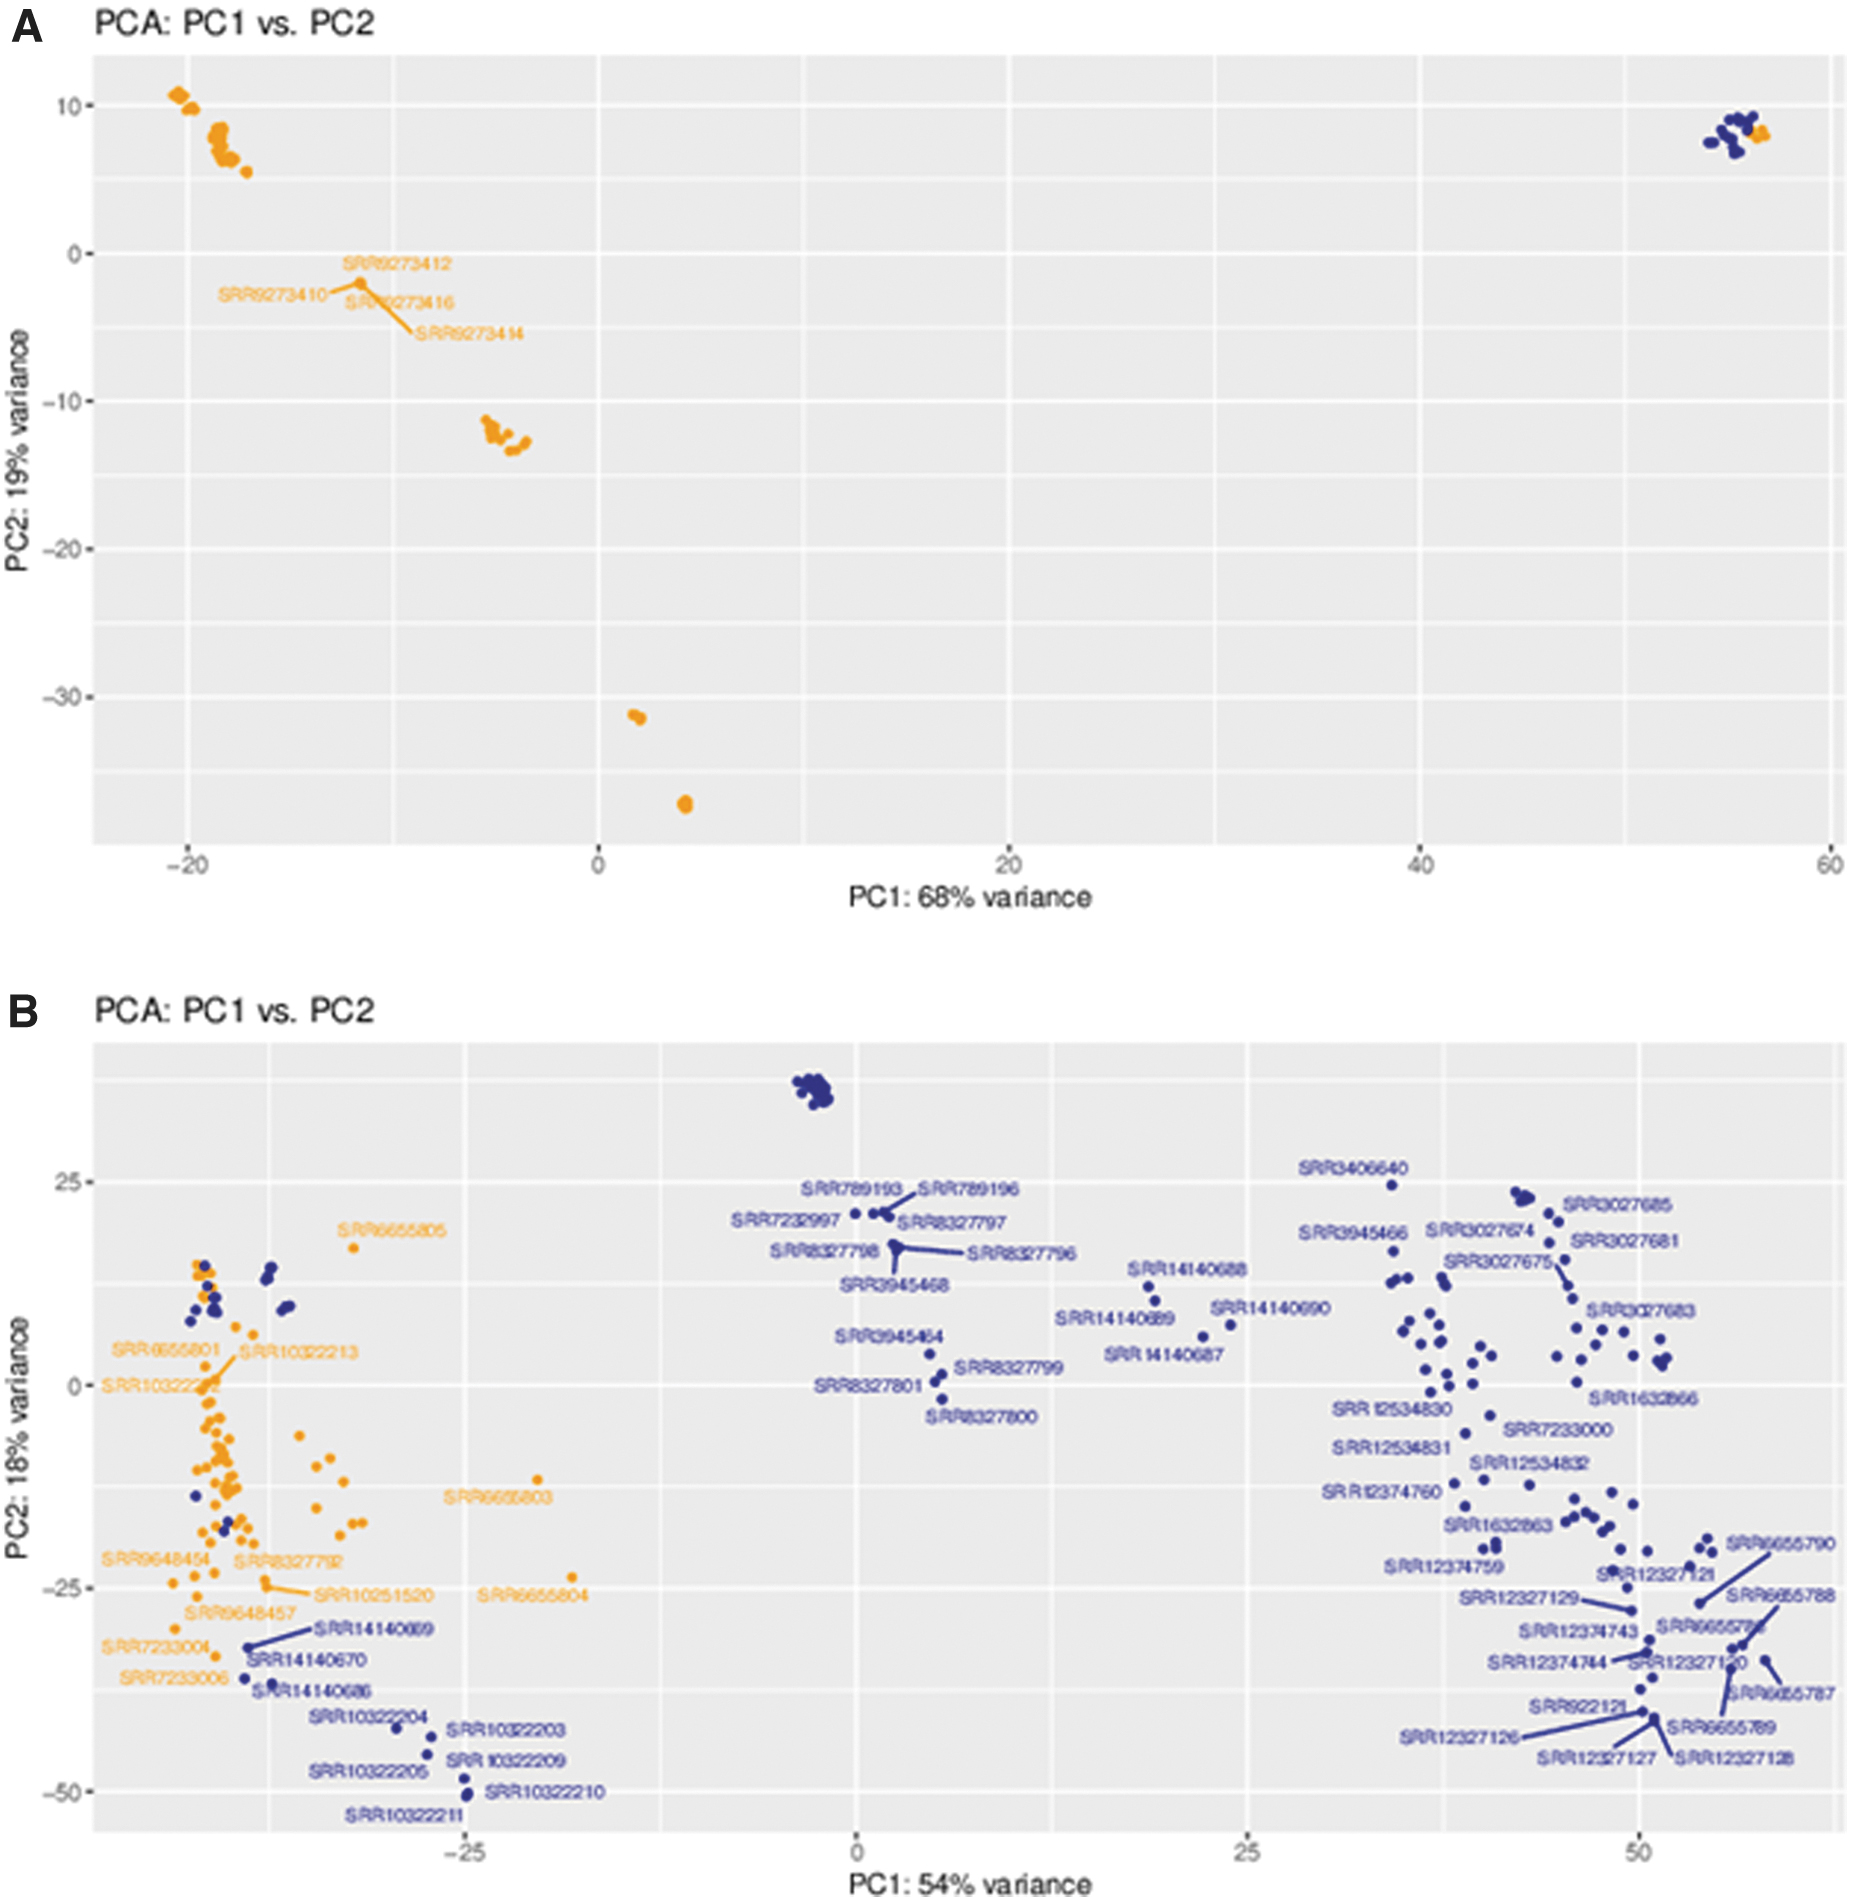
Principal component analysis (PCA) based on gene expression. Shown are
DRG tissue analysis
For the DRG tissue dataset, two groups were created across mouse and rat: control samples (including both naïve and sham models) and spinal cord injured samples (Supplementary Table S2). The spinal cord injuries were from a variety of models, including hemisection, transection, and contusion. One of the meta-analysis capabilities of SCI-GEE is the ability to perform cross-species analysis across human, mouse, and rat by looking at the expression of common homologs across species. In these usage cases, shared homologene IDs across mouse and rat were examined.
The top 25 up-regulated genes are shown in Supplementary Table S3, while the top 25 down-regulated genes are shown in Supplementary Table S4. Included in the up-regulated genes in the DRG for the mouse and rat meta-analysis are GADD45A, which is involved in cell cycle and neuronal cell death 66 and may act in a neuroprotective fashion 67 -69 ; GPR151, which is involved in neuropathic pain, and may promote axon regeneration 70,71 ; FLRT3, which promotes neurite outgrowth 72 -74 ; CRLF1, which forms complexes with neurotrophic factors to promote survival of neuronal cells 75 ; and the neuropeptide GAL. 76,77 At the top of the down-regulated genes are two leucine zipper proteins (FOSB and FOS), two zinc fingers (EGR1 and ZFP36), and CYR61. These all play roles in regulating cell proliferation and apoptosis, indicating that regulatory machinery is turned off in response to spinal cord injury. In the DRG for mouse only, the top 25 up-regulated genes are shown in Supplementary Table S5, and the top 25 down-regulated are shown in Supplementary Table S6.
At the top of the up-regulated genes are GADD45A, FST, GPR151, IGFN1, and TES. The up-regulation of FST (follistatin) and TES (testin LIM domain protein) may be indicative of sex-specific differences in the makeup of the mouse samples, while GPR151 is known to modulate neuropathic pain 78,79 and IGFN1 is involved in synapse assembly. 80 The top mouse down-regulated genes are similar to those found for mouse and rat homologs. The top 25 up-regulated genes in DRG for the rat only are shown in Supplementary Table S7, and the top 25 down-regulated genes are shown in Supplementary Table S8. Among the up-regulated genes are several members of the Hox gene family (Hoxc11, Hoxd10, and Hoxd11), which are important for motor neuron patterning, 81 –84 as well as peripheral myelin protein 2 (Pmp2). The down-regulated genes include Usp5, which modulates neuropathic and inflammatory pain 85 ; Tuba1a, which is necessary for central nervous system development and regeneration 86 ; Csf1r, which promotes microglial proliferation 87,88 ; and Slc39a6, which is found in reactive astrocytes. 89
For each of the comparisons (both, mouse, and rat, respectively), volcano plots were generated to show the overall pattern of expression, including the fold-change across the x-axis and the q-value significance across the y-axis (Fig. 5A-C), which illustrates a relative even distribution of the data. Heatmaps were generated showing the top differentially expressed genes (Supplementary Fig. S10A-C), with the genes listed across the rows, and the samples across the columns.
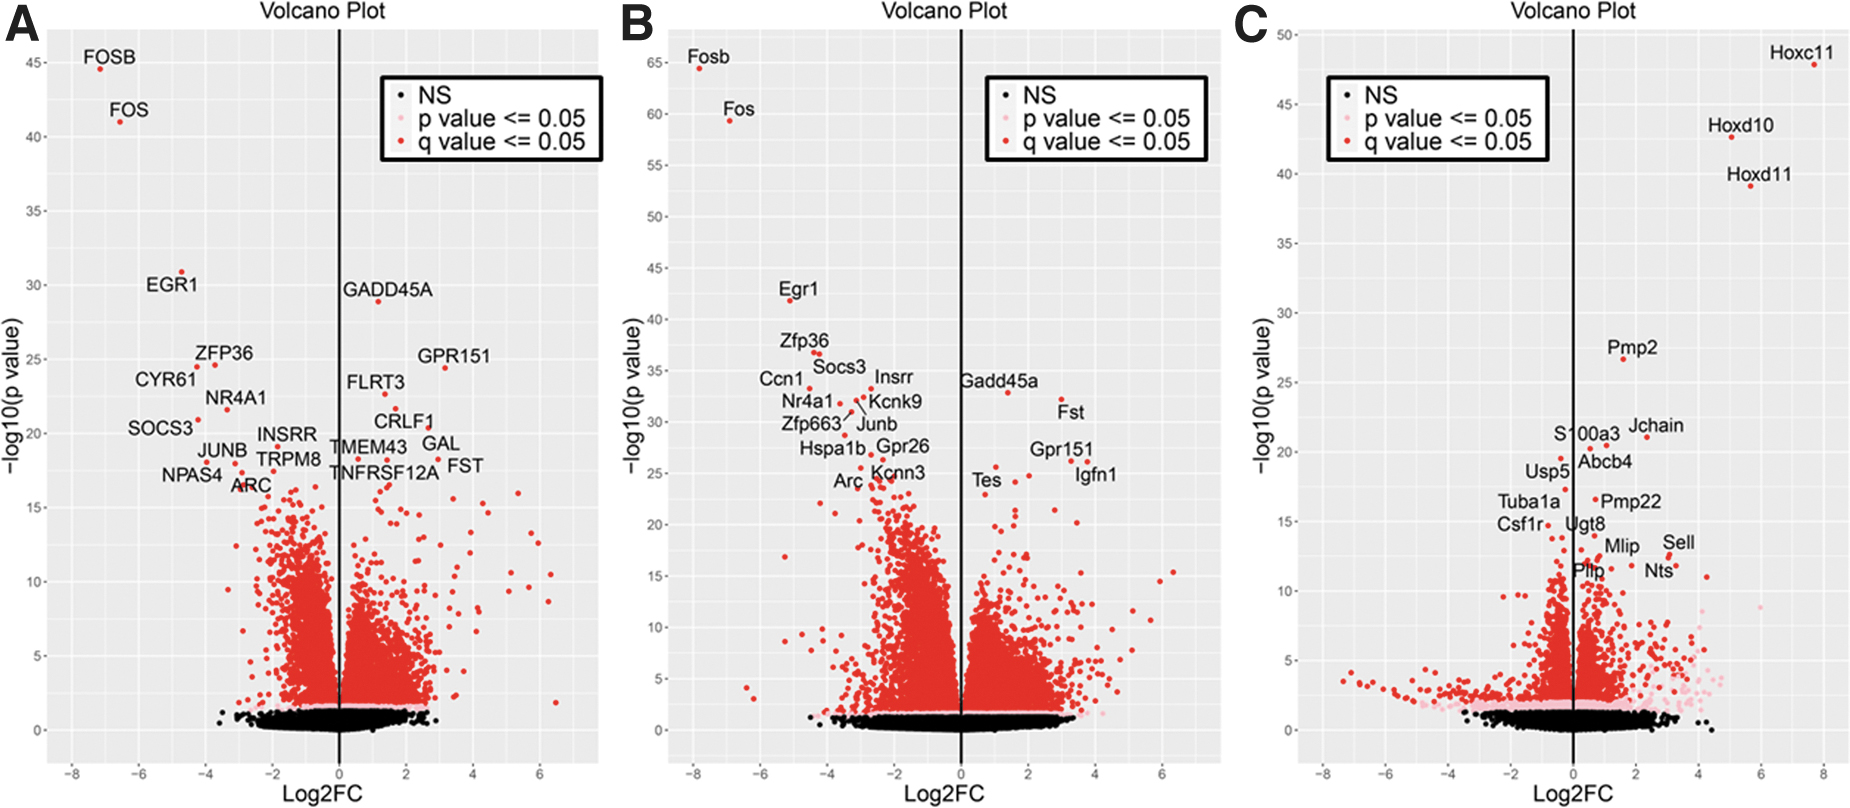
Volcano plots shown for dorsal root ganglion (DRG) samples. Shown are
DRG enrichment analysis
Differentially expressed genes from the mouse and rat comparisons were used as input into ClusterProfiler 64 for analysis of enriched GO:BP 62 and KEGG Metabolic Pathways. 63 The top 20 GO:BP enrichments are shown in Figure 6A and 6B for mouse and rat respectively, while the top 20 KEGG enrichments are shown in Figure 6C and 6D. For the mouse differentially expressed genes, several of the top GO:BP annotations are associated with nervous system development, including synapse organization, regulation of neurogenesis, axonogenesis, epithelial tube morphogenesis, and dendrite development, potentially indicating responses for regeneration and/or collateral sprouting. Others are associated with muscular development, including muscle tissue development, muscle cell differentiation, and striated muscle cell differentiation. A third cluster is related to cell signaling and adhesion, including cell-substrate adhesion, positive regulation of cell adhesion, regulation of metal ion transport, calcium ion transport, and cell junction assembly.
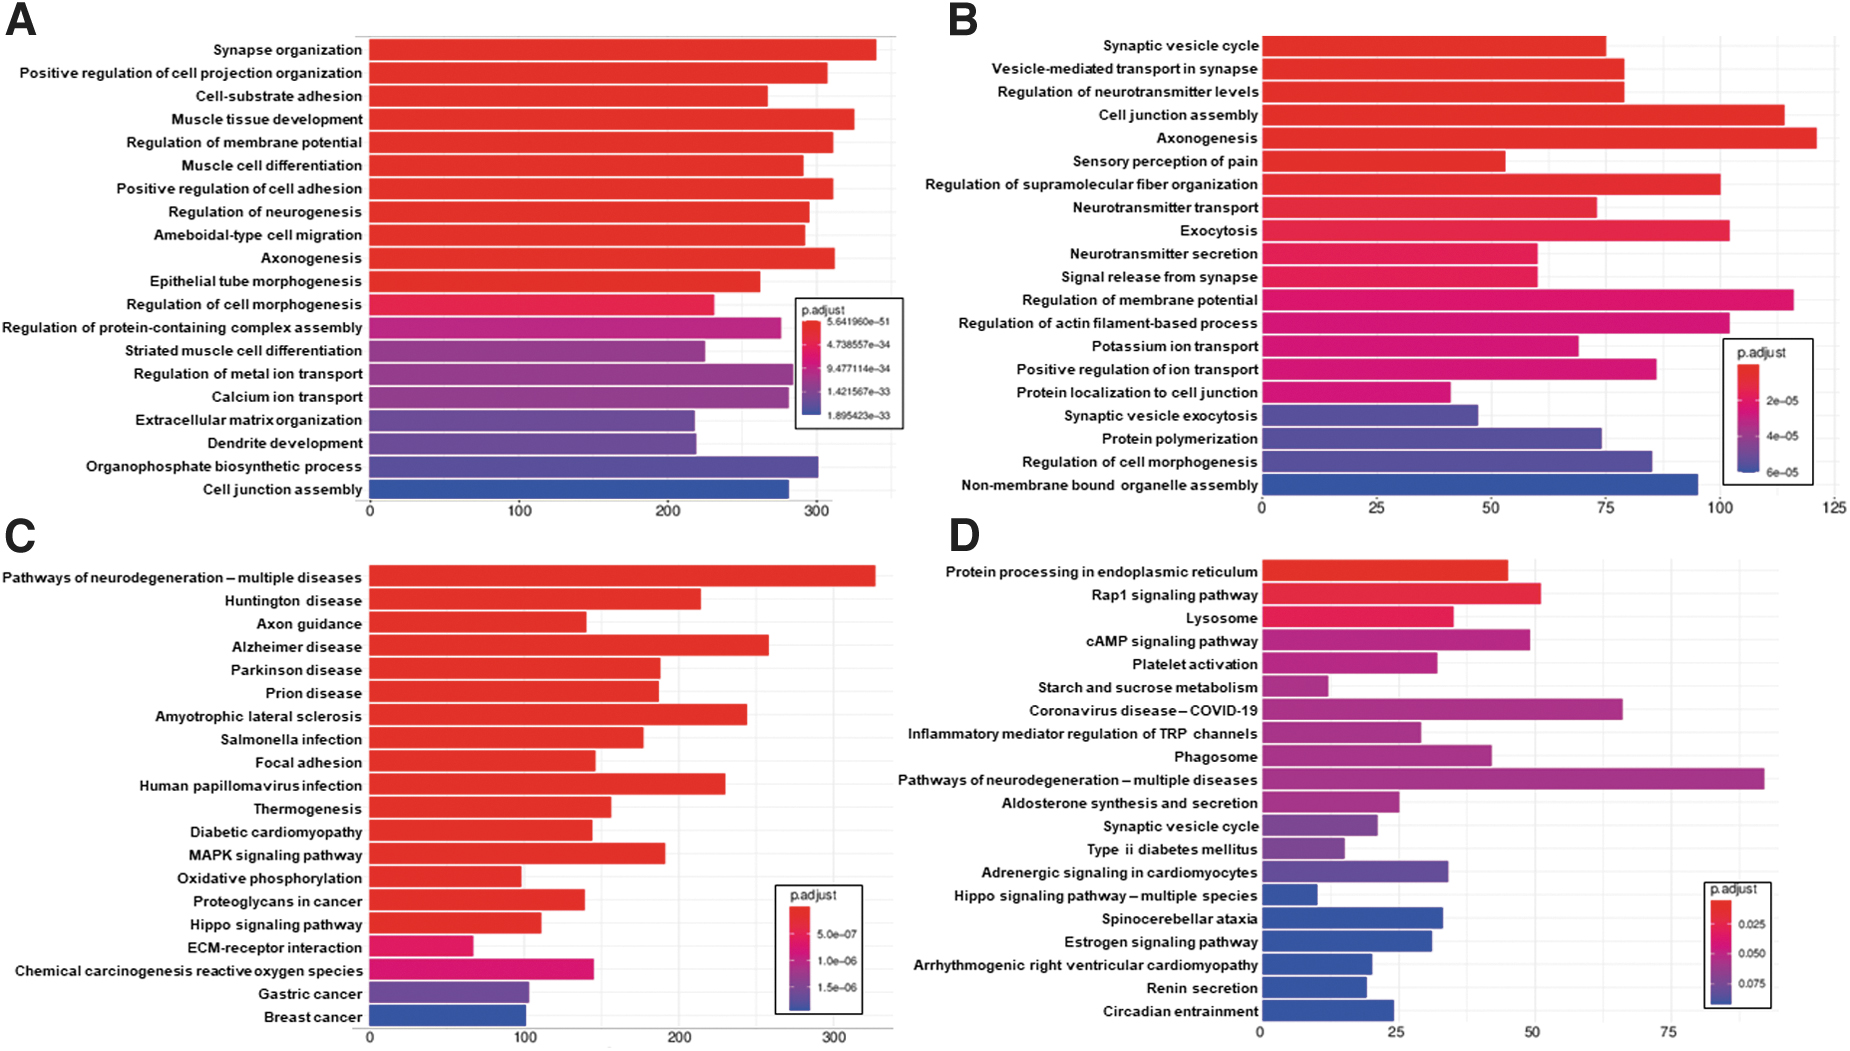
Top 20 clusterProfiler enrichments for dorsal root ganglion (DRG) injury. Included are top 20 GO:BP enrichments for DRG injury vs. control comparison for
Results are similar for the rat, including synaptic vesicle cycle, vesicle-mediated transport in synapse, axonogenesis, regulation of neurotransmitter levels, sensory perception of pain, neurotransmitter transport, neurotransmitter secretion, signal release from synapse, regulation of membrane potential, potassium ion transport, positive regulation of ion transport, protein localization to cell junction, and synaptic vesicle exocytosis. The KEGG pathway enrichment results are less clear, but include pathways of neurodegeneration, axon guidance and synaptic vesicle cycle, along with a number of seemingly unrelated pathways, many of which are tied to proinflammatory responses.
Spinal cord tissue analysis
In the case of the spinal cord tissues, two groups were created across mouse and rat: control samples (including both naïve and sham models) and spinal cord injured samples (Supplementary Table S9). The spinal cord injuries were from a variety of models, including hemisection, transection, hemicontusion, and contusion. Among the top up-regulated differentially expressed genes for the meta-analysis across mouse and rat homologs (Supplementary Table S10) are SIGLEC1 (CD169), which signals an increase in metallophilic macrophages and an increased immune response 90 ; GPNMB, a glioma-associated glycoprotein 91 ; MPEG1, a macrophage/microglia marker gene 92,93 ; CCL13 which is produced from M2 macrophages 94 ; and CD68, a marker for phagocytic microglia. 95 Down-regulated genes (Supplementary Table S11) include HMGCS1, HMGCR MSMO1 and IDI1, which are involved in cholesterol metabolism, and whose down-regulation may prevent demyelination. 96,97 The mouse-only study shows similar results to the mouse and rat homologs, with Gpnmb, Ccl2, Bst2, Lyz2, and Trem2 among the top up-regulated genes (Supplementary Table S12). Ccl2 is a cytokine functioning in inflammation and pain following spinal cord injury, 98 while Bst2 is a neuroinflammation biomarker. 99 Lyz2 is expressed in reactive microglia and macrophages, 100 and Trem2 elicits a proinflammatory response in microglia. 101 Down-regulated genes include Cltrn, Aldob, Rapgef5, Mep1a, and Slc22a12 (Supplementary Table S13). Aldob has a role in glycolysis and glucogenesis, 102 while Rapgef5 is involved in signal transduction with the Ras pathway. 103
Up-regulated genes for the rat-only spinal cord tissue includes Siglec1, Lilrb3, Gpnmb, Clec7a, and Mmp12 (Supplementary Table S14), similar to the results for the mouse and rat homologs. Ablation of Lilrb3 has been shown to promote neurite outgrowth, 104 while Clec7a is a marker of actively proliferating microglia 105 and Mmp12 is involved in myelination. The top down-regulated rat genes include a number of genes with unknown function (Supplementary Table S15). Among those that have associated functions are Hmgcr, Mff, and Msmo1. As previously mentioned, Hmgcr and Msmo1 function in cholesterol metabolism, while Mff is associated with lengthening neuron life. 106 Volcano plots and heatmaps are provided in Supplementary Figure S11A and S11B, and Supplementary Figure S12A and S12B, respectively.
Spinal cord enrichment analysis
Among the top 20 GO:BP enrichments (Fig 7A, 7B) are a number of proinflammatory annotations, including negative regulation of immune system process, regulation of inflammatory response, leukocyte migration, leukocyte cell-cell adhesion, cytokine-mediated signaling pathway, leukocyte proliferation, regulation of T cell activation, regulation of leukocyte migration, and myeloid leukocyte activation. Enriched KEGG metabolic pathways (Fig. 7C, 7D) include a number of signaling pathways (NF-kappa B signaling pathway, TNF signaling pathway, MAPK signaling pathway, B cell receptor signaling pathway, NOD-like receptor signaling pathway, Toll-like receptor signaling pathway, cytokine-cytokine receptor interaction, and Hippo signaling pathway, indicating that spinal cord injury leads to a number of signaling cascades in the spinal cord itself, consistent with previous independent findings, 107 –111 as well as within the studies whose samples are included in this case study. 112 –118
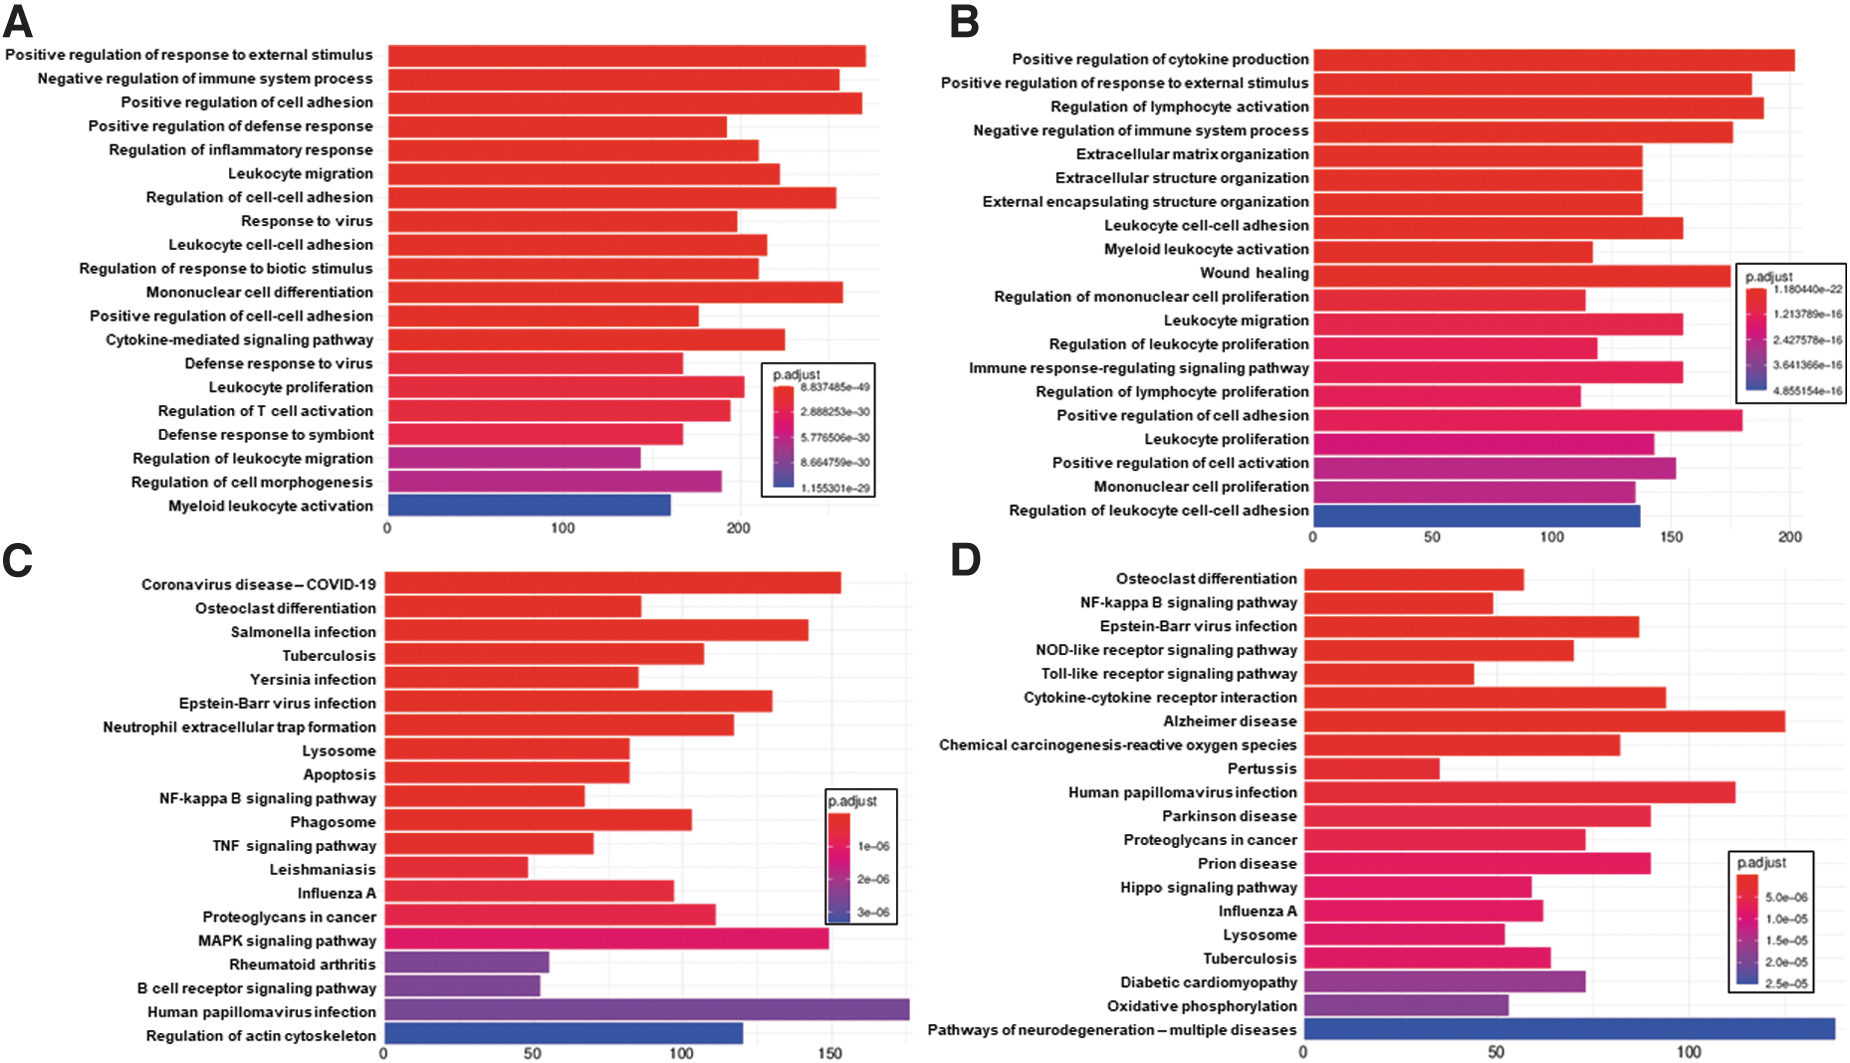
Top 20 clusterProfiler enrichments for spinal cord injury. Included are top 20 GO:BP enrichments for spinal cord injury vs. control comparison for
Single cell transcriptomics
More recent transcriptome work in the SCI field has included studies utilizing single cell RNA-Seq (scRNA-Seq), 100,119 -125 including a recent atlas of spinal cord injury in mice. 123 Due to the complexities of scRNA-Seq data, including cell typing and the disparity between limited sample numbers and large numbers of cells per sample, as well as a different modality for viewing scRNA-Seq data, we chose not to include those data at this time to focus on the more broadly available bulk RNA-Seq datasets. Over time, we anticipate that more scRNA-Seq datasets will be generated for SCI as costs come down. When that happens, we plan to develop a parallel method for integrating scRNA-Seq data. Such a resource would allow for more resolution at a single cell level, providing for an atlas of transcriptional changes for cells affected by SCI.
Conclusions
Our approach for preparing bulk RNA-Seq data related to SCI allows for greater interoperability across datasets. This in turn enables for meta-analyses both within and across species. By providing the data in an SQLite format, potential users are able to either utilize our web interface for exploring the available data, or develop their own analysis pipelines the utilizes the prepared data. We hope this work will eventually be incorporated into ODC-SCI data types, allowing for even greater integration along the genome-to-phenome modalities.
Transparency, Rigor, and Reproducibility Summary
All datasets utilized in this research are publicly available in the Sequence Read Archive and can be accessed using the SRA IDs available in Supplementary Table S2. The complete details of the data processing are provided in the Methods section. All raw and processed transcript count data is provided at the website: http://162.215.210.70/∼tracks/SCI-GEE .
Footnotes
Acknowledgments
A prior version of this manuscript titled “Construction of a searchable database for gene expression changes in spinal cord injury experiments” is available on the bioRxiv preprint server (doi: ![]() ).
).
The SQLite database, flat files used to construct the database, and the web interface can be accessed at: ![]() .
.
Ethical Compliance: No human subjects, human data or tissues, or animals were used in this study.
Authors' Contributions
Eric Rouchka: Conceptualization (lead), Methodology (lead), Software (lead), Validation (lead), Formal analysis (lead), Investigation (lead), Resources (lead), Data Curation (lead), Writing—Original Draft (lead), Visualization (lead), Supervision (lead), Project administration (lead), Funding acquisition (head).
Carlos de Almeida: Conceptualization (equal), Methodology (equal), Investigation (equal), Writing—Review and Editing (equal).
Randi B. House: Software (supporting), Formal analysis (supporting), Investigation (supporting), Data curation (equal), Writing—Review and Editing (supporting).
Jonah C. Daneshmand: Software (supporting), Formal analysis (supporting), Data curation (supporting), Writing—Review and Editing (supporting).
Julia H. Chariker: Investigation (supporting), Data Curation (supporting), Writing—Review and Editing (supporting).
Sujata Saraswat-Ohri: Conceptualization (supporting), Writing—Review and Editing (supporting), Supervision (supporting).
Cyntha Gomes: Conceptualization (supporting), Writing—Review and Editing (supporting).
Morgan Sharp: Conceptualization (supporting), Writing – Review and Editing (supporting).
Alice Shum-Siu: Conceptualization (supporting), Writing—Review and Editing (supporting).
Greta Cesarz: Conceptualization (supporting), Writing—Review and Editing (supporting).
Jeff Petruska: Conceptualization (supporting), Methodology (supporting), Writing—Review and Editing (equal), Supervision (supporting).
David Magnuson: Conceptualization (equal), Methodology (equal), Resources (equal), Writing—Original Draft (equal), Supervision (equal), Project administration (equal), Funding acquisition (equal).
Funding Information
Support provided by the Wings for Life Spinal Cord Research Foundation (grant WFL-US-17/20) and the National Institutes of Health (grants P20GM103436, R01NS094741 and R21NS120498). The contents of this manuscript do not reflect the official views of the funding agencies.
Author Disclosure Statement
No competing financial interests exist.
Supplementary Material
Supplementary Figure S1
Supplementary Figure S2
Supplementary Figure S3
Supplementary Figure S4
Supplementary Figure S5
Supplementary Figure S6
Supplementary Figure S7
Supplementary Figure S8
Supplementary Figure S9
Supplementary Figure S10
Supplementary Figure S11
Supplementary Figure S12
Supplementary Table S1
Supplementary Table S2
Supplementary Table S3
Supplementary Table S4
Supplementary Table S5
Supplementary Table S6
Supplementary Table S7
Supplementary Table S8
Supplementary Table S9
Supplementary Table S10
Supplementary Table S11
Supplementary Table S12
Supplementary Table S13
Supplementary Table S14
Supplementary Table S15
References
Supplementary Material
Please find the following supplemental material available below.
For Open Access articles published under a Creative Commons License, all supplemental material carries the same license as the article it is associated with.
For non-Open Access articles published, all supplemental material carries a non-exclusive license, and permission requests for re-use of supplemental material or any part of supplemental material shall be sent directly to the copyright owner as specified in the copyright notice associated with the article.