
Abstract
The difficulty of accurately identifying patients who would benefit from promising treatments makes it challenging to prove the efficacy of novel treatments for traumatic brain injury (TBI). Although machine learning is being increasingly applied to this task, existing binary outcome prediction models are insufficient for the effective stratification of TBI patients. The aim of this study was to develop an accurate 3-class outcome prediction model to enable appropriate patient stratification. To this end, retrospective balanced data of 1200 blunt TBI patients admitted to six Japanese hospitals from January 2018 onwards (200 consecutive cases at each institution) were used for model training and validation. We incorporated 21 predictors obtained in the emergency department, including age, sex, six clinical findings, four laboratory parameters, eight computed tomography findings, and an emergency craniotomy. We developed two machine learning models (XGBoost and dense neural network) and logistic regression models to predict 3-class outcomes based on the Glasgow Outcome Scale-Extended (GOSE) at discharge. The prediction models were developed using a training dataset with n = 1000, and their prediction performances were evaluated over two validation rounds on a validation dataset (n = 80) and a test dataset (n = 120) using the bootstrap method. Of the 1200 patients in aggregate, the median patient age was 71 years, 199 (16.7%) exhibited severe TBI, and emergency craniotomy was performed on 104 patients (8.7%). The median length of stay was 13.0 days. The 3-class outcomes were good recovery/moderate disability for 709 patients (59.1%), severe disability/vegetative state in 416 patients (34.7%), and death in 75 patients (6.2%). XGBoost model performed well with 69.5% sensitivity, 82.5% accuracy, and an area under the receiver operating characteristic curve of 0.901 in the final validation. In terms of the receiver operating characteristic curve analysis, the XGBoost outperformed the neural network-based and logistic regression models slightly. In particular, XGBoost outperformed the logistic regression model significantly in predicting severe disability/vegetative state. Although each model predicted favorable outcomes accurately, they tended to miss the mortality prediction. The proposed machine learning model was demonstrated to be capable of accurate prediction of in-hospital outcomes following TBI, even with the three GOSE-based categories. As a result, it is expected to be more impactful in the development of appropriate patient stratification methods in future TBI studies than conventional binary prognostic models. Further, outcomes were predicted based on only clinical data obtained from the emergency department. However, developing a robust model with consistent performance in diverse scenarios remains challenging, and further efforts are needed to improve generalization performance.
Introduction
There have been no significant advances in the treatment of traumatic brain injury (TBI) in recent decades. 1 Although mortality for patients with severe TBI has decreased slightly, which is primarily attributable to improvements in the emergency medical system, the prevalence of severe disability and vegetative state has increased. Moreover, the rate of favorable outcomes has not been improved. 2,3 As a result, TBI remains the leading cause of death among young people and the leading cause of death and disability in all age groups globally. 1,4 Further, the incidence of TBI is expected to continue to increase. 5 As such, various clinical trials have been conducted to improve the prognosis of TBI. 6
However, despite promising pre-clinical results, most randomized clinical trials on medical and surgical treatments have failed to demonstrate effectiveness. 1,6,7 The failure of prospective trials to demonstrate statistical superiority for such treatments may be attributed to the inability to identify patients who would benefit from novel therapies accurately. Existing screening methods, such as the Glasgow Coma Scale (GCS), should be insufficient on their own for successful stratification in clinical trials involving TBI patients with multiple underlying pathophysiological mechanisms. The pathogenesis of TBI involves not only primary brain injury from hematoma, cerebral contusion, diffuse axonal injury, and diffuse brain swelling, but also ischemia-reperfusion injury, inflammatory reaction, brain herniation, hypoxia, and hypotension caused by extracranial injuries, and secondary brain swelling resulting from these processes. 3,6
Machine learning techniques have been applied to classify TBI patients appropriately in several studies, including our previous study. 8 However, most of these models only provide binary predictions, such as in-hospital mortality, and are insufficient to describe patient severity and thus contribute to effective stratification. 9 –15 Currently, it remains unclear whether machine learning models can predict more specific outcome categories to stratify TBI patients more precisely.
The objective of this study was to develop an accurate 3-class outcome prediction model that can serve as the basis for appropriate patient stratification in future TBI studies. We only used clinical data obtained from the emergency department (ED) to train machine learning models based on multi-institutional retrospective data.
Methods
Ethical approval and data acquisition
The ethics committee of the Japanese Red Cross Kobe Hospital approved this study (No. 247) and waived the requirement for informed consent, as this was a retrospective observational study. In compliance with the Ethical Guidelines for Medical and Health Research Involving Human Subjects in Japan, participants in the study were given the option to withdraw from the study at any time through an opt-out method on institutional websites. The data supporting this study's findings are available from the corresponding author upon reasonable request. This study followed the transparent reporting of a multi-variable prediction model for individual prognosis or diagnosis guidelines. 16
Study design and participants
Data for 200 consecutive patients admitted for acute TBI treatments to each of six hospitals in Hyogo, Japan, from January 2018 onwards were collected retrospectively. To enroll 200 patients from each institution, patient data were collected until November 2021 at hospitals with fewer TBI patients, and until May 2019 at hospitals with more patients. Four of the six facilities are trauma and acute critical care centers, while two are tertiary care hospitals. All participating institutions offer 24-h neurosurgical services and acute neurological care to TBI patients, with board-certified neurosurgeons providing standard management according to the guidelines and consensus. 17,18 All information was obtained from electronic health record systems or institutional trauma registries.
Inclusion criteria were: 1) male or female participants (> 10 years of age); and 2) diagnosed with TBI requiring hospitalization. Exclusion criteria were: 1) cardiopulmonary arrest during transport or upon arrival; 2) pregnancy; 3) penetrating TBI; 4) lack of blood tests upon admission; 5) transferred after initial treatment at another institution; 6) chronic subdural hematoma; 7) injury preceded by stroke; 8) refusal to participate in the study; and 9) patients with four or more missing data. Patients who met the exclusion criteria were pre-screened, and a total of 1200 TBI patients were included in the study, with 200 consecutively admitted patients from each of the six hospitals. Setting a target period and including all consecutive cases within that period would have increased the variability in the number of patients at each institution, resulting in potential heterogeneity in the training data and, consequently, significant bias during the development and evaluation of the prediction model. Therefore, we decided to use a balanced dataset in this study by including a fixed number of consecutive TBI cases from each institution, instead of opting for a universal data collection period.
We randomly selected 10% of the 200 patients at each hospital to construct the test dataset (comprising 120 patients in aggregate). The remaining 1080 patients were randomly divided into validation (80 patients) and training (1000 patients) datasets (Fig. 1). The difference between the validation and test datasets was that the latter consisted of equal numbers of TBI patients from all hospitals, whereas the validation dataset was not stratified by hospital. The sample size was determined based on our previous findings. 8 In the case of binary prediction, our previous model showed that approximately 180 patients from a single institution are sufficient to ensure good prediction performance with an appropriate selection of clinical factors. As a result, we assumed that 90% of the obtained data should be used for training, and set the number of patients collected from each institution to be 200. The six emergency hospitals were rigorously selected based on their ability to provide high-quality TBI care during the study period consistently, yielding a total sample size of 1200 patients.
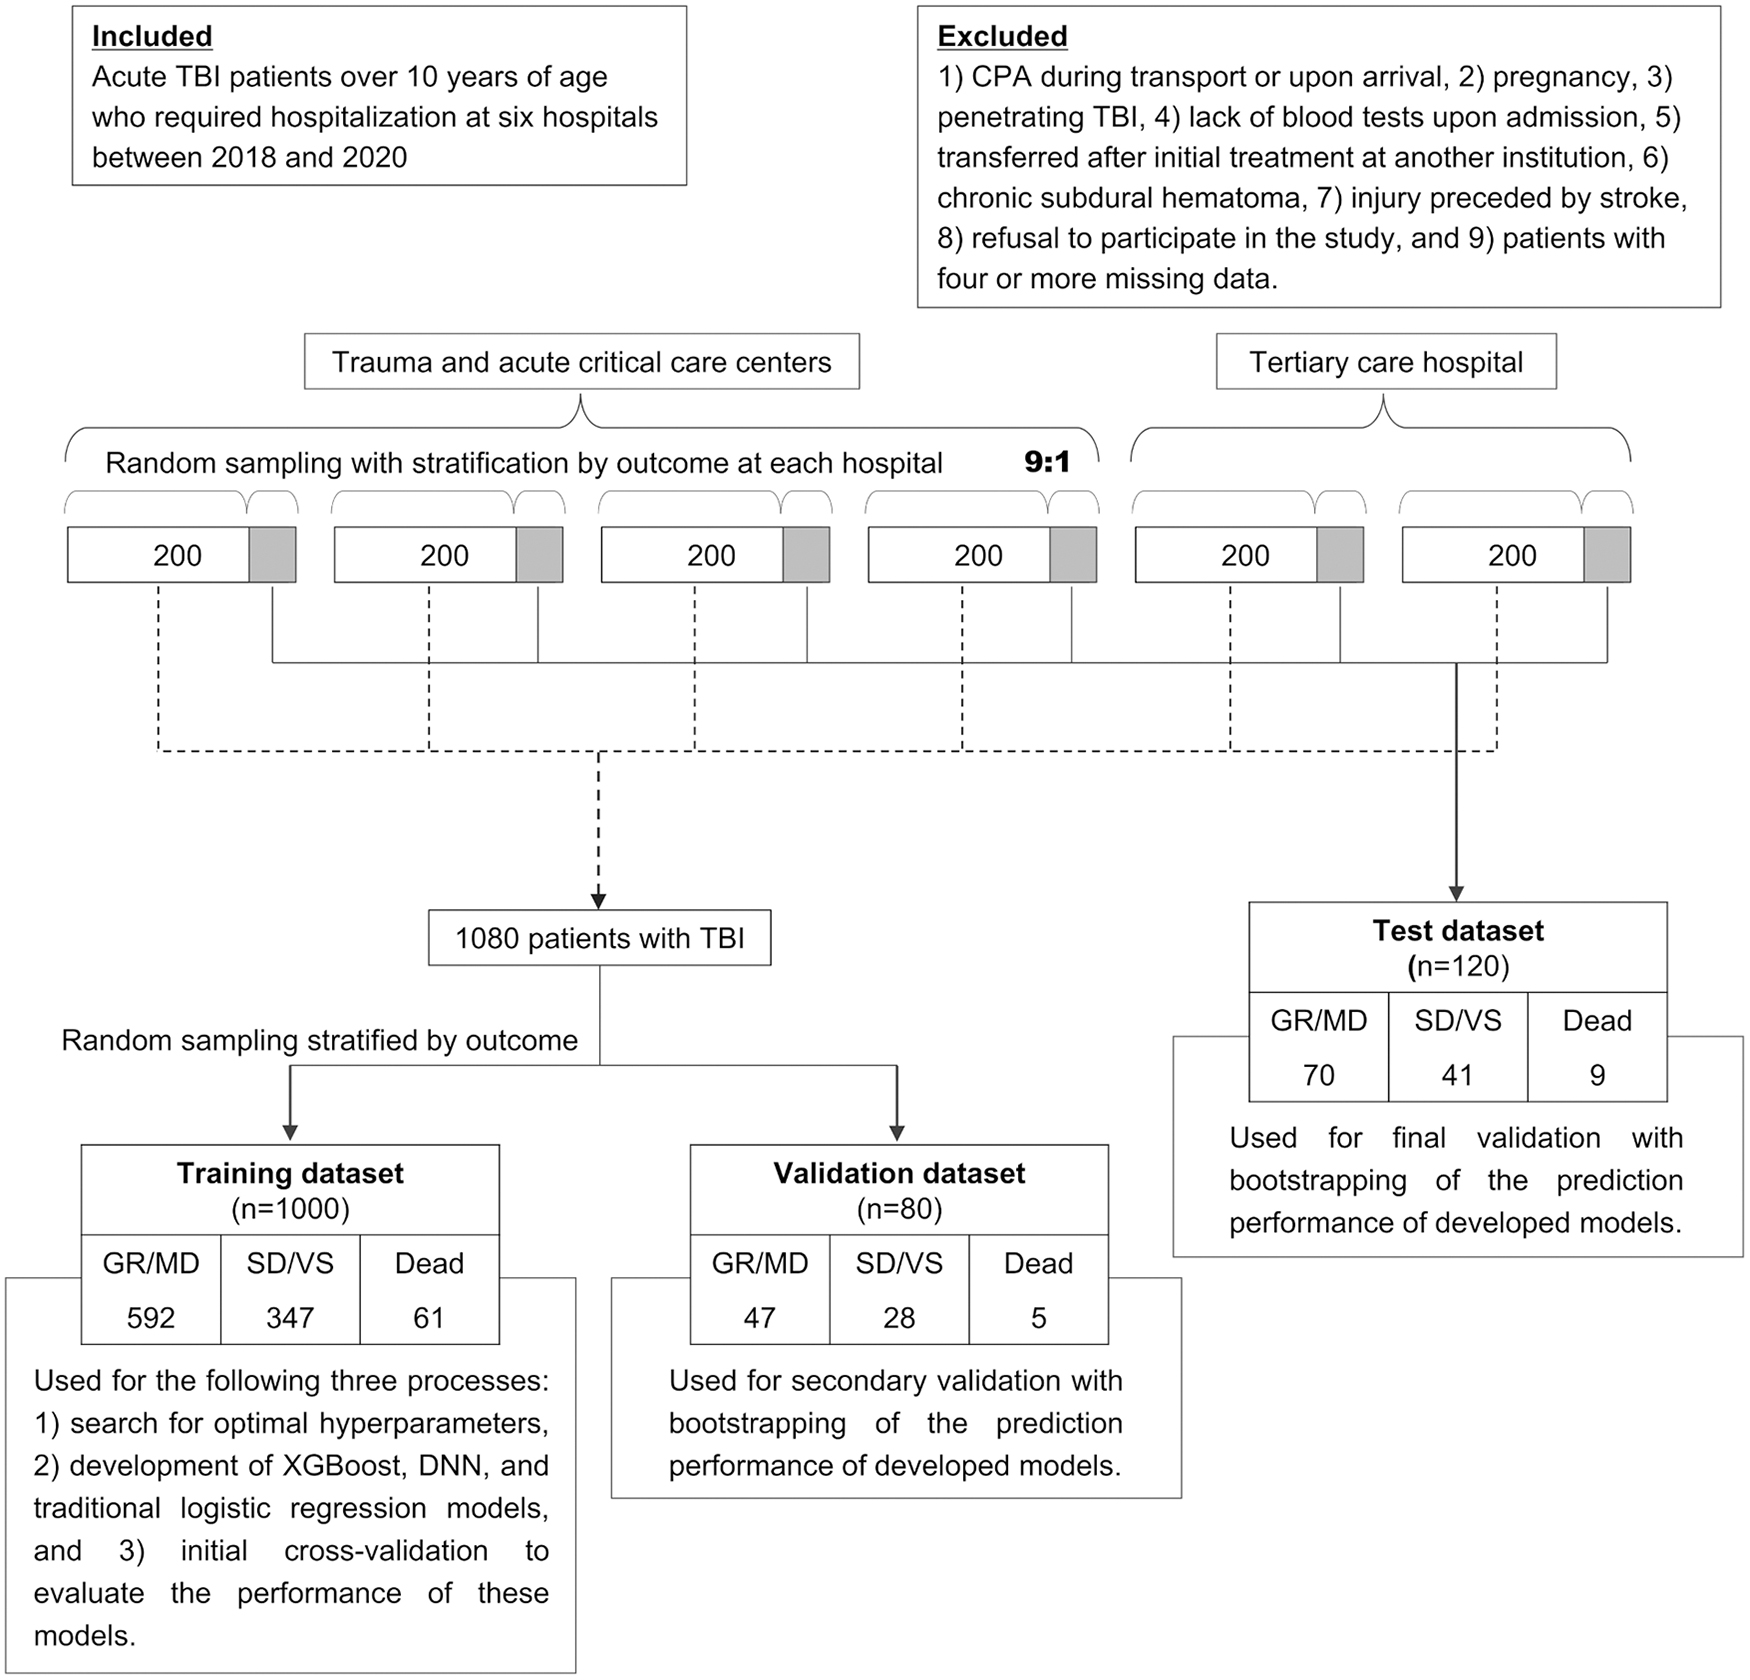
Flow chart of patient inclusion and the process of developing and validating machine learning models. CPA, cardiopulmonary arrest; DNN, dense neural network; GR, good recovery; MD, moderate disability; SD, severe disability; TBI, traumatic brain injury; VS, vegetative state.
Predictive parameters
We developed prediction models incorporating the following 21 predictors—age; sex; six clinical findings, including systolic blood pressure, GCS total score, GCS motor score, the presence of spinal cord injury, the presence of major extracranial injuries and pupillary abnormalities; four laboratory parameters including hemoglobin, glucose, C-reactive protein, and D-dimer levels on blood tests; eight computed tomography (CT) findings including acute subdural hematoma (ASDH), acute epidural hematoma, traumatic subarachnoid hemorrhage (tSAH), cerebral contusion, mass lesion, midline shift, basal cistern compression, and modified Rotterdam CT score (Supplementary Table S1) 19 ; and emergency craniotomy. These clinical parameters were obtained upon initial presentation to the ED. The definition of each clinical factor is presented in the Supplementary Methods.
Outcome classification
Patient outcomes were evaluated based on the Glasgow Outcome Scale (GOS) and GOS-extended (GOSE) at discharge. 20,21 The evaluating neurosurgeon determined and rated the assessment items, such as social activities, ability to work as before, and maximum time for which the patients could take care of themselves at home, based on their in-hospital activities of daily living and need for care. We defined three outcome categories for a predictive target: 1) GOSE 5 (lower moderate disability [MD])–8 (upper good recovery [GR]) as good; 2) GOSE 2 (vegetative state [VS])–4 (upper severe disability [SD]) as poor; and 3) GOSE 1 as death.
Machine learning model development
Missing variables were imputed using the k-nearest neighbor imputation method. 22 In the k-nearest neighbor imputation for missing variables, the admission hospital, the presence of pneumocephalus, and the length of hospitalization were introduced in addition to the 21 learning parameters. All 21 parameters were then standardized. We used XGBoost and a dense neural network (DNN) as machine learning approaches. 23,24 The optimal hyperparameters of the models were determined using automated Bayesian optimization implemented using the Hyperopt library. 25 During hyperparameter optimization, we repeated the search for hyperparameters that maximize accuracy, sensitivity, F1 score, area under the receiver operating characteristic curve (AUROC), and area under the precision-recall curve (AUC-PR). The prediction model was designed to determine the prediction probability for each of the three classifications, with the classification with the highest probability serving as the model's response. Each evaluation index was calculated using a confusion matrix obtained based on the predicted and true classifications, and for indices other than accuracy, the macro-averages of the values of each outcome class were used for evaluation. Thus, the construction of this model did not require a probability threshold to be set. 26 Both the XGBoost and DNN models were trained using an early stopping function, which terminated training when the specified metrics reached the optimal values.
The following 10 hyperparameters of XGBoost were optimized: “max_depth,” “min_child_weight,” “gamma,” “subsample,” “colsample_bytree,” “lambda,” “alpha,” “max_delta_step,” “eval_metric,” and learning rate. The number of decision trees was fixed to 100,000, and the value of “early_stopping_rounds” was fixed to 100. The following 11 hyperparameters of the DNN model were optimized: number of hidden layers, activation method for hidden layers, number of units of hidden layers, dropout rate on input, dropout rate on hidden layers, type of optimizer, learning rate of the optimizer, usage of batch normalization on a hidden layer, batch size, L1 regularization weight, and L2 regularization weight. Regularization is a machine learning technique that adds a regularization term to loss functions to reduce overfitting. L1 regularization adds an L1 penalty equal to the absolute value of the coefficient magnitude. L2 regularization adds an L2 penalty equal to the square of the coefficient magnitude.
The training epoch was fixed to 1000 rounds, the patience for early stopping was fixed to 100, and the loss metric was fixed to mean squared error. We adopted the hyperparameter set that produced the highest and second-highest values for the five predefined statistical indicators during hyperparameter optimization for model training on the training dataset, yielding 10 XGBoost and 10 DNN models in aggregate. Python version 3.9, scikit-learn version 1.1.3, and XGBoost version 1.7.1 were used to develop and validate the machine learning models. The DNN model was implemented using Tensorflow version 2.6.0. A subset of the program code generated for this study is available at GitHub and can be accessed on
Analysis of model performance
First, as initial validation of the developed models, we performed three-repeated 10-fold stratified cross-validation on the training dataset. For secondary validation using the validation dataset, we selected the XGBoost and DNN models with the top three AUC-PR scores as measured during the initial validation. Subsequently, we selected the XGBoost and DNN models with the highest AUC-PR scores on the validation dataset for further evaluation on the test dataset as final validation (i.e., test). We also performed multinomial logistic regression to compare prediction performances on the training, validation, and test datasets. 27 This logistic regression model was designed as a statistical method with no regularization or penalization. 28,29 We performed bootstrap analysis 1000 times on the validation and test datasets to generate a value distribution for each evaluation index.
Sensitivity, positive predictive value (PPV), accuracy, F1 score, AUROC, and AUC-PR were used to evaluate prediction performance. Except for accuracy, the averages of the respective prediction results for the three outcome classes were employed as the evaluation indices (i.e., macro-average). We compared the prediction performances of representative XGBoost, DNN, and logistic regression models using 3-class confusion matrices and 3-class ROC curves. No model updates (e.g., recalibration) were conducted throughout the modeling process in response to the validation results. In addition, we assessed the contribution of each predictor to the predicted outcome using SHapley Additive exPlanations (SHAP) values.
Statistical analysis
Categorical variables were reported as frequencies and percentages, whereas continuous variables were reported as medians and interquartile ranges (IQRs). For comparison between datasets, the chi-squared test and Kruskal-Wallis one-way analysis of variance were used to compare categorical and continuous variables. In comparisons of patient characteristics between the six hospitals, p values were adjusted using Bonferroni correction. On the test dataset, we compared the AUROC corresponding to each outcome class of the best performing XGBoost and logistic regression models using the DeLong test and calculated the p values. 30 Since the DeLong test cannot be applied to the macro-averages of AUROC in multi-class classification, we only presented 95% confidence intervals calculated using the bootstrap method for the macro-averages of multi-class AUROC. All p values were two-tailed, and significance was set to p < 0.05. All statistical analyses were performed with EZR version 1.54 (Saitama Medical Center, Jichi Medical University, Saitama, Japan), which is based on R version 4.0.3. The “pROC” package was used to calculate the p values of the DeLong test. 31
Results
Study participants
Figure 1 shows the study flowchart, including the number of patients corresponding to each outcome. Of the 1200 patients in aggregate, the median age was 71 years (IQR 51-81), 756 (63.0%) were male, 199 (16.6%) had severe TBI with GCS 3-8, 212 (17.7%) had severe extracranial injuries, and 43 (3.6%) experienced hypotension in the ED. The most common CT findings were tSAH (56.8%) and ASDH (47.4%). Emergency craniotomy was performed on 104 patients (8.7%). The median length of stay was 13.0 (IQR 4.0–28.0) days, and GOS ratings at discharge were as follows: GR in 514 (42.8%) patients, MD in 195 (16.3%), SD in 369 (30.8%), VS in 47 (3.9%), and death in 75 (6.2%). Missing data were common for D-dimer (n = 236) and glucose (n = 26; Supplementary Table S2). Even after imputing missing values, patient characteristics were similar (Supplementary Table S3). Baseline characteristics were similar between training, validation, and test datasets; however, a trend toward more tSAH was observed in the test dataset and one towards more pupillary abnormalities was observed in the validation dataset (Table 1). The distributions of GOSE and the 3-class outcomes showed similar trends on each dataset (Fig. 2A, 2B). Patient characteristics differed significantly among the six hospitals (Supplementary Table S4).
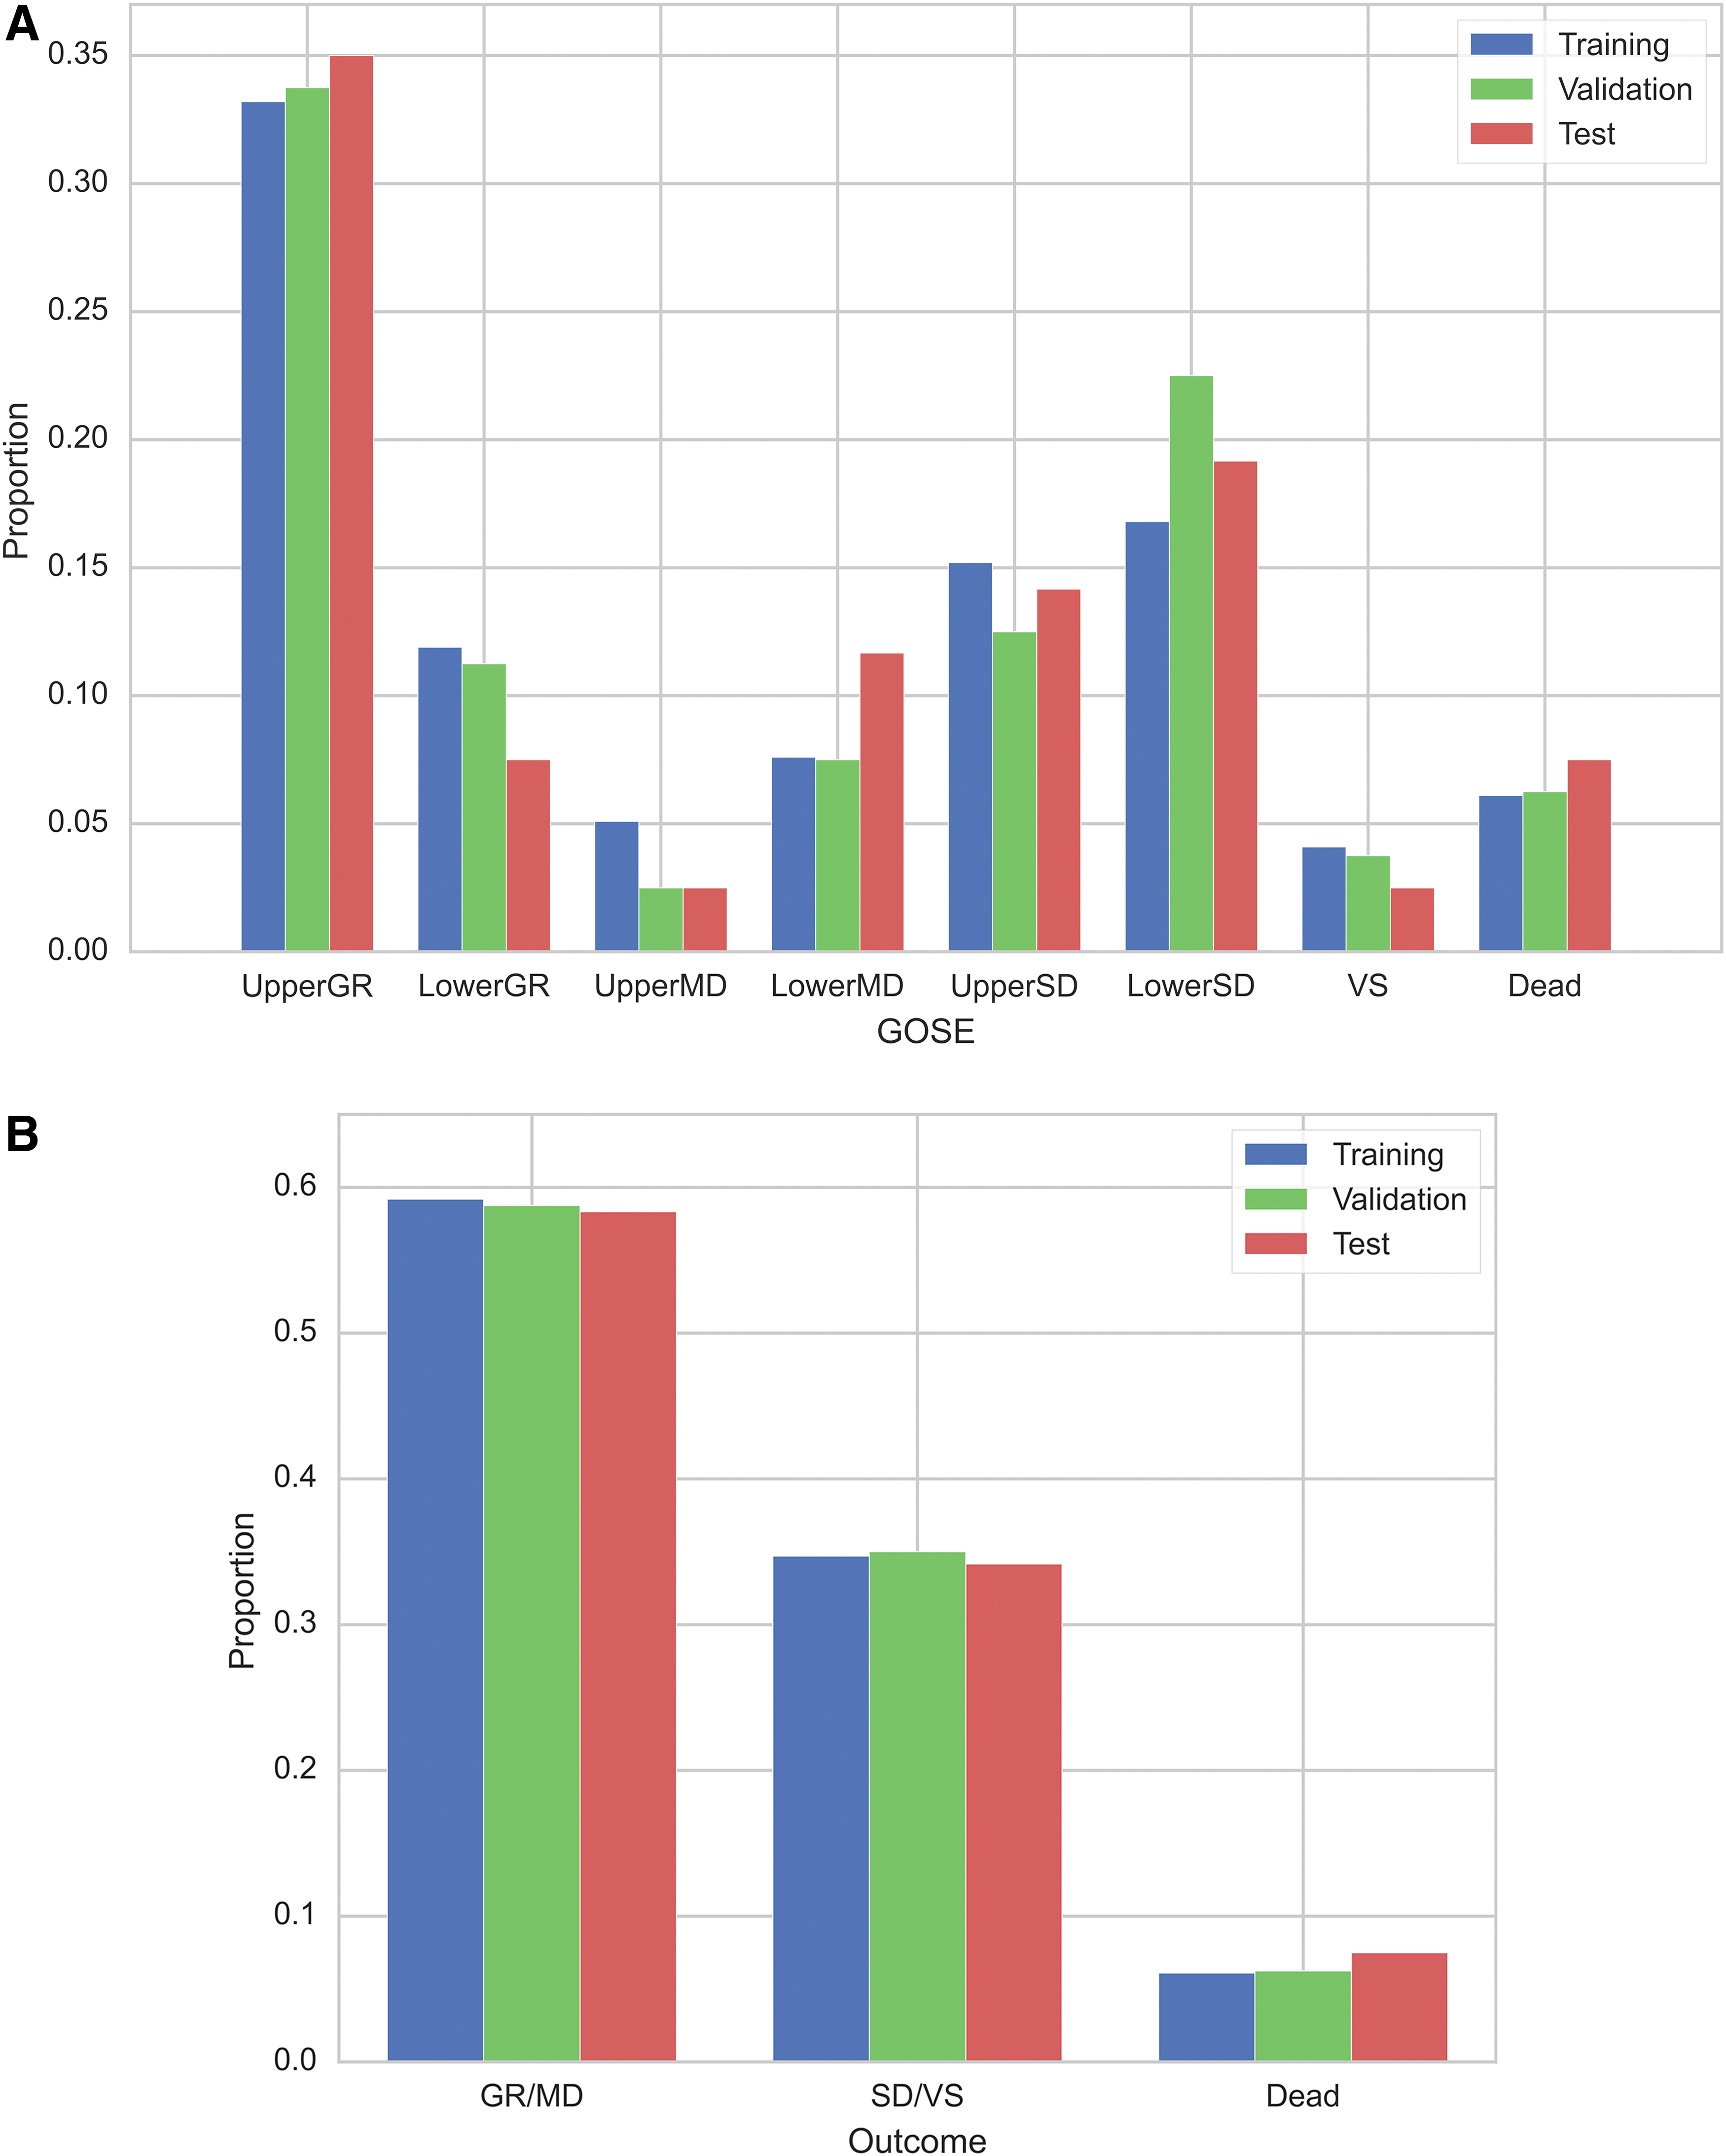
Distribution of the Glasgow outcome scale extended on each dataset
Baseline Characteristics of Patients With TBI in the Training, Validation, and Test Datasets
The p values are calculated using chi-squared test or Kruskal–Wallis one-way analysis of variance. Outcomes are assessed at discharge according to the Glasgow outcome scale.
AEDH, acute epidural hematoma; ASDH, acute subdural hematoma; CRP, C-reactive protein; CT, computed tomography; GCS, Glasgow coma scale; GR, good recovery; IQR, interquartile range; MD, moderate disability; SBP, systolic blood pressure; SD; severe disability; TBI, traumatic brain injury; TSAH, traumatic subarachnoid hemorrhage; VS, vegetative state.
Initial validation of the prediction models on the training dataset
On the training dataset, cross-validation results showed that the logistic regression model had the highest PPV and F1 score, while the XGBoost had the highest sensitivity, accuracy, AUROC, and AUC-PR. The complete results of the 10 XGBoost, 10 DNN, and logistic regression models are shown in Supplementary Table S5.
Further validation of the prediction models on the validation and test datasets
On the validation dataset, the secondary validation results showed that the DNN with AUROC-maximizing hyperparameters had the highest sensitivity, PPV, accuracy, and F1 score of 83.7%, 85.0%, 79.9%, and 84.0%, respectively (Supplementary Table S6). The AUROC and AUC-PR of the logistic regression model were the highest, at 0.908 and 0.882, respectively. XGBoost with accuracy-maximizing hyperparameters and DNN with AUROC-maximizing hyperparameters had the highest AUC-PR among the XGBoost and DNN models—these were employed for further validation.
The test results showed that XGBoost with accuracy maximizing hyperparameters had the highest scores in terms of all metrics, with sensitivity of 69.5%, PPV of 87.6%, accuracy of 82.5%, F1 score of 74.1%, AUROC of 0.901, and AUC-PR of 0.803 (Table 2). The hyperparameters corresponding to the best models are provided in Supplementary Table S7.
Prediction Results for the Test Dataset With Bootstrapping of 1000 Repetitions
The figures in bold indicate the highest value for each performance metric.
Models are sorted by AUC-PR. Maximized metric in hyperparameter tuning is indicated in parentheses after the model's name (e.g., DNN [AUROC]). Metrics are calculated using macro averages of results for each of the three outcome classes and are reported as means and 95% confidence intervals from bootstrapping.
AUC-PR, area under the precision-recall curve; AUROC, area under the receiver operating characteristic curve; DNN, dense neural network; PPV, positive predictive value.
Based on 3-class ROC curve analysis, XGBoost was observed to slightly outperform DNN and logistic regression models, except for SD/VS prediction on the validation dataset (Fig. 3 and Supplementary Fig. S1). Comparison of the AUROC of the best XGBoost and logistic regression models on the test dataset revealed that the XGBoost model significantly outperformed the logistic regression model in predicting SD/VS (Supplementary Table S8). The 3-class confusion matrix analysis demonstrated that, while all models tended to predict GR/MD accurately, they tended to miss the prediction of death, particularly on the test dataset (Fig. 4). These analyses indicated that each prediction model behaved differently depending on the scenario, and the prediction targets on which it excelled did not appear to be consistent. For instance, on the validation dataset, XGBoost outperformed the other models in terms of PPV in predicting GR/MD and death, but it was less sensitive in predicting death.
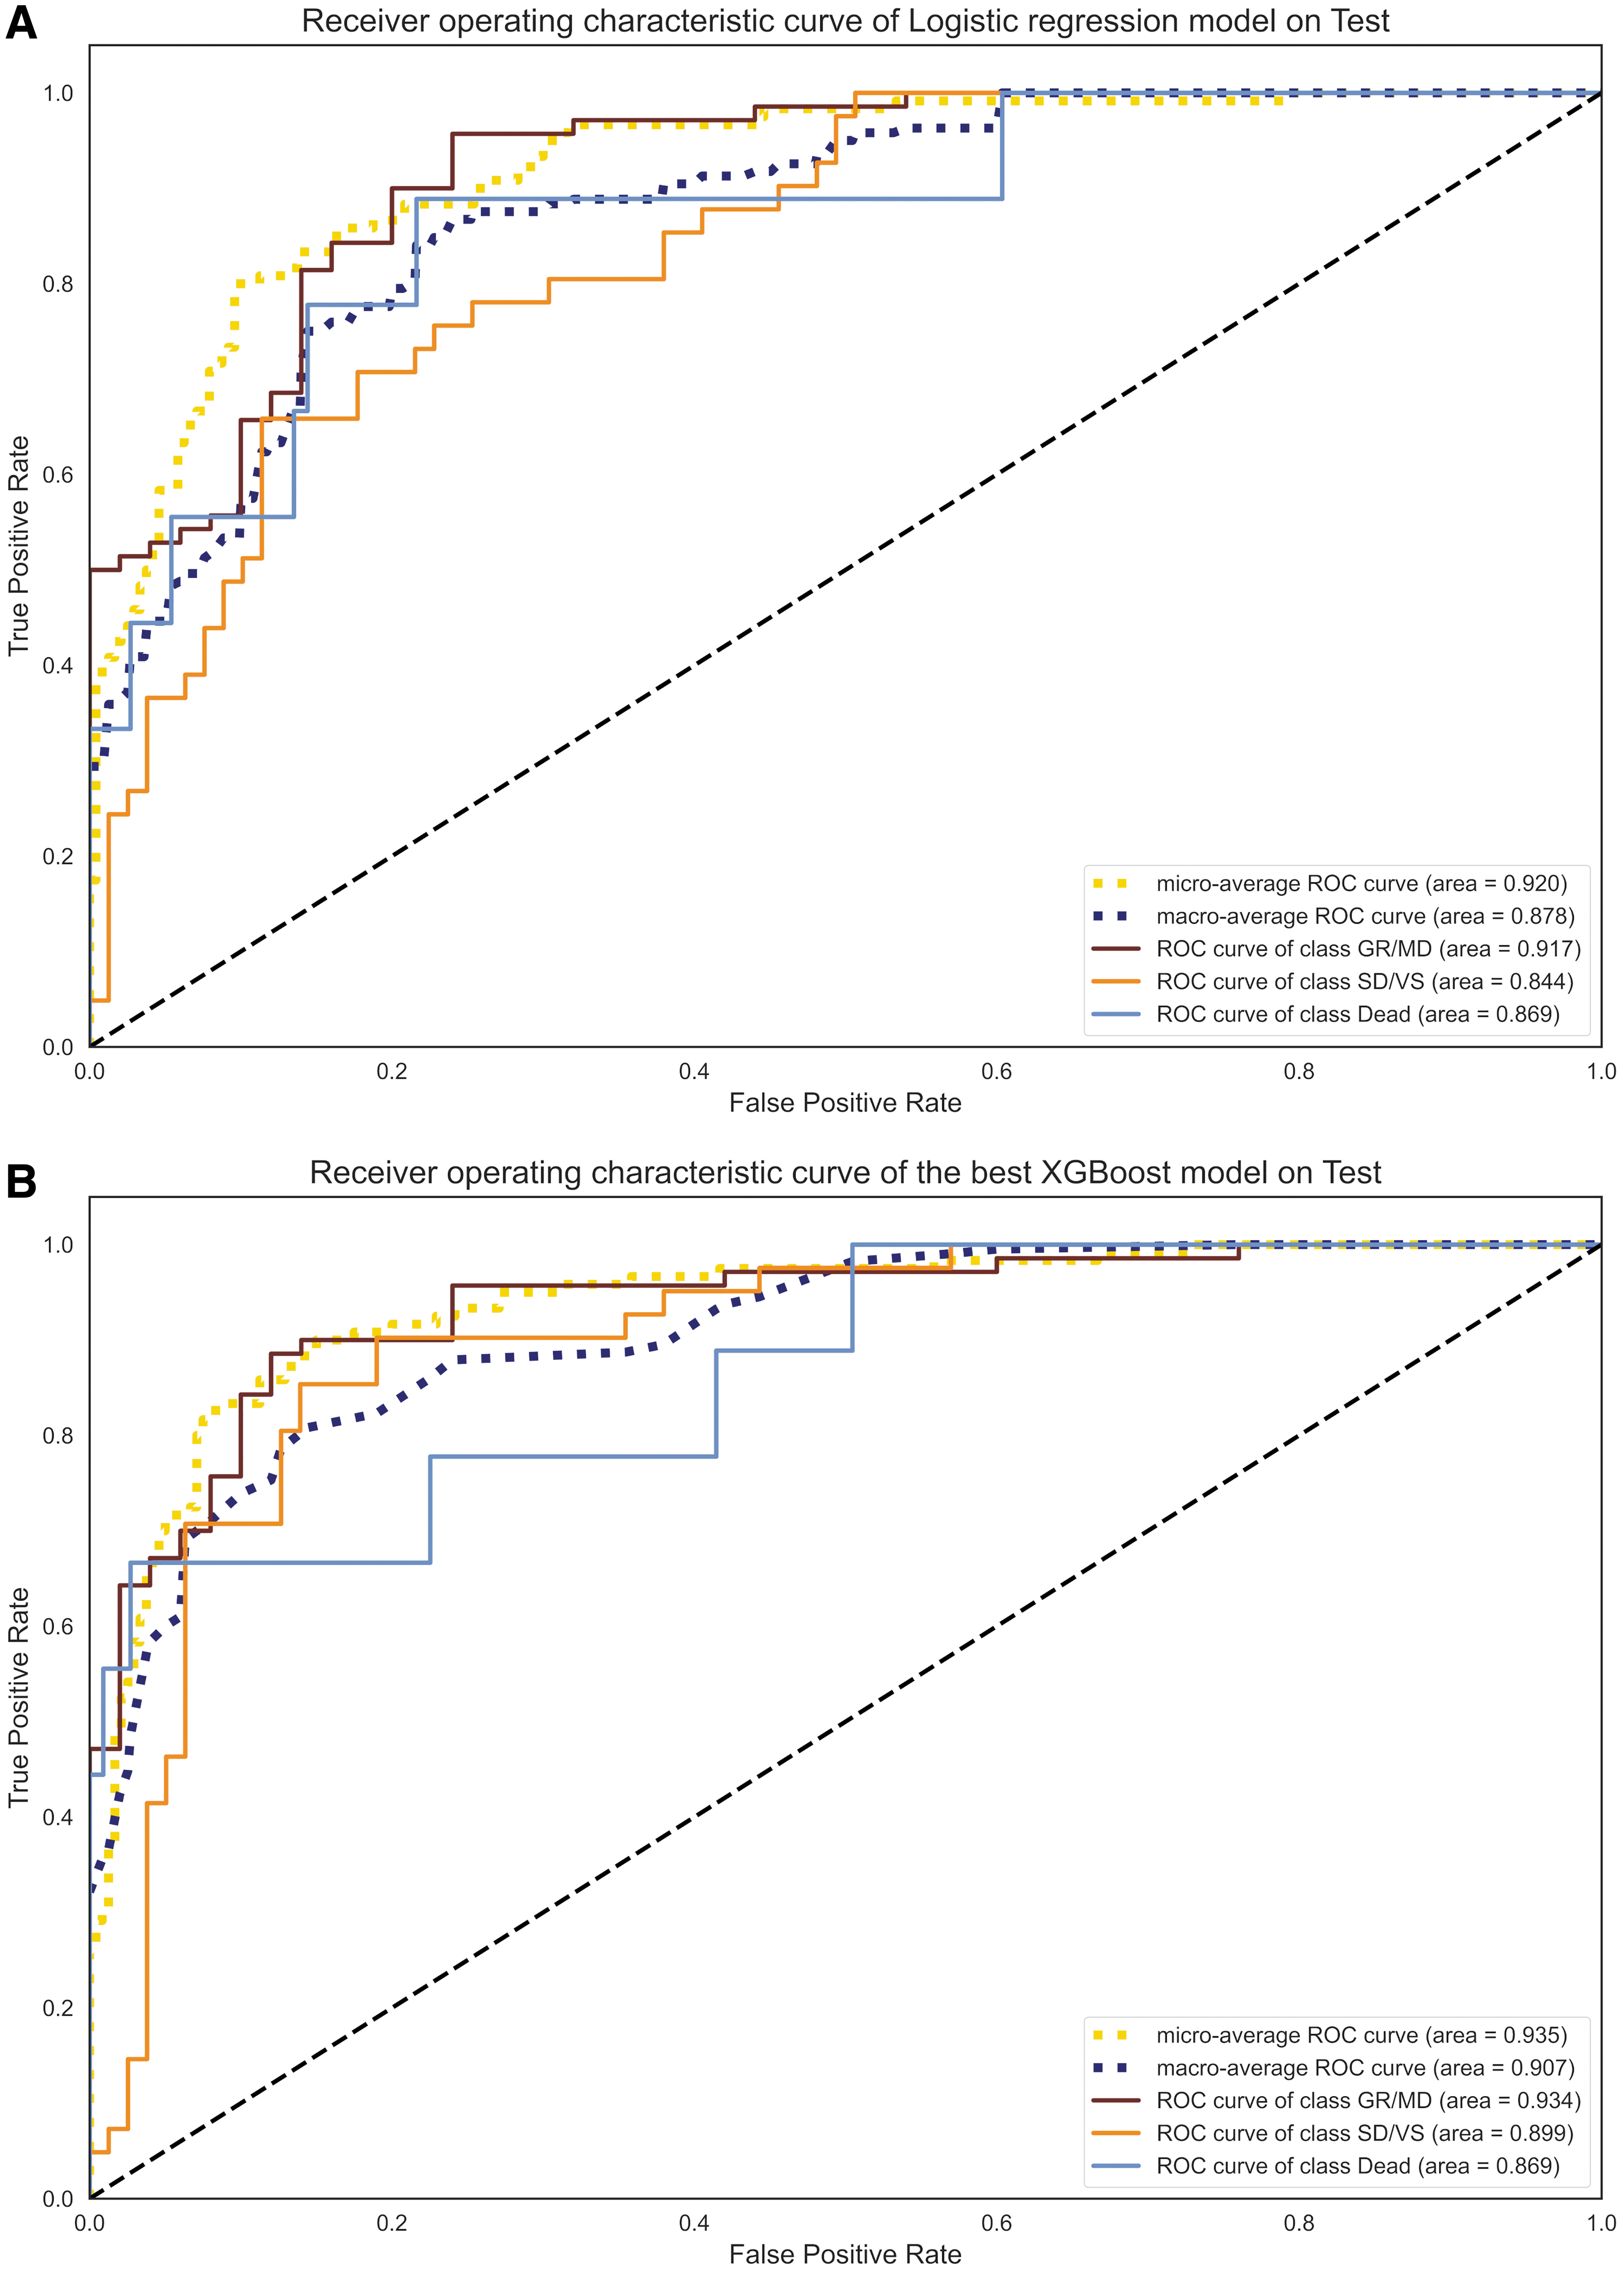
Three-class receiver operating characteristic curve for the logistic regression model
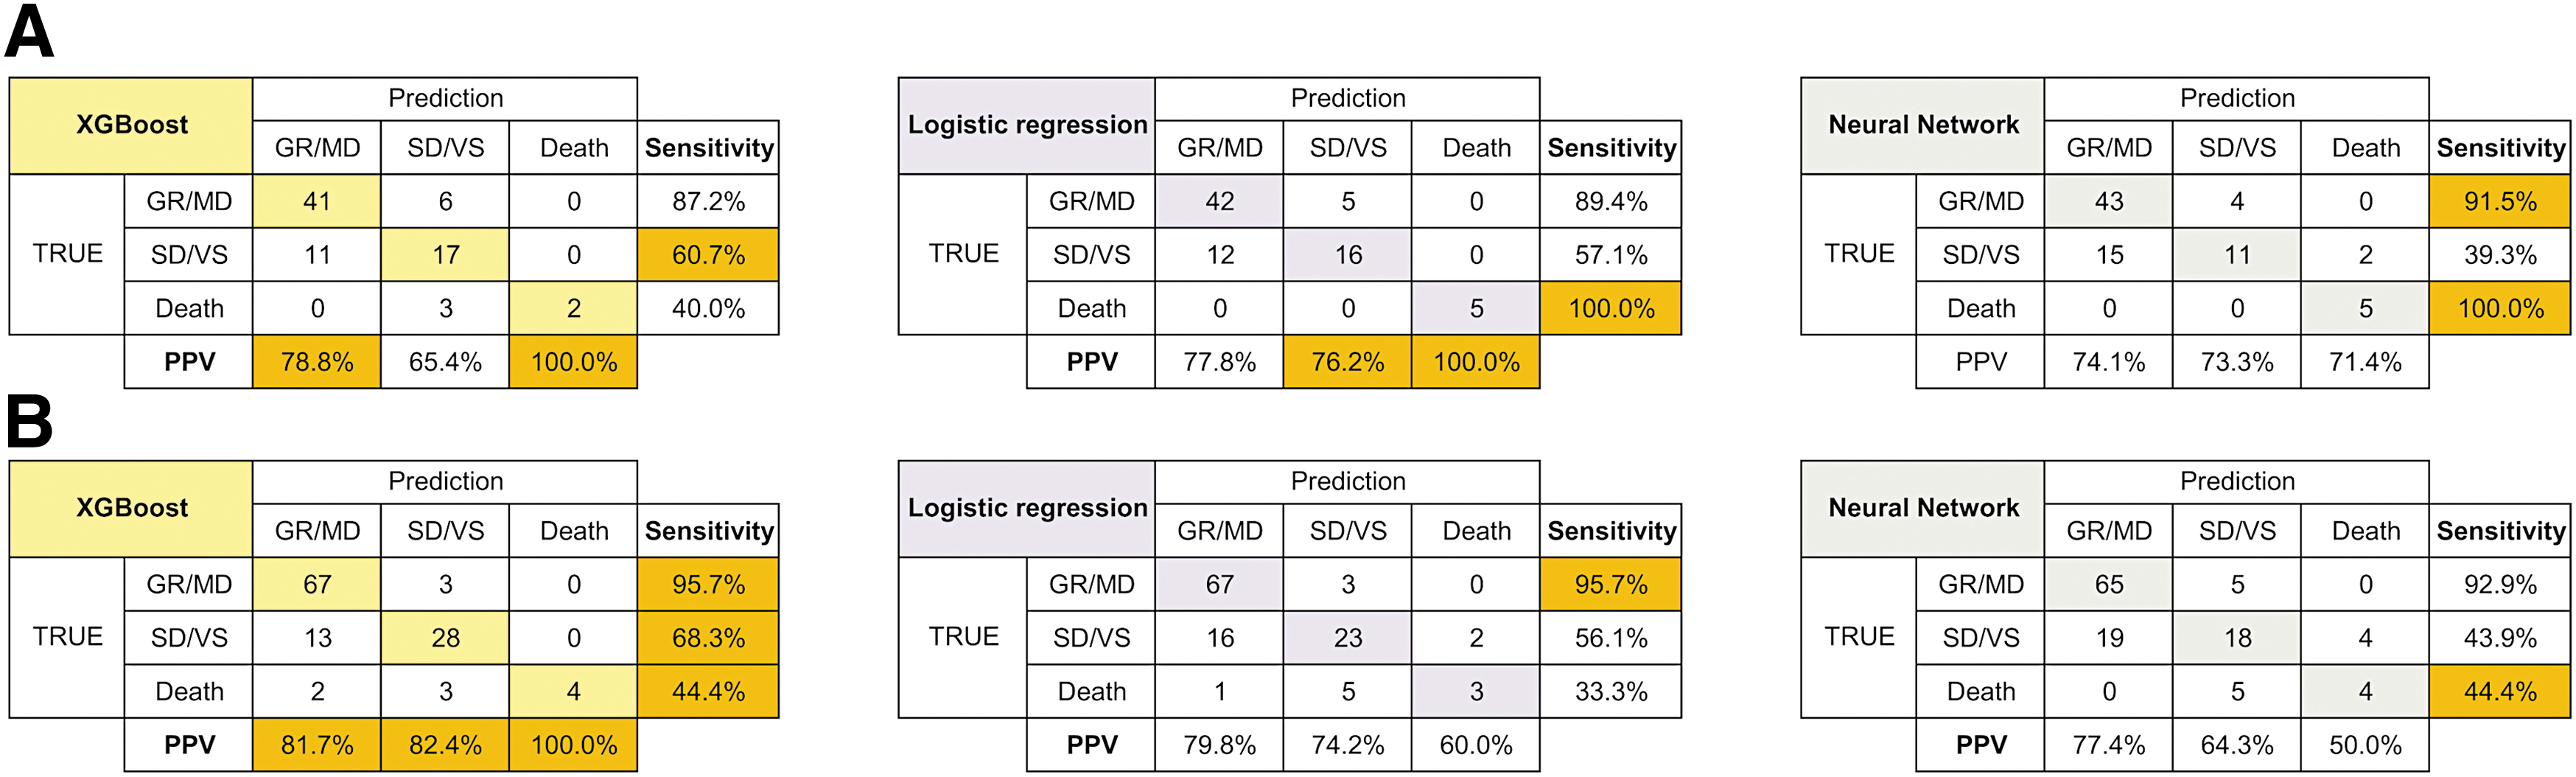
Three-class confusion matrix for the XGBoost, dense neural network, and logistic regression models in validation
Importance of the clinical predictors
According to the SHAP values of clinical parameters based on the best XGBoost model on the test dataset, GCS total score, age, and D-dimer contributed the most to the prediction results (Fig. 5). Regarding imaging findings, ASDH exerted the greatest impact on outcome prediction.
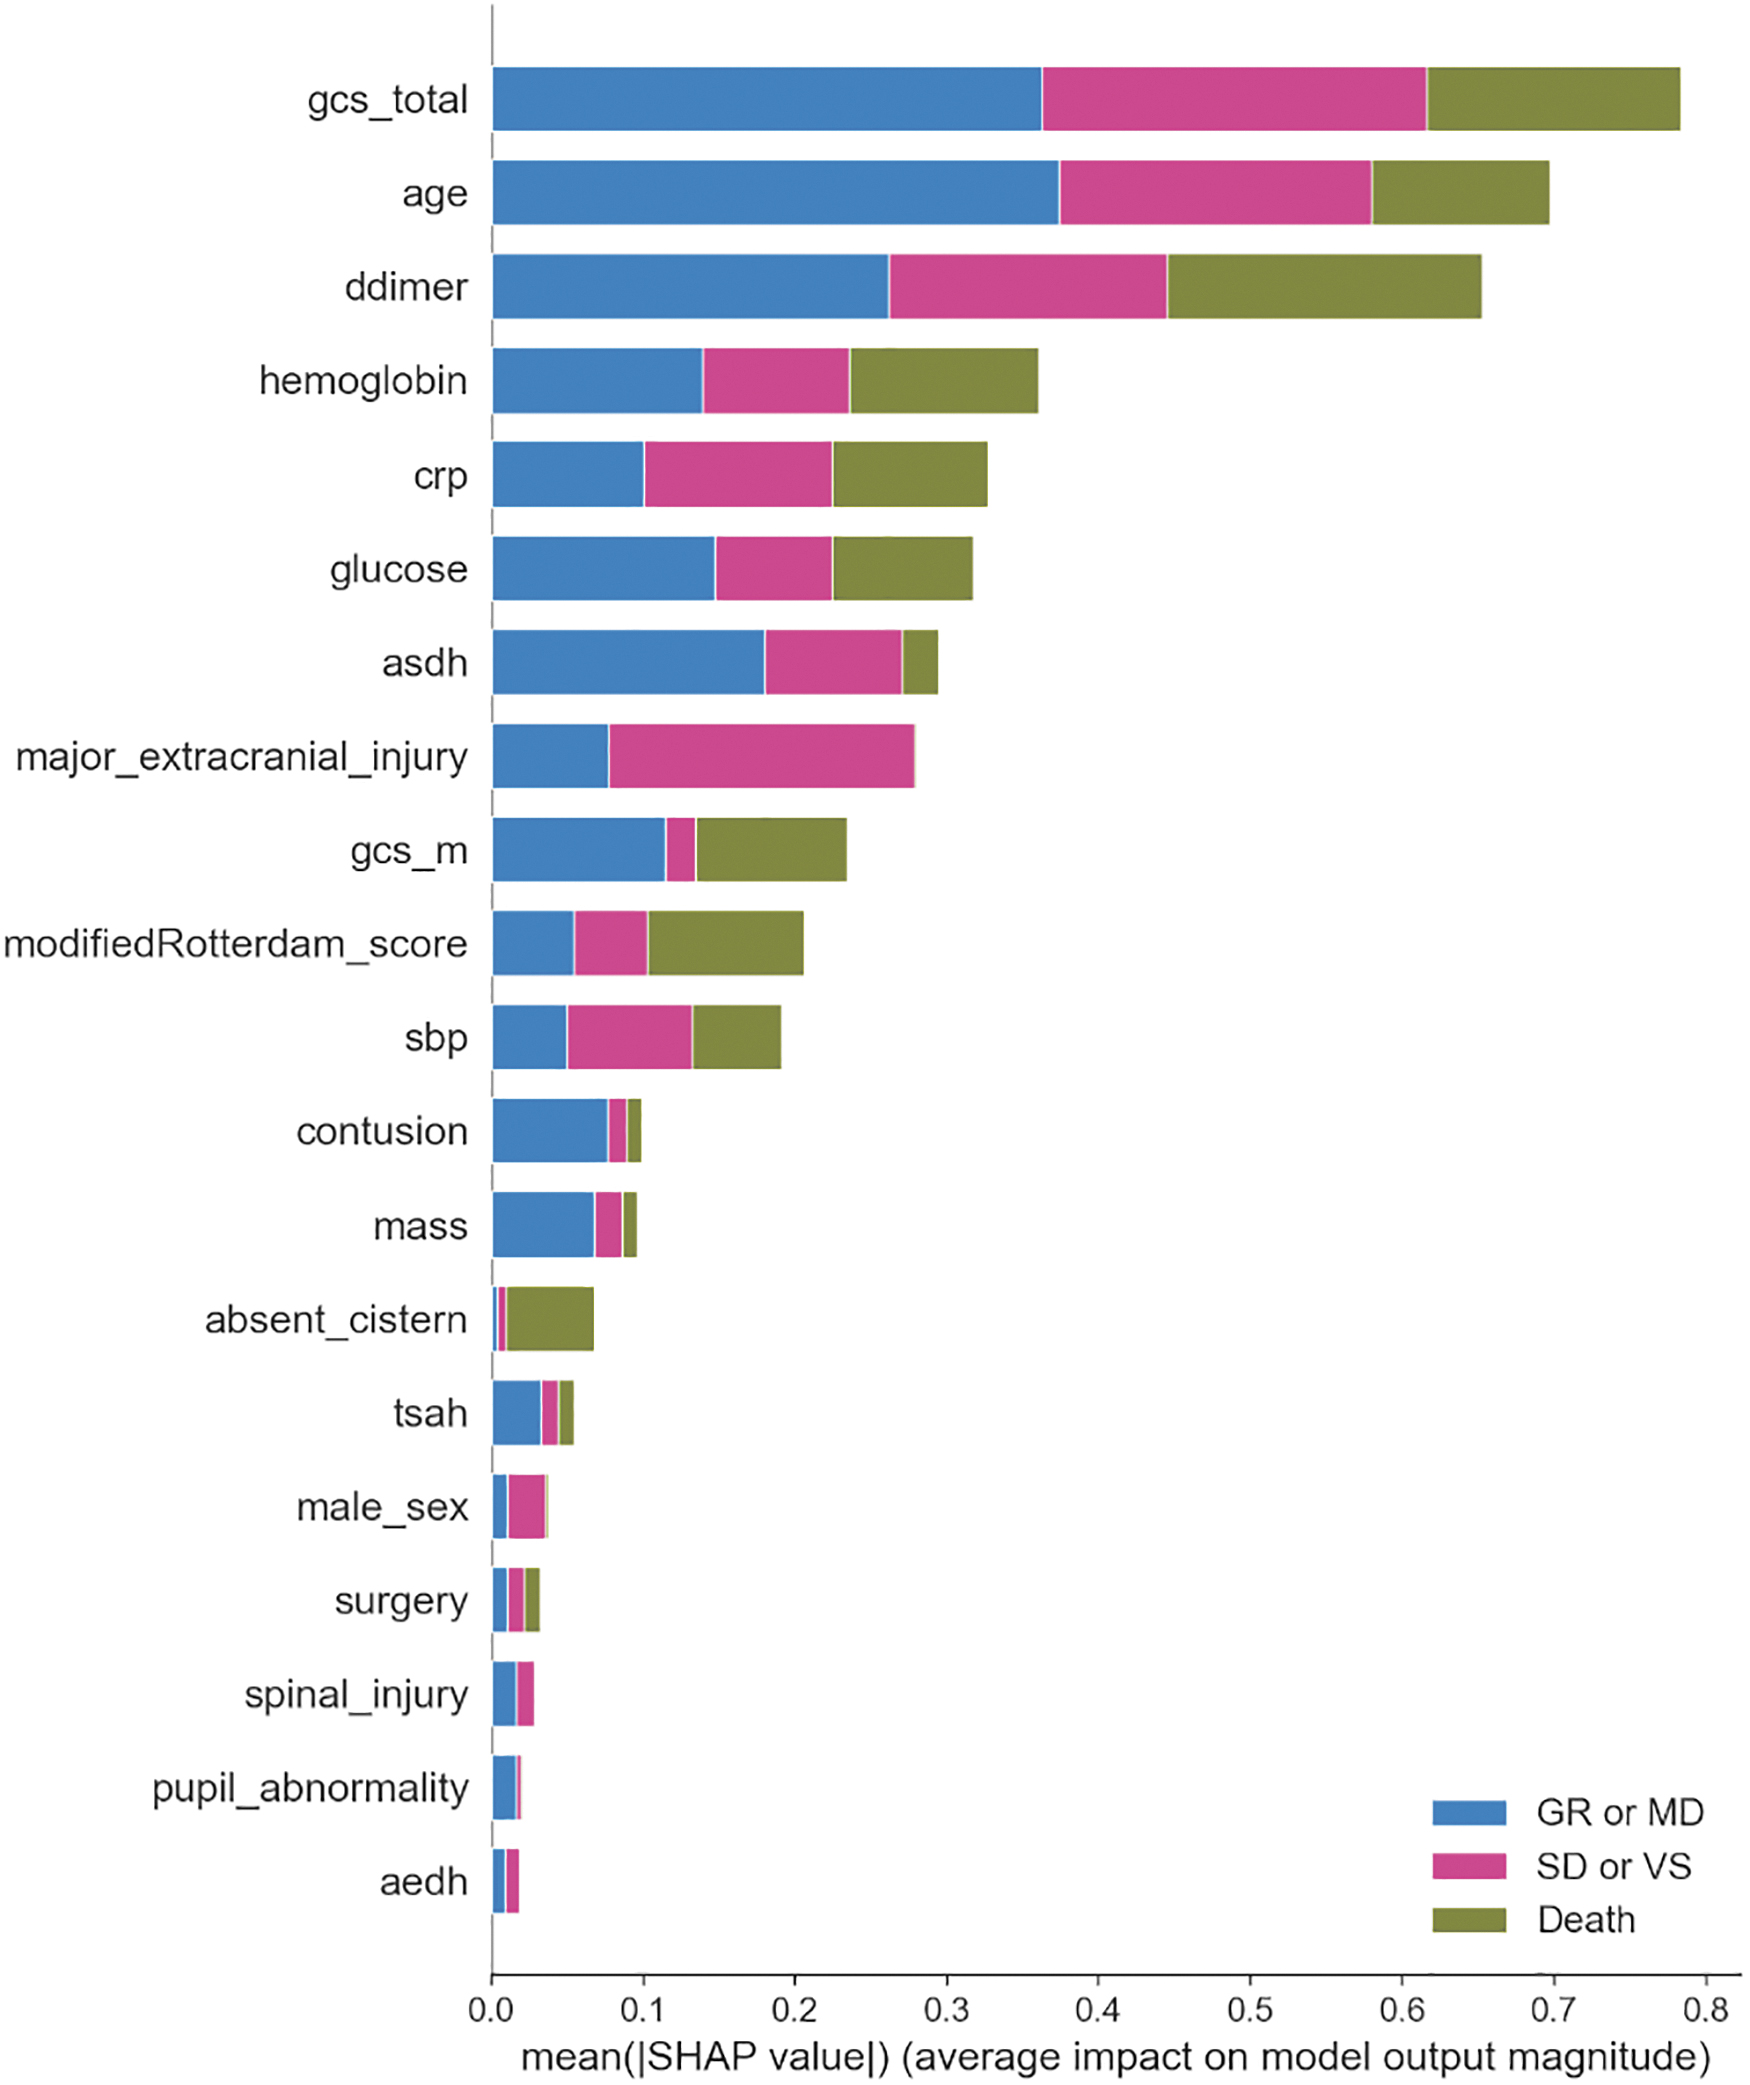
SHapley Additive exPlanations (SHAP) values on the test dataset calculated using the best XGBoost model. asdh, acute subdural hematoma; crp, C-related protein; gcs, Glasgow coma scale; sbp, systolic blood pressure; tsah, traumatic subarachnoid hemorrhage; aedh, acute epidural hematoma.
Discussion
This study revealed several new implications related to the application of machine learning in TBI research. First, we developed a more specialized machine learning model to predict in-hospital outcomes following TBI using three GOS-based classifications, and concluded that the XGBoost model exhibited a high AUROC of approximately 0.90. However, there is still scope for improvement, particularly concerning the sensitivity of death prediction, and developing a robust model with consistent performance in diverse scenarios remains challenging. Additionally, even on the training dataset, which was learned by the model, the best performing XGBoost model's prediction accuracy of 77.6% appeared to be insufficient, suggesting that the models may not yet be fully applicable to real-world settings. Next, although traditional logistic regression performed well on the validation dataset, the machine learning-based model outperformed it in the other two validation tests. Therefore, the machine learning-based models may have better generalization performance than logistic regression.
Our model achieved an AUROC of 0.90, which is a good level of discrimination. However, its prediction performance cannot be compared to that of any current model. The proposed model tended to miss death predictions, especially on the test dataset, resulting in a relatively low sensitivity of 69.5%. This seems attributable to the difficulty of predicting death caused by the worsening of underlying diseases, such as heart failure or cancer, based solely on ED information. Post-admission information can be a useful predictor; however, predicting outcomes only based on ED data would be more helpful to subsequent treatment decisions. To date, only a single study has predicted three categories of outcomes after TBI. 32 This study differs from the present study in that the outcome categories were defined somewhat loosely in terms of the types of discharge disposition, rather than in terms of GOSE. Meanwhile, several studies have developed machine learning-based models to predict binary outcomes following TBI, such as in-hospital mortality, 8,10,11,13,33 –36 poor outcomes at discharge, 8,14,37 and favorable outcomes after six months. 38
These models suffer from certain limitations, such as including patients with chronic subdural hematoma, 34 excluding patients with mild TBI, 13,33,35,38 requiring information on post-admission interventions 10 or many underlying conditions as learning parameters, 11,32,33 and insufficient validation. 8,10,14,33 An alternative approach to address the multi-class classification problem is to combine these binary classifiers separately. However, if, for example, a binary prediction model for death is combined with one for an unfavorable outcome, some patients will be assigned contradictory outcomes—they may be predicted to die by one model but predicted to have a favorable outcome by the other. This issue may be resolved in the future if the prediction performance of the models improves drastically.
However, another problem is that most recent studies that make binary predictions define an unfavorable outcome as GOS SD or VS or death. Thus, in the case of a combined binary prediction model, if one constituent model predicts survival and the other predicts an unfavorable outcome, a discrepancy is introduced into the response regarding death because unfavorable outcomes include death. The ability to predict outcomes using more detailed categories may enable more effective personalized treatment. However, in our preliminary experiments, it was difficult to predict more subdivided outcomes accurately based solely on current clinical parameters (data not shown). As evidenced by the adoption of binary prediction, which is a simpler classification model than that proposed in the present study, in most previous studies, it is difficult to predict outcomes with greater subdivisions with high accuracy. To tackle this issue, the introduction of novel biomarkers or more advanced image analysis appear to be required.
Next, although logistic regression performed well on the validation dataset, the machine learning model outperformed it in the other two validation tests. This contradicts several studies that have indicated that machine learning models provide no benefit over regression models. 12,39,40 However, the machine learning models considered in these studies seem to have been inadequately tuned, 40 and the prediction targets of 6-month unfavorable outcomes (GOS <3) appear to be too facile to highlight the advantages of machine learning 12 —these would only be perceptible in more challenging classification problems or problems involving significantly more predictors. Nevertheless, we did not observe a large performance difference between the logistic regression and machine learning models; thus, this topic merits further investigation. Based on previous studies, the utilization of more outcome-relevant predictors should improve prediction performance more effectively than increasing the number of training samples. 8,10,11,13,33,35,36
Important predictors identified by machine learning model
The two highest-ranked features determined by the best XGBoost model were GCS total score and age, both of which are well-established predictors of outcome. Thus, it is reasonable that they contributed significantly. D-dimer was the third most influential clinical factor in predicting outcomes—in particular, it was more influential than GCS score or age in predicting death. Coagulopathy after TBI has been reported to occur in nearly two-thirds of patients with severe TBI 41 and is significantly associated with progressive hemorrhagic injury and increased mortality and disability rates at discharge. 41,42 Therefore, in this study, D-dimer most likely represented the degree of coagulation abnormalities associated with the severity of trauma. Since coagulopathy after TBI is complicated by multiple mediating mechanisms, it is not yet clear which parameter is the most informative. 41,42 However, considering only prothrombin time (PT) and activated partial thromboplastin time (aPTT) may not be adequate to assess the degree of coagulopathy, 43 and D-dimer and fibrin/fibrinogen degradation products (FDP) are associated with a higher mortality risk than aPTT or platelet count. 44 Additionally, FDP and D-dimer may be less susceptible to modification by oral anticoagulants than PT and aPTT. However, this study did not examine the influence of oral anticoagulants—this topic requires further research.
Second, pupillary abnormalities, which have been suggested to be associated with outcome in previous studies, exhibited a smaller association with outcome in this study. This may be attributed to the following factors. First, pupillary abnormalities were present in only 9.1% of all patients. In addition to this, the present study may have included pupillary abnormalities that differ in pathophysiology from pupillary abnormalities induced as symptoms of brain herniation (e.g., pupillary abnormalities due to traumatic optic neuropathy, original pupillary abnormalities due to previous ocular surgery, or Horner's syndrome due to neck trauma). Thus, this observation may not necessarily reflect brain herniation and may have become relatively less important because other features, such as the absent cistern or the Rotterdam CT score, which reflect brain herniation similarly, are used as features.
Potential clinical applications of the proposed model
Based on data in the ED and the surgeon's judgment of the necessity of an emergency craniotomy, our model can calculate the probability of three classes of outcomes with and without craniotomy, which may help determine the treatment strategy. In the future, we might be able to apply this prognostic model as a severity index to identify subgroups of patients who would be most likely to benefit from specific interventions. In recent major commissions, such neuroinformatics-based clinical decision support in the field of TBI has been highly recommended for implementation. 45
Limitations
The first major limitation of this study is that the outcome was assessed in terms of GOSE at discharge. Patients with severe disabilities at discharge may recover after six months. 46,47 However, retrospective assessment of outcomes at a pre-determined time, such as 14 days or 6 months post-injury, excludes mild TBI patients who are discharged early and not followed comprehensively in an outpatient setting, rendering data from these mild TBI patients unavailable for model training. In this study, we aimed to develop a highly generalizable prediction model by minimizing restrictions on target patients to reduce learning bias as much as possible. Consequently, it was imperative to include data from mild TBI patients in the dataset, and outcomes at discharge were used for outcome assessment. In addition, there may be inter-rater variation in the assessment of GOSE. 48 Further study is needed to determine the optimal timing for prognostication. Second, this study included patients who died of non-traumatic causes. It might be reasonable to exclude patients who died of underlying diseases from the training data.
Finally, all training data included in this study were obtained from Japanese hospitals that provide standard treatment for TBI. Japan has one of the highest aging populations in the world, with more than a quarter of the population being above 65 years in age. 49 Additionally, the median age of the patients in this study was 71 years, which could be attributed to the participation of several rural hospitals with higher-than-average elderly populations. 50 Thus, prediction accuracy might be affected corresponding to patient data obtained from low-resource hospitals or non-Japanese populations. 51 Prospective studies with larger datasets including more young patients are required to confirm the usefulness of our prediction model and to develop a more robust alternative.
Conclusions
In this study, we developed the first machine learning-based model to predict in-hospital outcomes after TBI using three GOS-based classifications. The XGBoost model exhibited a high AUROC of approximately 0.90. This model can potentially be more impactful in the development of appropriate patient stratification methods in future TBI studies than conventional binary prognostic models. Further, outcomes were predicted based solely on clinical data from the ED. However, there is still scope for improvement, particularly concerning the sensitivity of death prediction. Developing a robust model with consistent performance in diverse scenarios remains challenging, suggesting that the proposed models may not yet be fully applicable to real-world settings. Additional innovations are required to improve generalization performance.
Footnotes
Acknowledgments
We would like to thank Yusuke Okamura, Ayaka Shibano, Subaru Umeda, Shunsuke Yamanishi, Junichi Sakata, Daisuke Yamamoto, and Satoshi Nakamizo for their assistance in data collection and Editage (
Authors' Contributions
KM: Conceptualization (lead); methodology; software; formal analysis; writing—original draft. HA: Conceptualization (supporting); resources; writing—review and editing (equal); supervision. YH: Resources; writing—review and editing (equal). AM: Investigation; writing—review and editing (equal). YS: Investigation; writing—review and editing (equal). SM: Investigation; writing—review and editing (equal). ST: Investigation; writing—review and editing (equal). SI: Resources; writing—review and editing (equal). YT: Resources; writing—review and editing (equal). HY: Resources; writing—review and editing (equal). TS: Writing—review and editing (equal); project administration.
Funding Information
This research was supported by research funds from JSPS Grant-in-Aid for Early-Career Scientists Grant Number 21K18079 (to K.M.); by the General Insurance Association of Japan (to K.M.); and by the ZENKYOREN (National Mutual Insurance Federation of Agricultural Cooperatives) (to K.M.). No funding body had any role in study design, data collection and analysis, decision to publish, or preparation of the manuscript.
Author Disclosure Statement
No competing financial interest exist.
Supplementary Material
Supplementary Method
Supplementary Table S1
Supplementary Table S2
Supplementary Table S3
Supplementary Table S4
Supplementary Table S5
Supplementary Table S6
Supplementary Table S7
Supplementary Table S8
Supplementary Figure S1
References
Supplementary Material
Please find the following supplemental material available below.
For Open Access articles published under a Creative Commons License, all supplemental material carries the same license as the article it is associated with.
For non-Open Access articles published, all supplemental material carries a non-exclusive license, and permission requests for re-use of supplemental material or any part of supplemental material shall be sent directly to the copyright owner as specified in the copyright notice associated with the article.