
Abstract
This study aims to determine tissue-specific neurodegeneration across the spinal cord in patients with mild-moderate degenerative cervical myelopathy (DCM). Twenty-four mild-moderate DCM and 24 healthy subjects were recruited. In patients, a T2-weighted scan was acquired at the compression site, whereas in all participants a T2*-weighted and diffusion-weighted scan was acquired at the cervical level (C2–C3) and in the lumbar enlargement (i.e., rostral and caudal to the site of compression). We quantified intramedullary signal changes, maximal canal and cord compression, white (WM) and gray matter (GM) atrophy, and microstructural indices from diffusion-weighted scans. All patients underwent clinical (modified Japanese Orthopaedic Association; mJOA) and electrophysiological assessments. Regression analysis assessed associations between magnetic resonance imaging (MRI) readouts and electrophysiological and clinical outcomes. Twenty patients were classified with mild and 4 with moderate DCM using the mJOA scale. The most frequent site of compression was at the C5–C6 level, with maximum cord compression of 38.73% ± 11.57%. Ten patients showed imaging evidence of cervical myelopathy. In the cervical cord, WM and GM atrophy and WM microstructural changes were evident, whereas in the lumbar cord only WM showed atrophy and microstructural changes. Remote cervical cord WM microstructural changes were pronounced in patients with radiological myelopathy and associated with impaired electrophysiology. Lumbar cord WM atrophy was associated with lower limb sensory impairments. In conclusion, tissue-specific neurodegeneration revealed by quantitative MRI is already apparent across the spinal cord in mild-moderate DCM before the onset of severe clinical impairments. WM microstructural changes are particularly sensitive to remote pathologically and clinically eloquent changes in DCM.
Introduction
Degenerative cervical myelopathy (DCM) is the most common cause of non-traumatic spinal cord injury and can lead to spinal cord dysfunction. Degenerative changes of the spine lead to a progressive stenosis of the cervical spinal canal 1,2 with ensuing spinal cord compression. Cord compression triggers a cascade of pathophysiological processes (ischemia, inflammation, neuronal, and oligodendroglial apoptosis) at the site of compression producing irreversible neural tissue damage (cervical myelopathy) 3 as well as secondary anterograde and retrograde degeneration of spinal pathways 4 above and below the compression site. 5 –7
To detect tissue at risk and prevent irreversible tissue damage in the early stages of DCM, there is a pressing need to determine tissue integrity and the underlying pathophysiology 3 at and remote to the site of spinal cord compression. Indeed, recent work suggests that >50% of patients with mild-moderate DCM will decline over a 2.5-year follow-up period and that conventional magnetic resonance imaging (MRI) techniques are insensitive to detect this change. 8 Quantitative MRI (qMRI) techniques can provide biomarkers sensitive to spinal cord tissue integrity 9 and underlying pathology in DCM 7,10 and help in clinical decision making (i.e., early surgery vs. conservative treatment).
This study aims therefore to track compression-induced neurodegeneration across the spinal cord axis using an advanced qMRI protocol 11,12 that includes tissue-specific volumetric and microstructural indices derived from structural and diffusion-weighted imaging (DWI). We hypothesized that 1) tissue-specific neurodegeneration extends from the site of compression in the rostral and caudal directions in mild-moderate DCM, 2) remote white matter (WM) microstructural changes are evident before irreversible tissue damage at the site of compression (i.e., radiological evidence of cervical myelopathy), and 3) spinal cord pathology is clinically eloquent remote to the site of cord compression.
Methods
Standard protocol approvals, registrations, and patient consents
The study protocol was performed in accordance with the Declaration of Helsinki, approved by the local ethics committee (EK-2010-0271). Informed written consent was obtained from each participant before study enrolment.
Participants
Twenty-four mild (n = 20; modified Japanese Orthopaedic Association [mJOA] ≥15) to moderate (n = 4; 12 ≤ mJOA ≤14) DCM patients (Abbreviated Injury Scale D–E; mean [± standard deviation (SD)] age = 54.92 ± 11.00 years; 8 female) and 24 healthy controls (mean age [±SD] = 41.6 ± 15.4 years; 4 female) were recruited from the Spinal Cord Injury Center outpatient clinic. Inclusion criteria were a spinal canal stenosis observed in MRI and the clinical diagnosis of DCM, 2 no previous spine operations, no head or brain lesions, no pre-existing neurological and mental disorder, no MRI contraindications, and 18 < age < 70 years.
Clinical assessments
All patients underwent a clinical examination specific to DCM including the mJOA score 13 and the Nurick scale. 14 The mJOA score is a validated disease-specific outcome measurement quantifying clinical impairment in the upper and lower limbs as well as sphincter function on an 18-point scale as follows, 13 where a score of 18 reflects no impairment and lower scores indicate a progressively greater degree of disability and functional impairment. The Nurick classification 14 was conducted to grade patients into five different categories, from 0 to 5, where a grade of 0 indicates no evidence of spinal cord involvement to the patient's symptoms and a grade of 5 indicates that the patient is chair-bound or bedridden. In addition, the International Standards for Neurological Classification of Spinal Cord Injury (ISNCSCI) protocol 15 was performed, which discerns detailed assessments of upper and lower extremity motor function, as well as light-touch and pinprick sensation across all spinal segments.
Electrophysiological measurements
Cervical dermatomal (dSEP) somatosensory evoked potential (SEP) measurements were conducted in patients at the C6 and C8 dermatomes according to the standard protocol of the European Multicenter Study about Spinal Cord Injury. 16
Image acquisition
Participants were positioned head-first supine on a 3 Tesla MRI system (SkyraFit; Siemens Healthcare, Erlangen, Germany). An MRI protocol was performed in patients to assess the extent of the lesion, consisting of an anatomical two-dimensional sagittal scan and an axial T2-weighted scan based on a turbo spin echo sequence. MRI parameters of the sagittal T2-weighted scan were as follows: repetition time (TR) = 3500 ms, echo time (TE) = 84 ms, flip angle = 160 degrees, field of view (FOV) = 220 × 220 mm2, in-plane resolution = 0.34 × 0.34 mm2, readout bandwidth = 260 Hz/pixel, and acquisition time = 1.37 min. MRI parameters for the axial T2-weighted scan were as follows: TR = 5510 ms, TE = 96 ms, flip angle = 150 degrees, FOV = 160 × 160 mm2, in-plane resolution = 0.6 × 0.6 mm2, readout bandwidth = 283 Hz/pixel, and acquisition time = 1.57 min.
To quantify atrophy at the cervical cord (C2–C3) and lumbar enlargement (T11–L1), a T2*-weighted three-dimensional (3D) sequence (multiple echo data image combination) was performed. T2*-weighted images resulted in four axial 3D volumes of the cervical and lumbar cord, with in-plane resolution of 0.5 × 0.5 mm2, slice thickness = 5 mm, and FOV = 162 × 192 mm2; TR = 44 msec for the cervical cord and 55 msec for the lumbar cord imaging, TE = 19 msec, flip angle = 1 degree, and readout bandwidth = 260 Hz/pixel, and acquisition time = 3.30 min at the cervical and 4.22 min at the lumbar cord level. These sequences are based on the spine generic consensus protocol. 11,12
To quantify microstructural changes of the spinal cord at the cervical and lumbar levels, a DWI sequence was performed based on the FOV single-shot spin-echo echo planar imaging method with cardiac gating (based on finger pulse oximetry), resulting in 60 diffusion-weighted images (b-value = 500 sec/mm2) and six b0-weighted images. DWI MR parameters were as follows: TR = 350 msec, TE = 73 msec, slice thickness = 5 mm with 10% interslice gap, bandwidth = 812 Hz/pixel, FOV = 133 × 30 mm2, in-plane resolution = 0.8 × 0.8 mm2, and nominal total acquisition time of 6.2 min.
As a result of motion artefacts at the cervical level, 3 patients and 1 healthy control were excluded from atrophy analysis and 3 patients and 5 healthy controls from diffusion analysis. At the lumbar cord level, 5 patients and 3 healthy controls were excluded from atrophy assessment, and 5 patients and 5 healthy controls were excluded from diffusion assessment.
Image processing
Processing of T2-weighted magnetic resonance imaging at the compression site
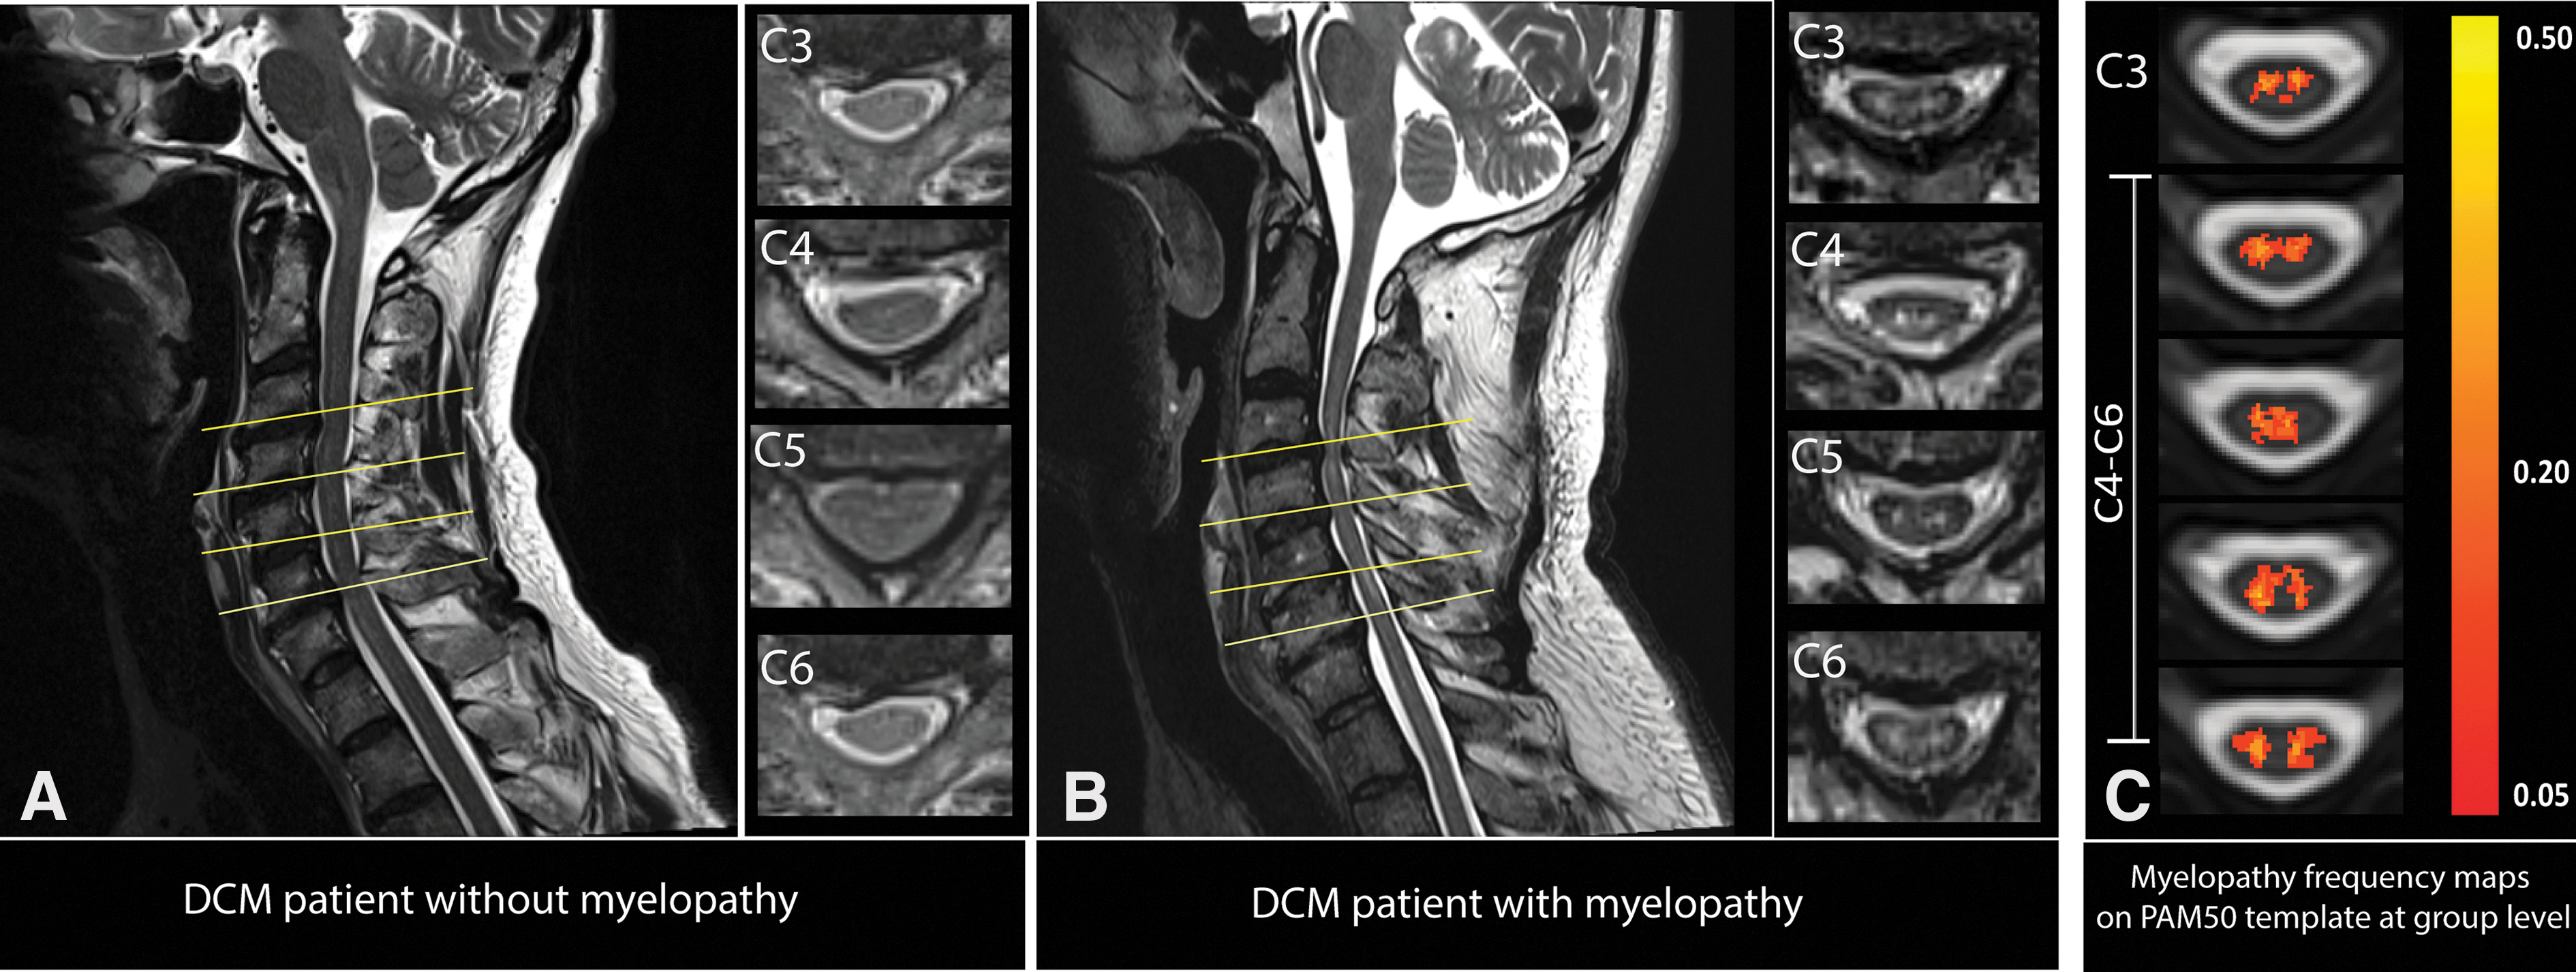
T2-weighted MRI was used to determine the exact level(s) of spinal canal stenosis and intramedullary signal hyperintensity as a sign of myelopathy (radiological evidence of cervical myelopathy) along the cervical spinal cord. Next, the mid-sagittal slice of the T2-weighted images was assessed to determine the maximum spinal cord compression (MSCC) and maximum canal compromise (MCC) and to calculate signal intensity of the signal hyperintensity on T2-weighted images. 17,18
To show the distribution frequency of lesions in the patient group voxel-wise, hyperintense voxels were manually segmented on axial slices by an experienced rater (K.V.), using FSLeyes from FMRIB software library v6.0. Next, the total spinal cord area (SCA) was segmented and normalized applying the Spinal Cord Toolbox (SCT; version 3.2.2). 19 In the resulting lesion frequency map, voxel intensity represents the frequency of a lesion (%) occurring in the corresponding voxel.
Processing of T2*-weighted magnetic resonance imaging at cervical and lumbar cord level
The serial longitudinal registration algorithm available in SPM1220 was applied to all T2*-weighted images to average the images accounting for intraparticipant motion. Jim 7.0 software was used to semiautomatically segment the cross-sectional cord (SCA) and gray (GMA) and white matter area (WMA). Of note, at the lumbar enlargement level, three slices with the largest spinal cord cross-sectional area were selected 21 to ensure the anatomical level, while at the cervical cord all slices were considered for the further analysis.
Processing of diffusion weighted magnetic resonance imaging at cervical and lumbar cord level
Processing of DWI data was carried out with a modified version of the MATLAB-based Artefact Correction in Diffusion MRI (ACID) toolbox 22,23 within SPM12 optimized for the spinal cord. The diffusion tensor model was fitted to the DWI data by applying a robust tensor fitting algorithm in the ACID toolbox. 22,24 DWI fitting resulted in diffusion tensor imaging (DTI) maps, including fractional anisotropy (FA), mean diffusivity (MD), axial diffusivity (AD), and radial diffusivity (RD). DTI maps were registered to the corresponding T2*-weighted image, applying a non-linear transformation (BSplineSyn algorithm) 25 implemented with regularization across slices and the b0 image as a source image to drive the registration. Mean FA, AD, MD, and RD were extracted from the spinal cord, gray matter (GM), and WM binary masks, using the ACID toolbox.
Statistical analysis
Statistical analysis was performed using Stata software (version 16; StataCorp LP, College Station, TX). Mean age was higher in DCM patients compared to healthy controls (DCM, 54.9 ± 11.0; healthy control, 41.6 ± 15.0; p = 0.001 [mean ± SD]); thus, age was considered as a covariate of no interest in our linear regression models. Macrostructural morphometric measurements (i.e., SCA, GMA, and WMA) were compared between healthy controls and DCM patients by means of a one-tailed t-test. Next, microstructural DTI indices (FA, AD, MD, and RD) within the cervical and lumbar cord were compared between groups using a two-sample t-test (unpaired, one-tailed, p < 0.05).
Patients were divided into two groups depending on the presence versus absence of T2-hyperintensity signal in the cervical cord as a sign of cervical myelopathy. Measurements of MSCC and MCC, volumetric and microstructural MRI readouts, as well as clinical scores were compared between groups using a two-sample t-test (unpaired, one-tailed; p < 0.05). Finally, linear regression and Pearson's correlation analysis in Stata software (StataCorp LP) were performed to reveal possible relationships between volumetric and microstructural MRI readouts in cervical and lumbar cord and clinical and electrophysiological outcomes, adjusted for age, using a level of significance set to p < 0.05.
Results
Demographic, clinical, electrophysiological, and radiological characteristics
Twenty-four mild-moderate DCM patients and 24 healthy controls were recruited and underwent the MRI protocol. Of the 24 DCM patients, 20 patients had mild (mJOA ≥15) and 4 had moderate DCM (12 ≤ mJOA ≤14). Moreover, 8 patients had a Nurick grade of 0/5, 13 patients had a Nurick grade of 1/5, and 3 patients had a Nurick grade of 2/5. Within the ISNCSCI examination, the light-touch score was (mean ± SD) 28.56 ± 4.79 points for the upper and 30.67 ± 2.76 points for the lower extremities (maximum value, 32 points). The pinprick score of the upper extremities (maximum value, 32 points) was 27.8 ± 4.8 points, and the pinprick score of the lower extremities was 30.67 ± 2.76 points. Upper and lower extremity motor scores (maximum value, 50 points) were 48.04 ± 6.5 and 48.5 ± 7.0 points, respectively.
Cervical dSEPs showed values considered in the normal range in clinical practice 26,27 : a sensory threshold of 3.20 ± 0.64 mA for C6 and 3.28 ± 0.45 mA for C8, a pain threshold of 18.81 ± 6.71 mA for C6 and 16.37 ± 5.39 mA for C8, an amplitude of 1.39 ± 0.81 mV for C6 and 1.17 ± 0.61 mV for C8, an N1 latency of 24.21 ± 1.62 msec for C6 and 24.89 ± 1.89 msec for C8, and a P1 latency of 23.30 ± 1.99 msec for C6 and 29.15 ± 6.5 msec for C8.
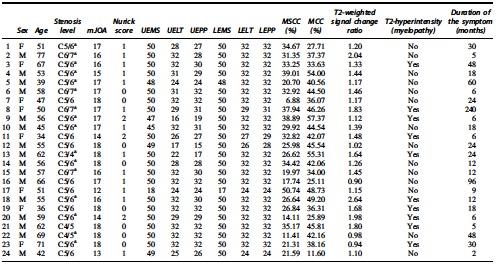
Maximal cervical spinal stenosis was mostly observed at cervical level C5–C6 (n = 17; Table 1). Of the 24 patients, 16 had multi-segmental cervical spinal canal stenosis. Signal hyperintensity of the cord on T2-weighted images was observed in 10 patients (Fig. 1A,B). The frequency map of T2-hyperintensity signal (“myelopathy”) across the cervical cord in DCM patients with myelopathy has been shown for 10 patients (Fig. 1C). The map shows that T2-weighted hyperintensity was more frequent on the C4–C6 levels in these patients (Fig. 1C).
Overview of the site of compression in DCM patients (
Demography and Clinical Data of Patients with Degenerative Cervical Myelopathy
Multi-segmental cervical spine stenosis.
mJOA, modified Japanese Orthopaedic Association (maximum 18 points);.UEMS, upper extremity motor score (maximum 50 points); UELT, upper extremity light-touch (maximum 32 points); UEPP, upper extremity pinprick (maximum 32 points); LEMS, lower extremity motor score (maximum 50 points); LELT, lower extremity light-touch (maximum 32 points); LEPP, lower extremity pinprick (maximum 32 points); MSCC, maximum spinal cord compression; MCC, maximum canal compromise.
DCM patients with radiological evidence of cervical myelopathy had reduced MSCC at their maximal compression site in comparison with patients without cervical myelopathy (DCM with radiological evidence of myelopathy, n = 10: MSCC = 29.36% ± 7.77%; DCM without radiological evidence of myelopathy, n = 14: MSCC = 26.95% ± 11.56%; p = 0.02) and reduced MCC (DCM with myelopathy MCC = 43.00% ± 9.8%; DCM without myelopathy MCC = 38.14% ± 10.89%; p = 0.04). There were no significant differences between clinical scores (e.g., mJOA, Nurick, and INSCSCI scores) in patients with and without radiological evidence of cervical myelopathy.
Spinal cord neurodegenerations at cervical and lumbar cord
We first confirmed findings reported in previous studies 7,28 that at cervical cord level (C2–C3), the SCA was decreased (Δ = −12.0%; p < 0.001) in DCM patients compared to healthy controls (Table 2). Subsegmentation of the spinal cord showed that both the GMA and WMA were decreased in DCM patients in comparison to healthy controls (GMA: Δ = −10.4%, p < 0.001; WMA: Δ = −12.1%, p < 0.001).
Spinal Cord Tissue–Specific Quantitative MRI Parameters
Cross-sectional areas and diffusion tensor imaging scalar values in the cervical cord at level C2–C3 and in lumbar enlargement in patients with degenerative cervical myelopathy and healthy controls.
MRI, magnetic resonance imaging; SCA, spinal cord area; GMA, gray matter area; WMA, white matter area; WM, white matter; GM, gray matter; ROI, region of interest; FA, fractional anisotropy; MD, mean diffusivity; AD, axial diffusivity; RD, radial diffusivity.
Considering microstructural indices, FA was decreased in the cervical WM in DCM patients compared to healthy controls (Δ = −4.6%, p = 0.01). In the WM of the cervical cord, MD, AD, and RD were increased in DCM patients compared to healthy controls (MD: Δ = +10.58%, p = 0.001; AD: Δ = +6.8%, p = 0.01; RD: Δ = +14.50%, p = 0.001; Table 2).
At the lumbar level, SCA (Δ = −8.6%, p = 0.014) and WMA (Δ = −11.30%, p = 0.01) were decreased in DCM patients compared to healthy controls significantly, whereas GMA was similar in both groups (p = 0.69; Table 2; Fig. 2). Microstructural indices showed that MD, AD, and RD were significantly increased in DCM patients compared to healthy controls in WM (MD: Δ = 9.5%, p = 0.01; AD: Δ = 7.1%, p = 0.04; RD: Δ = 11%, p = 0.02). However, decrease of FA in WM of DCM patients compared to healthy controls was not significant (p = 0.42), and DTI indices did not change in the GM (Table 2; Fig. 3).
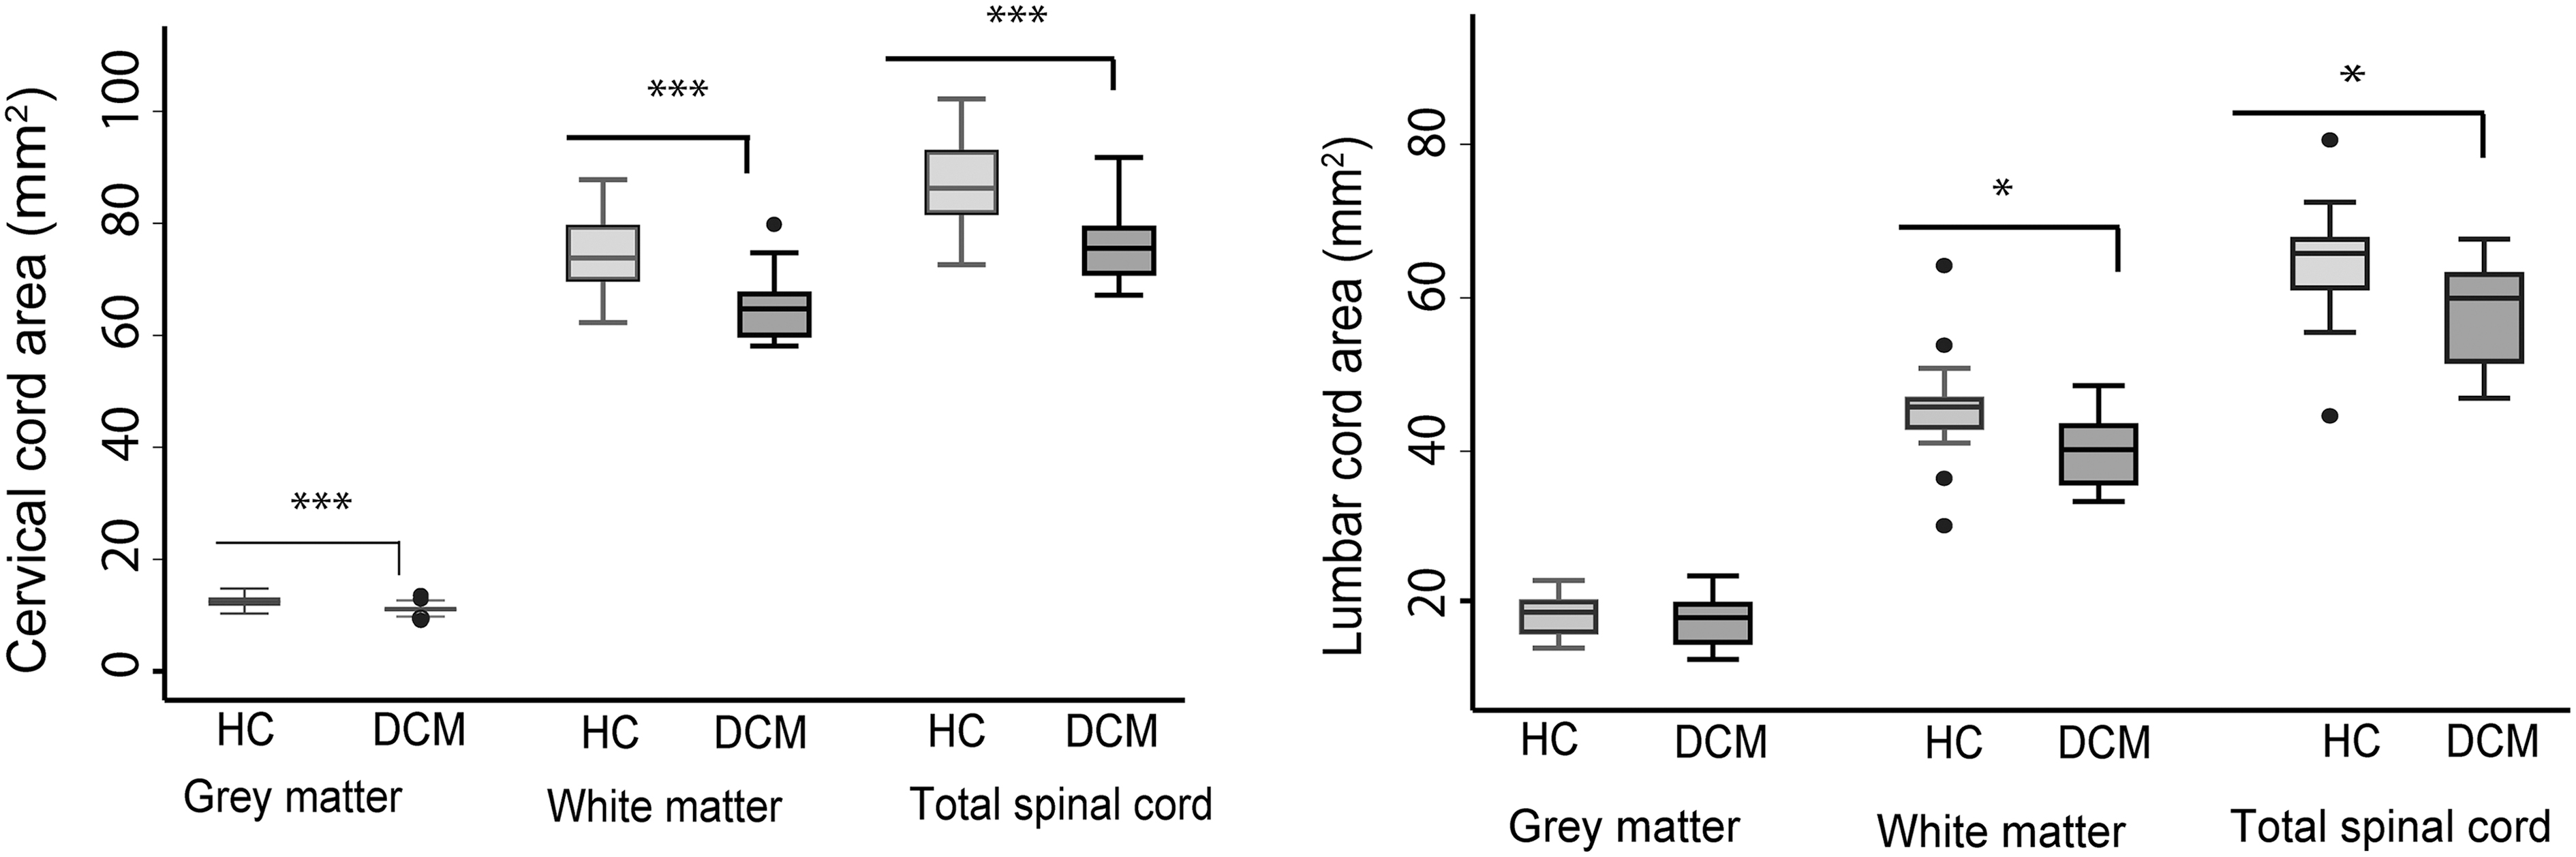
Box plots of cross-sectional areas of total spinal cord and gray and white matter in the cervical and lumbar cord of both DCM patients and healthy controls. ***p < 0.001; *p < 0.05. DCM, degenerative cervical myelopathy; HC, healthy controls.
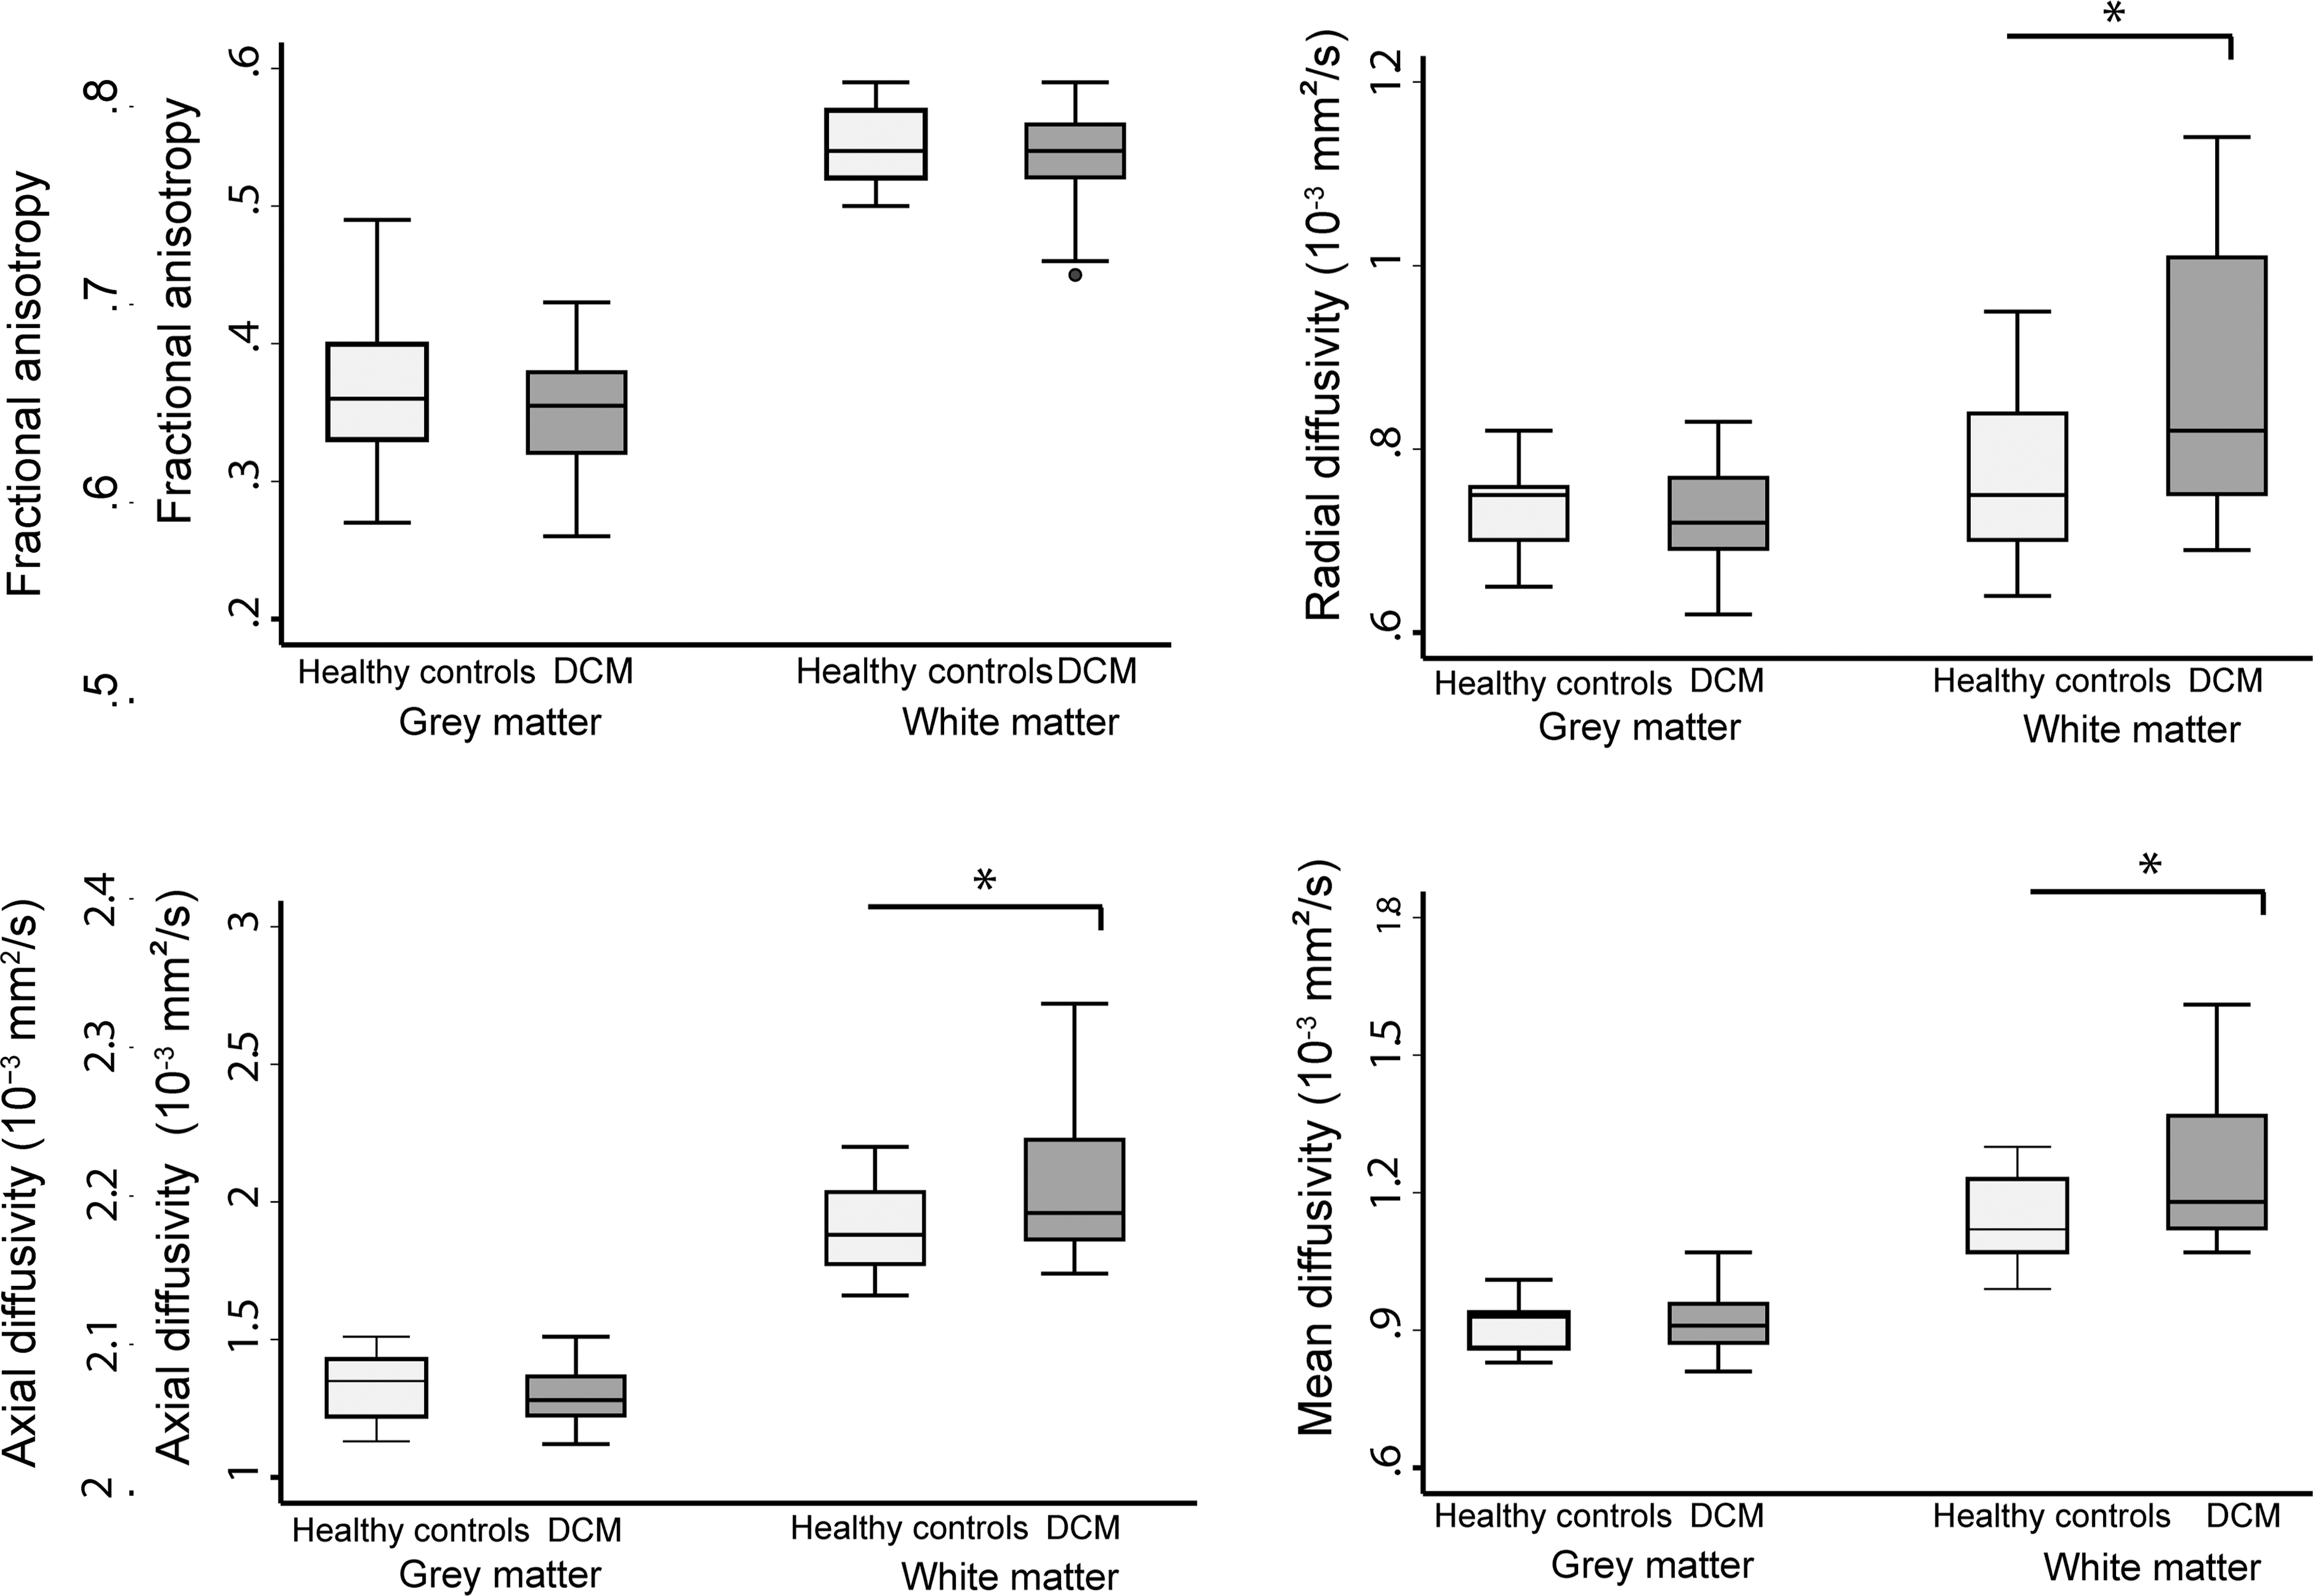
Box plots of lumbar cord diffusion tensor imaging metrics of gray and white matter of both DCM patients and healthy controls. *p < 0.05. DCM, degenerative cervical myelopathy; DTI, diffusion tensor imaging.
Associations between cervical and lumbar cord neurodegeneration
In DCM patients, total cross-sectional SCA and WMA at the cervical C2–C3 level predicted the corresponding volumetric changes at the lumbar level (p < 0.001, r = 0.78; p = 0.002, r = 0.70, respectively). However, no association was found between GMA at the cervical level (C2–C3) and in the lumbar cord enlargement.
In healthy controls, volumetric measurements at the C2–C3 level were not associated with the corresponding measurements in the lumbar cord (SCA: p = 0.17, r = 0.31; WMA: p = 0.06, r = 0.42; Fig. 4). DTI indices measured at the C2–C3 level were not associated with the DTI indices measured in the lumbar cord in both DCM patients and healthy controls.
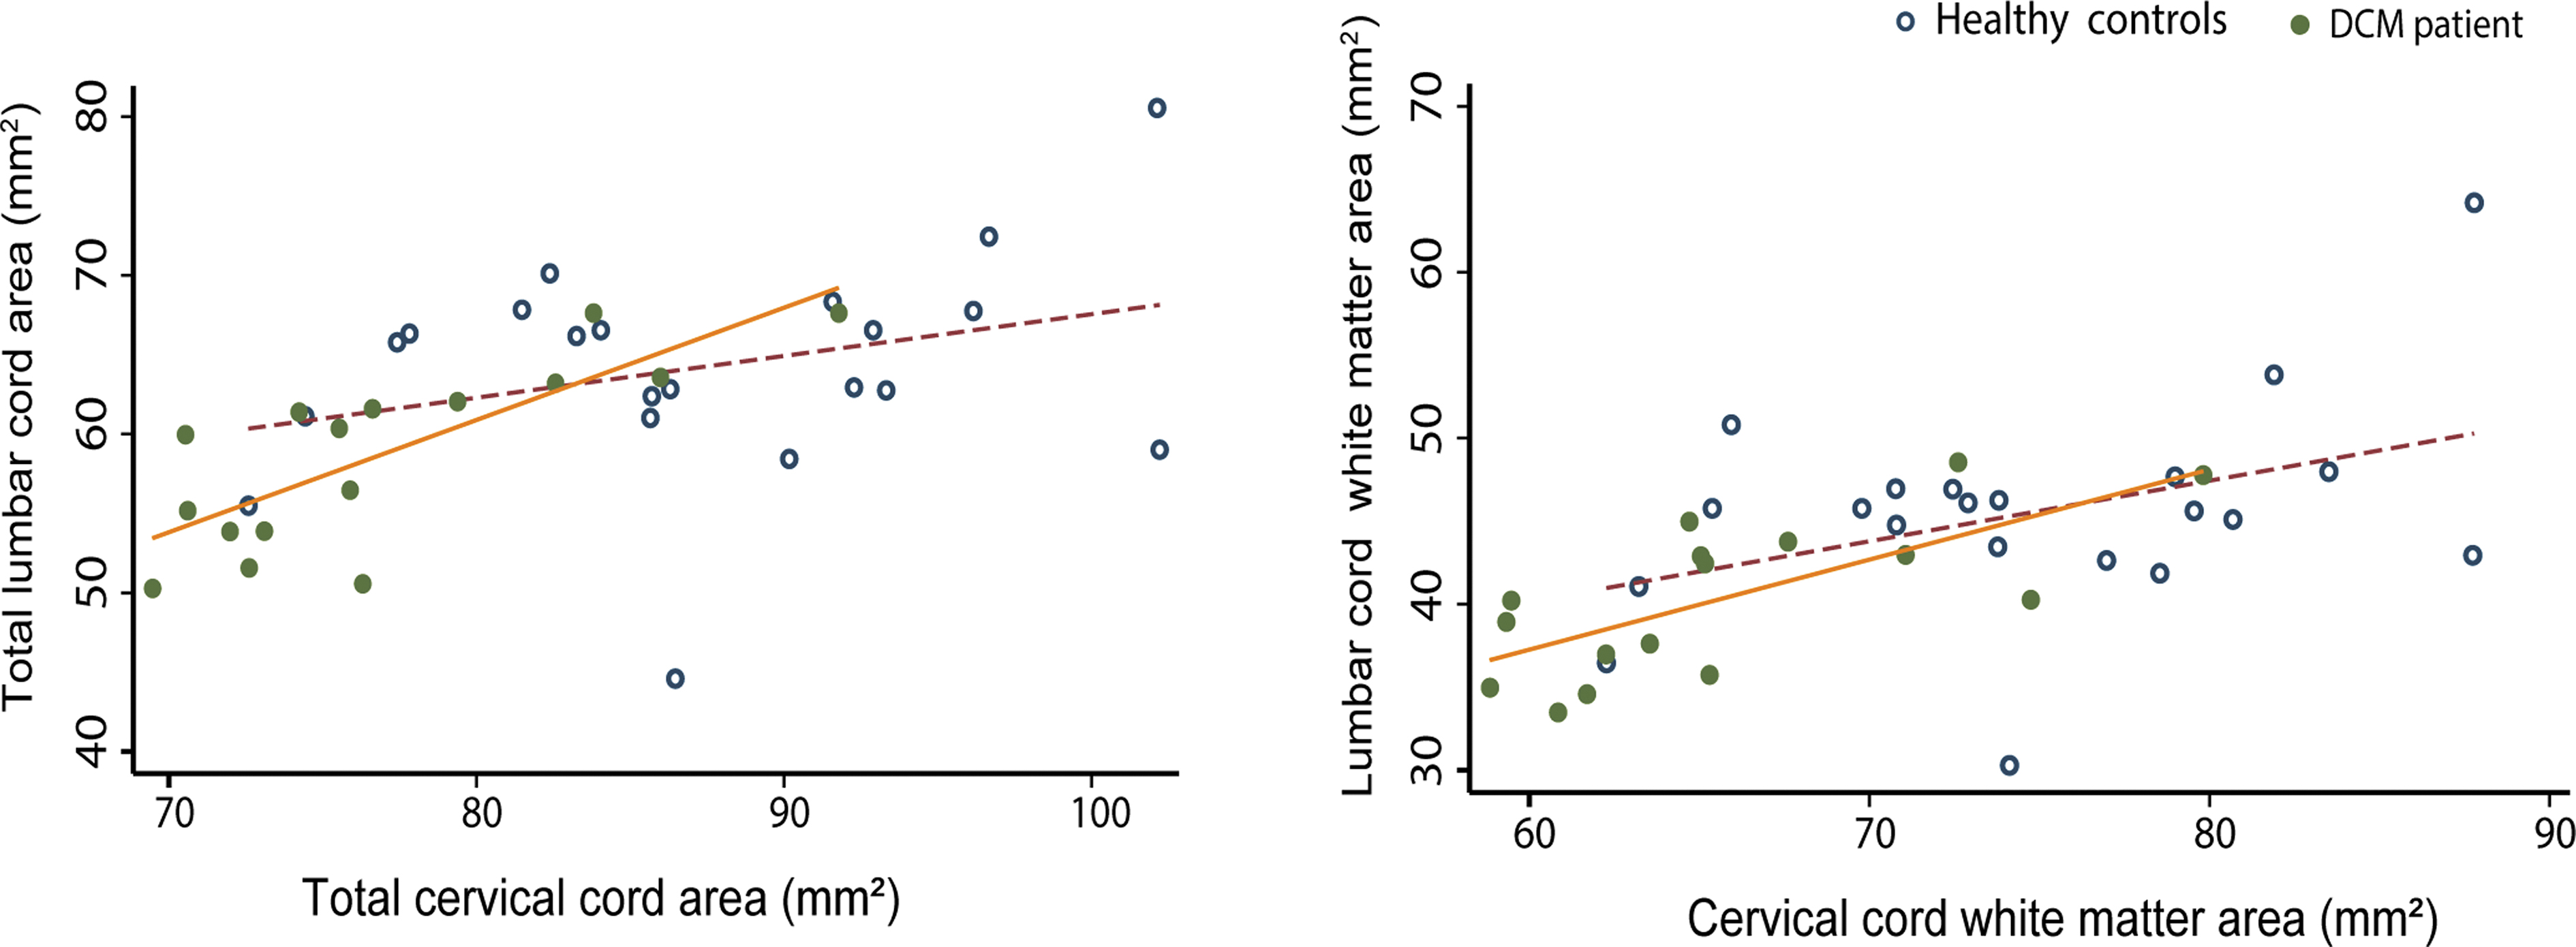
Linear regression models of spinal cord cross-sectional areas in cervical and lumbar level: The total spinal cord and white matter areas in both DCM patients and healthy controls are shown. DCM patients: cervical total spinal cord area: p < 0.0001, r = 0.78; white matter area: p = 0.002, r = 0.70). Healthy controls: cervical total spinal cord area: p = 0.168, r = 0.31; white matter area: p = 0.06, r = 0.42. DCM, degenerative cervical myelopathy. Color image is available online.
Effects of myelopathy on remote neurodegeneration
Patients with radiological evidence of cord myelopathy (i.e., T2-weighted hyperintensity) showed reduced FA (DCM without myelopathy: FA = 0.68 ± 0.03; DCM with myelopathy: FA = 0.63 ± 0.05, Δ = −7.35%, p = 0.005), increased RD (DCM without myelopathy: RD = 0.62 ± 0.07; DCM with myelopathy: RD = 0.70 ± 0.12, Δ = +22.06%, p = 0.03; Fig. 5) in cervical WM compared to patients without myelopathy. At the lumbar cord level, no significant differences in DTI indices were found between patients with or without radiological evidence of cord myelopathy.
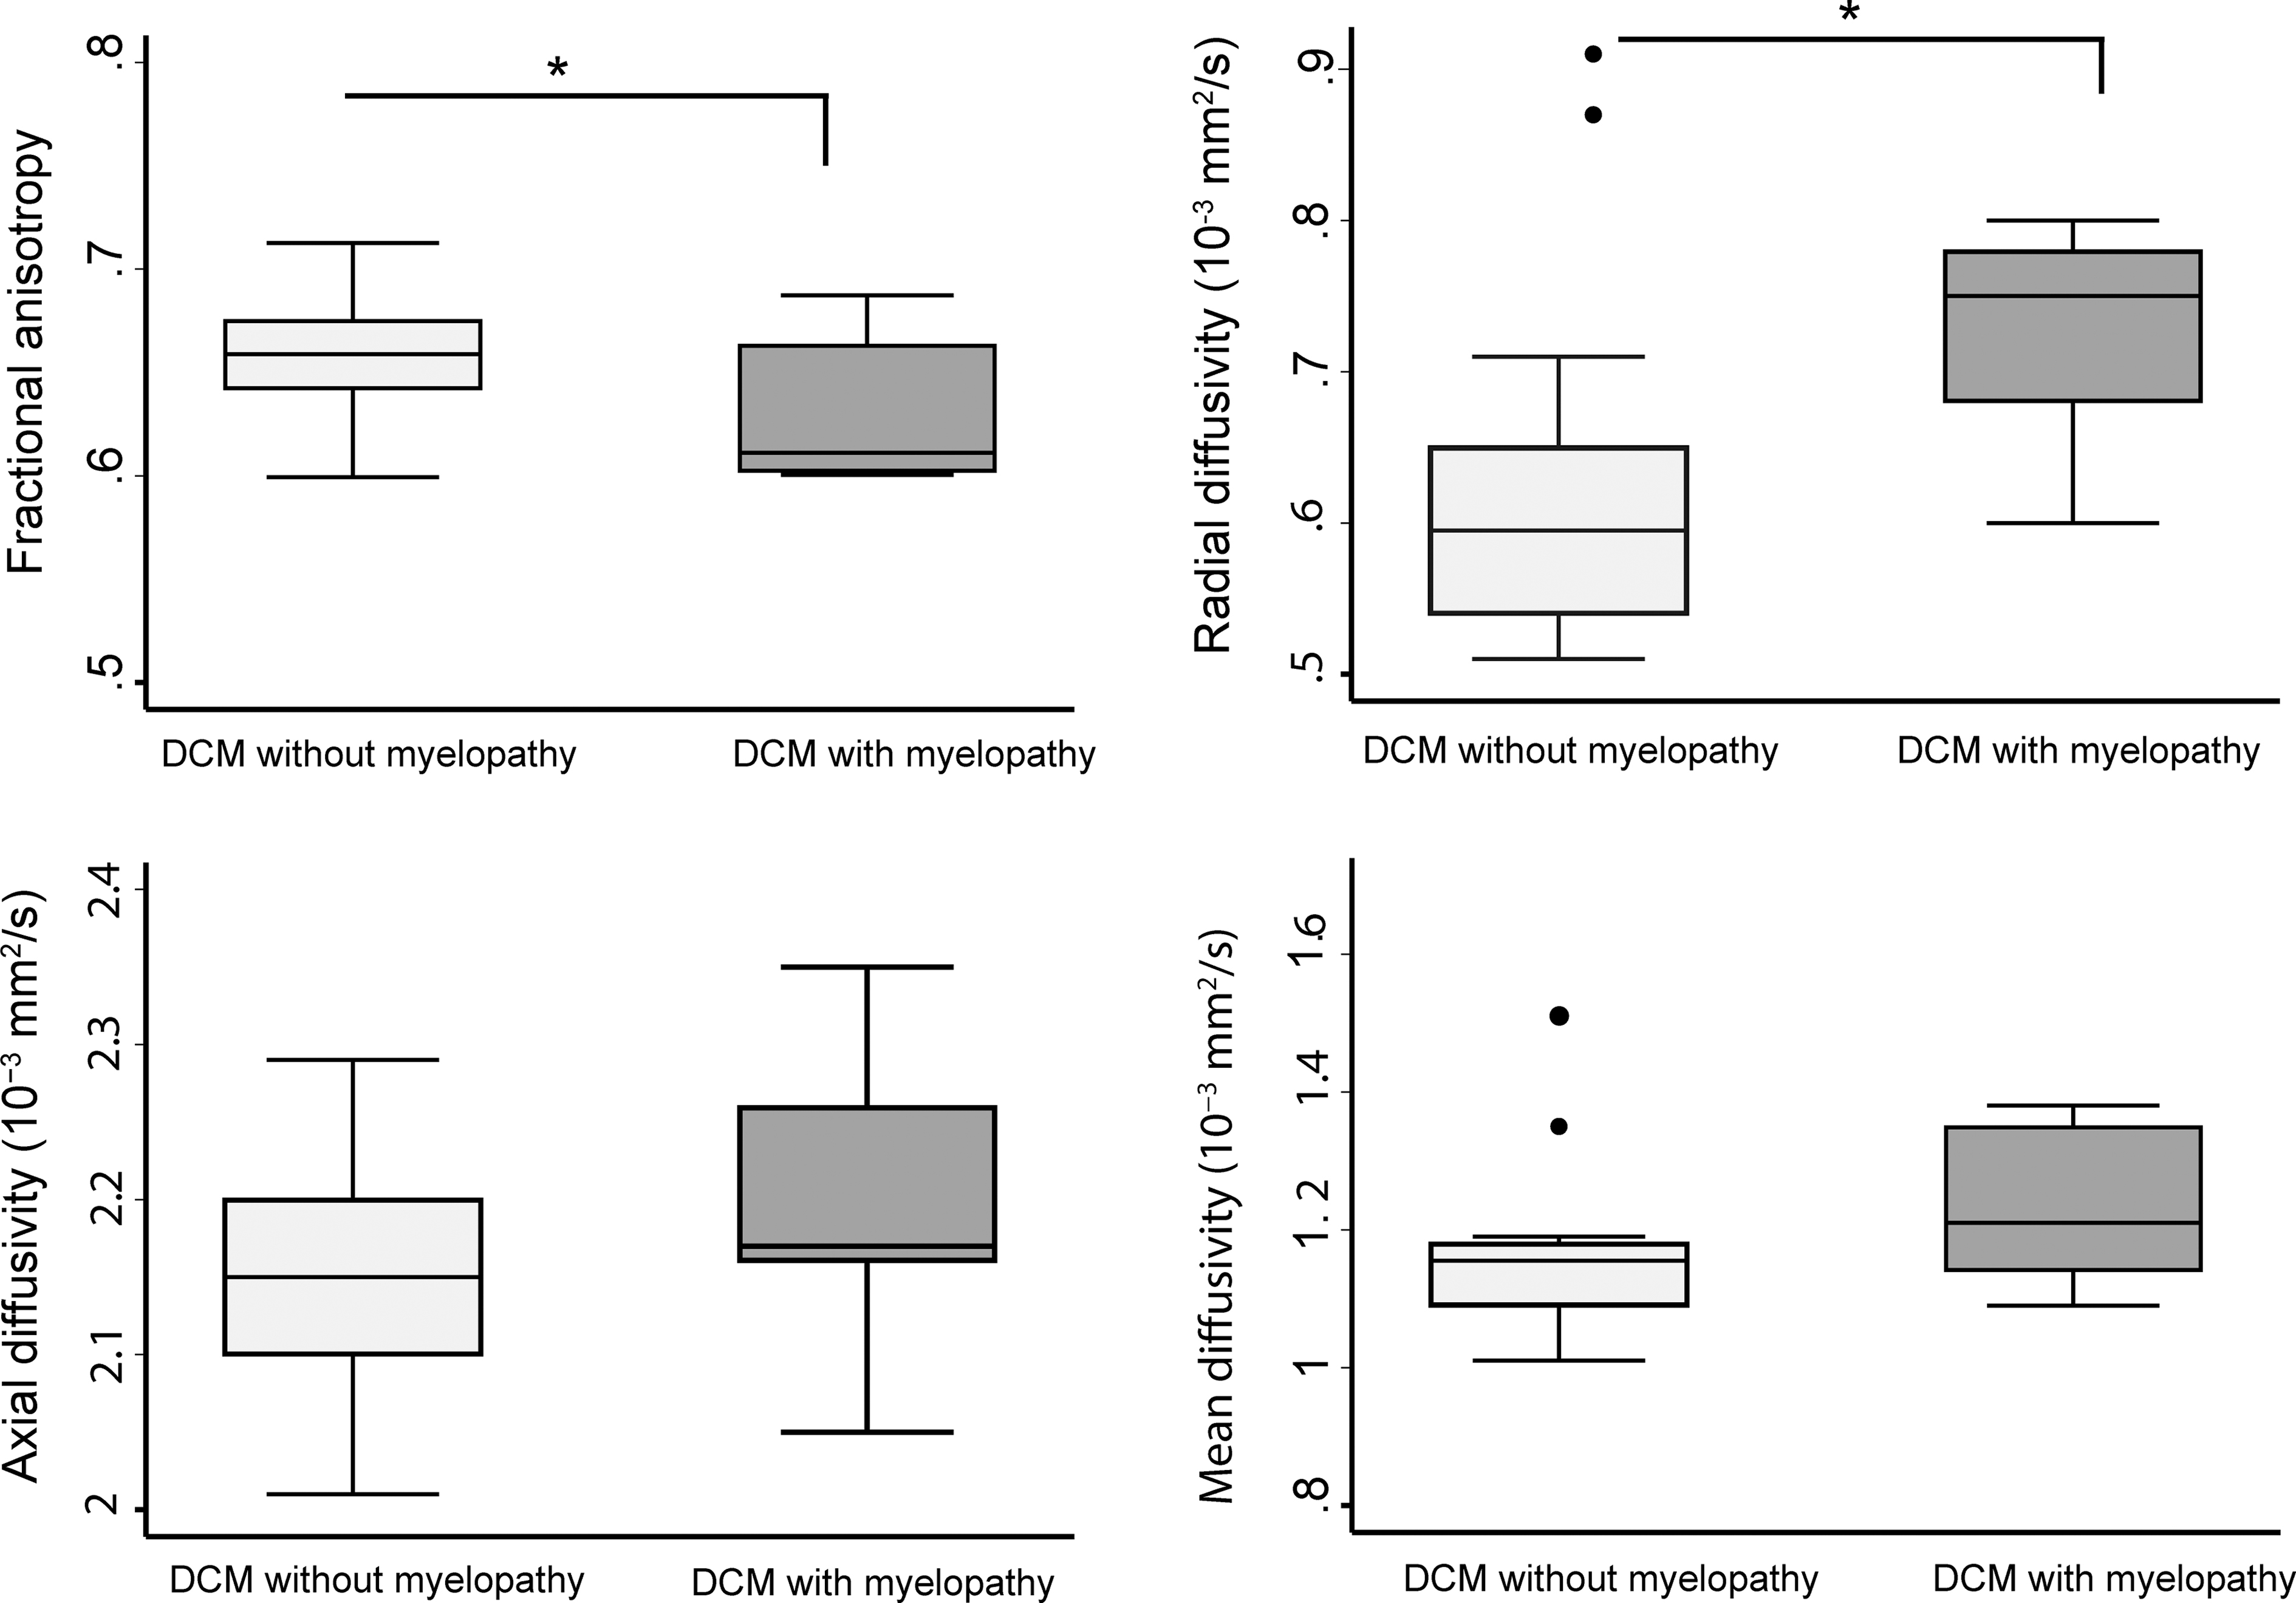
Box plots of diffusion tensor imaging (DTI) metrics of white matter in cervical (C2–C3) level of DCM patients with and without radiological signs of myelopathy. *p < 0.05. DCM, degenerative cervical myelopathy.
Associations between MRI readouts and clinical outcome
Increased MD in the cervical cord was associated with lower C6 and C8 dSEP pain thresholds (C6: n = 16, p = 0.031, r = −0.56; C8: n = 16, p = 0.01, r = −0.62). Increased AD was associated with lower pain threshold dSEPs at the C8 level (n = 16, p = 0.007, r = −0.65).
Increased RD in cervical cord and FA in lumbar cord (WM) significantly correlated with duration of DCM symptoms (n = 19, p = 0.02, r = 0.52; p = 0.03, r = 0.52, respectively). Lumbar WM atrophy was associated with light touch score (p < 0.001, r = 0.92) and pinprick score (p = 0.001, r = 0.86) of the lower extremities. No significant correlations were found between MRI readouts and number of stenoses in DCM patients.
Discussion
This study shows compression-induced neurodegeneration along the spinal cord axis in the early stages of DCM, even preceding the onset of severe functional impairments. The magnitude of cervical cord neurodegeneration revealed by microstructural indices in WM was more pronounced in patients with radiological evidence of cervical myelopathy (i.e., T2-weighted hyperintensity). Crucially, qMRI was more sensitive to myelopathy-induced changes compared to conventional MRI and clinical measures. Thus, the qMRI protocol complements standard clinical measures for diagnostic purposes, 29 revealing microstructural changes of the spinal cord in early DCM stages.
The majority of included DCM patients showed only mild clinical impairment based on both the mJOA classification and detailed assessments of motor and sensory function within the ISNCSCI examination. Interestingly, diffusion MRI readouts within the cervical cord showed more sensitivity than clinical mJOA scores, distinguishing DCM with and without radiological evident myelopathy. Demonstrating a link between microstructure and function by means of DTI points toward the applicability of such advanced qMRI measures over conventional assessment in clinical routines. 5
Electrophysiological recordings (i.e., cervical dSEPs) were within normal ranges or very small changes in all patients. In contrast, conventional MRI demonstrated signs of irreversible intramedullary signal changes (i.e., T2-weighted hyperintensity, reflecting cervical myelopathy) in 42% (i.e., 10 of 24) of the patients at the site of maximal compression. Although standard clinical MRI scans did not show any sign of tissue damage (i.e., normal-appearing spinal cord in T2-weighted MRI) remote from the level of cord compression, qMRI revealed degeneration in cervical cord WM 7,28 as well as damage of WM in the lumbar enlargement regardless of the extent of spinal cord compression.
This result is in line with previous studies reporting cervical 5,7,28,30 and lumbar cord damage 10 in DCM patients using qMRI. Pathophysiological WM changes above and below the level of compression may result from secondary induced antero- and retrograde degeneration of spinal pathways. Whereas measurements in the cervical cord are only some segments (one to four segments) apart from the site of spinal cord compression, lumbar cord measurements are at least 13 segments away from the compression site, emphasizing remote alterations of the neural network away from the site of spinal cord injury. Interestingly, GM atrophy was observed only in the cervical cord. This may be attributable to the mechanically induced restriction of the microvasculature and blood supply impairments 31,32 that affects more the cord in the proximity of the site of compression, 7 where anterior horn cell loss and apoptosis have been reported, 33,34 whereas in the lumbar cord this remains unaffected. 35
Thus, pathophysiological changes occurring in the lumbar cord must relate to long-distance tract degeneration from cervical compression 4,6,36 ; this hypothesis is in line with human post-mortem findings, where demyelination of both descending and ascending WM tracts in the lesion epicenter of DCM patients were found. 33 In accordance with these neuropathological reports, our DTI indices revealed microstructural changes in the atrophied cervical and lumbar WM. Above and below the level of compression, RD, AD, and MD increased, supporting demyelination as an integral part of the underlying neurodegenerative process. 37 These results are in line with previous studies 4,35,38 that highlighted the potential role of demyelination in neurodegeneration of the spinal cord in DCM patients.
The magnitude of cervical cord atrophy above the compression site was correlated with atrophy occurring in the lumbar enlargement, that is, those patients with severe atrophy above the compression site showed also severe atrophy below the compression site. This could imply a common pathophysiological process causing neurodegeneration above and below the lesion site, with the compression site being the common denominator. In healthy controls, no correlations were observed between cervical and lumbar cord volumetric parameters, supporting our results as being an epiphenomenon of the DCM pathophysiology. Given that those results are independent of the compression-site measurements, further characterization of patients exhibiting more remote neurodegeneration could shed light on remote and targetable pathophysiological changes in DCM.
Whereas microstructural changes of the cervical cord (C2–C3) detected by DTI were associated with lower sensory and pain thresholds in C6 and C8 dSEPs, the mJOA scores were not associated with sensory impairments. Additionally, atrophy of the lumbar cord in DCM patients was correlated with sensory lower limb impairment. Interestingly, MRI readouts at the site of compression were not associated with motor or sensory outcomes or with cervical dermatomal SEPs. DTI matrices were associated with duration of DCM symptoms. These results suggest that advanced qMRI methods have an enhanced sensitivity to pathological changes and the potential to identify clinically eloquent spinal cord neurodegeneration in DCM patients with mild impairments. Hereby, qMRI can provide more sensitive tools to complement current standard clinical classification methods. These results are in line with studies before, reporting tissue changes in a multi-modal MRI protocol in the cervical cord in DCM patients. 5,6,28,39
Limitations
DCM patients were, on average, 14 years older than healthy controls, which may affect the compensatory effects, like aging, on microstructural changes. However, age was considered as a covariate in statistical analysis to reduce age-related effects. Given that all electrophysiological (i.e., dSEP) measurements were within normal limits and patients were only mildly affected, statistical analysis (i.e., correlation of qMRI readouts to the clinical data) may be affected by a ceiling effect of the clinical data.
Conclusion
This study shows that tissue-specific neurodegeneration is already apparent above and below the site of compression in DCM patients with mild to moderate clinical symptoms based on mJOA score, its magnitude being more pronounced in patients with radiological evidence of cervical myelopathy. Therefore, qMRI readouts are sensitive to remote pathological and clinically eloquent changes across the spinal cord axis before onset of severe clinical impairments in DCM patients. Thus, evolving clinical impairment in DCM patients are not entirely attributable to focal cervical cord pathology, but implies complex degeneration that occurs across the spinal cord axis. 40,41
Footnotes
Acknowledgments
We thank all subjects participating in our study who gave generously of their time, the staff of the Department of Radiology for scanning subjects, as well as the Spinal Cord Injury Center Balgrist for the support in patient recruitment.
Funding Information
This study is funded by grants from the Wings for Life charity (INSPIRED; No. WFL-CH-007/14), ERA-NET NEURON (hMRIofSCI no.: 32NE30_173678), the European Union's Horizon 2020 research and innovation program under grant agreement no. 681094, and the Swiss State Secretariat for Education, Research and Innovation (SERI) under contract number 15.0137, grants from the International Foundation for Research (IRP-158), Spinal Research, and the Craig H. Neilsen Foundation (CHNF). M.S. is funded by Wings for Life (no.: WFL-CH-19/20). P.F. is funded by the Eccellenza fellowship/181362 by SNSF.
Author Disclosure Statement
All authors declare no potential conflicts of interest with respect to research, authorship and/or publication of this article. The Wellcome Trust Centre for Neuroimaging and Max Planck Institute for Human Cognitive and Brain Sciences have an institutional research agreement with and receives support from Siemens Healthcare.