
Abstract
In addition to behavioral testing, the efficacy of neuroprotective therapies applied after spinal cord injury (SCI) is commonly evaluated by means of histological quantification of spared neural tissue. The primary insult itself, but mainly the pathological processes of secondary injury are the underlying causes of spinal tissue degeneration, the extent of which depends on the injury severity and post-injury time. Under-estimation of tissue loss due to spinal cord shrinkage and subjective evaluation (impeding reproducibility) are substantial factors that negatively affect the final results. Moreover, processing large numbers of stained spinal cord sections is very time-consuming. To overcome the problem, our new quantification approach combines a modified method for predicting the cross-sectional area at the lesion site with semi-automatic measurement of spared neural tissue and cystic cavities, using freely accessible National Institutes of Health (NIH) ImageJ software, with a Java-based image processing program. Based on the histological parameters measured after differing compression-induced SCI and correlated with behavioral outcomes, we can conclude that our new method is relatively fast, accurate, and optimally reproducible.
Introduction
Spinal cord injury (SCI) is an extremely serious type of physical trauma with a significant temporary or permanent impact on most aspects of daily life. The primary traumatic impact to the spinal cord serves as a nidus from which secondary injury extends in cranio-caudal directions, away from the lesion epicenter. Analysis of early post-traumatic changes reveals that a significant proportion of human SCI pathology is due to secondary injury, and not to the effects of the primary traumatic event. 1 The progress of histopathological changes observed in humans can be divided into four phases: (1) immediate phase (initial 1–2 h) consisting of the actual mechanical disruption of neural tissue; (2) acute phase (hours to 1–2 days) characterized by vasogenic and cytotoxic edema, hemorrhage, inflammation, and neuronal and myelin changes; (3) intermediate phase (days to weeks) involving prominent glial responses, necrotic debris elimination, edema resolving, and revascularization associated with blood-brain barrier (BBB) restoration; and (4) late phase (weeks to months/years) characterized by wallerian degeneration, astroglial and mesenchymal scar formation, and development of cysts and syrinxes. 2 These pathological processes resulting from SCI can contribute to shrinkage of the injured spinal cord that develops over time after the initial swelling in both cranio-caudal directions away from the lesion epicenter. 3
Depending on the severity of the initial trauma, the neurological deficit can be recovered to a certain degree within the first year. 4 The degree of functional recovery after spinal cord trauma depends on tissue sparing, predominantly at the lesion epicenter, the area of the spinal cord with the greatest extent of neural tissue damage. Sparing of tissue at the lesion epicenter can dramatically enhance motor output and is likely to facilitate reorganization of neural systems below the lesion. 5
Therapeutic interventions are developed to limit or prevent the harmful processes of secondary lesion cascade. It is essential for assessment of therapeutic effects to reliably investigate the extent of the lesion, reflecting secondary processes following traumatic injury. However, accurate assessment of experimental treatment efficacy remains a recurring problem for the following reasons. Two of the common parameters reflecting the success of experimental treatment are the amount of neural tissue that is spared at the lesion epicenter and the extent of tissue destruction in cranio-caudal directions from it. Due to the progressive shrinkage of the spinal cord, direct measurement of the lesion cross-sectional area in transverse or longitudinal sections 6 –8 leads to under-estimation of the lesion volume. To prevent this, a method of predicting the pre-injury cross-sectional area from the reference value was devised by Olby and Blakemore. 9 The differentiation of damaged from spared tissue at the lesion site is very complicated and often based on subjective evaluation, resulting in less than optimal reproducibility. Moreover, processing large numbers of stained spinal cord sections together with manual measurement of spared neural tissue is a difficult and time-consuming operation.
The research into trauma-induced SCI focuses on increasing scientific understanding of how changes at the molecular and cellular level and their complex reciprocal interactions determine the functional outcome of SCI, and on finding ways to prevent and treat these injuries. Despite intensive basic research aimed at repair and regeneration of the injured spinal cord, and the identification of many promising targets for treatment in recent years, there is still no effective, trustworthy or clinically fully accepted cure available for patients with SCI. Frustratingly, most of the already-published experimental data are difficult to reproduce for many reasons, so there is a growing effort by the scientific community to provide detailed guidelines for replication and reproducibility in SCI research to improve the basic and translational neuroscience. 10 –13 For these reasons, a fast, unbiased and reproducible method for assessment of tissue destruction is indispensable.
The main goal of our study was to develop a standardized as well as reliable method for quantification of tissue sparing at the lesion site after spinal cord trauma, particularly one that is not affected by subjective evaluation. We chose compression-induced SCI for our experimental study because it represents one of the valuable pre-clinical models. Our approach combines the modified method of Olby and Blakemore 9 with semi-automatic measurement of spared tissue and cystic cavities, using freely accessible National Institutes of Health (NIH) ImageJ software.
Methods
Experimental design
All experiments were performed on adult female Wistar rats (250–330 g weight, aged 3–4 months). The experimental animals were randomly divided into four groups: (1) control animals for establishing the pre-injury area along the spinal cord (n = 5); (2) SCI induced by 30 g compression lasting 15 min (n = 11); (3) SCI induced by 40 g compression lasting 15 min (n = 11); and (4) SCI induced by 50 g compression lasting 15 min (n = 11). The rats survived 28 days after the application of compression. The experimental animals were allowed access to tap water and standard rat diet freely and were kept in animal quarters with permanent 22°C in a 12-h light/dark cycle. All experiments were conducted with respect to the animals' welfare in accordance with the principles of the Ethical Committee for Animal Experimentation at the Institute of Neurobiology, and they were approved by the State Veterinary and Food Administration of the Slovak Republic (approval no. 2855/16-221) in strict accordance with Slovak legislation based on Directive 2010/63/EU of the European Parliament and of the Council of the European Union on the protection of animals used for scientific purposes.
Tissue processing
After the animals were sedated with an overdose of thiopental (VUAB Pharma, Slovakia), transcardial perfusion was performed with normal saline followed by freshly prepared 4% paraformaldehyde diluted in 0.1 M phosphate-buffered saline (PBS; pH = 7.4). The fixed spinal cord was exposed and transversely sectioned precisely at the level of the 13th rib, a useful anatomical landmark (Fig. 1A), and it was extracted from the spinal canal. The removed spinal cord was sliced into 3-mm transverse blocks using a spinal cord coronal matrix for rat (Electron Microscopy Sciences, Hatfield, PA), post-fixed overnight in the same fixative, and cryoprotected in phosphate buffers containing graded sucrose (15–30%) at 4°C until saturation. The dorso-caudal ending of each block was labeled via permanent marker for cranio-caudal identification and to keep the same orientation for cutting (Fig. 1B). Prior to sectioning, the blocks were covered with an M-1 embedding matrix and immediately frozen in the cryostat, and then 25-μm thick sections from each region at intervals of 1 mm were cut and mounted on Superfrost Plus microscope slides.
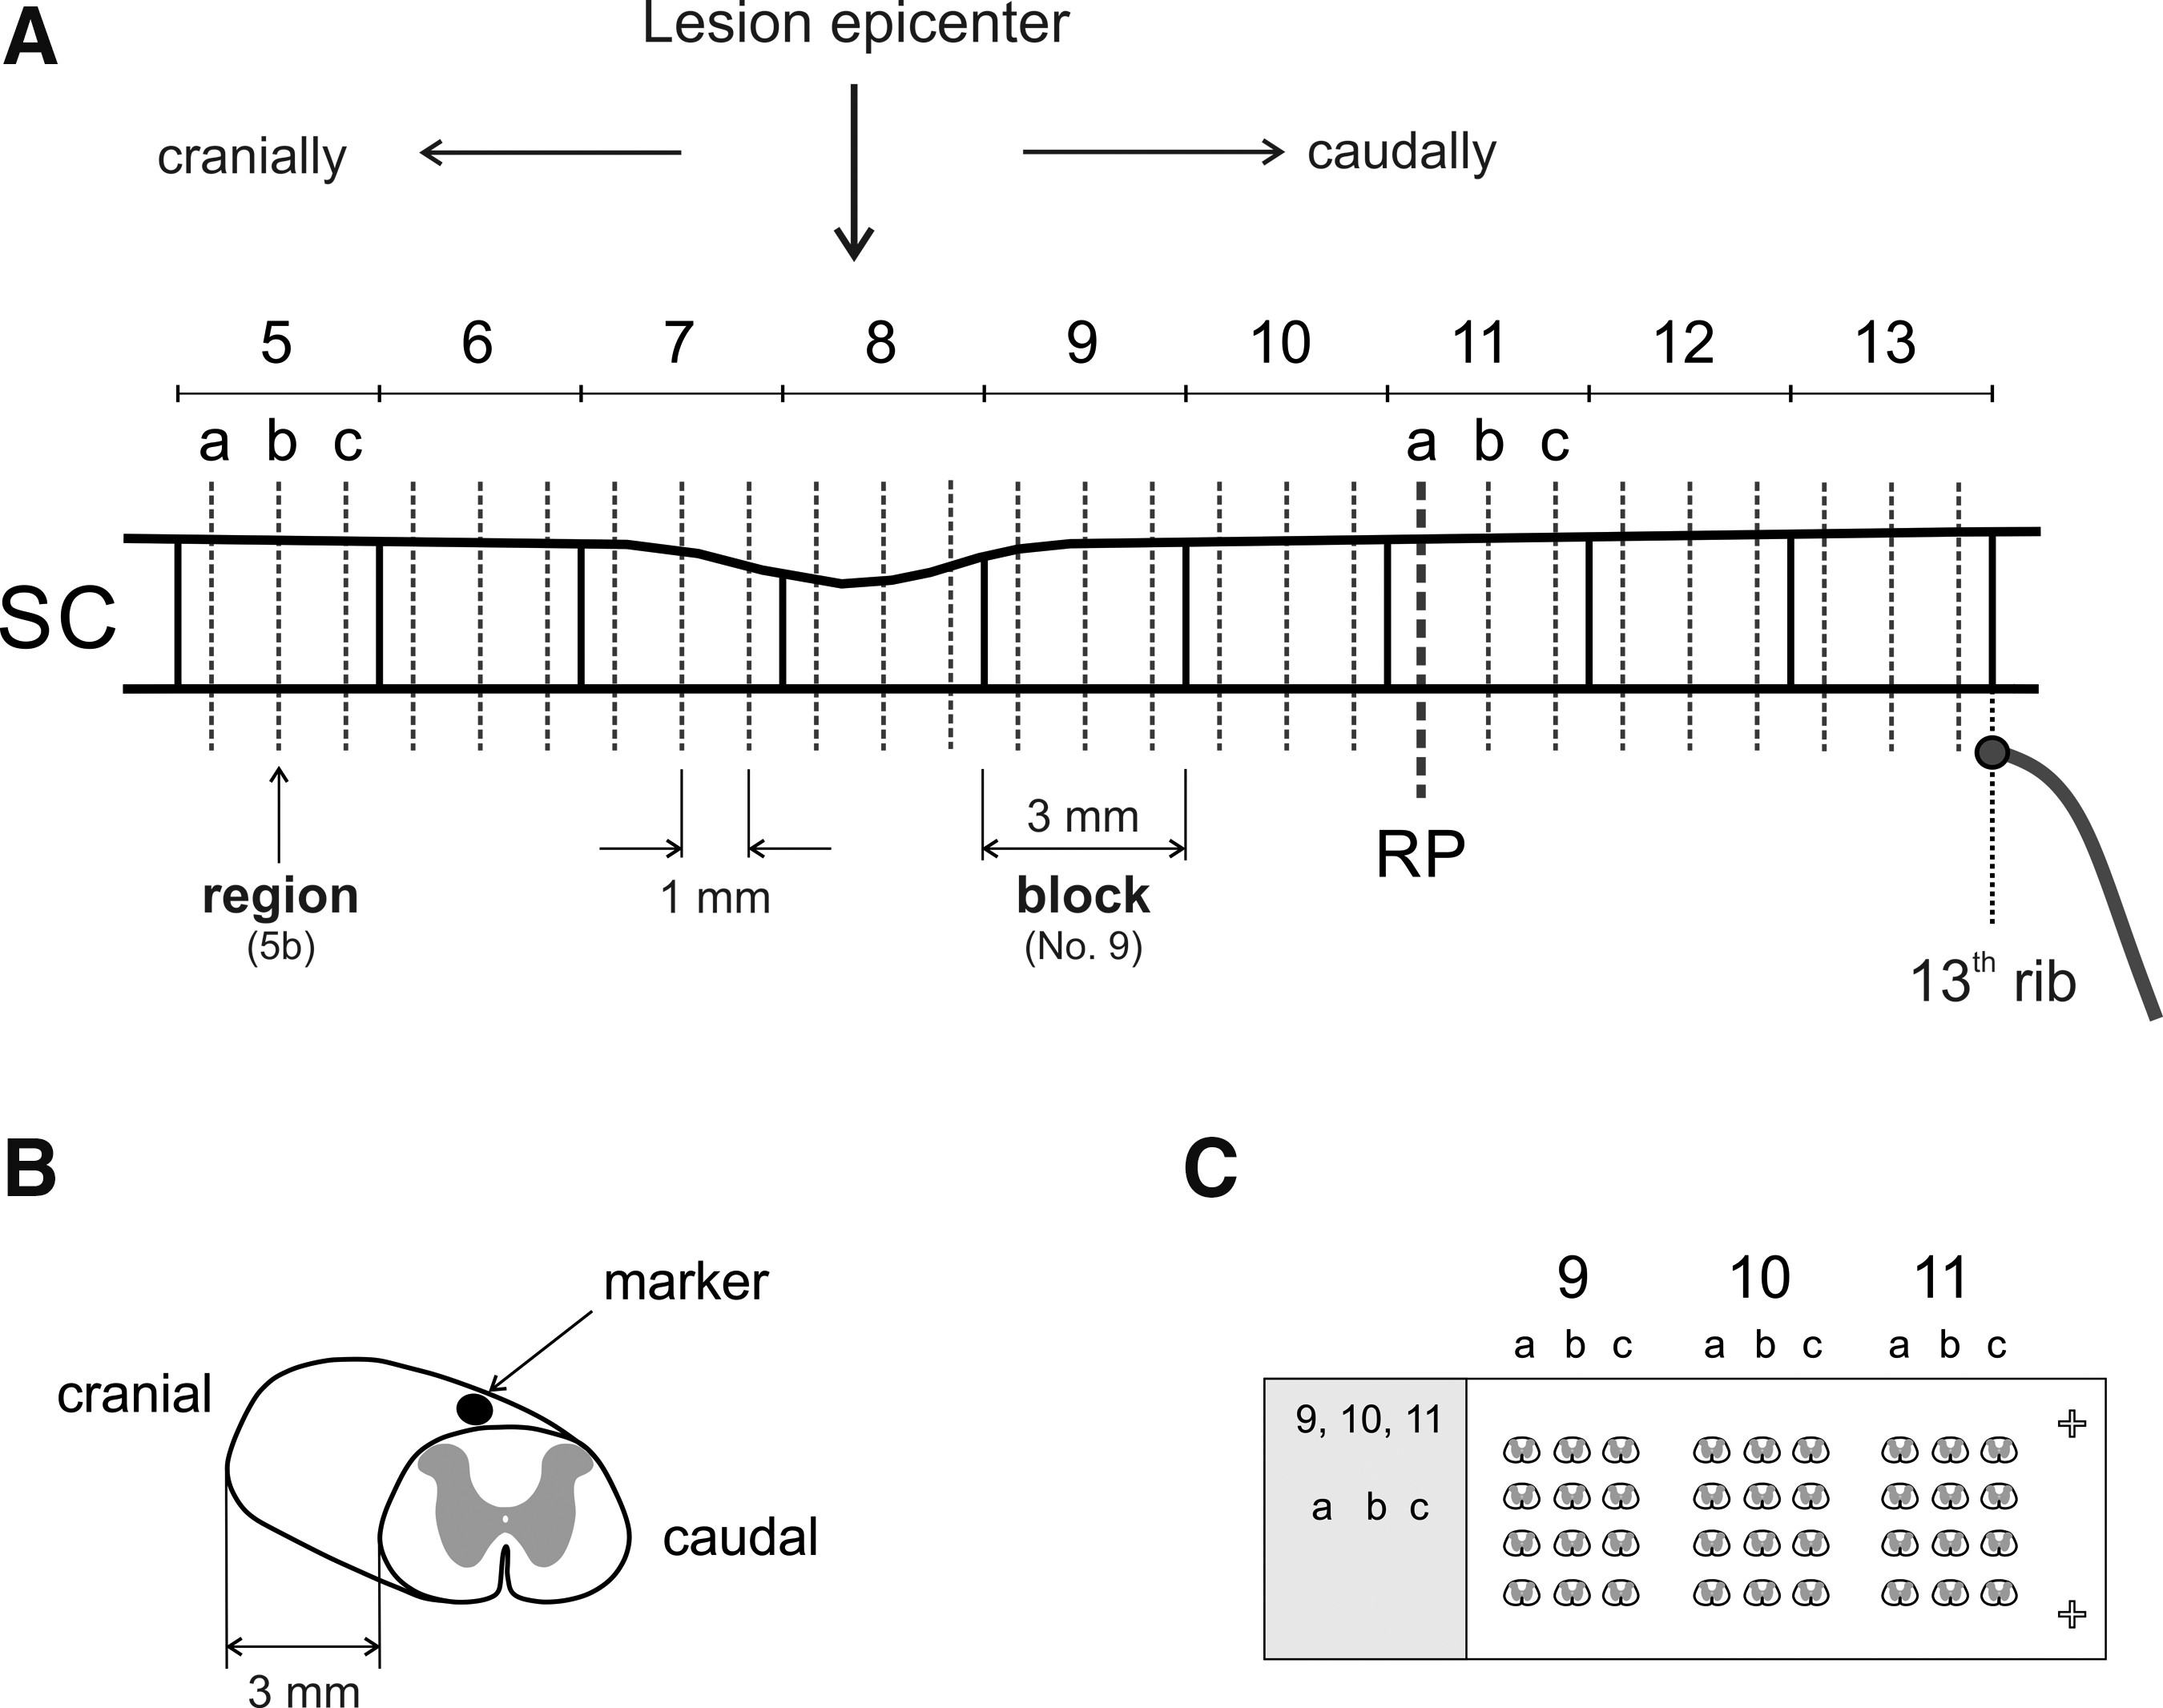
Schematic drawing illustrating the pattern for spinal cord sampling
Luxol fast blue and cresyl violet (LFB/CV) staining procedure
The Luxol fast blue staining procedure counterstained with cresyl violet (LFB/CV) was used for staining myelin/myelinated axons and the Nissl substance to assess the spinal cord tissue damage after experimental compression. Briefly, the sections were treated with 0.1 M PBS for 10 min, then with 70% ethanol for 120 min and incubated with 0.1% LFB solution at room temperature (RT) overnight. After washing with distilled water for 3 min, sections were treated with 0.1 M PBS for 40 sec and then distained with 0.05% lithium carbonate solution for 20 sec and 40% ethanol until the contrast between gray and white matter was clearly detected. After another 2 min rinsing in distilled water, the sections were counterstained with 0.2% CV solution for 10 min and again washed for 1 min in distilled water. Subsequently, the sections were dehydrated in 80% ethanol for 1 min, 96% ethanol for 2 min, and absolute ethanol for 3 min, cleared in xylene, and then Entellan mounting medium (Merck KGaA, Darmstadt, Germany) was used to adhere the cover-slips to the microscope slides. Stained sections were captured automatically at 20 × magnification using the Aperio AT2 digital scanner (Leica Biosystems, Wetzlar, Germany) with consistent exposure times. The digital images of the intact or injured spinal cord were analyzed using NIH ImageJ software.
Method for prediction of pre-injury cross-sectional area in damaged spinal cord
The pre-injury area of each transverse spinal cord section from the selected regions along the rat spinal cord was calculated using our modified version of Olby and Blakemore's method.
9
Five fixed intact spinal cords from adult female animals were used and analyzed to establish the pre-injury area of transverse sections extending cranio-caudally from the injury site. Four consecutive sections with 25 μm thickness were cut from each region (at 1 mm intervals), mounted on SuperFrost Plus microslides (Fig. 1C), and later stained with LFB/CV. The outline of the spinal cord section was drawn onto a digitizer pad, and the total cross-sectional area of the cord was determined for all regions using the NIH ImageJ program, for each animal individually. Based on the cranio-caudal extent of the compression injury, region 11a of block 11 was selected as a suitable reference point (RP) for our SCI model. The RP is defined as the cross-sectional area of the spinal cord at a point sufficiently caudal from the lesion site to be unaffected by the compression injury. Its selection and localization depend on the compression force and survival time. The correction factor established for each region was calculated as the ratio of the cross-sectional area at each region along the spinal cord to the area at the RP for each animal individually according to the formula:
The final correction factor based on five animals was expressed as mean ± standard error of the mean (SEM) for each region along the spinal cord.
Induction of spinal cord compression
The rats were put under general anesthesia with 1.0–1.5% isoflurane (Chemical Iberica PV, Salamanca, Spain) via face mask, then the operation area was shaved, cleaned up, and disinfected with Betadine®. The last rib was externally palpated to identify the T13 vertebra. After a dorsal midline skin incision, the spinous processes were counted rostrally from T13 to localize the T9 vertebra. Then the muscles were retracted laterally with blunt dissection to expose the spinous process, and a T9 laminectomy was performed. The animal was slightly elevated and the spinal cord was stabilized and fixed by clamping with forceps in a stereotaxic frame. Body temperature was maintained with a homeothermic heating pad set at 37°C with feedback from a rectal thermometer (ATC1000, World Precision Instruments, Sarasota, FL) during the experimental procedure. The impactor was then slowly lowered onto the exposed T9 spinal segment until its weight fully rested on the spinal cord.
The compression equipment used for the induction of traumatic SCI was similar to that previously used. 14 Our custom-made compression device consisted of a steel rod terminating in a plastic impactor (total weight = 10 g) freely moving in a Teflon™ block and firmly attached to the micromanipulator of a lab standard stereotaxic frame allowing precise positioning. The 30 g, 40 g, and 50 g compressions were performed by additional 10-g weight units fastened to the upper part of the steel rod. The impactor tip contacting the dura was a symmetrical arch-shape rectangle (base dimensions: 2.5 × 2.0 mm, W × L) made from ABS-M30i biocompatible material using an uPrint SE 3D printer (Stratasys, MN). After 15 min of spinal cord compression, the impactor was removed and the wound sutured with sterile silk (USP 4/0; Chirana, Prague, Czech Republic) in anatomical layers.
Post-operatively, the antibiotic Amoksiklav (12.5 mg/kg for 3 days, subcutaneously [SC]; Sandoz GmbH, Kundl, Austria) and the analgesic Novasul (500 mg/kg for 24 h, intramuscularly [IM], later as necessary; Richter Pharma AG, Wels, Austria) were delivered, as well as 5 mL of sterile saline solution injected SC to prevent dehydration and to account for blood loss during surgery. Standard pellet food was placed at the bottom of each cage after the animals were moved back to the animal facility room. Individually housed animals underwent physical examination and veterinary care once daily or more times as necessary during their 28 days of survival. The bladder was manually emptied daily until the animals regained voiding function. We preferred female rats because manual expression of the bladder is more easily performed due to their shorter and wider urethra.
Evaluation of neurological impairment and urinary bladder function
Hindlimb function was evaluated in an open field periodically during the 28 days of survival according to the Basso, Beattie, and Bresnahan (BBB) scoring scale. 15 The BBB neurological evaluation score ranges from 0 for complete paralysis up to 21 for normal gait. The evaluations were conducted by two experienced researchers who were unaware of the compression force that the rats had received. Bladder response was evaluated at the end of the survival period using a 2-point urinary bladder function score as follows: 0 = loss of function, 1 = physiological function.
Semi-automatic quantification of spared spinal cord tissue and cavities
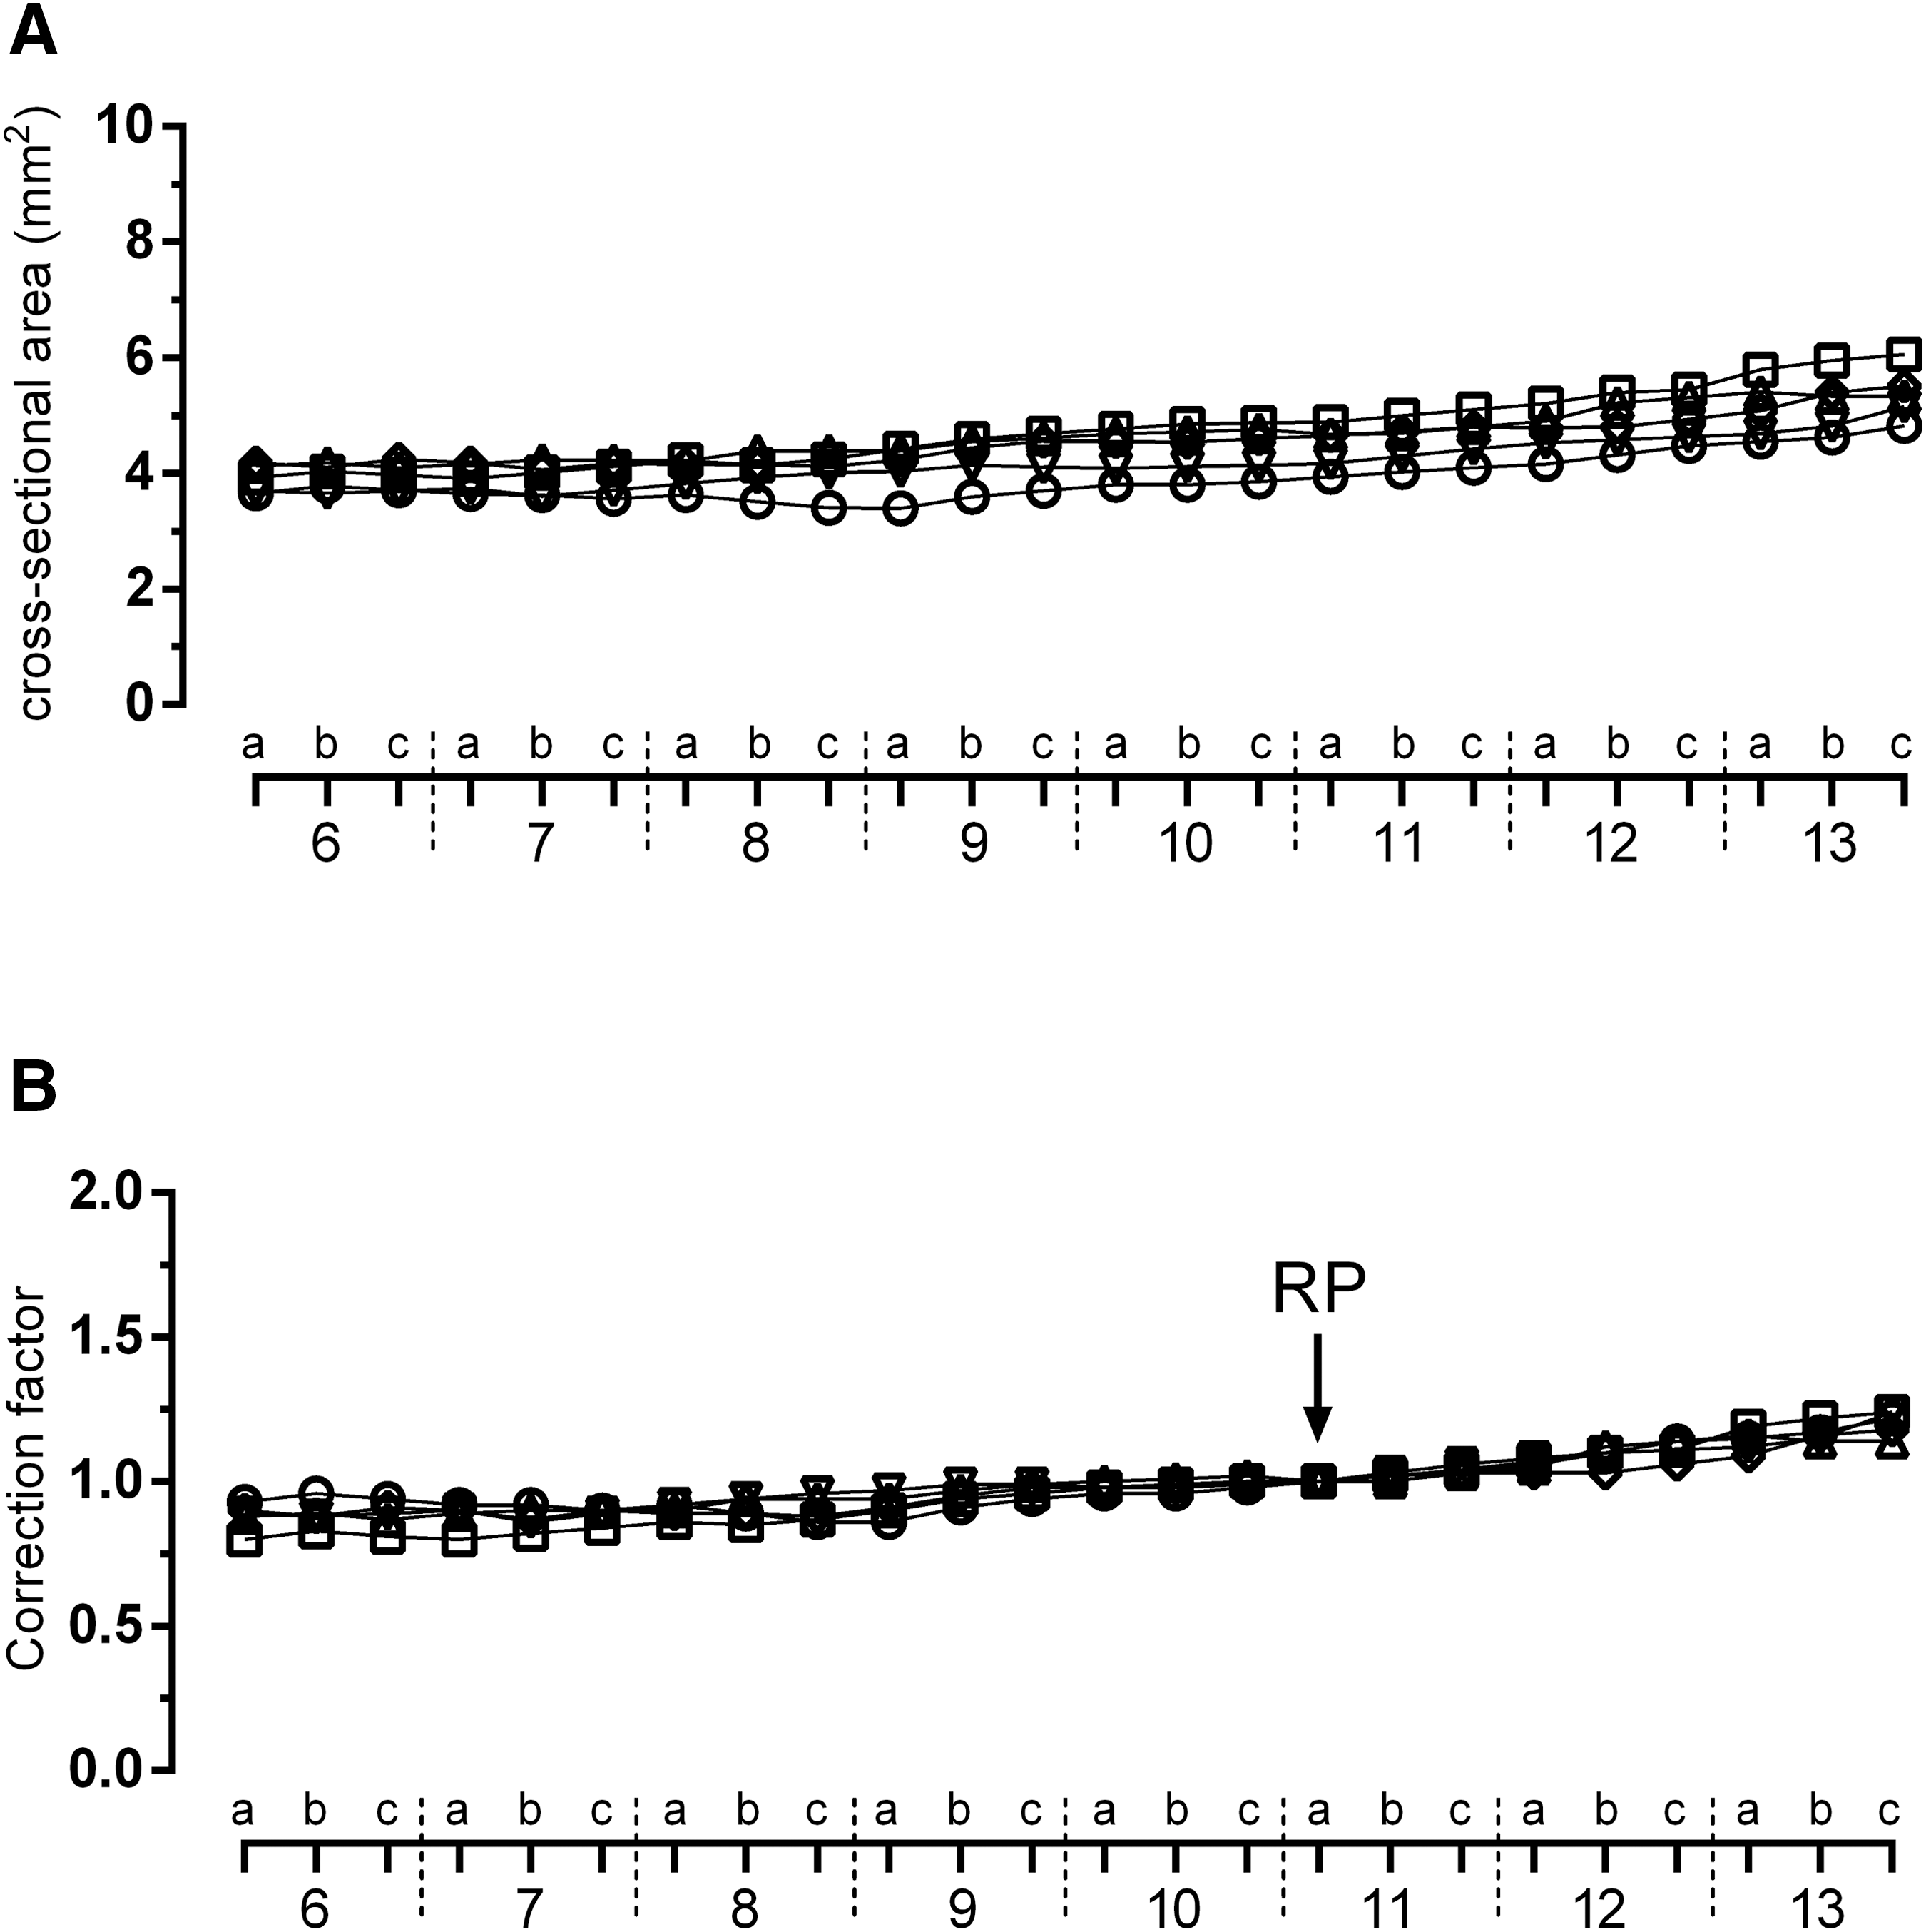
All image processing and analyses were done using NIH ImageJ 1.51 software. Prior to analysis, the spatial scale was calibrated (Analyze>Set Scale) so that the measurement results could be presented in calibrated units as micrometers (μm). Digital red/green/blue (RGB) images of the spinal cord were converted to 8-bit grayscale (Image>Type) with the gray intensity range from 0 to 255. The image histogram shows the gray levels of the objects of interest and the background that are presented as primary and secondary peaks separated by a deep valley. We applied the Huang auto-threshold method (Image>Adjust>Threshold; B&W display mode), which utilizes the measures of fuzziness of an input image to identify the appropriate threshold value. 16 The use of the fuzzy range can help to locate effectively the deep valley of the histogram. This thresholding method satisfactorily separated the stained spinal cord sample from the background using the appropriate threshold value.
After threshold adjustment, the outline of the spinal cord section was drawn either automatically using the Wand tool from the Toolbar menu (which can find the edge of the section) or manually onto a digitizer pad. Area statistics (the area, area fraction expressed as %) and intensity statistics (mean, median, minimum and maximum gray value) were set up (Analyze>Set Measurements) prior to analysis, then measurements were taken based on the existing area selection in the thresholded binary image (Analyze>Measure), and finally the results were automatically recorded and displayed in the Results panel. The predicted cross-sectional area (mm 2 ) for each specific region along the lesioned spinal cord was calculated as:
The amount of spared tissue was reported as a percentage of the total cross-sectional area in the specific region, and calculated using the formula:

To quantify cavities, the thresholded digital image of the spinal cord section with the selected area was inverted (Edit>Invert) and each cavity above 200 μm 2 was automatically numbered and its area quantified and visualized when the Masks option was selected (Analyze>Analyze Particles). The size limit >200 μm 2 was defined according to the quantitative evaluation of control samples. Representative three-dimensional (3D) reconstructions were created from the selected set of sections in required order (Image>Stacks>Image to stack) and the stack visualized as a 3D projection (Image>Stacks >3D projection).
Statistical analysis
All presented data were expressed as mean ± SEM. Ordinary one-way analysis of variance (ANOVA) with multiple comparisons and Fisher's least significant difference (LSD) post hoc analysis were used. The p-value of 0.05 was set as the level of significance. All analyses were performed using GraphPad Prism software, version 6.
Results
Determination of correction factors for estimation of cross-sectional area at the injury site
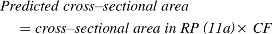
The total cross-sectional area along the spinal cord gradually increases from block 6 to block 13, and the course of each curve was approximately similar for all animals (Fig. 2A). Analysis of histological sections from the compression-injured spinal cords revealed that region 11a was the most suitable RP for calculation of the correction factors along the spinal cord. As mentioned above, the RP was defined as the cross-sectional area of the spinal cord at a point sufficiently caudal from the lesion site to be unaffected by the compression injury. As previously published, 9 a very weak positive correlation was detected between the cross-sectional area of the spinal cord at the RP and the body weight using linear regression (Pearson's coefficient r = 0.195). This means that the size of the spinal cord area at a particular segmental level is not directly dependent on the body weight of the experimental animal. Because the course of the curves indicates an existing relationship between cross-sectional areas of the sequential spinal cord regions, there was very low variability of correction factors in individual regions along the spinal cord from the five control animals, as shown in Figure 2B and summarized in Table 1, where the results are expressed as mean correction factor ± SEM.
Cross-sectional areas of consecutive spinal cord regions at 1 mm intervals ranging from the 6th to 13th rib
Mean Correction Factors for Prediction of the Cross-Sectional Area at the Lesion Site
RP, reference point; SEM, standard error of the mean.
Method for predicting the pre-injury cross-sectional area of damaged spinal cord
An image segmentation technique was used to quantify the spinal cord tissue sparing and post-traumatic syringomyelia. The simplest technique of pixel-based segmentation is based on histogram thresholding. Direct RGB image conversion to binary is very complicated, because every color channel has to be handled separately. For this reason, all digital RGB images were converted to 8-bit grayscale (intensity range 0–255) prior to further image analysis (Fig. 3A,B). Our digital images have a distinct spinal cord section stained with LFB/CV on a contrasting background. In this case, the histogram is bimodal and the applied Huang auto-threshold is placed in the bottom of the deep valley midway between the two peaks (Fig. 3B). This means that the threshold grayscale value found in the valley region optimally separates the stained spinal cord section from the background (Fig. 3D,F). The binary images obtained were then quantitatively analyzed. Commonly used default (Fig. 3C,E) and other auto-threshold methods (not shown) available in the NIH ImageJ program did not effectively separate the stained sections from the background.
Comparison of the commonly used default and Huang's auto-threshold method for an intact spinal cord section.
To validate the suitability of our approach, the Huang auto-threshold was applied to digital images from three differently damaged spinal cord regions: intact, injured, and lesion epicenter (Fig. 4A). The selected area of the spinal cord section expressed in mm 2 , and the area fraction expressed as the percentage of pixels in the selection highlighted in black were measured (Fig. 4B). For illustration, the percentage of spared neural tissue in the section from the intact spinal cord is 99.3%, in the injured region close to the epicenter it is 91.5%, and it drops to 52.0% at the lesion epicenter (Table 2). After inversion of the thresholded digital image, all existing cystic cavities were highlighted (Fig. 4C), but only those over 200 μm 2 were measured (Fig. 4D). Cystic cavities make up 46.3% of the total cross-sectional area at the lesion epicenter, 5.2% in the injured region, and 0.2% in the intact sample (Table 2). However, the recorded value in the intact sample in fact represents mainly the contribution of the central canal and small tissue fissures.
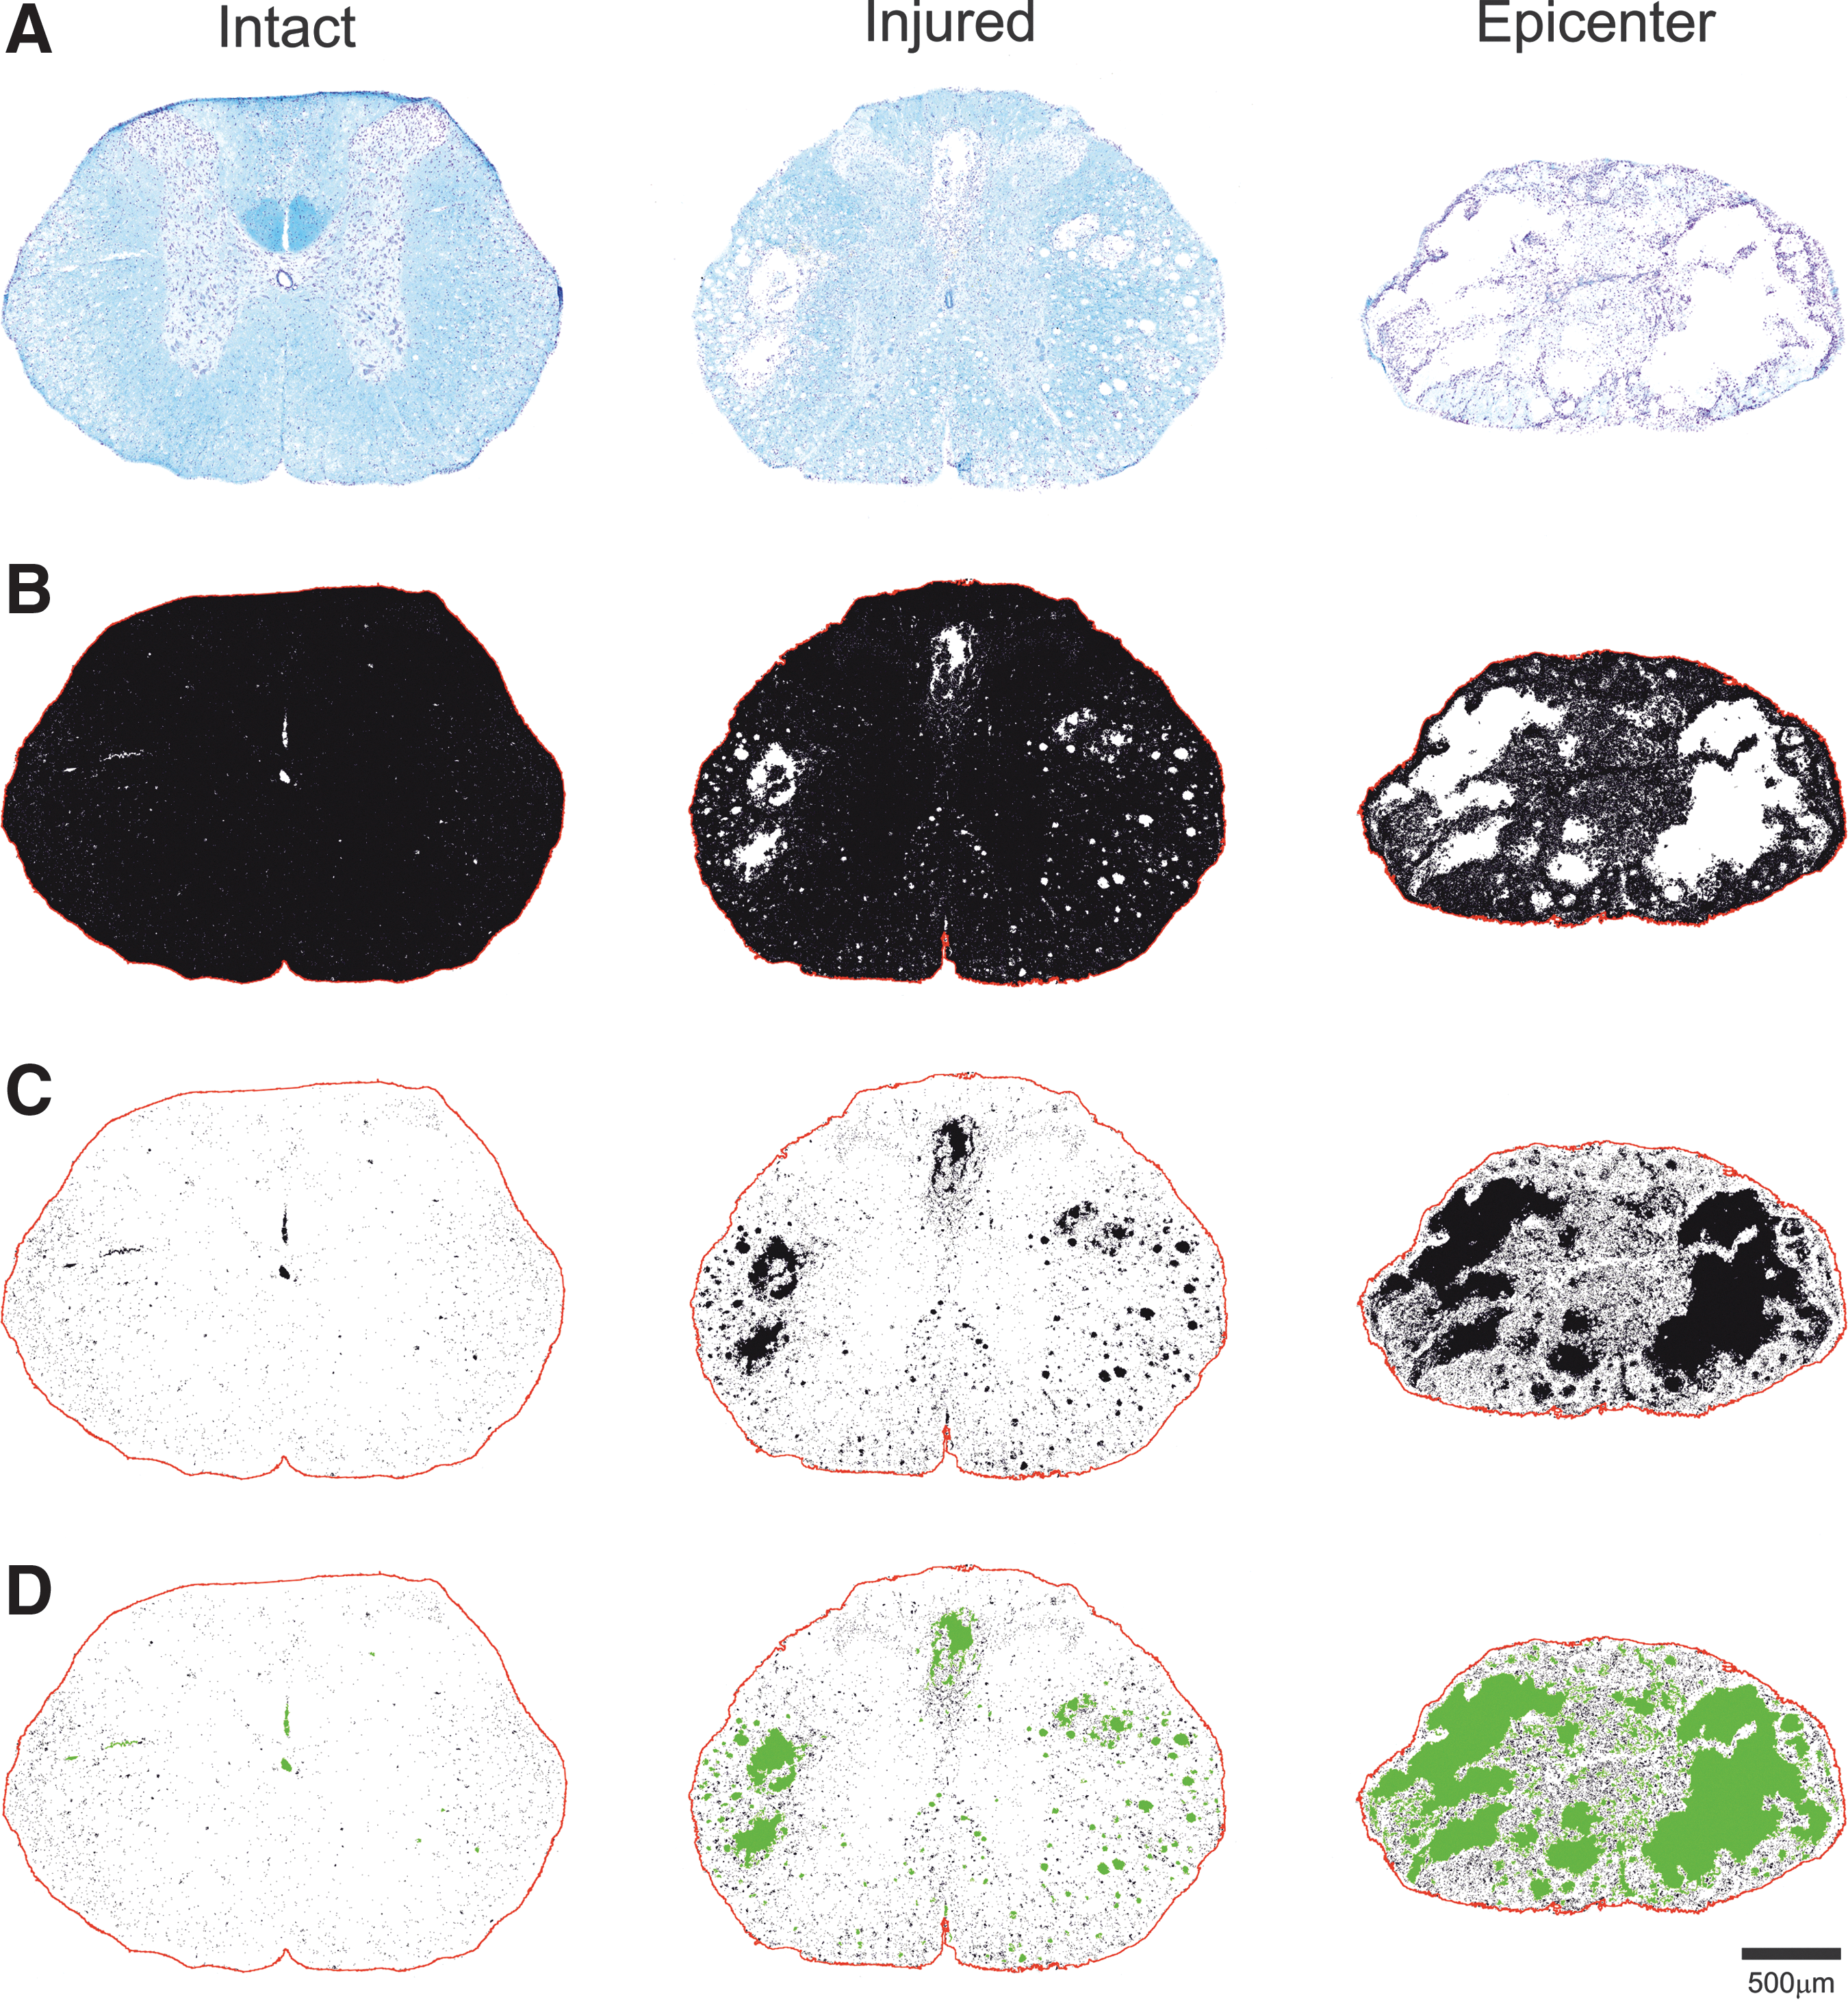
Representative images of cross-sections of intact and injured spinal cord, as well as the lesion epicenter, suggesting quantitative evaluation of neural tissue sparing and presence of cavities.
Parameters Measured in the Representative Section from Intact and Injured Spinal Cord, as Well as the Lesion Epicenter
Characterization of histopathological changes and functional outcomes with increasing compression force
The histological analysis of compression injury was done on spinal cord sections stained with LFB for myelin and CV for Nissl substance. Three-dimensional representative reconstruction of the lesion site 28 days after compression-induced injury clearly demonstrated that the cross-sectional area of the spinal cord increased in both cranio-caudal directions away from the lesion epicenter, and the extent of neural tissue loss was compression force dependent (Fig. 5A–C). No marked changes were detected after quantitative analyses of the lesioned spinal cord samples without the application of predicted values of cross-sectional area at the lesion site into the final calculations. This means that after 30 g compression, without application of correction factors it appeared that at the lesion epicenter 84.5% of neural tissue was spared, and 80.1% and 78.4% after 40 g and 50 g impact, respectively. However, the histological analyses of the variously injured spinal cords revealed that approximately 44% of spinal cord tissue was spared at the lesion epicenter after 30 g compression when the prediction of cross-sectional area at the lesion site was applied in the calculations (Fig. 5A).
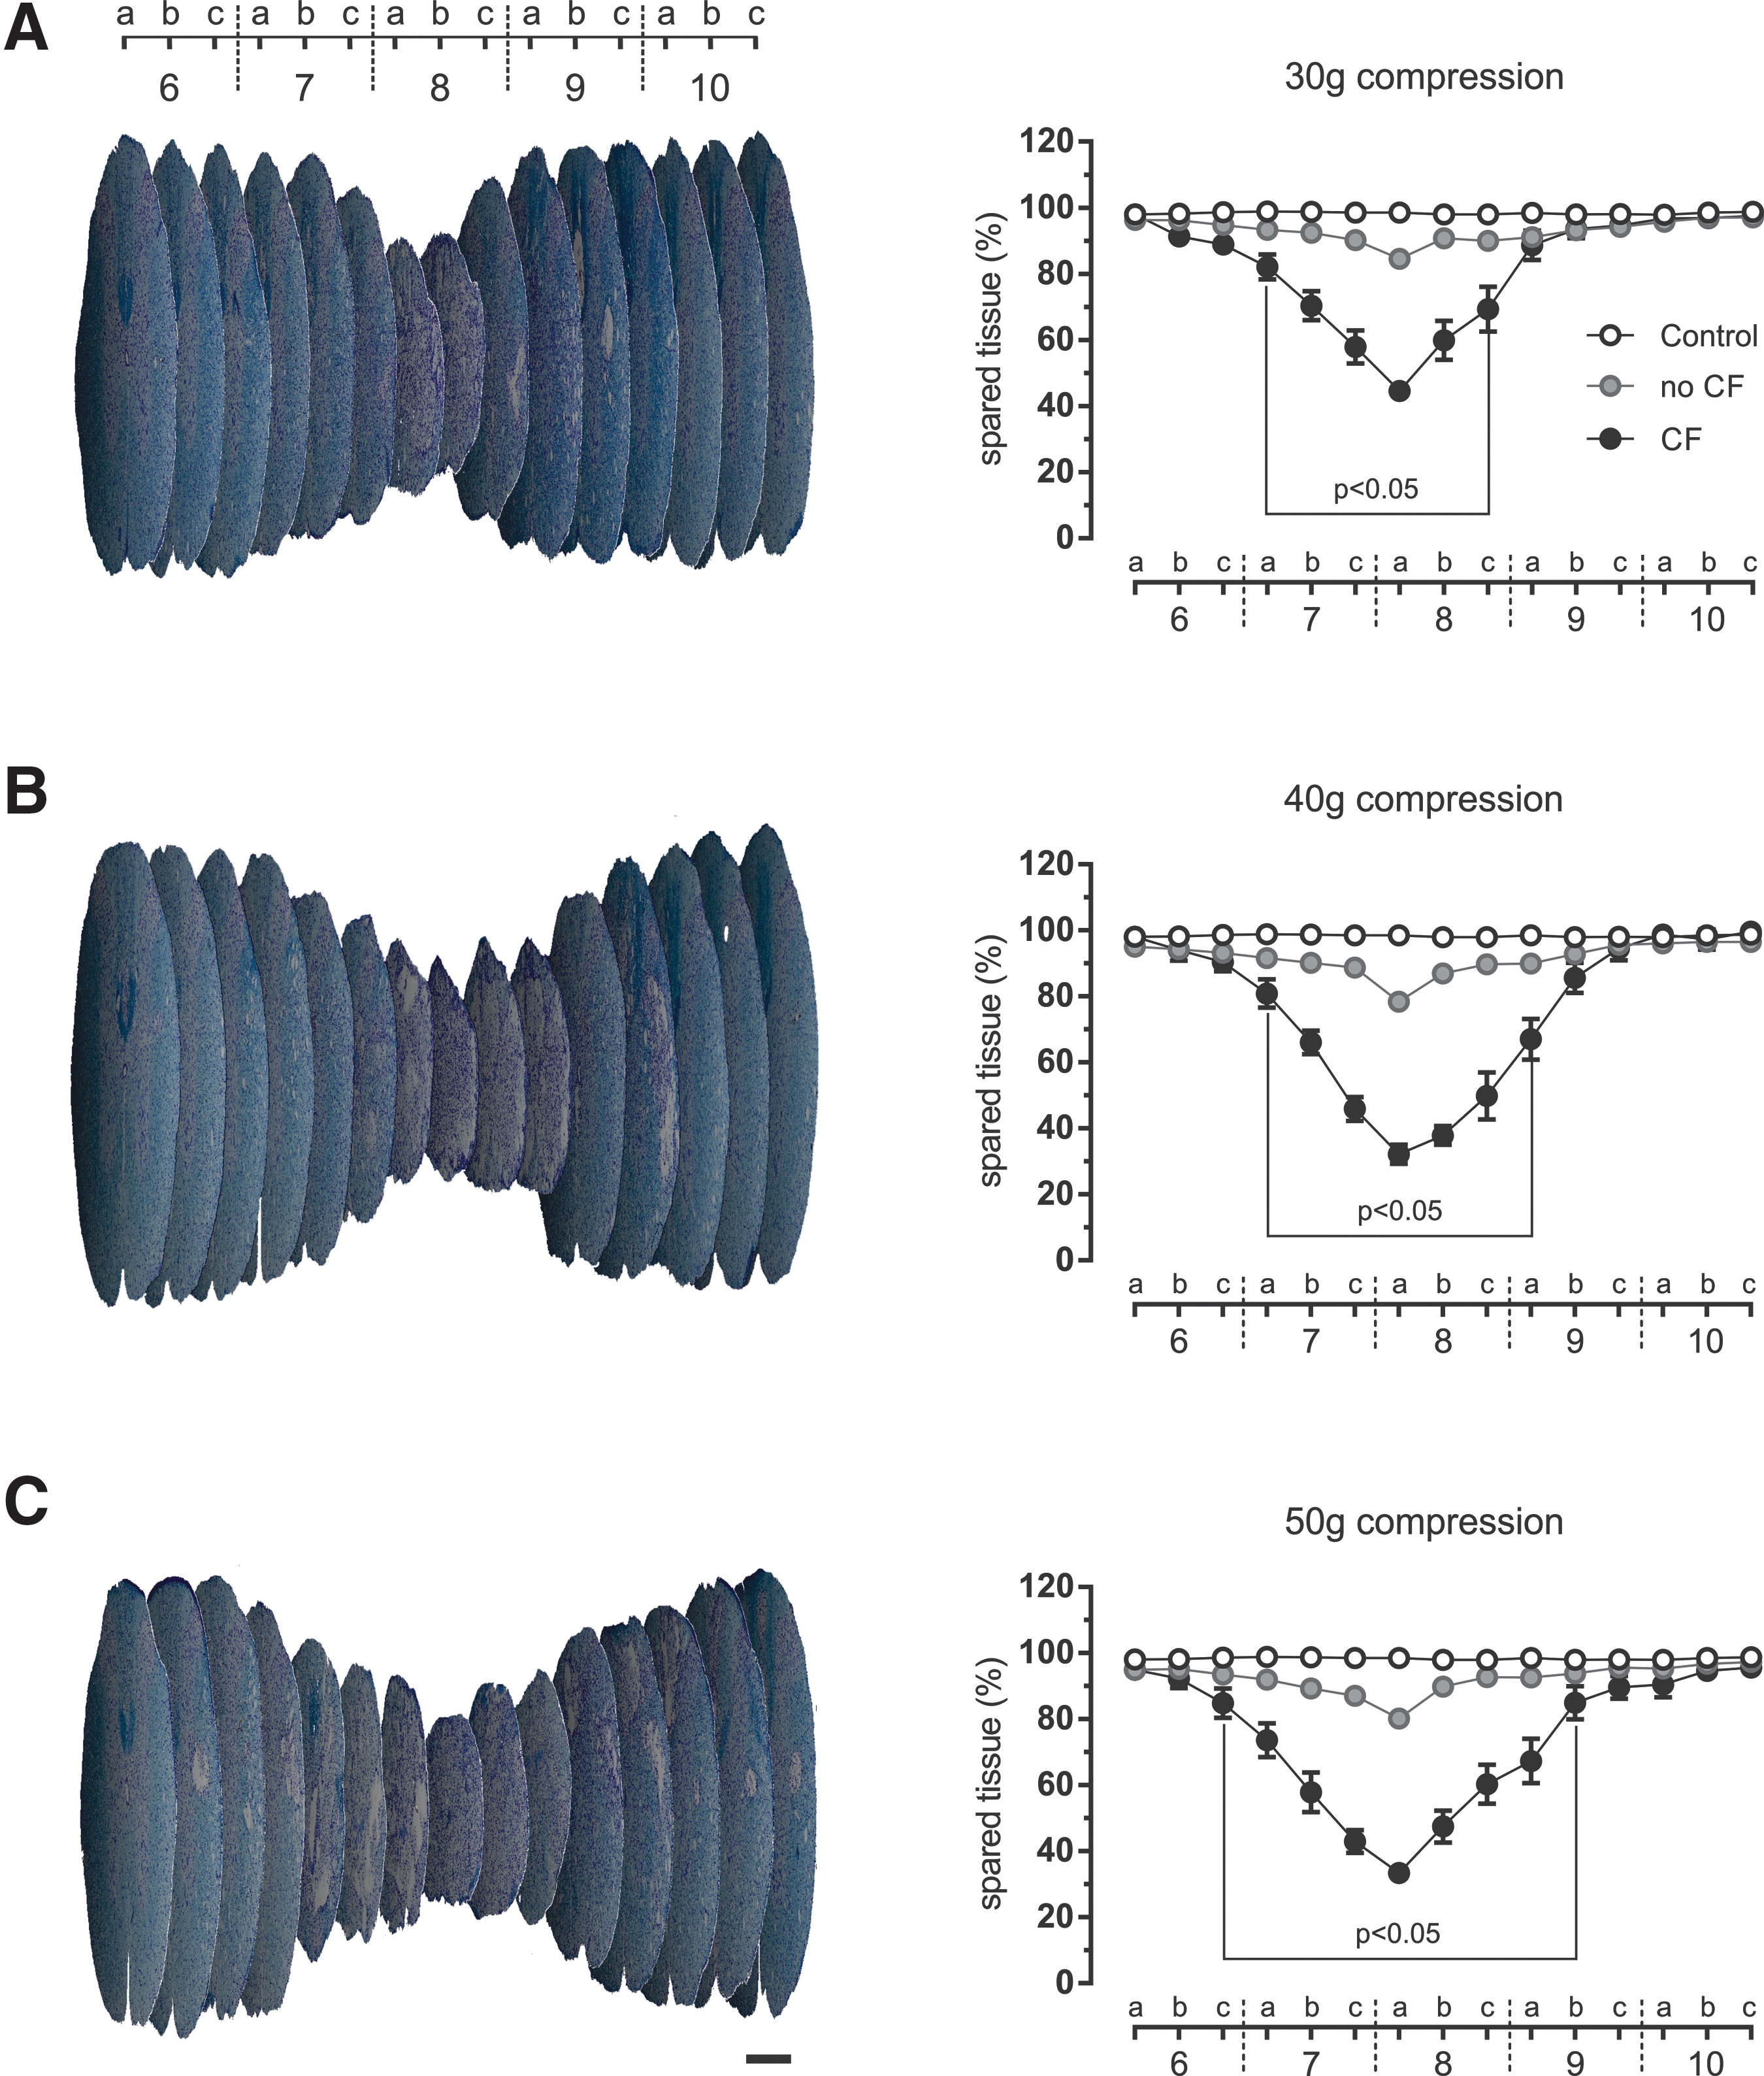
Three-dimensional reconstruction demonstrating development of secondary tissue damage following 30 g
The spinal cord injury after 40 g and 50 g compression was more profound. There was 33% spared tissue after 40 g compression at the epicenter (Fig. 5B). Subsequent raising of the compression force to 50 g did not induce further tissue damage at the lesion epicenter (32% spared tissue) (Fig. 5C). In addition, maximum cranio-caudal lesion extensions of 10, 11, and 13 mm were observed after 30 g, 40 g, and 50 g compression respectively (Table 3). However, statistically significant spinal cord tissue damage extended 5 mm (30 g compression), 6 mm (40 g compression), and 8 mm (50 g compression), when compared with the control values. The total amount of damaged tissue established by measurement of the area under the control and experimental curves was expressed in arbitrary units as follows: 65.570 (30 g compression), 90.686 (40 g compression), and 98.642 (50 g compression), which corresponds to an increase of 38.3% between 30 g and 40 g compression, and 8.8% between 40 g and 50 g compression (Table 3).
Summary of Measured Parameters Characterizing the SCI after Graded Compression Force on Day 28
p < 0.05 vs. control, b p < 0.05 vs. 30 g compression.
BBB, Basso, Beattie, and Bresnahan; SCI, spinal cord injury.
These findings corresponded very well with the changes in locomotor activity evaluated at the end of the survival period. Complete bilateral paraplegia was observed immediately after compression injury in all experimental groups, then the animals demonstrated different levels of progressive recovery during the 28-day post-injury period. The mean BBB score after 30 g compression was 10.4 points (Table 3). However, the impairment of locomotor activity after 40 g and 50 g compression was more marked and quite similar (8.8 vs. 8.1 points), which corresponded with the comparable tissue damage at the lesion epicenter. There was a strong positive correlation between the spared tissue at the lesion epicenter and the BBB locomotor rating scale score (Pearson's coefficient r = 0.621). The function of the autonomic nervous system was checked through bladder control. The sham-operated experimental rats demonstrated bladder control, whereas in all injured animals manual bladder emptying was necessary. All experimental animals (11 per group) with 30 g and 40 g compression-induced SCI after 28 days regained bladder function (mean value 1.00) (Table 3). However, the bladder dysfunction still persisted in three animals after 50 g compression.
The spinal cord lesions after compression were characterized by areas of cyst formation as well as cavitation. There were multi-loculated, predominantly extracanalicular cavities and microcysts in the histological sections. The maximum total area occupied by cavities and microcysts was observed in the proximal and distal regions in close proximity to the lesion epicenter (Fig. 6).
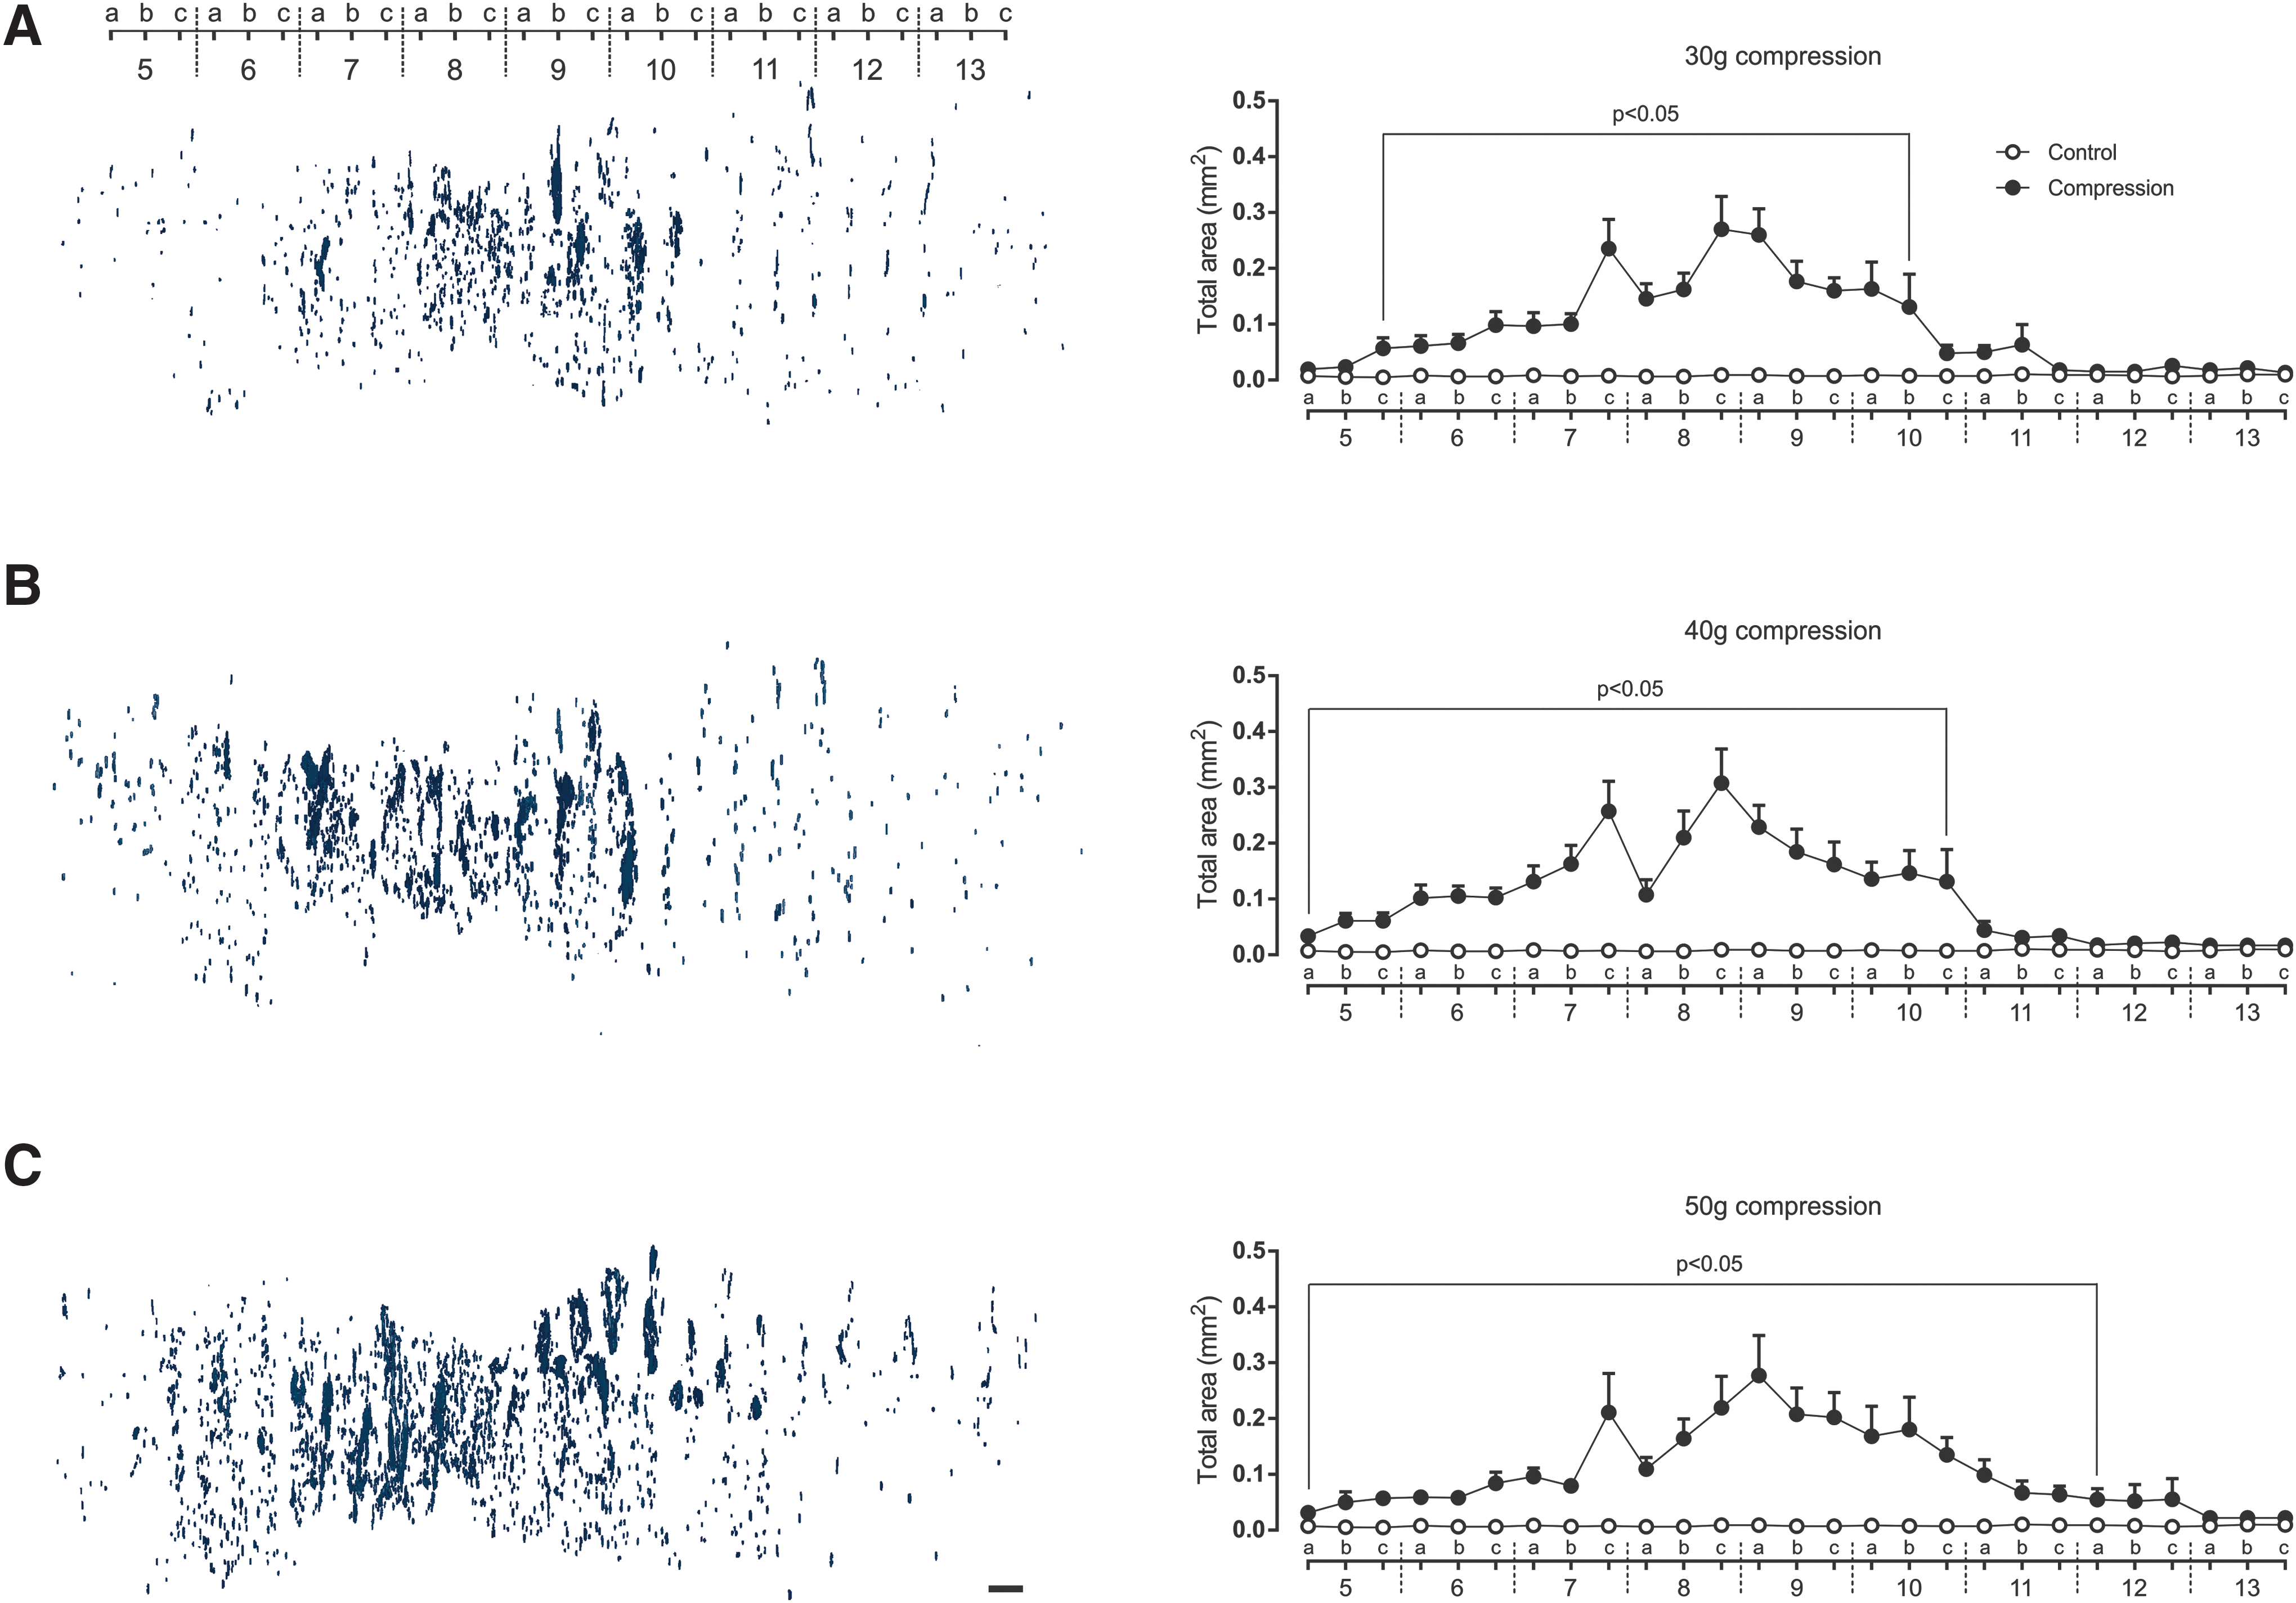
Three-dimensional reconstruction of cavities over 200 μm
2
in cranio-caudal extent from lesion site on post-injury day 28 after 30 g, 40 g, and 50 g spinal cord compression (
Measurement of total cavity area revealed a progression of the post-traumatic cavities from the lesion epicenter in the course of the 4 weeks, predominantly in a caudal direction (Fig. 6). Similar to the progress of lesion extension, the overall extent of the cavity formation was compression force dependent.
Discussion
The preservation of as much functional tissue as possible is a critical requirement for the success of either spontaneous or therapeutically affected neurological recovery after SCI. A major goal of traumatic SCI research is to develop effective therapeutic interventions that can halt or at least reduce secondary injury to prevent disability of the affected person. Minimizing the lesion extent makes the injured spinal cord more responsive to therapeutic interventions and more successful subsequent rehabilitation. The pathological processes of primary, but predominantly of secondary injury induce progressive post-traumatic destruction of the spinal cord resulting in tissue loss whose severity is force- and time-dependent. The most important histopathological changes contributing to spinal cord shrinkage include: (a) axonal and neuronal necrosis, especially at the lesion epicenter previously occupied by hemorrhage; (b) edema that develops at the injury site and spreads into adjacent segments; (c) demyelination followed by cyst formation and infarction. 17
The precise and reproducible evaluation of lesion extent correlating with injury severity is a critical factor for determining the effectiveness of the applied therapeutic intervention. Under-estimation of tissue loss due to spinal cord shrinkage is one of the substantial factors negatively affecting the final results. There is significant under-estimation of the cross-sectional area at the lesion site when it is calculated from direct measurement. Knowledge of the pre-injury cross-sectional area of the spinal cord is therefore required for the accurate determination of tissue loss/sparing. To overcome the problem, a method for prediction of the pre-injury cross-sectional area based on establishing correction factors for defined regions along the spinal cord was devised by Olby and Blakemore 9 in an experimental model of photochemically induced SCI.
Prediction of the original cross-sectional area of the damaged spinal cord based on measurements of the cords from intact animals of similar age and weight is an inaccurate method of predicting the pre-injury area. 9 A very weak positive correlation between the cross-sectional area of the intact spinal cord at the RP and the animal's body weight using linear regression confirmed the findings indicating that the size of the rat's spinal cord in a particular region is variable and ultimately independent of body weight. However, Olby and Blakemore 9 showed that accurately predicting the cross-sectional area is possible using correction factors relating the cross-sectional area at the RP to the cross-sectional area in regions along the spinal cord. They selected block 11a as a suitable reference point, located approximately 4–5 mm in cranial direction from the lesion center at the 12th thoracic vertebra.
The RP is defined as the total cross-sectional area of the spinal cord at a point sufficiently far from the lesion site to be unaffected by compression injury. Because the maximum cranio-caudal extension of the lesion (the lesion epicenter approximately in the 8a region) was within the range of the 6a to 10c regions, our RP could be either the 5c or 11a region. For our set of experiments with T9 compression, we selected the region 11a as the most suitable RP, located caudally from the lesion epicenter, because: (1) there was more pronounced cranio-caudal extension of the lesion after mechanically induced (distance from the lesion epicenter approximately 9 mm) than photochemically induced spinal cord trauma; and (2) the excision of block 11 is more precise because it is closer to the landmark 13th rib, resulting in lower variability of the correction factors at the lesion site. As shown in Figure 2B, due to the relatively similar development of the total cross-sectional area along spinal cord, the variability of correction factors for each spinal cord region was quite small. Thus the prediction of cross-sectional area at the lesion center using correction factors for regions at 1 mm intervals along the damaged spinal cord after compression-induced trauma (based on a reference point in the 11a region) is relatively precise.
Another important factor that substantially contributes to misrepresentation of the final results is subjective selection of tissue sparing/loss. Precise manual identification of either spared or lost neural tissue after SCI, especially at the lesion site, is practically impossible. The main complication is the presence of a wide range of cysts and cavities within the spinal cord that may be erroneously considered as spared neural tissue, as can be seen in Figure 4. Moreover, it is very difficult to determine accurately the exact boundary between damaged and non-damaged areas in any section with various staining intensity, as published by other researchers. 6,7
The SCI research in recent years has resulted in many experimentally promising strategies that have subsequently failed in clinical trials. For this reasons, the National Institute of Neurological Disorders and Stroke (NINDS) launched a program in 2003 (renewed in 2008), called Facilities of Research Excellence-Spinal Cord Injury (FORE-SCI) and provided funding via contracts to carry out independent replication of already-published studies reporting experimental interventions that reduce secondary injury, improve recovery, or enhance axon regeneration after SCI. 10 Replication contracts were launched to determine the reproducibility and robustness of experimentally promising therapies already published before eventual clinical testing. Although exact replication is impossible, there was a surprising preponderance of failure to replicate key findings from the original studies. One of the performance objectives was to compare the efficacy of treatment in a standardized environment with minimum variability in outcome evaluation. Subjective evaluation is a very influential factor affecting final results. Our semi-automatic evaluation of spared/lost tissue based on image processing markedly reduces the influence of subjective assessment.
Computer-aided analysis seems indispensable when processing large numbers of digital images. We used the freely accessible, open-source NIH ImageJ 1.51 software for our image processing and subsequent measurements. Our approach to evaluation of tissue sparing requires an efficient image segmentation process partitioning each image into various non-overlapping segments. The thresholding method is the simplest solution for image segmentation, dividing the image pixels with respect to their intensity level. Prior to direct area measurement, LFB/CV-stained sections were automatically scanned on a Leica slide scanner and converted into digital images, represented by sets of pixels. These then underwent a thresholding procedure based on a gray level histogram of each image. The main aim was to find a critical value or threshold that could be applied to the whole image, effectively separating the stained spinal cord section from the background into non-overlapping sets.
Generally, the histogram thresholding method works optimally when the image's gray level histogram is bimodal, which means that it features a deep valley between two peaks, 18 as seen in our case. The automatic threshold method developed by Huang, 16 applied to the whole image, optimally set the threshold in the deep valley and assigned pixels whose gray levels exceeded this critical value to the background and the rest to the stained tissue section. In this way the area of black pixels in the binary image quite reliably represents the area of the spared tissue depending on the severity of the tissue damage, as shown in Figure 4 and Table 2. The accuracy of this measurement approach strictly depends on the quality of the staining procedure. Histological outcomes expressed as percentages of spared tissue after trauma injury compared with the predicted cross-sectional area in a particular region reliably indicate the extent of SCI.
The evaluation of histological outcomes requires sensitive measurements correlating strongly with the severity of the injury and loss of neurological function. To find out whether our new quantitative approach combining the modified method of Olby and Blakemore 9 with semi-automatic measurement of the lesion area satisfactorily reflected actual spinal cord damage, we decided to perform sets of experiments with different compression weights. Extensive (44.5%) tissue sparing and mean BBB locomotor score of 10.4 points were detected at the lesion epicenter after 30 g compression. Moreover, the similar intermediate (33.3 and 32.2%) lesion extents observed after 40 g and 50 g compression corresponded very well with the BBB locomotor scores (8.8 and 8.1 points). Further, we confirmed the expected strong positive correlation between spared neural tissue at the lesion epicenter and neurological motor function outcome, which tends to be highly variable after traumatic SCI. The changes in cranio-caudal extension of damage to the spinal cord, as well as cavities included in the total amount of damaged tissue, were compression force-dependent. Quantification without involvement of the predicted cross-sectional area in the calculation leads to a marked under-estimation of the damage to the spinal cord at the lesion epicenter and in its cranio-caudal extension, as demonstrated in Figure 5.
Post-traumatic syringomyelia is a disabling neurological complication that can occur after spinal cord trauma, involving progressively expanding cystic cavities, which become a barrier to directed axonal regrowth and are a poor substrate for cell migration. 19,20 The mechanisms of their formation and expansion are as yet not well known. Neural tissue loss in our spinal cord compression model was predominantly due to the presence of a large number of cystic cavities of varying sizes. Automatic detection and visualization, then measurement of the area of each of them, can be easily done immediately after measuring the spared tissue using NIH ImageJ software. Our evaluation of the total area occupied by cystic cavities revealed that the maximum or statistically significant cranio-caudal lesion extent was compression force dependent. Interestingly, there was no marked difference in BBB locomotor scale scores between 40 g and 50 g compression, but the extent of cystic cavities in the caudal direction was more considerable with greater compression. Our purpose was not to fully characterize the presence of cystic cavities, but to propose a simple and reproducible way for their detection and quantification.
Based on histological parameters such as the percentage of spared tissue, cranio-caudal lesion extent, total amount of damaged tissue, and in correlation with neurological outcomes, we can conclude that our quantification method combining the modified method of Olby and Blakemore 9 with semi-automatic measurement of spared tissue using the NIH ImageJ program, is relatively accurate and highly reproducible. This quantification is relatively fast and independent of subjective evaluation, and provides optimal reproducibility. Standard spinal cord withdrawal, careful tissue sampling, and high-quality staining are indispensable requirements. A big advantage is that the NIH ImageJ software is a freely accessible Java-based image processing program. The optimal reproducibility of our new quantification approach gives us increased confidence in the presented findings. It is very probable that this combined method can also be used for quantitative neural tissue evaluation in other trauma-induced SCI models in rat.
Footnotes
Acknowledgments
The authors thank Zuzana Barkacs for her excellent technical assistance. This study was supported by VEGA Grant no. 2/0160/16 from the Slovak Academy of Sciences, and the project Formation and Development of a Diagnostic Procedure in the Treatment of Trauma-injured Spinal Cord (ITMS 26220220202) supported by the Research and Development Operational Program funded by the European Regional Development Fund (ERDF).
Author Disclosure Statement
No competing financial interests exist.