
Abstract
We evaluated the hypothesis that nutritive needs of injured brains are supported by large and coordinated increases in lactate shuttling throughout the body. To that end, we used dual isotope tracer ([6,6-2H2]glucose, i.e., D2-glucose, and [3-13C]lactate) techniques involving central venous tracer infusion along with cerebral (arterial [art] and jugular bulb [JB]) blood sampling. Patients with traumatic brain injury (TBI) who had nonpenetrating head injuries (n=12, all male) were entered into the study after consent of patients' legal representatives. Written and informed consent was obtained from healthy controls (n=6, including one female). As in previous investigations, the cerebral metabolic rate (CMR) for glucose was suppressed after TBI. Near normal arterial glucose and lactate levels in patients studied 5.7±2.2 days (range of days 2–10) post-injury, however, belied a 71% increase in systemic lactate production, compared with control, that was largely cleared by greater (hepatic+renal) glucose production. After TBI, gluconeogenesis from lactate clearance accounted for 67.1% of glucose rate of appearance (Ra), which was compared with 15.2% in healthy controls. We conclude that elevations in blood glucose concentration after TBI result from a massive mobilization of lactate from corporeal glycogen reserves. This previously unrecognized mobilization of lactate subserves hepatic and renal gluconeogenesis. As such, a lactate shuttle mechanism indirectly makes substrate available for the body and its essential organs, including the brain, after trauma. In addition, when elevations in arterial lactate concentration occur after TBI, lactate shuttling may provide substrate directly to vital organs of the body, including the injured brain.
Introduction
O
At the whole-body level, lactate metabolism is understood to be important for at least three reasons: (1) lactate is a major energy source 4 –8 ; (2) lactate is the major gluconeogenic precursor 9 –12 ; and (3) lactate is a signaling molecule with autocrine-, paracrine- and endocrine-like effects and has been called a “lactormone.” 2,3,13 “Cell-cell” and “intracellular lactate shuttle” concepts describe the roles of lactate in delivery of oxidative and gluconeogenic substrates as well as in cell signaling. 2,3 Examples of the cell-cell lactate shuttles include lactate exchanges between white-glycolytic and red-oxidative fibers within a working muscle bed and between working skeletal muscle and heart, liver, kidneys, and brain. 5,8,10,14 –16 Examples of intracellular lactate shuttles include cytosol-mitochondrial, 17,18 and cytosol-peroxisome exchanges. 19
Subsequent to and coincident with findings of high rates of lactate flux, oxidation, and gluconeogenesis (GNG) in healthy rodents 20,21 and humans during rest and submaximal exercise 6,10 were observations that lactate traverses membrane barriers by facilitated, carrier-mediated lactate anion and proton exchange 22 –24 involving a family of lactate/pyruvate monocarboxylate transport (MCT) proteins. 25 –27 MCT protein isoform expression patterns vary with muscle fiber type 28,29 and are expressed in tissues and cellular organelles that rapidly exchange lactate, including the brain. 19,30,31 Further, cerebral MCT expression is rapidly increased after neurotrauma in rats. 32
The roles of lactate as a metabolic substrate and critical signaling molecule continue to gain support with ongoing research. 33,34 As in the intact functioning humans 35,36 and in working human skeletal muscles of those persons 4,8 and in the heart, 14 –16 lactate is preferred over glucose as a fuel in brain preparations. 37 –39 The astrocyte-neuron lactate shuttle posits that lactate is extruded by astrocytes and then actively consumed and oxidized by neurons involved in glutamatergic signaling. 40 Relevant to lactate shuttling in the brain, neurons possess the cellular components necessary for glucose uptake and use by an intracellular lactate shuttle, 30 and a post-trauma neuroprotective role of lactate has been proposed. 41,42 Acutely, TBI results in cerebral hyperglycolysis, 43 which is followed by suppressed cerebral glucose uptake (cerebral metabolic rate glucose [CMRglc]) and oxygen consumption (CMRO2), but increased net lactate uptake (CMRlac) 44 and improved outcomes when cerebral lactate uptake occurred in patients with TBI. Importantly, ongoing research on animal models has been translated to both experimental 45 and clinical studies on humans. 46 –48
At both systemic and cerebral levels, it is clear that glucose-lactate interactions are essential in normal physiology as well as pathophysiology after TBI. Observations of blood metabolite concentrations gave rise to the hypothesis that lactatemia and hyperglycemia are linked via GNG in a precursor-product relationship after TBI, as they are during other conditions. Indeed, we are not alone in positing that there exists a relationship among lactatemia, GNG, and hyperglycemia after TBI. Recently, we experimented with intensive insulin therapy to moderate hyperglycemia after TBI, 49 whereas others have experimented with glucagon 50 or with a combination of glucagon and insulin 51 administration to normalize glycemia and curb glutamate excitoxicity after TBI.
To better understand the relationships among lactatemia, glycemia, and cerebral substrate supply and metabolism in persons with TBI, our studies take the novel approach of using two stable isotope tracers to study the metabolic fates of glucose and lactate in patients with TBI. In this report, we describe a massive mobilization of body carbohydrate stores in the form of lactate to support hepatic and renal GNG, thereby indirectly supplying glucose, supporting the nutrient needs of the injured brain. In a companion report, we describe cerebral glucose-lactate interactions in patients with TBI and normal controls. 52
Methods
Patients with TBI
Methodological details have been reported previously, 49 but are abbreviated here for the convenience of readers. Patients with moderate or severe head injuries, aged 16 and older, were admitted to the University of California, Los Angeles (UCLA) Medical Center within 24 h of injury. Moderate or severe head injury was defined as closed injury with a post-resuscitation Glasgow Coma Scale (GCS) score less than or equal to 13, or deterioration to a GCS less than or equal to 13 within 24 h of admission, and necessitating mechanical ventilation and intracranial pressure (ICP) monitoring. 44 Exclusion criteria included the following: (1) terminal illness, (2) severe neurologic illness, and/or (3) acute complete spinal cord injury. UCLA and the University of California, Berkeley (UCB) Institutional Review Boards approved this protocol, and informed consent was obtained from patients' legal representatives.
Patients were admitted to the intensive care unit (ICU) after initial stabilization or surgical evacuation of an intracranial hematoma and treated in accordance with the 2007 Brain Trauma Foundation and American Association of Neurological Surgeons/Congress of Neurological Surgeons TBI Guidelines. 53 Management goals included maintenance of ICP less than 20 mm Hg and cerebral perfusion pressure (CPP) above 70 mm Hg, in accordance with the guidelines for the management of severe head injury. All patients had arterial and jugular bulb (JB) catheters inserted as soon as possible after admission to allow determination of arteriovenous differences (a-v) for glucose (AVDglu), lactate (AVDlac), and oxygen (AVDO2).
For sampling of venous blood from the brain, the dominant jugular vein was visualized on admission by means of CT scanning. Using standard techniques, a 5F Cordis and a 4F Oxymetric catheter (Baxter Critical Care, Baxter Health Care, Deerfield, IL) were inserted to approximately 15 cm until resistance was encountered. Placement of the catheter was confirmed by lateral skull radiology. The catheter was calibrated in vivo, and repeated calibration was performed every 12 h. Light intensity and oxygen saturation were continuously displayed on the monitor.
For patient care, arterial and venous samples were scheduled every 24 h during post-injury days 0 to 5, 7, and 9; 133xenon-measured cerebral blood flow (CBF) was scheduled for every 12 h for the first 48 h after injury (post-injury days 0 and 1), then daily on post-injury days 2, 3, 4, 5, 7, and 9. In this study, to assess the relationship of early brain metabolism to long-term outcome, only metabolic data obtained from post-injury days 0 to 5 were used, given that many patients did not have complete data on post-injury days 7 and 9. Because of the patients' clinical status, such as severely elevated ICP (ICP>30 mm Hg), hemodynamic or respiratory instability, or removal of the jugular catheter or extubation after clinical improvement, it was not possible for all scheduled studies to be completed on all patients.
For the conduct of isotope tracer studies, stable, nonradioactive D2-glucose and [3-13C]lactate isotope tracers were infused (vide infra), 6±2 days (range of days 2–10) after admission to the ICU when informed consent had been obtained. All glucose-containing intravenous tube feeds were discontinued before isotope infusion. All enteral feeding was either Osmolite 1.2 or 1.5 (Abbott, Columbus, OH) and was continued during the isotope infusion. Determination of the rate of caloric delivery was at the discretion of the attending physician.
Healthy control subjects
Six healthy, nonsmoking, weight-stable volunteers (28.25±8.22 years) were recruited from the UCLA campus and the surrounding community by posted notices and Internet advertisements. Subjects were admitted into the study if they met the following criteria: (1) were diet and weight stable for >6 months; (2) were not taking medications; (3) had normal lung function (forced expiratory volume in 1 sec of 70% or more); and (4) were disease and injury free as determined by a health history questionnaire and physical examination. Control subjects received local anesthetics for catheter placements and experimental procedures. Details for this technique were described previously. 44 Briefly, through use of a femoral vein approach, a JB catheter was inserted under fluoroscopic guidance into proper position in the JB. A radial arterial line was also placed. Again, Institutional Ethical Review Boards approved the protocol, and subjects provided written informed consent. Diet records were not recorded in the control group.
Experimental protocol control subjects reported to the laboratory, and patients were studied as described above. Before tracer infusions, a blood sample was collected from the radial artery and JB catheter for measurement of background isotope enrichments of glucose and lactate. Next, subjects received a primed continuous infusion of D2-glucose and [3-13C]lactate while resting semi-supine for 90 min. The priming bolus for glucose was equal to 125 times the resting glucose infusion rate. Subsequently, D2-glucose was infused at 2 mg/min. The priming bolus for lactate was equal to 23 times the resting lactate infusion rate that was at 2.5 mg/min. 4,54 Isotopes were obtained from Cambridge Isotope Laboratories (Woburn, MA), diluted in 0.9% sterile saline, and tested for sterility and pyrogenicity before use (UCLA Pharmaceutical Services). Tracers were administered via an indwelling intravenous catheter placed in the arm.
Arterial and JB blood samples (1–2 mL) were collected simultaneously every 60 min for 3 h after commencement of tracer infusion. Cannulas were flushed with an equivalent amount of 0.9% saline after each collection.
Processing and analysis of blood
Blood samples were immediately transferred to ice-chilled tubes containing 0.6 M of perchloric acid, shaken, and stored on ice until the end of the experiment. Within 1 h of collection, perchloric acid extracts were centrifuged (10 min at 3000 rpm,=2000 G), 4°C), and the supernatants were transferred to separate tubes for storage at −20°C until further analysis. In this investigation, glucose and lactate flux rates are presented in units of mg/kg/min instead of mMol/kg/min to facilitate comparisons between metabolite flux rates.
Blood (lactate) was measured in neutralized perchloric extracts using an enzymatic method in addition to mass spectrometry as described previously 4,36 with (U-13C3)lactate as an internal standard. Blood lactate isotopic enrichment (IE) was determined using gas chromatography/mass spectrometry (GCMS: GC, model 6890 series; MS, model 5973N, Agilent Technologies, Danbury, CT) of the N-propylamide heptafluorobutyrate derivative. 55 Briefly, neutralized perchloric extracts were lyophilized, resuspended in 200 μL of 2,2-dimethoxypropane and 20 μL 10% HCl in methanol, capped, and incubated at room temperature for 60 min. After the addition of 50 μL of N-propylamine, the samples were heated at 100°C for 30 min, dried under a stream of N2, and transferred to GCMS vials using ethyl acetate. Thereafter, the samples were dried under N2, derivatized by adding 20 μL of heptafluorobutyric anhydride (5 min at room temperature), dried again under N2, and resuspended in ethyl acetate for GCMS analysis. Methane was used for chemical ionization with selected ion monitoring for mass to charge ratios (M/Z) of 328 (unlabeled lactate), 329 (tracer labeled lactate), and 331 ([U-13C3]lactate internal standard), respectively.
Blood glucose concentrations and IEs were determined by GCMS of the pentaacetate derivative and (U-13C6)glucose as internal standard. Glucose sample preparation was performed as described previously. 4,56 Methane was used for chemical ionization, and selective ion monitoring was performed for M/Z of 331 (unlabeled glucose), 332 (M+1 glucose), 333 (D2-glucose), and 337 ([U-13C6]glucose internal standard). Selected ion abundances were compared against external standard curves for calculation of both concentration and IE, with normalization to internal standard signal for determination of concentration.
Calculations of whole body metabolism
Whole body substrate (glucose and lactate) rates of appearance (Ra, mg/kg/min) and disappearance (Rd, mg/kg/min) were calculated using the equations of Steele
57
as modified for use with stable isotopes
58
:
where: F is the tracer infusion rate, Ci is the metabolite concentration at time ti, IE is the isotopic enrichment of either D2-glucose or (3-13C)lactate, and V is the volume of distribution for glucose 59 and lactate. 7
The percentage of glucose from GNG was calculated as described previously by Bergman and associates,
4
derived from that of Zilversmit and colleagues
60
as follows:
where: glucose M+1 IE is the isotopic enrichment of 13C-glucose derived from lactate tracer and H is the factor to correct for loss of label in the tricarboxylic acid cycle during GNG and was assumed to be 1.45. 9,10,59,61 –64
Statistical analysis
Data descriptions and testing were conducted in R version 2.15.1. 65 Groups were compared both with the conventional t test and its robust analogue, the Yuen test, 66 because of the presence of nonnormality in the data distributions. 67
Results
Patient status and control subject descriptors
Demographic and anthropometric data on study participants are provided in Table 1.
GCS, Glasgow Coma Scale score.
Glucose
Over the course of measurement, arterial glucose concentration ([glucose]) was constant in controls and in patients with TBI, but there was a nonsignificant trend of higher glucose in TBI than in controls (Fig. 1A). For both populations, JB glucose concentrations were significantly lower than arterial values, reflecting significant cerebral net glucose uptake (i.e., positive CMRgluc). Within 90 min of the commencement of tracer infusion, D2-glucose isotopic enrichments (IEs) were constant in jugular and arterial blood in both control subjects and patients with TBI (arterial values shown, Fig. 2A). Comparing the two populations, there were no significant changes in IEs of simultaneously sampled glucose in arterial and JB blood. While constant over time, median IEs tended to be lower in patients with TBI compared with healthy controls. Because of greater variability in D2-glucose IEs in patients with TBI, however, IEs were not significantly different between groups over time (p>0.05). Hence, the apparent increase in whole-body glucose Ra after TBI was not significantly different (Fig. 3A).
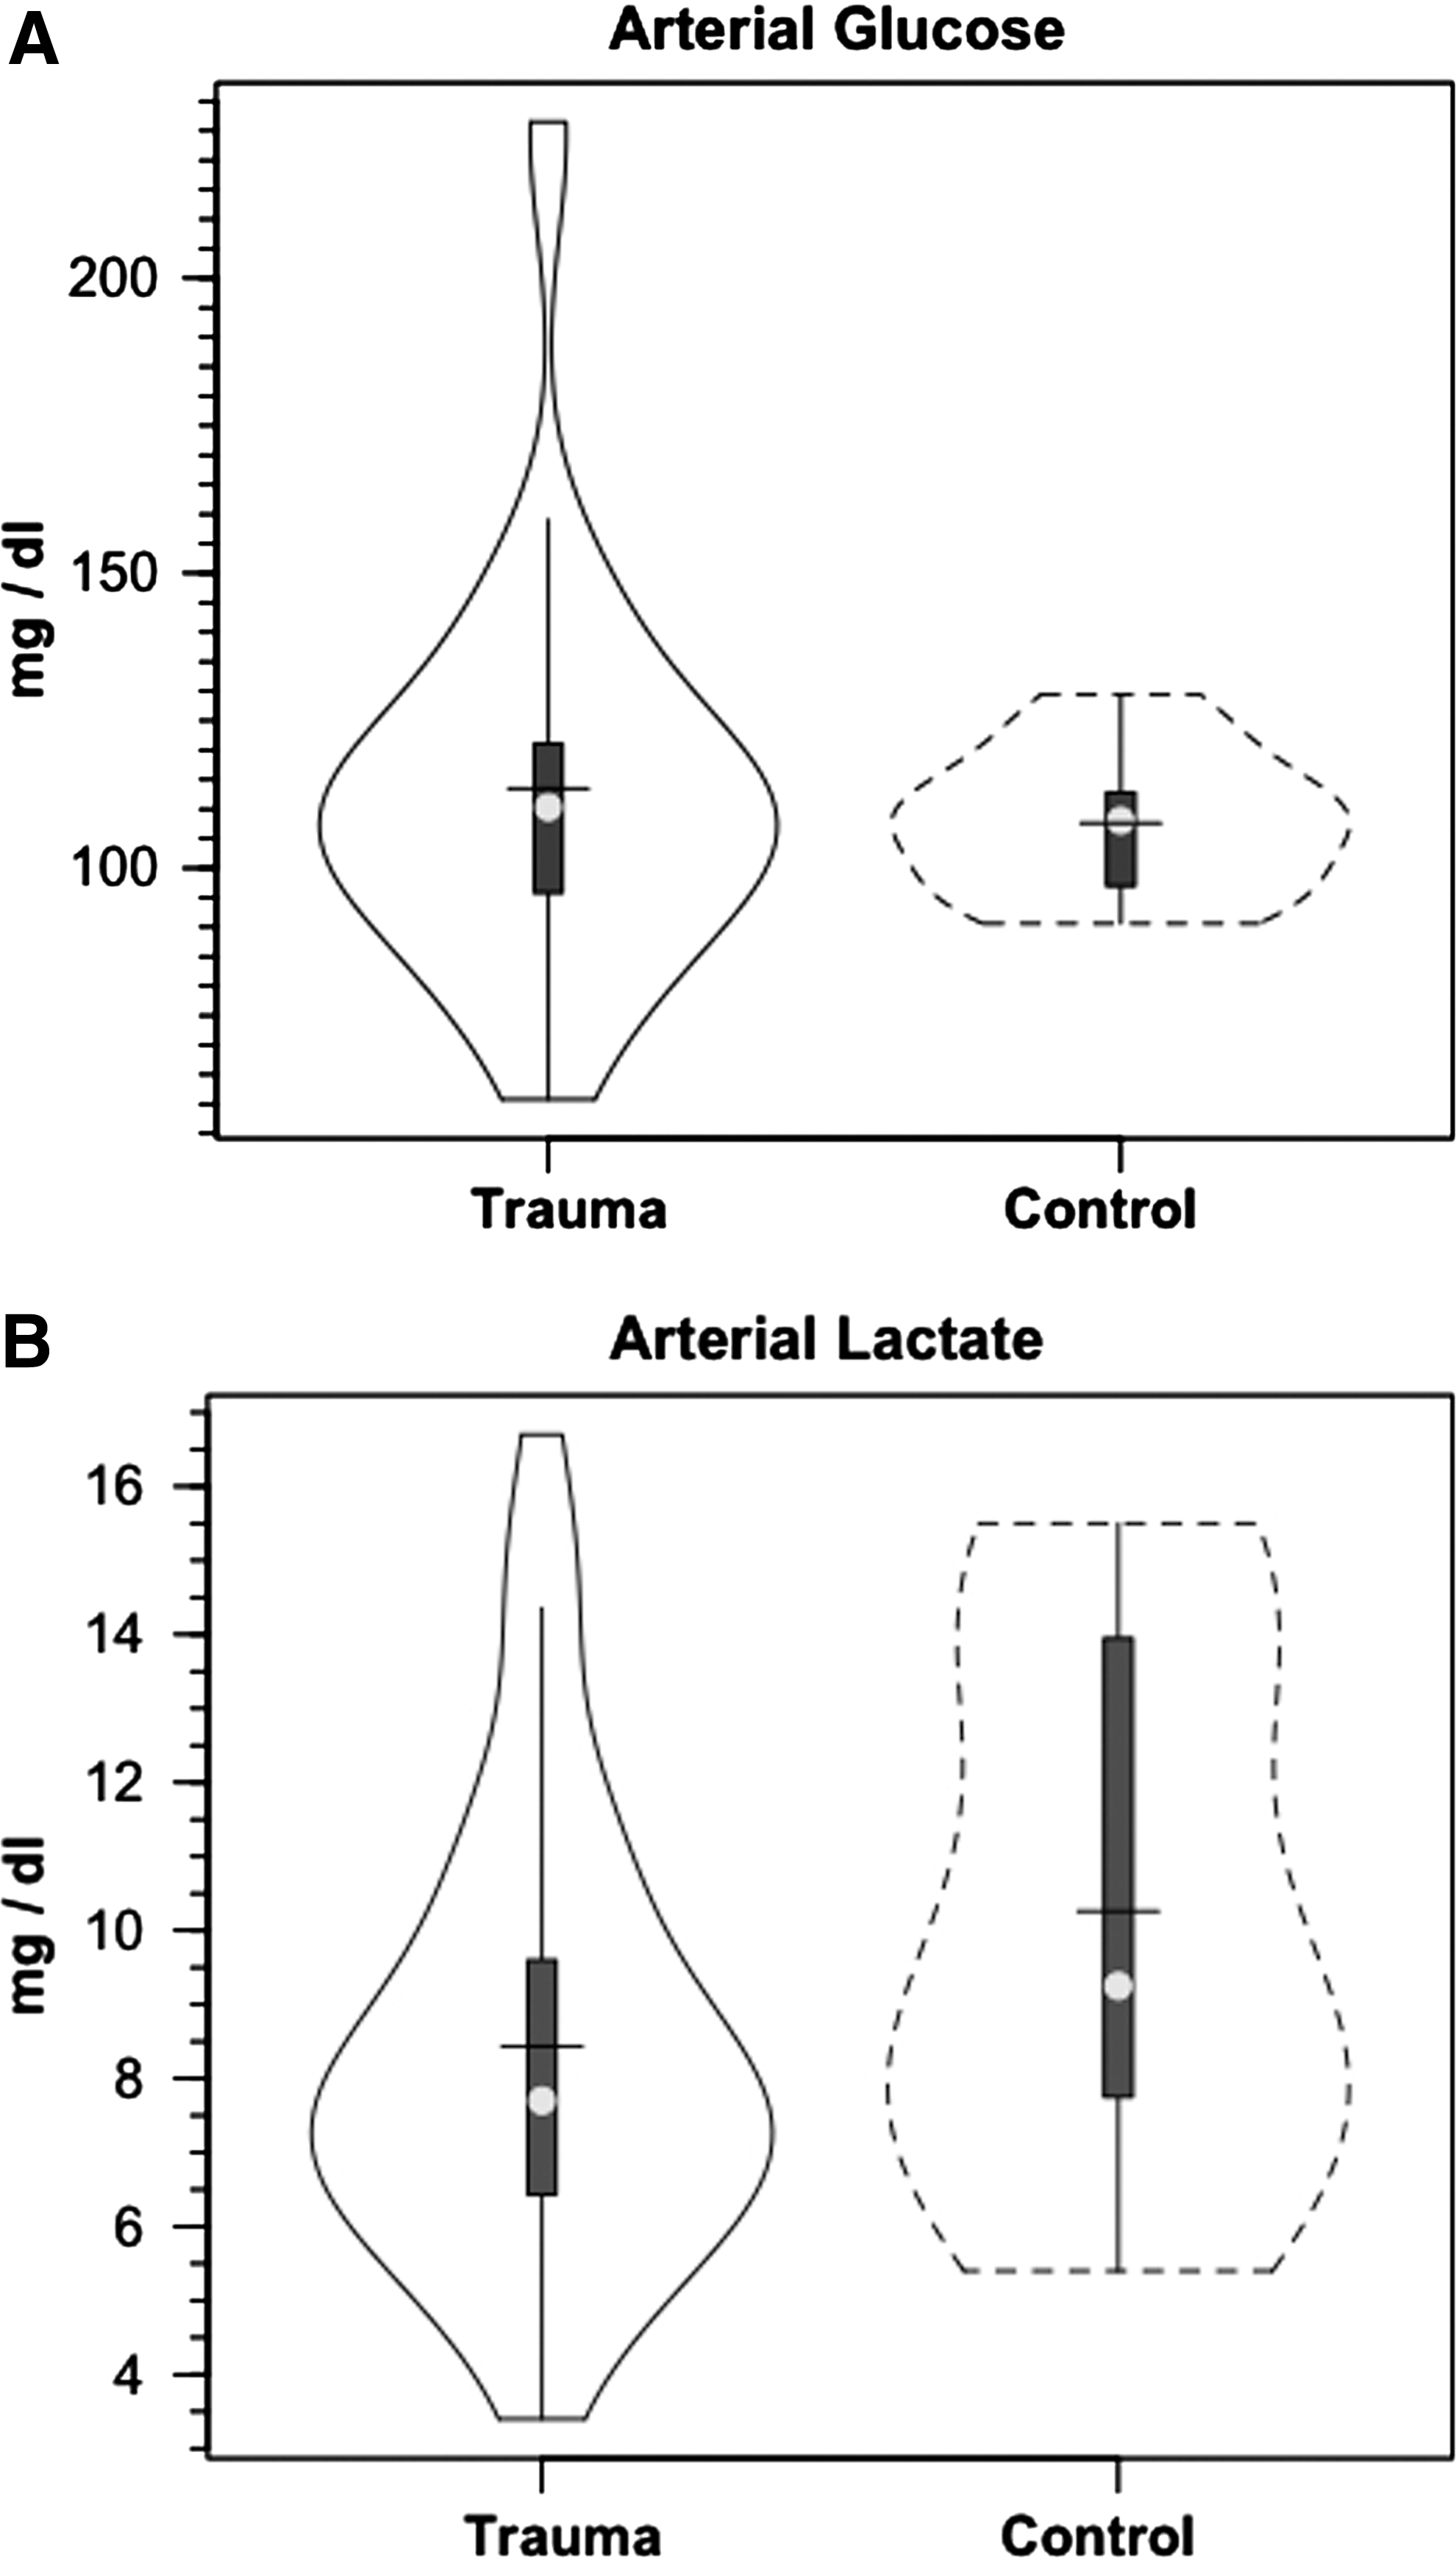
Violin plot of arterial glucose (
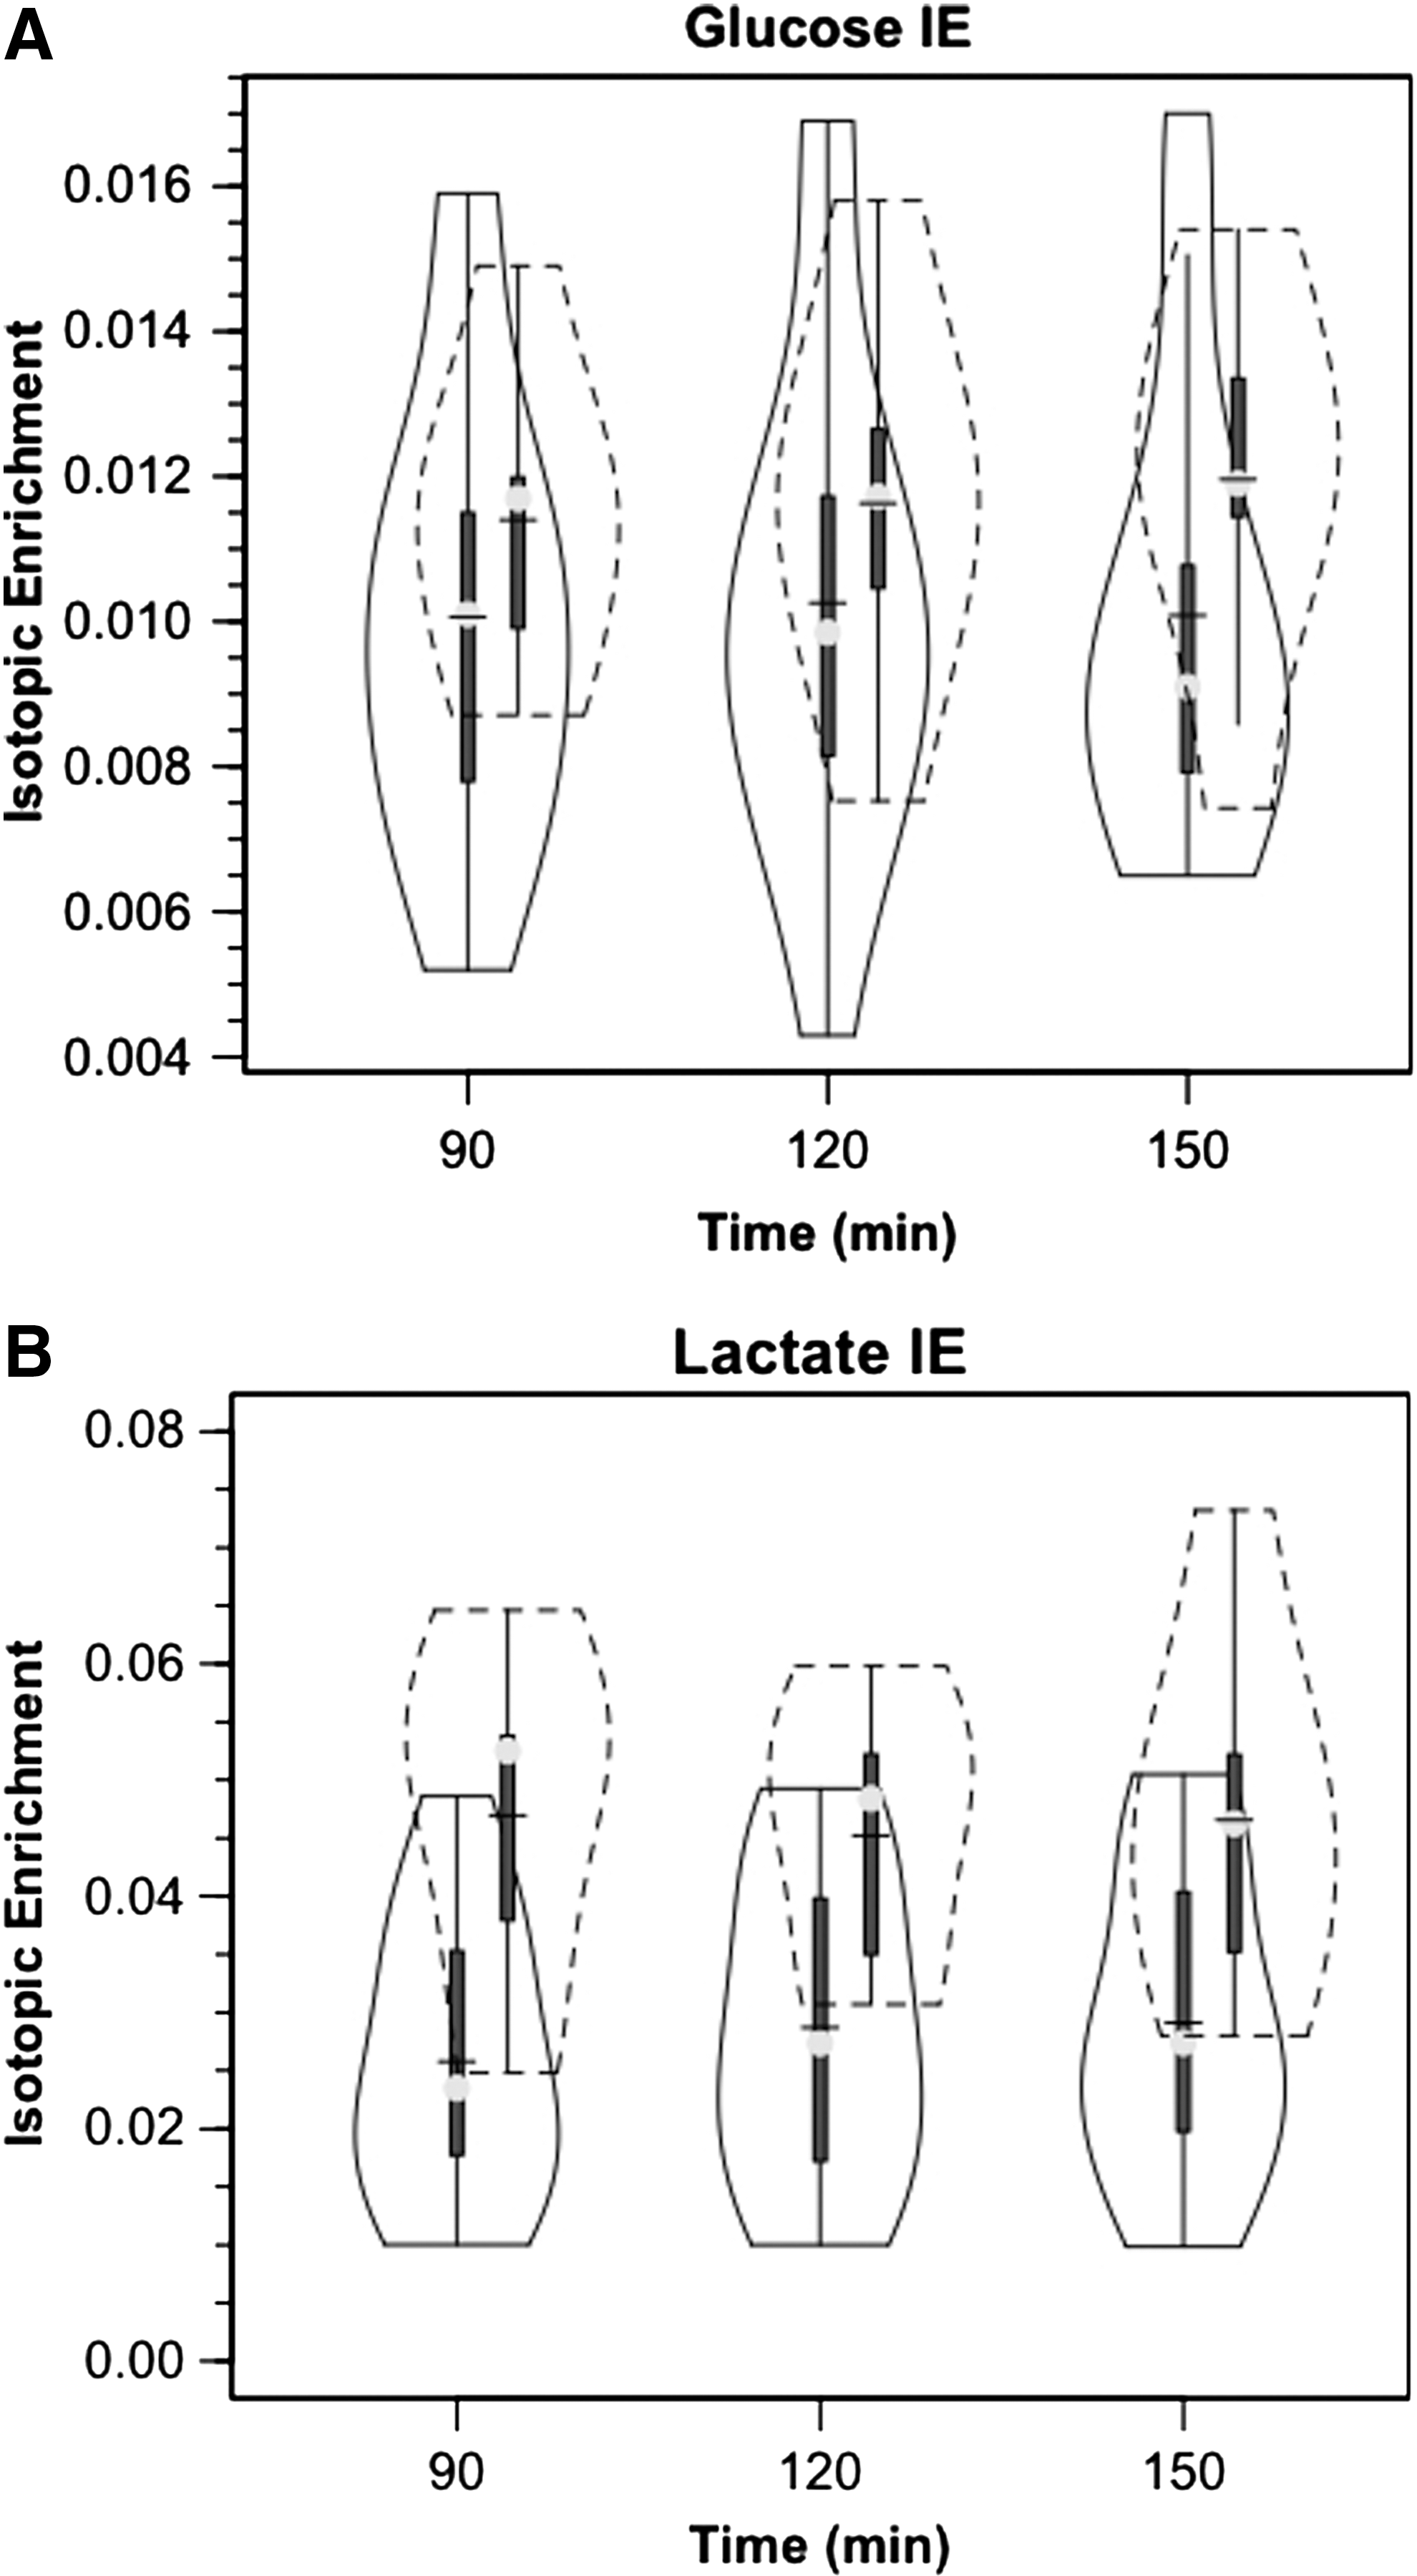
Violin plot of arterial D2 glucose (
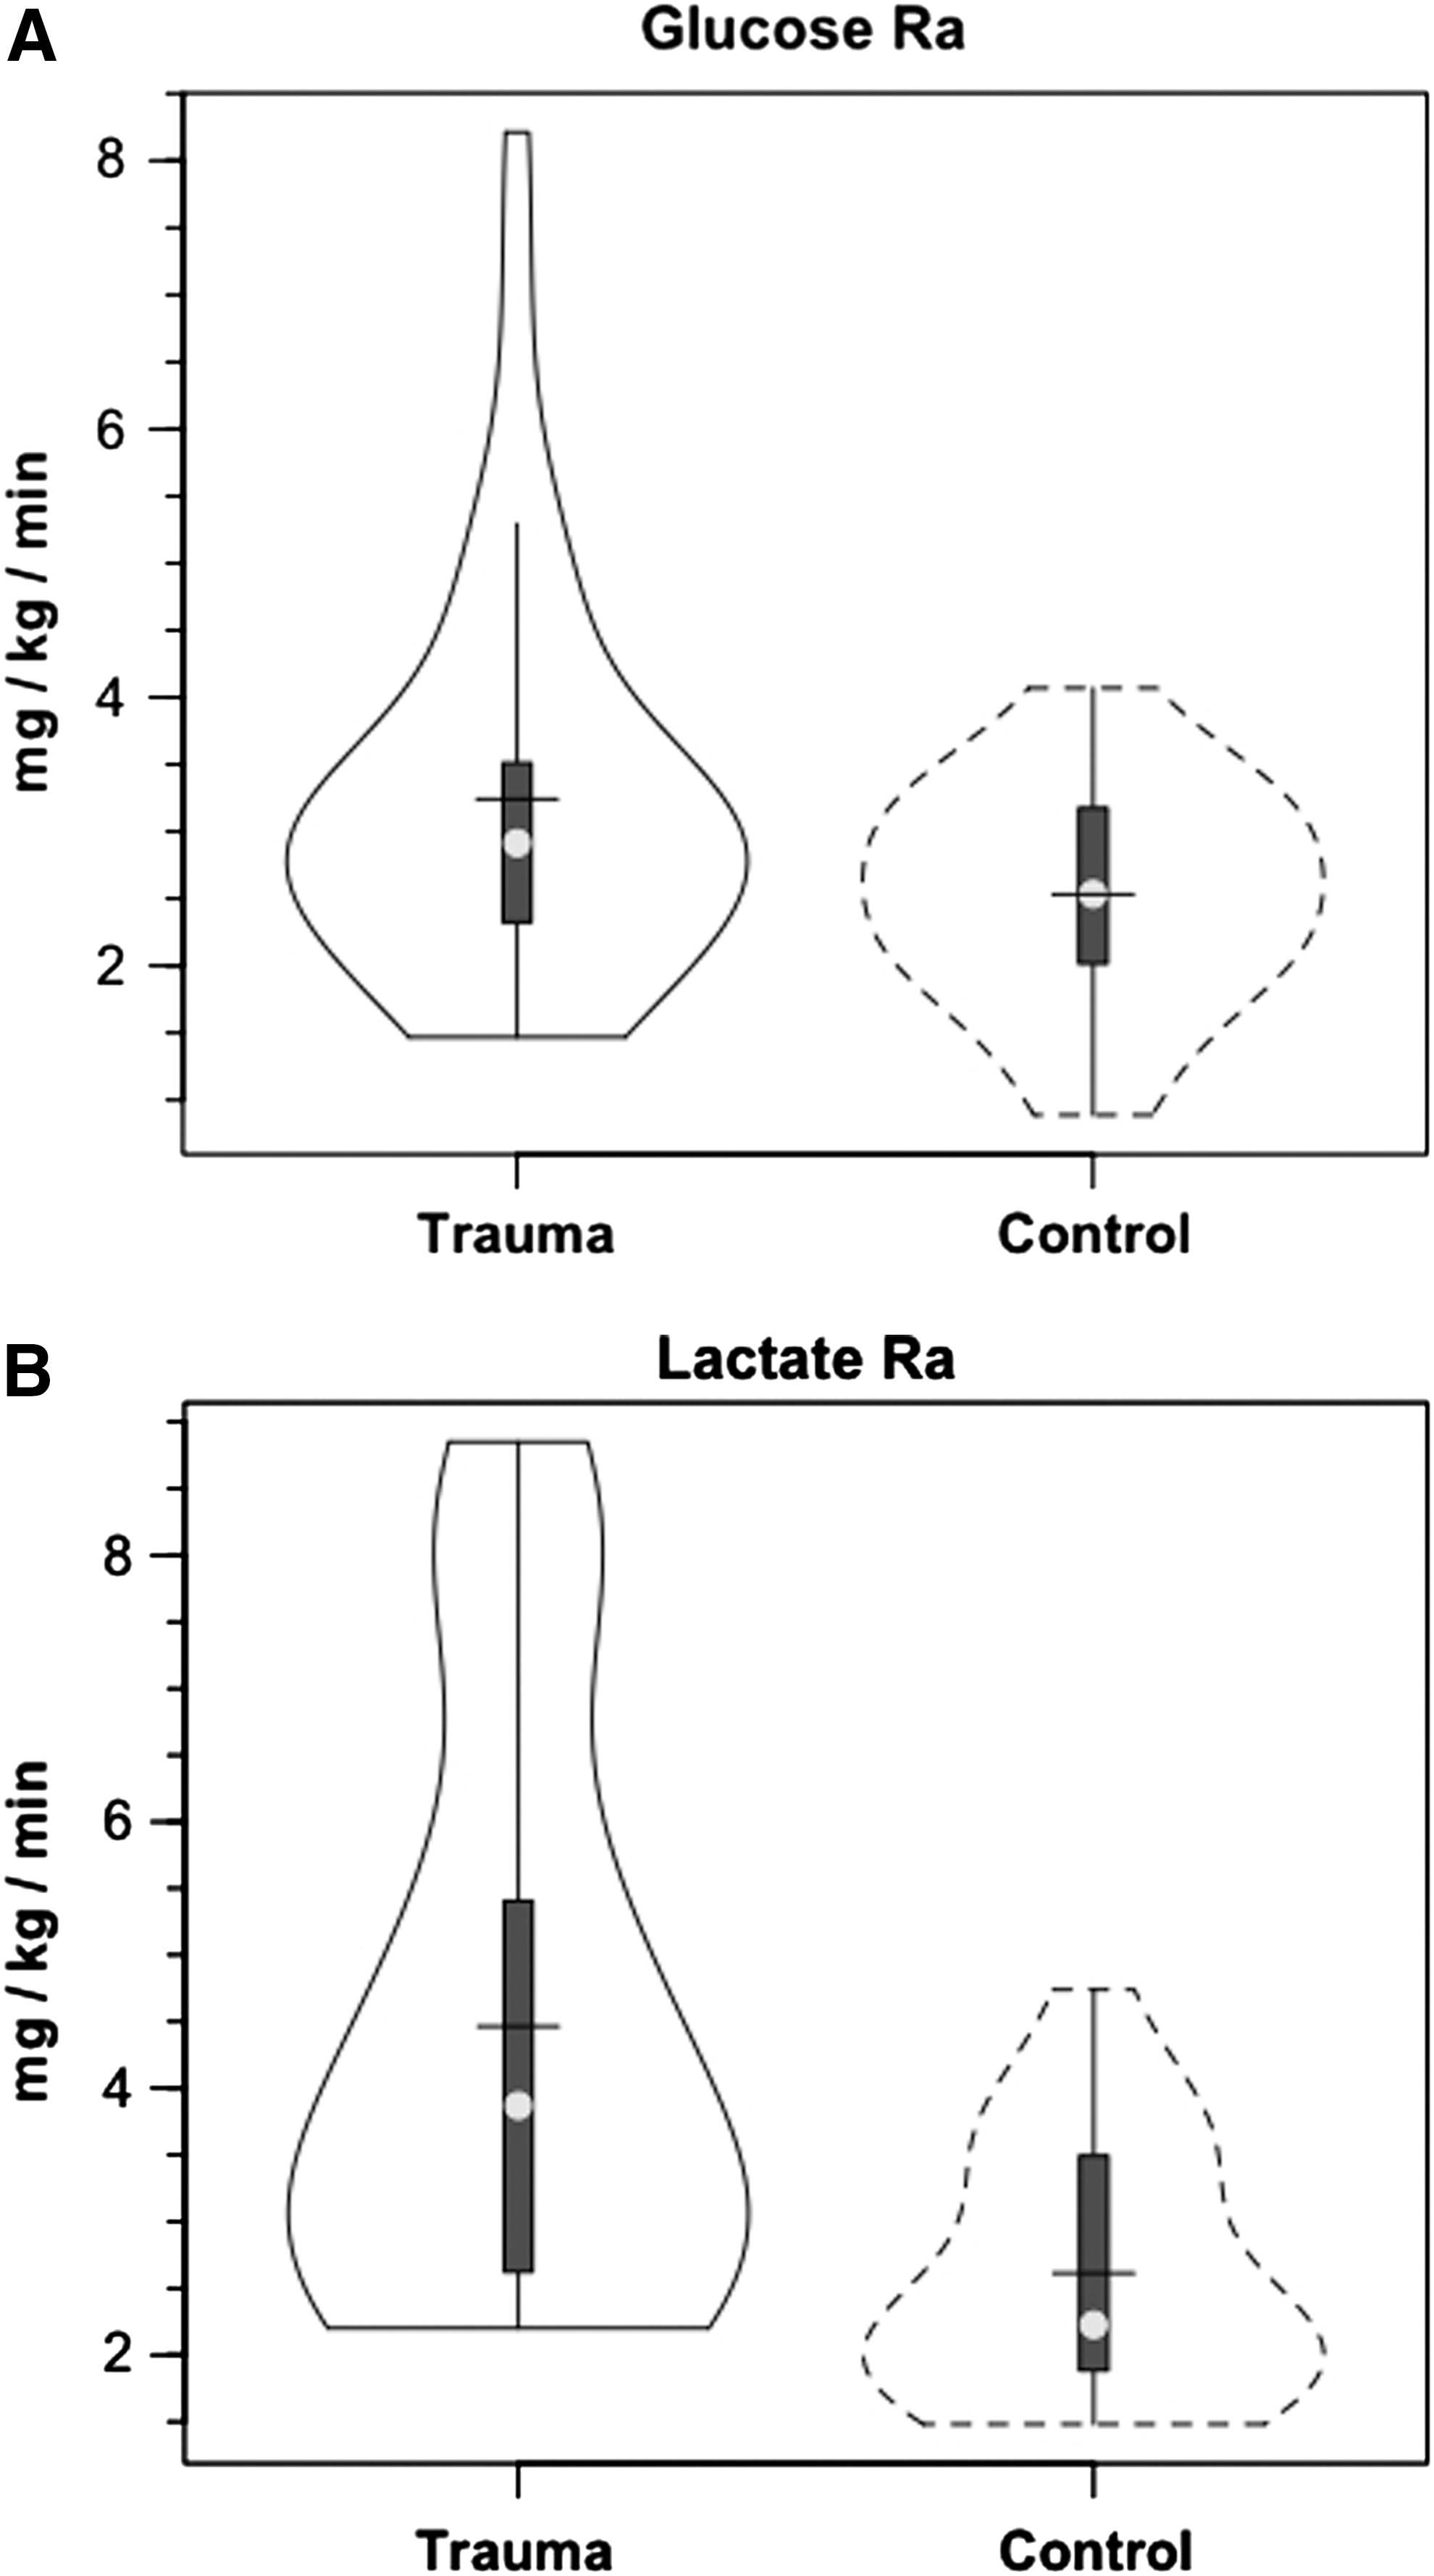
Violin plot of whole-body glucose (
Lactate
Like [glucose], arterial [lactate] was constant in both populations but slightly depressed after TBI compared with controls (Fig. 1B). The lower, as opposed to higher, blood lactate levels after TBI reflect their status as patients in the ICU 5.7±2.2 days post-injury, 44 well beyond the immediate post-injury state of hyperglycolysis. 43
As with the glucose tracer, within 90 min of the commencement of tracer infusion, [3-13C]lactate isotopic enrichments were constant in jugular and arterial blood in both control subjects and patients with TBI (Fig. 2B). For both populations, IEs were significantly lower in simultaneously sampled JB than in arterial blood because of the presence of cerebral lactate production and admixture to the venous effluent (p=0.035 for TBI and p =<0.001 for control subjects). Importantly, mean arterial lactate IEs were constant over time of measurement and significantly lower in patients with TBI than in control subjects (Fig. 2B) (p<0.001). Given that tracer infusion rates were the same in control subjects and patients with TBI, lower (3-13C)lactate isotopic enrichments in patients with TBI meant 71% higher lactate appearance (Ra, production) and disposal (Rd, removal) rates after TBI (Fig. 3B) (p<0.05). The significant increase in lactate flux after TBI could not have been suspected from measurements of arterial lactate concentrations alone (Fig. 1B).
After TBI, glucose M+1 IEs were significantly increased (25%, p<0.03) from IEs of control subjects in both arterial and JB samples (Fig. 4). In controls, the percent contribution of lactate to glucose production approximated 15.2% as seen previously. 9 As a result of far greater hepatic and renal conversion of lactate to glucose, however, after TBI, the percent glucose Ra from GNG increased significantly to 67.1% (p<0.03), a four-fold increase over control subjects (Fig. 5). Again, the dynamic role of lactate in supporting glycemia was not evident in either the normative and unwavering blood glucose or lactate concentration responses shown in Figure 1. For TBI and in general, constancy of blood glucose and lactate concentrations means only that Ra≅Rd, but no information could be extracted about the flux or metabolite interconversion rates. Thus, a novel aspect of this study was that the use of tracers revealed previously undetected effects of trauma on whole-body and cerebral lactate metabolism.
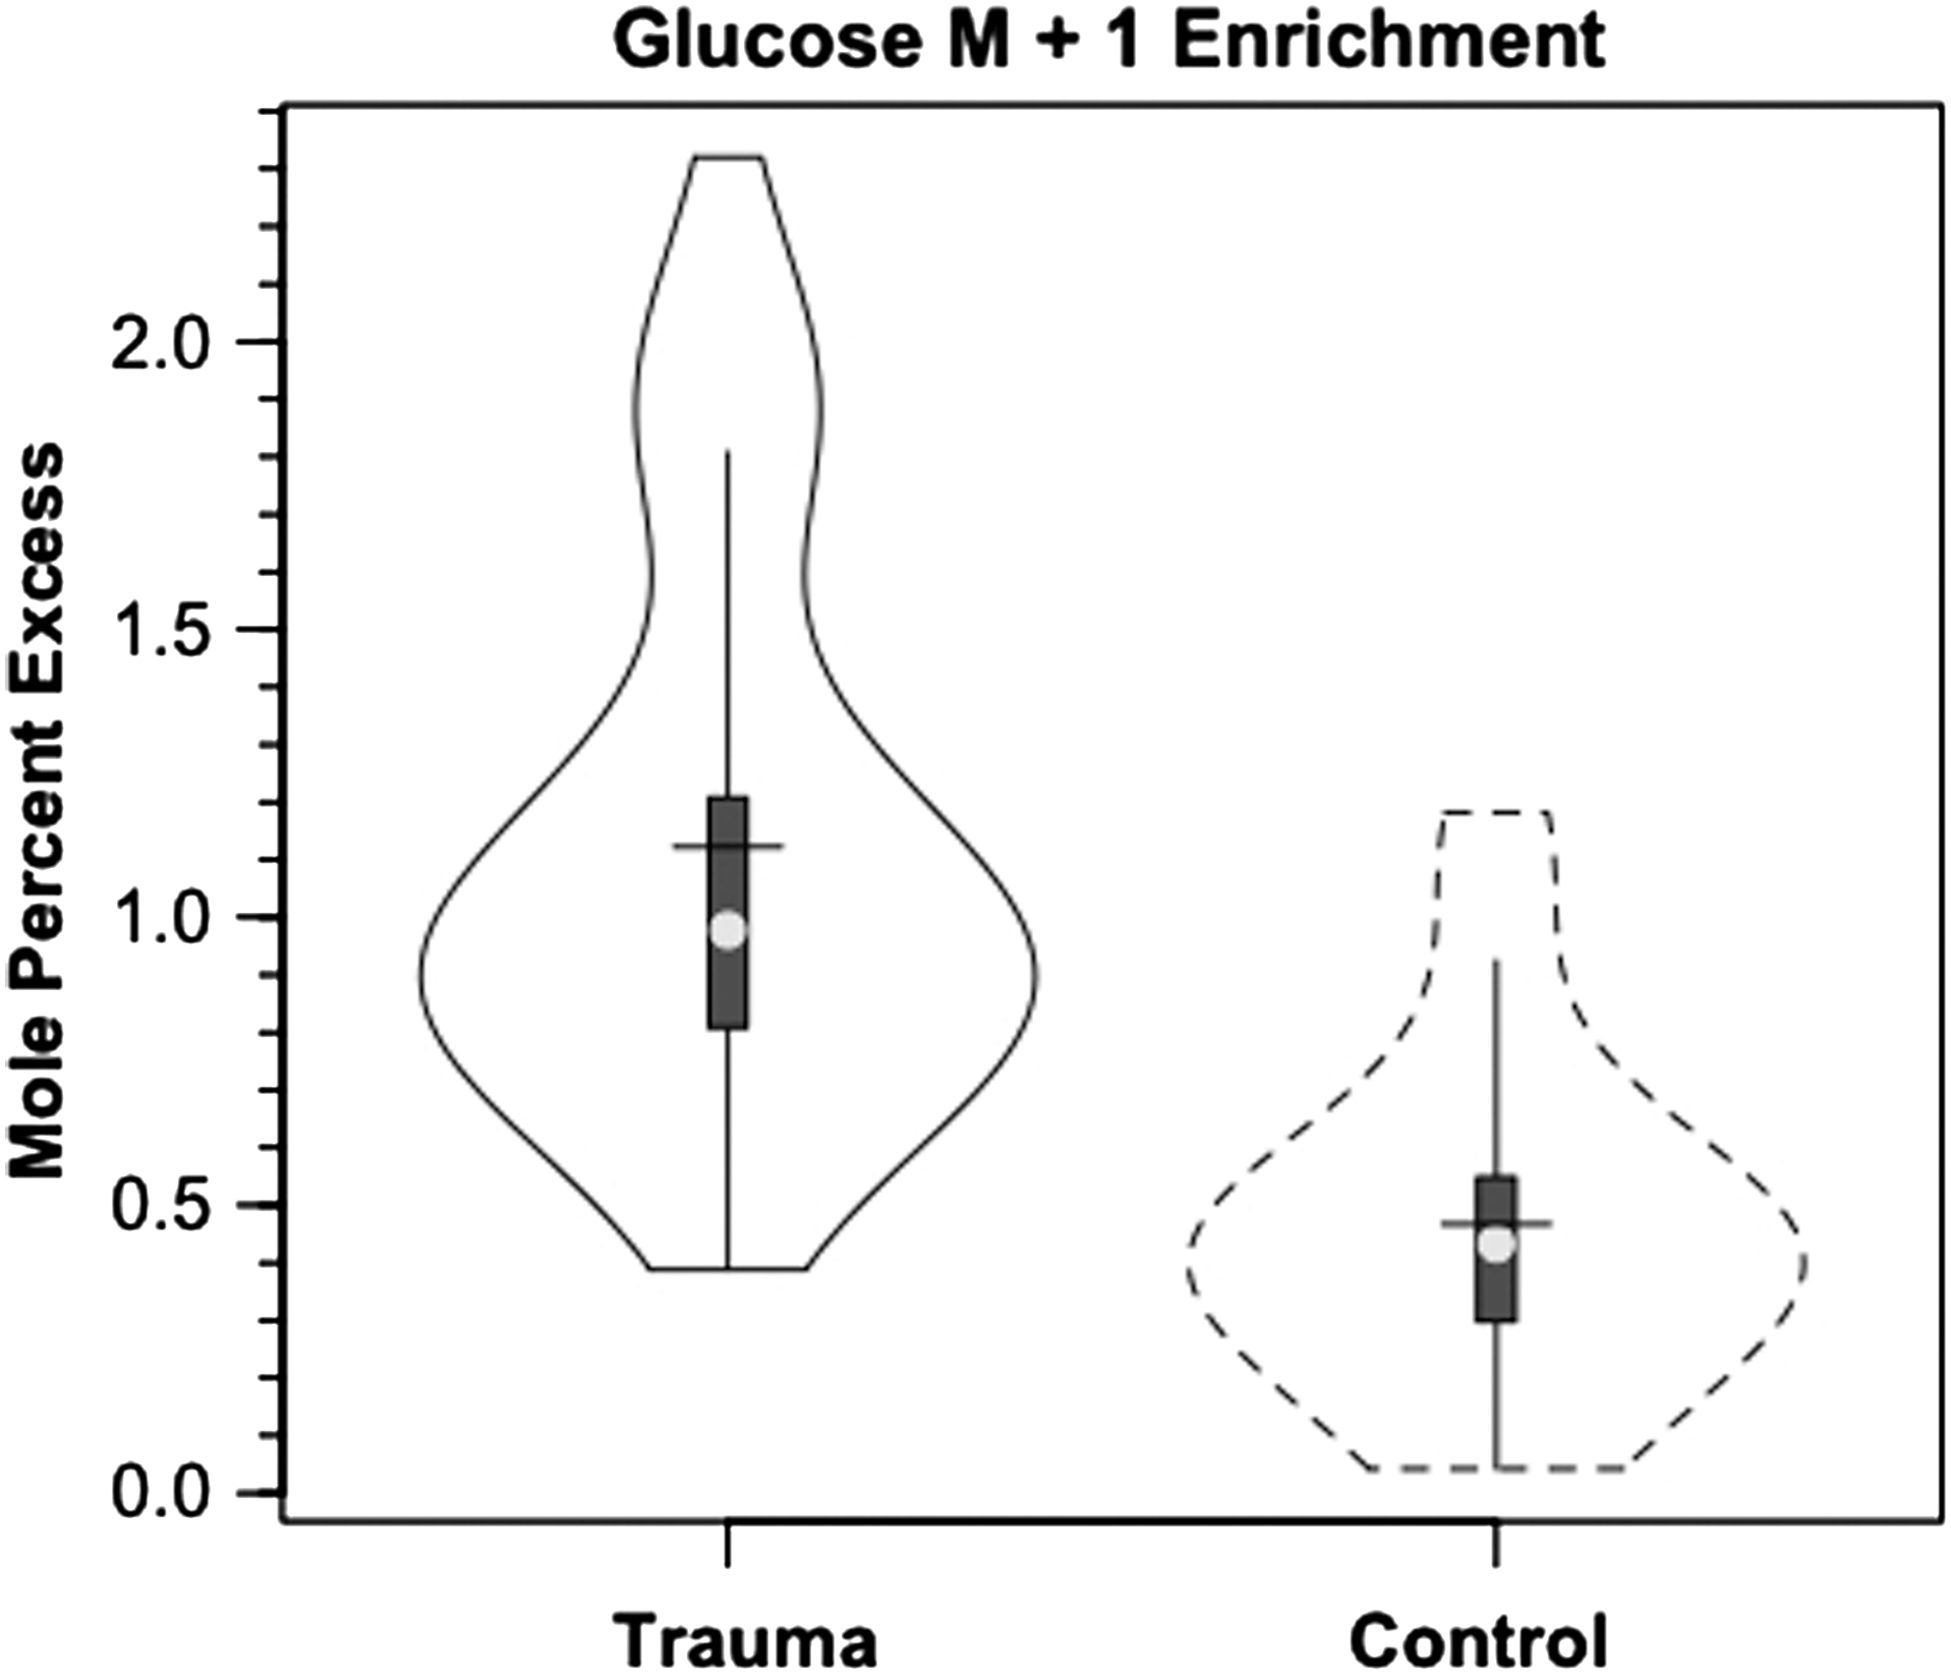
Violin plot of incorporation of M+1 label from infused lactate tracer into glucose in healthy controls (dashed lines) and patients with traumatic brain injury (solid lines). Trauma significantly greater than control, p<0.05.
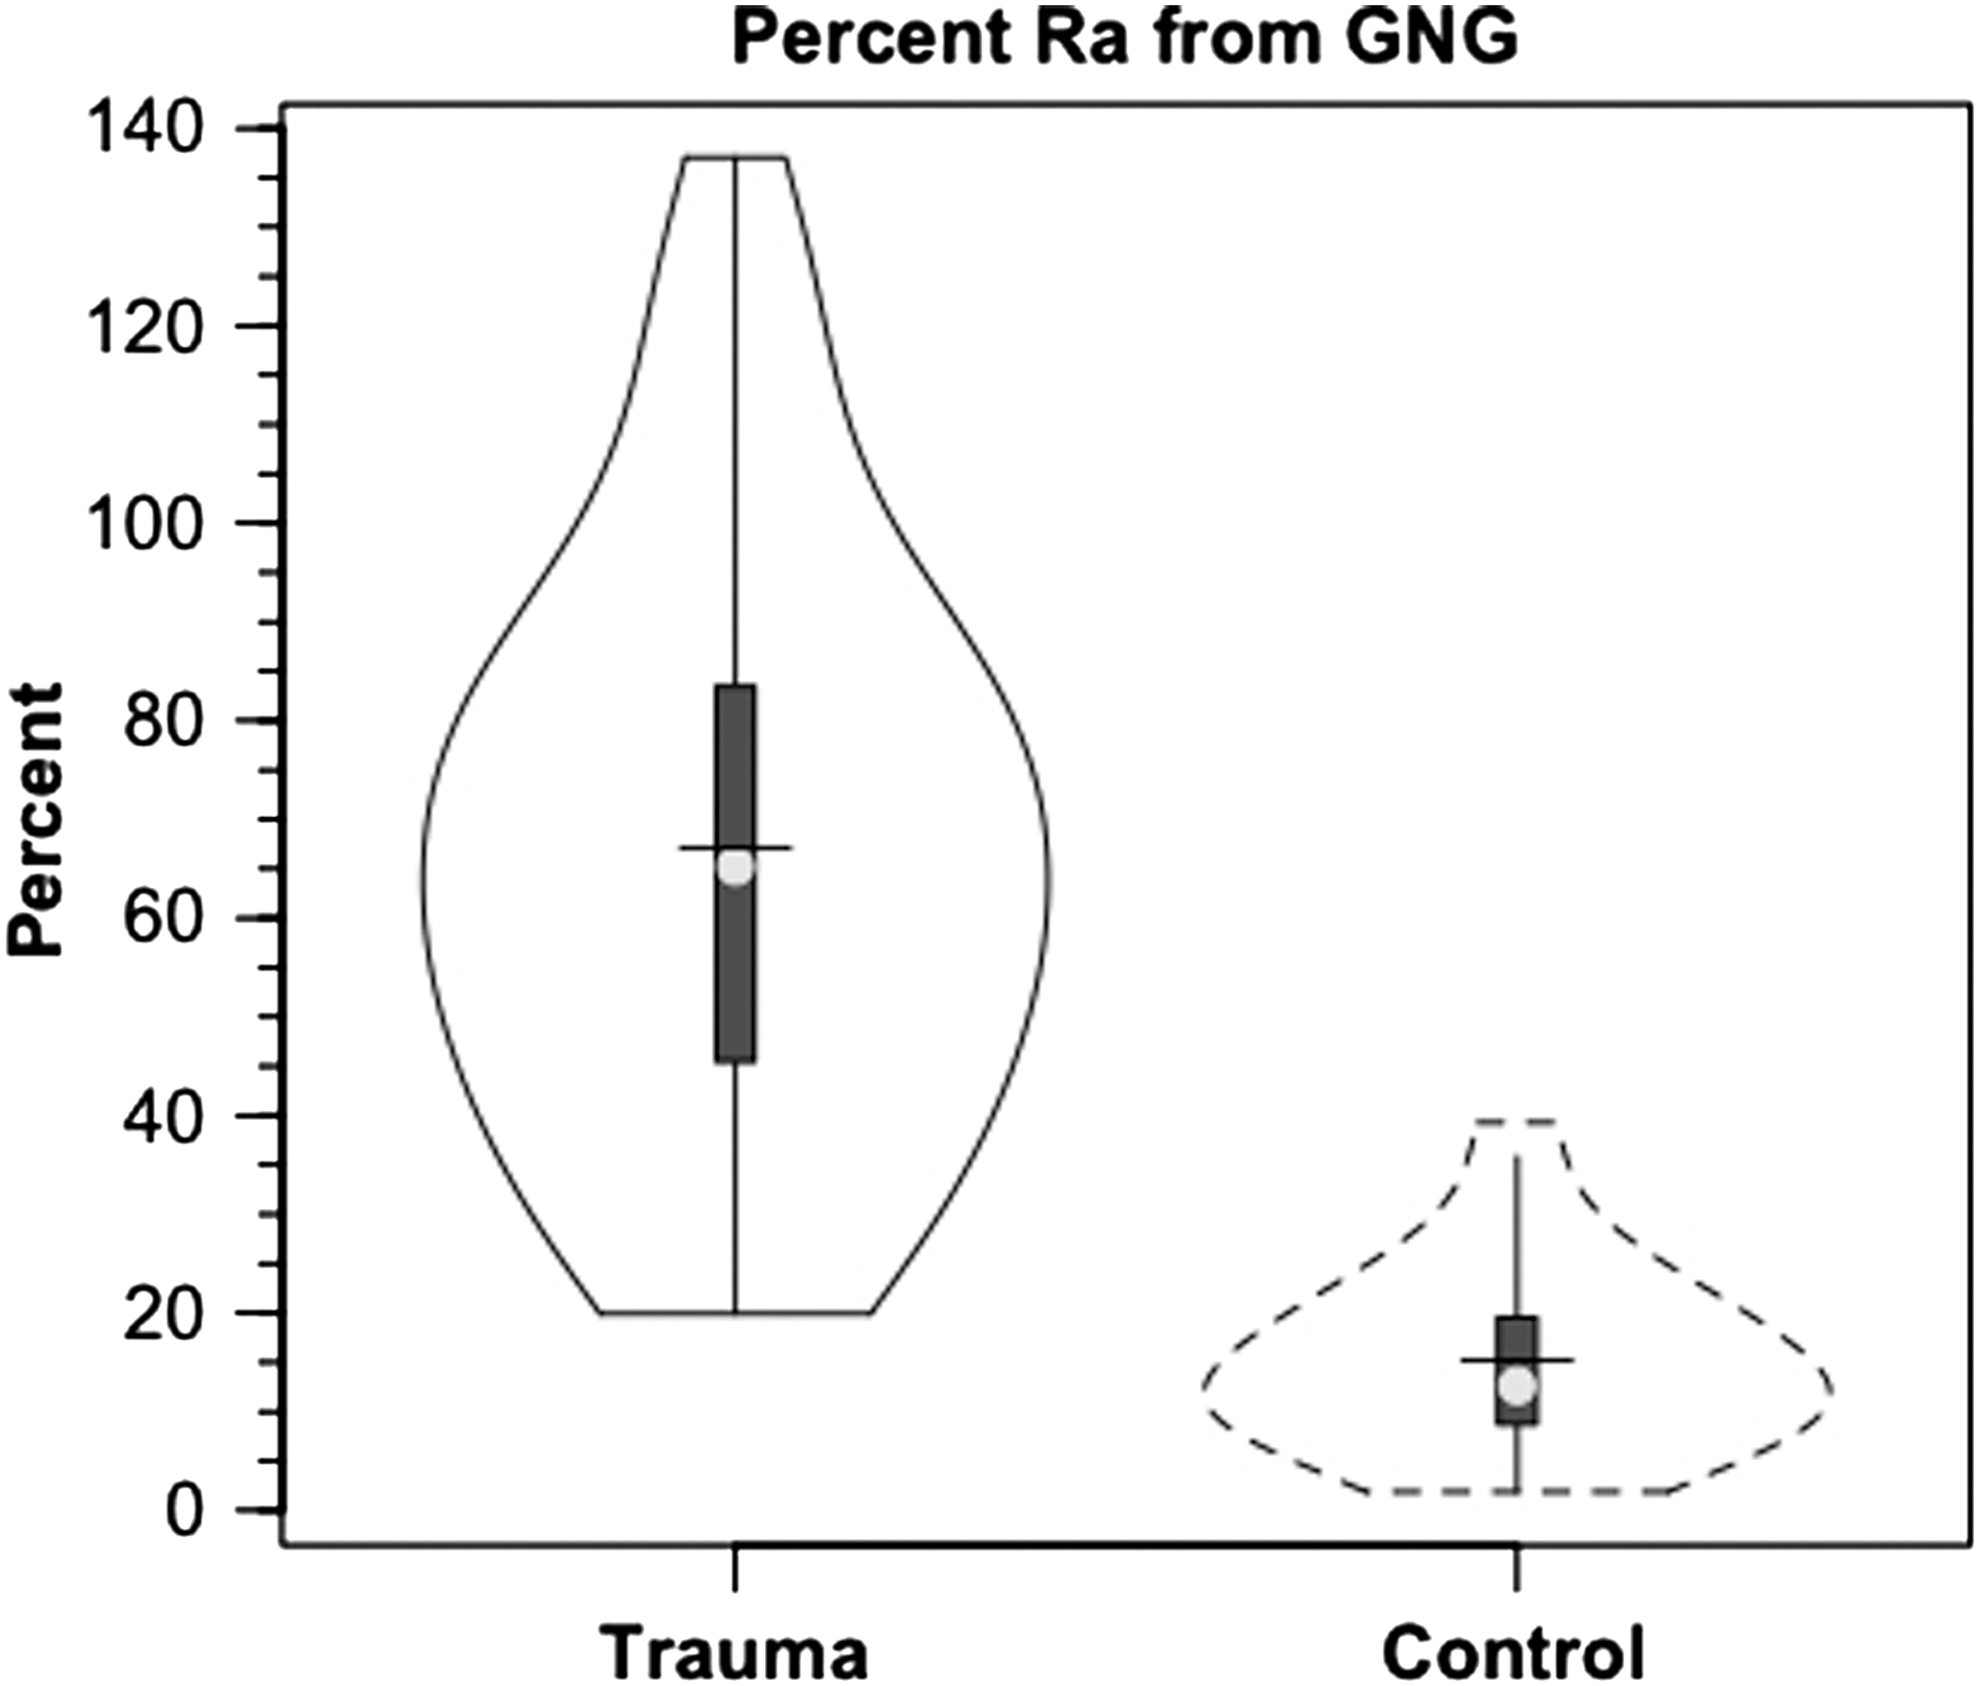
Violin plot of percent contribution of lactate to glucose production (gluconeogenesis, GNG) in healthy controls (dashed lines) and patients with traumatic brain injury (TBI) (solid lines). Values are significantly greater after TBI, p<0.05. Trauma caused a major change in GNG from lactate.
Discussion
Maintaining cerebral nutrient delivery is always a primary physiological priority, especially after brain injury. Support for cerebral nutrient delivery is achieved by mechanisms that operate within the brain as well as by systemic responses. In this report, we describe the peripheral support responses by which the body serves to fuel the brain. Endogenous fueling of the brain after TBI is accomplished mainly via the mobilization of total body glycogen reserves and the production of lactate. Lactate is the major gluconeogenic precursor in healthy, postabsorptive persons, 9,11 but we now show that the role of lactate as a gluconeogenic precursor is markedly elevated after TBI. In a resting post-absorptive person, glucose flux typically exceeds the lactate flux, 10 but not during exercise, when lactate flux can be greater than glucose flux, 4,9,68 or after TBI (Fig. 3B). After TBI, both lactate and glucose production are increased; a significant amount of the lactate produced is cleared via GNG, which in turn supports glycemia and, ultimately, cerebral glucose uptake. Together, the present report, in conjunction with our companion article in which we describe simultaneously measured cerebral glucose and lactate kinetics reveal the presence of major hepatic and extrahepatic functions in supporting metabolic needs in the brain after TBI. 52
Novel features of this investigation include the use of isotope tracers; the tracer approach provides new and important data on whole-body and cerebral metabolite fluxes and their interactions that were not apparent in either arterial metabolite concentration or AVD metabolite data. Arterial and JB glucose concentrations and corresponding IEs were stable during the period of observation (Fig. 1, 2), showing the results to be reliable and reproducible. Similarly reproducible were determinations of glucose and lactate IEs. In that context, equivalent glucose IEs in simultaneously sampled arterial and JB blood were important because of long-standing conclusions on the lack of cerebral glucose production and GNG because of the lack of gluconeogenic bypass enzymes and glucose 6-phosphatase in brain cells. Because the AVD measurements of glucose IE were negligible, the results mean that there was no significant contribution to the brain glucose supply, such as the action of de-branching enzymes that could release unlabeled glucose during the degradation of brain glycogen.
The importance of isotope tracers in this study is indicated by lactate isotopic dilution measurements (Fig. 3B), and by incorporation of 13C, from infused [3-13C]lactate, into circulating glucose (Fig. 4). After TBI, GNG from lactate is the major contributor to hepatic and renal glucose production (Fig. 5), and this phenomenon would have been missed had only blood glucose and lactate measurements been available.
Isotopic dilution measurements showed that lactate turnover was significantly increased after TBI. As seen by the secondary labeling of glucose from infused lactate tracer, in large measure, much of the isotopic dilution of lactate tracer was attributable to diversion to glucose in the process of GNG. The four-fold elevation in GNG, however, could not explain the entire elevation in lactate turnover after TBI (Fig. 3B). Augmented whole-body lactate production after TBI was unlikely to involve a negative feedback mechanism involving changes in blood [glucose] because systemic glucose concentration was little changed after TBI (Fig. 1). Rather, another most likely sympathetically driven mechanism of peripheral glycogenolysis was responsible for elevated lactate flux rates after TBI that rival those observed during hard physical exercise. 4,36,69
Results of our investigation indicate that caution needs to be applied when using the term “lactate clearance” as a biomarker for the severity of traumatic injury. 77 Without the use of isotope tracers, clearance is calculated as a net metabolite change over time with lactatemia and lactic acidosis harbingers of poor outcome. In our investigation, we infused [3-13C]lactate tracer to determine the metabolic clearance rate (MCR=Rd/[lactate]a), units being (mL/kg/min). In our investigation, lactate production (Ra) and disposal (Rd) rates were significantly elevated after TBI (Fig. 3B, Rd shown), while arterial lactate concentration ([lactate]a) was the same in control subjects and patients with TBI (Fig. 1B). Ordinarily, a greater Rd, but similar blood [lactate] would mean increased lactate MCR after TBI (Fig. 6). However, because of variability in the measurements, there was no significant change in lactate MCR after TBI. Additional tracer studies will be needed to establish the relationship between lactate MCR and outcome after TBI.
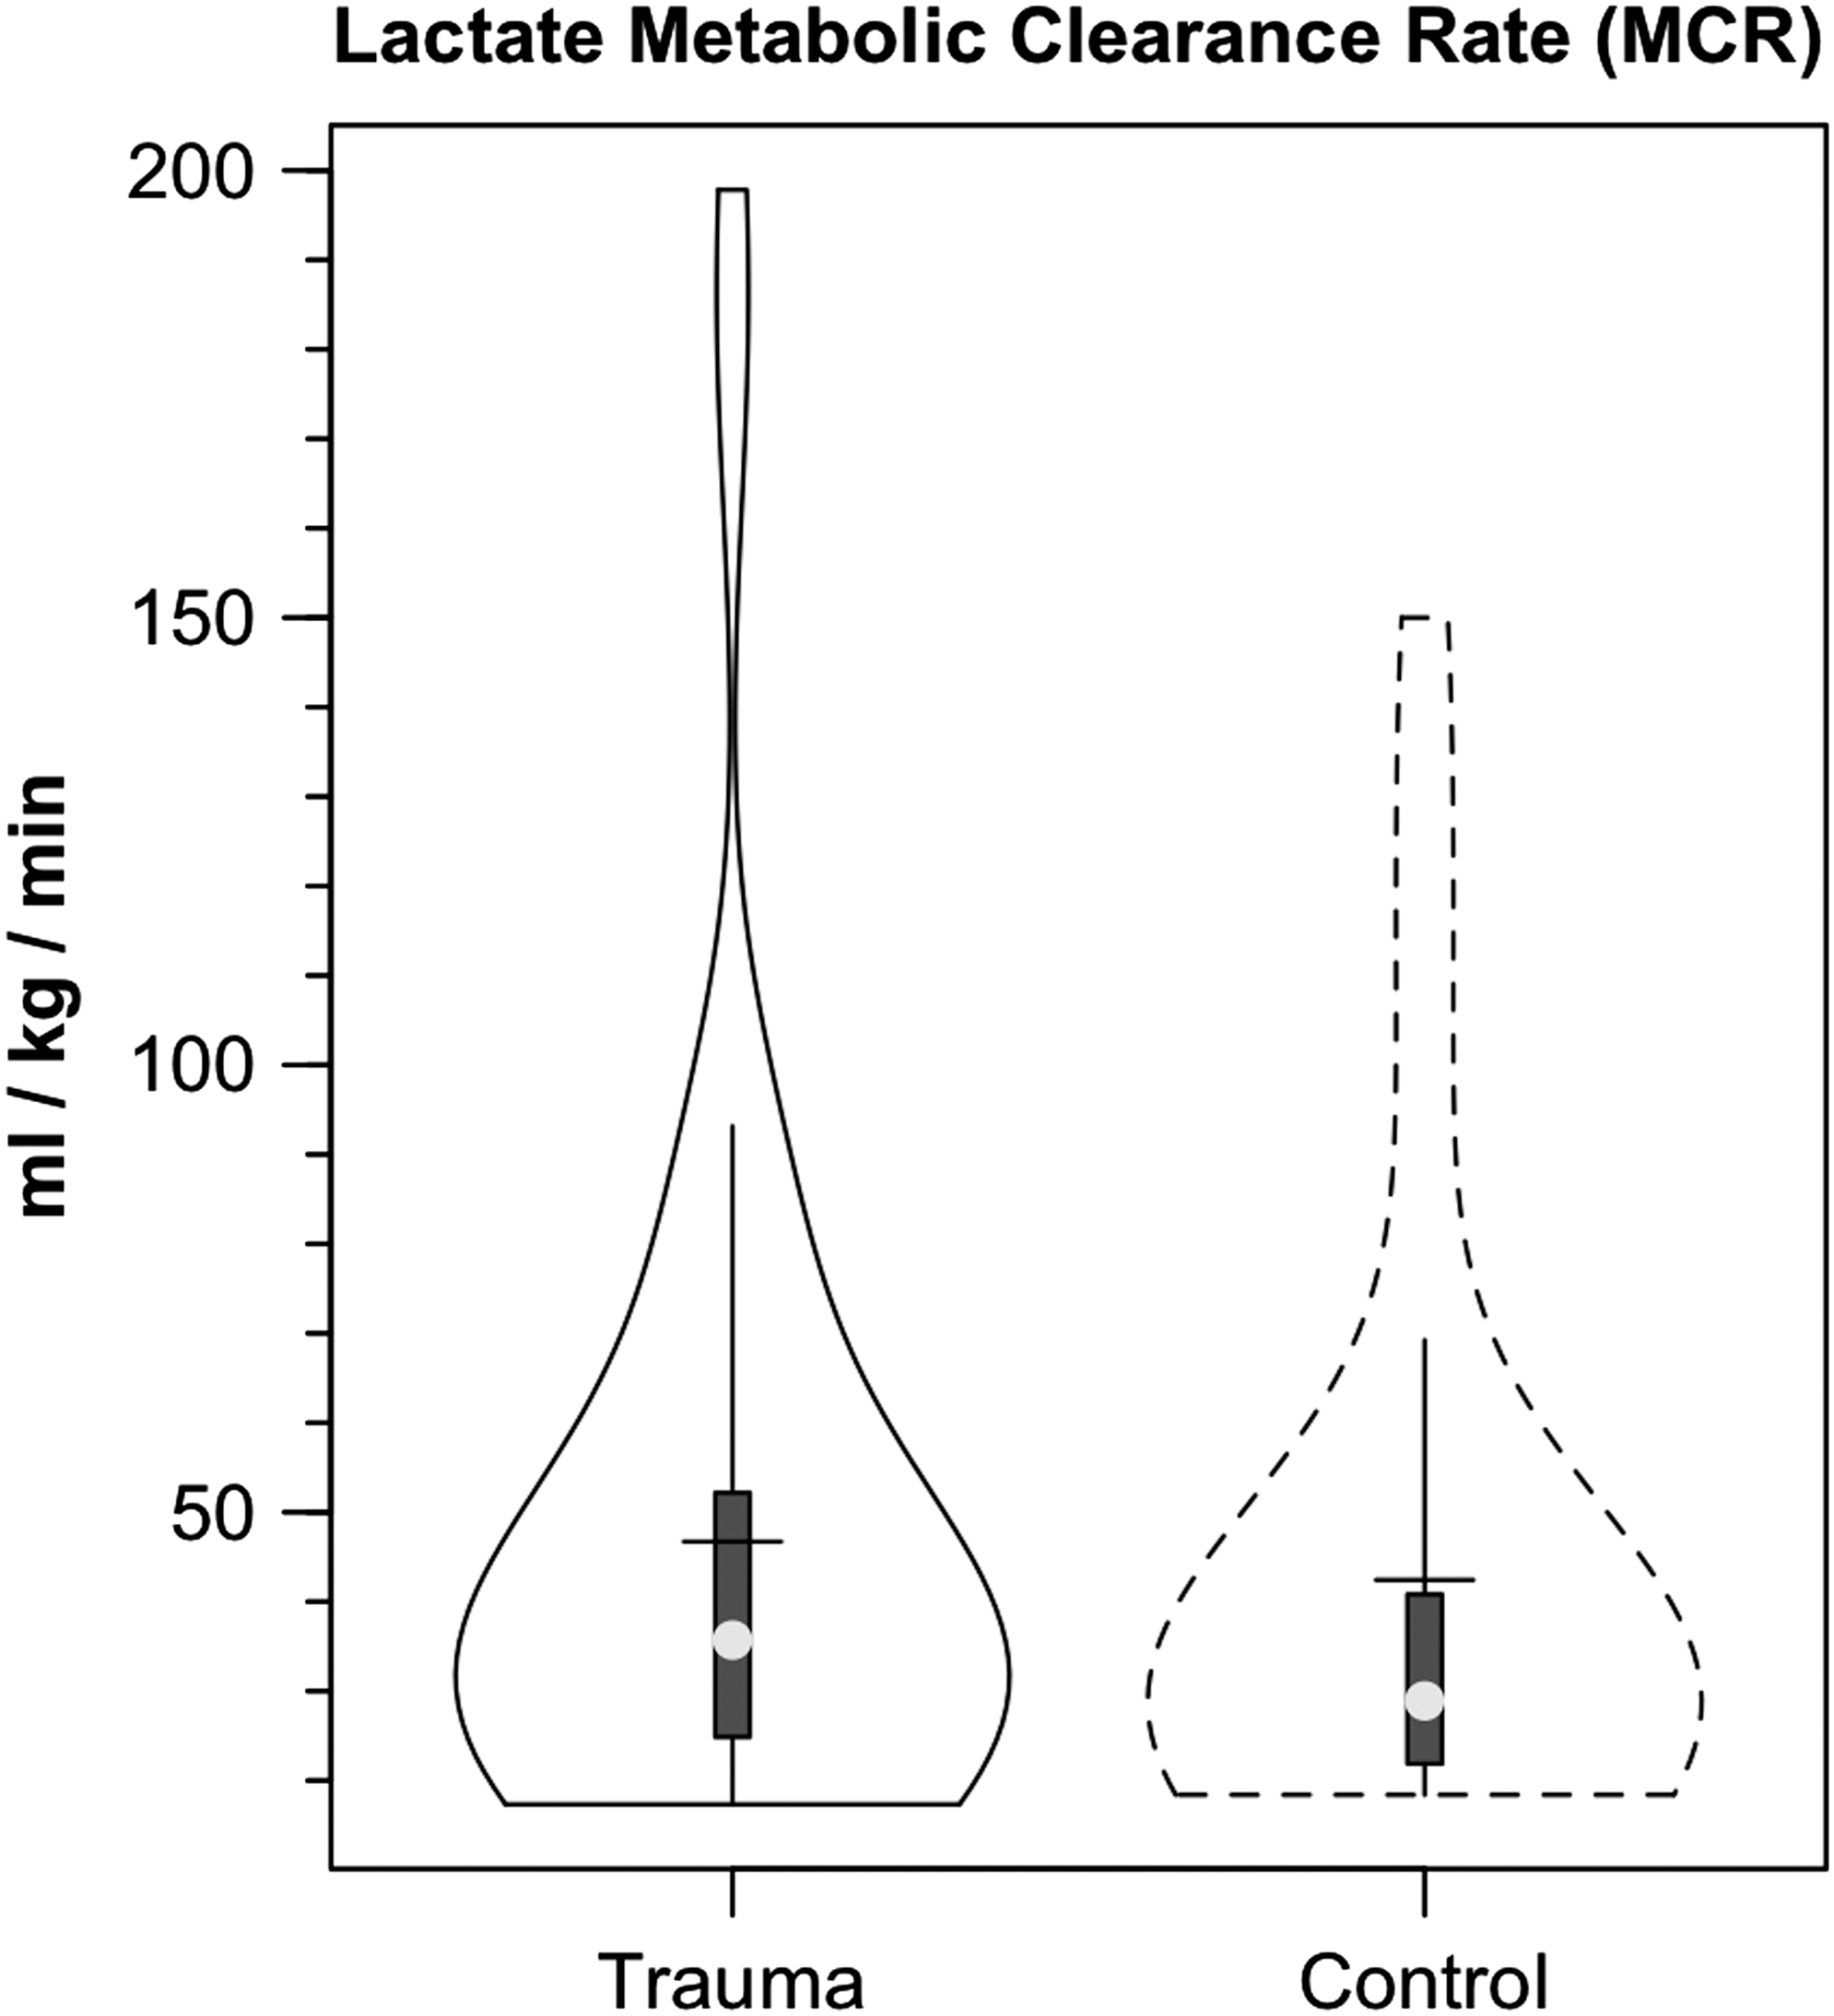
Violin plot of lactate metabolic clearance rate (MCR=Lactate Rd/[Lactate]) in healthy controls (dashed lines) and patients with traumatic brain injury (TBI) (solid lines). Typical of parameters of cerebral and body metabolism following TBI, variability in lactate MRC appeared greater following TBI, but there were no significant differences in measures of central tendency or variability in MCR following TBI.
Since the classic studies of Meyerhof 70 and of Hill and Lupton, 71 it has widely been assumed that elevations in circulating lactate are attributable to oxygen insufficiency in skeletal muscle. Those historic assumptions pose problems for the interpretation of diverse sets of data, because hypoxemia did not occur in our studies. Further, we now know that lactate is produced in muscle under fully aerobic conditions, 2,63,72 and like the beating heart, working muscle can be a net lactate consumer. 62,73 Because of its mass and dynamic range of metabolism, muscle adds lactate to the systemic circulation. 4,62,63 Under sympathetic stimulation, other tissues, such as the integument, also contribute to the circulating lactate level. 74
TBI increased glucose flux, but lactate production (Ra, shown) and disposal (Rd, not shown) rates are 40% greater than glucose flux rates (Fig. 3). Hence, after TBI, at the whole-body level, lactate is a far more important CHO-derived carbon source than is glucose. Although novel, the results obtained on healthy and traumatized persons were foreshadowed by the studies of Schurr 38,39 and Schurr and Gozal 41 on brain slices studied in vitro. As well, consistent with contemporary lactate shuttle concepts, 1 –3 the present results emphasize the role of lactate as the major gluconeogenic precursor (Fig. 5), but likely serves a variety of other needs via nonoxidative and oxidative mechanisms.
In the present investigation, we infused 13C-lactate, and some may wonder why we do not report data on 13C-pyruvate. Previously we have addressed issues related to lactate-pyruvate interconversion in studies on humans, 4,56 and laboratory rats. 75,76 Fortunately for this investigation, the concern is not of lactate to pyruvate conversion, but conversely it would be a problem in studying pyruvate kinetics—i.e., pyruvate to lactate conversion.
The matter is complicated, but in brief, a simple example may be helpful. In a resting, unstressed person, the arterial lactate/pyruvate concentration ratio (L/P) is minimally 10, but rises during stress an order of magnitude or more. 56 Further, the Keq for lactate dehydrogenase (LDH) is 106. So, a few percent of lactate tracer injected into blood is converted to pyruvate, but the vast majority of lactate tracer stays as lactate. Conversely, pyruvate tracer is rapidly converted to lactate in the blood. 76 Two factors seem to be involved: (1) the activity of LDH in erythrocytes, and (2) LDH and MCT activities in lung parenchyma. 76 Accordingly, we are confident that we were measuring lactate kinetics in the blood. It remains, however, that tracing the source of JB13CO2 was important. which is what we have done in our companion paper on the brain carbohydrate. 52
Conclusion
Our results obtained using glucose and lactate tracers unmask enormous attempts in the body for GNG to support energy needs of the brain after injury. Extracerebral glycogen reserves are mobilized, resulting in high rates of lactate production. Although not directly measured, skeletal muscle, 4 integument, 74 and other tissues are likely involved in a general sympathetic response. 78 While not apparent in either blood glucose or lactate concentrations, lactate production and disposal are very high after TBI, with lactate giving rise to most glucose production. Regardless of cerebral demands, systemic glucose flux is greatly increased after TBI. The large increase in glucose Rd necessitates a corresponding increase in glucose production (Ra) that is supported mainly by GNG from systemically generated lactate. And as shown in our companion report, 52 peripherally produced lactate is also available as a cerebral metabolic substrate and is actively consumed and oxidized by the brain when in crisis. Thus, both directly, via cerebral lactate uptake, and indirectly, as a gluconeogenic precursor, lactate from the corpus serves to maintain the body energy state (BES) that then serves cerebral energy needs always and after TBI (see Fig. 7).
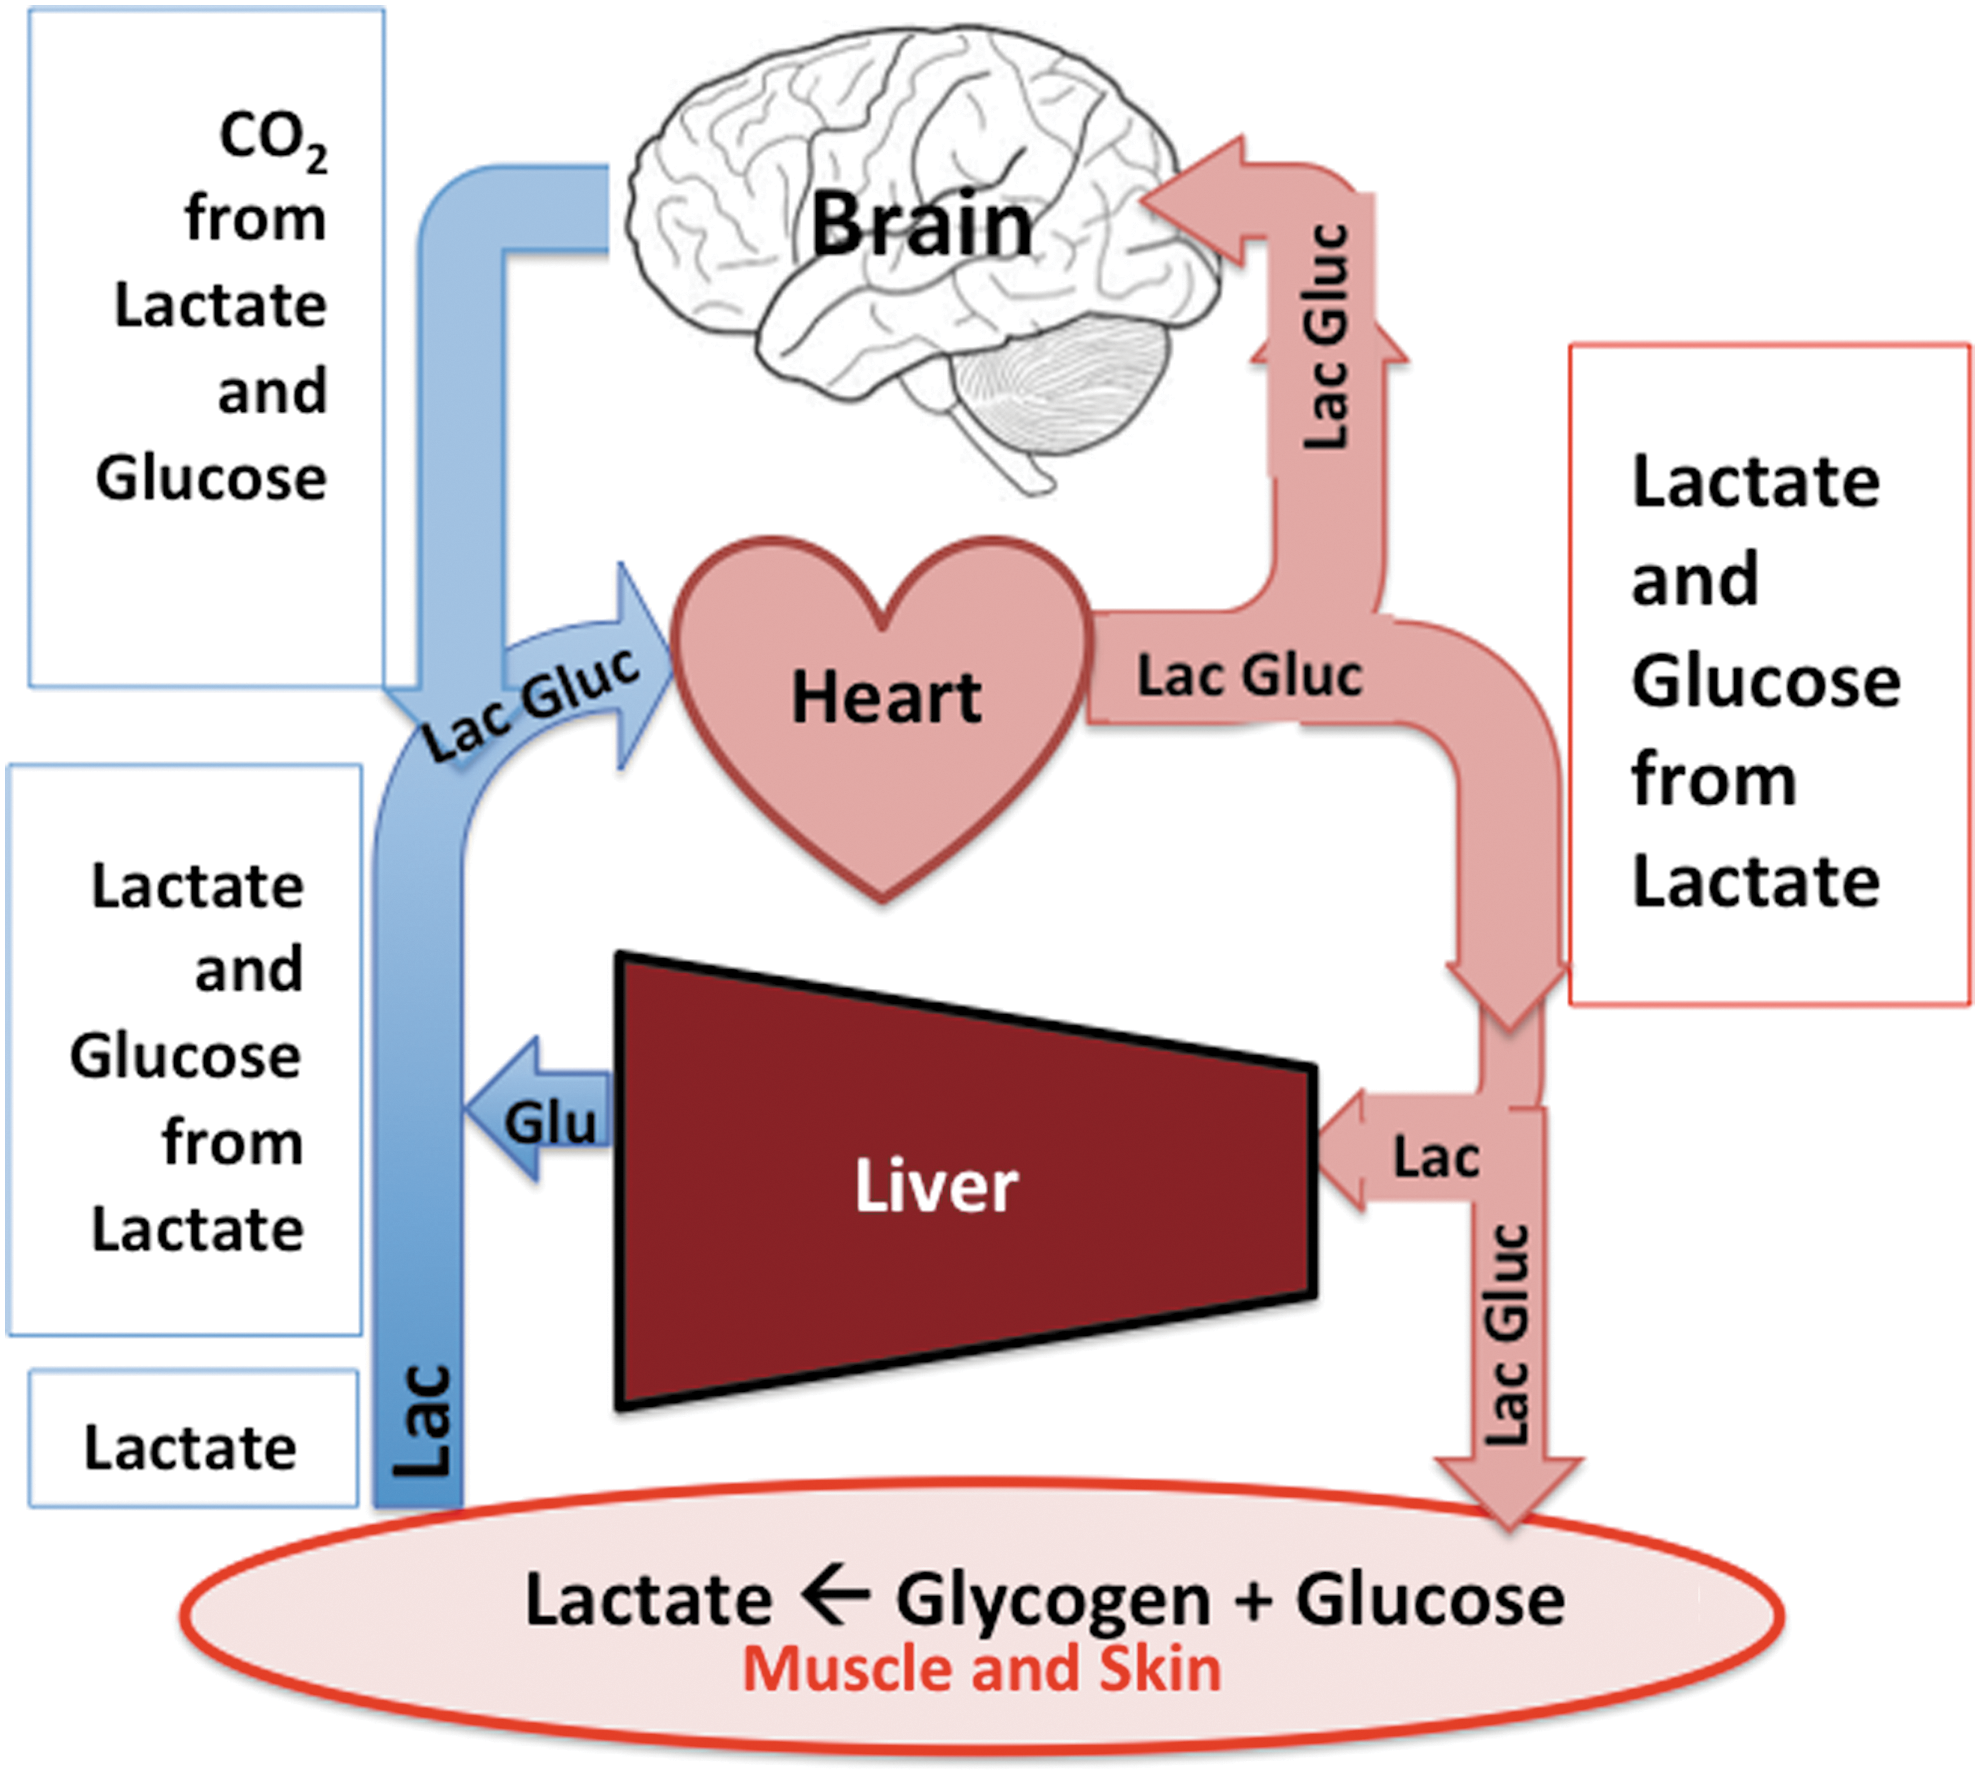
Schematic of lactate shuttle mechanism by which the body mobilizes lactate to fuel the brain after traumatic brain injury (TBI). Lactate is the major gluconeogenic precursor, and together lactate as well as glucose formed from lactate in the liver and kidneys fuel the brain always, but especially after TBI. Hence, lactate fuels the brain directly via uptake and oxidation
48
as well as indirectly via gluconeogenesis. Color image is available online at
Because of the previously unrecognized central role of lactate in maintaining glycemia and cerebral carbohydrate supply after cerebral injury, conceptually “lactate is the new glucose.” With this new knowledge about glucose and lactate fluxes not predictable from metabolite concentrations alone, heathcare professionals should now be better able to write personalized prescriptions to optimize feeding of patients in the acute phase of critical illness or injury such as TBI. As such, the measurement of BES may represent the long sought biomarker for adequacy of clinical nutritional support. 79
Footnotes
Acknowledgments
Research supported by the UCLA Brain Injury Research Center and award PO1NS058489 from the National Institute of Neurological Disorders and Stroke (NINDS), a gift from CytoSport, Inc. of Benicia, CA.
Author Disclosure Statement
GAB had a financial interest in CytoSport, Inc. For the remaining authors, no competing financial interests exist.