
Abstract
Diabetes prevalence achieved 470B in 2021. Diabetics are looking for foods that allow them to better manage the postprandial glycemia. Owing to its large amylose fraction, pea starch may contribute to formulate recipes with a lower glycemic index (GI). This study measured the rapidly, slowly digested and resistant fractions in pea starch and in a powder mix recipe. Starch fractions were determined according to the Englyst methodology. A nonblind repeat measure crossover design trial in healthy humans was used to study the GI of pea starch and maltodextrin powder mix recipes against glucose. Gastrointestinal symptoms were measured. Thirteen healthy volunteers aged 18–60 years with body mass index <30 kg/m2 and fasting blood glucose <6.1 mmol/L participated in the study. They consumed 25 g available carbohydrate portions of the test products. Blood glucose was measured at −5 and 0 min before consumption till 180 min after starting to eat. The slow digestible starch (SDS) content of native pea starch was 30% of the total starch content. The pea-based powder mix recipe contained 25% SDS in comparison with 9% for the maltodextrin-based recipe. The glucose response after pea starch was significantly lower compared with maltodextrin. The glucose response after pea starch recipe was significantly lower compared with maltodextrin recipe. There was no significant difference in mean scores for well-being and gastrointestinal symptoms after consumption of pea starch and maltodextrin or between the two recipes. In conclusion, this study has demonstrated the presence of high SDS content in pea starch, which reduced postprandial glycemic response compared with maltodextrin. The pea starch recipe did not induce any negative gastrointestinal symptoms. Pea starch may, therefore, prove to be a beneficial ingredient in developing food products for improving glycemic control without undesirable side effects.
Introduction
Since 1990
The United States of America is among countries with the highest expenditure with USD 9505 per person affected by diabetes per year. 2 Although there are several factors that influence the development of type 2 diabetes, including both genetic and environmental, it is evident that the most influential effects are through lifestyle and behavioral influences commonly associated with urbanization. These include consumption of unhealthy foods and inactive lifestyles alongside sedentary behavior. Overconsumption of high fat, high sugar, hypercaloric diets and alcohol are the predominant dietary factors that affect the onset and development of type 2 diabetes. 3
In this context, high glycemic index (GI) carbohydrate consumption becomes problematic when they are rapidly digested in the small intestine. As a consequence, the postprandial glycemia increases very high and very fast inducing a strong pancreatic insulin response that when repeated over multiple meals, days, and years contributes to the onset of glucose intolerance, followed by insulin resistance and the associated increase in circulating insulin levels and finally the onset of type 2 diabetes. As carbohydrates are the main contributors to the daily energy requirements of a balanced diet, 4 reducing their glycemic impact ought to be considered as a way of preventing and reducing prevalence of type 2 diabetes.
High glycemic impact caused by high GI carbohydrates or high GI foods are unhealthy by inducing an exaggerated insulin response followed by delayed hypoglycemia and reactive increases in free fatty acids, which increase triglycerides and low-density lipoprotein-cholesterol whereas decreasing high-density lipoprotein-cholesterol. The greater insulin responses may increase body fat and weight and lead to insulin resistance and to exhaustion of endocrine pancreatic function and insulin release. Predicting the glycemic response and the insulin response of carbohydrate ingredients and foods is, therefore, of interest in the context of preventing type 2 diabetes. 5,6
In 1992, Englyst proposed a new carbohydrate classification according to their in vitro digestibility. The in vitro methodology allowed researchers to classify carbohydrates, especially starch, into three categories according to their ability to deliver glucose through the action of digestive enzymes: rapidly digestible starch (RDS), slow digestible starch (SDS), and resistant starch (RS) fractions. 7 The repeatability and reproducibility of the methodology were tested and the authors concluded that the SDS fraction content measured could identify slow release carbohydrates and predict their slow and low glycemic impact. 8 –10
There is a strong inverse correlation reported between the SDS content and the glycemic response of foods. 11 The Englyst methodology thus serves to screen new food ingredients especially carbohydrates and carbohydrate-rich food recipes to introduce to markets food innovations that can prevent type 2 diabetes or be useful solutions for individuals with type 2 diabetes. 12
Pea (Pisum sativum L.) is one of the most widespread and most cultivated annual legume crops in temperate regions as it is an excellent source of protein (15–30% dry matter), starch (50% dry matter) and micronutrients (zinc, iron, and vitamins). Its richness in amylose—between 20.7% and 33.7% of the total starch—makes the pea starch rich in the SDS fraction and contributes to a low impact on the postprandial glycemia. 13,14
Therefore, this study aimed to assess the composition of pea starch and a recipe based on pea starch to ascertain the different Englyst starch fractions, to measure the starch fractions content and to correlate it with the effect on GI and gastrointestinal symptoms in healthy individuals. To determine if pea starch can be qualified as a good source of slow digestible carbohydrates, and its concomitant potential role in the prevention of type 2 diabetes, a rapidly digesting carbohydrate maltodextrin and a recipe based on maltodextrin were used for comparison. As non-digestible carbohydrates such as resistant starch are known to cause gastrointestinal discomfort due to gas production following its fermentation in the large intestine, gastrointestinal complaints were recorded and evaluated.
Materials and Methods
Carbohydrates
Native pea starch (Pea Starch LN30®), anhydrous glucose, and Maltodextrin Glucidex®IT19 were processed by Roquette Frères (Lestrem, France). Maltodextrin IT19 is corn-based, obtained by enzymatic process (mean dextrose equivalent: 18.4, average Mw: 9300).
Powder mix recipes
The composition and nutrition information for the pea starch-based recipe and the maltodextrin-based recipe are given in Tables 1 and 2.
Composition of Pea Starch-Based Powder Mix Recipe and Maltodextrin-Based Powder Mix Recipe
Nutrition Information for the Pea Starch-Based Powder Mix Recipe and the Maltodextrin-Based Powder Mix Recipe
To prepare the powder mix recipes, all the ingredients were blended in a TURBULA® Blender for 5 min. To prepare the pea starch-based final beverage, 46.7 g of the recipe was weighed and combined with 230 mL of water in a shaker followed by shaking for 30 sec. To prepare the maltodextrin-based final beverage: 39.7 g of the recipe was weighed and added with 230 mL of water in a shaker followed by shaking for 30 sec.
In vitro testing by Englyst method
The starch profile of Pea Starch LN30 and GlucidexIT19 maltodextrin was determined according to an adaptation of the Englyst methodology, 7 with slight modifications. This procedure allows to measure different fractions of starch: RDS, SDS, and RS after enzymatic digestion.
To prepare the enzyme solution I, 10 g of porcine pancreatin α-amylase (P7545; Sigma-Aldrich) was suspended into 80 mL of osmotic water with magnetic stirring and then centrifuged for 10 min at 1500 g. Enzyme solution II contained 3.7 mL of amyloglucosidase solution (A7095; Sigma-Aldrich) and 4.3 mL osmotic water. Enzyme solution III was composed of 50 mg of invertase (I-4504; Sigma-Aldrich) mixed into 6 mL of osmotic water for 10 min. The enzymatic cocktail was obtained by mixing 54 mL of Enzyme solution I with 6 mL of Enzyme solution II and 4 mL of Enzyme solution III.
Eight hundred milligrams of starch sample was dissolved in 20 mL of rehydrated guar-gum acetate buffer solution (2.5 g/L of guar gum, 0.1 M of sodium acetate, pH 5.2, and 4 mM CaCl2) at 37°C under agitation. After addition of 5 mL of enzymatic cocktail, the solution was incubated for 120 min at 37°C. Aliquots of the samples were taken at 0, 20, and 120 min, added into ethanol solution (66%) and centrifuged at 1500 g for 3 min. Glucose was measured within the supernatant using glucose oxidase/peroxidase reagent. The results were expressed as RDS = (glucose at 20 min − glucose at 0 min) × 0.9; SDS = (glucose at 120 min – glucose at 20 min) × 0.9 and RS = (total starch – glucose at 0 min) × 0.9) – (RDS + SDS).
In vivo GI testing
Study design
A nonblind repeat measure crossover design trial was used to study the GI of Pea Starch LN30, GlucidexIT19 Maltodextrin, a pea starch powder mix recipe, and a maltodextrin powder mix recipe against a reference of glucose. The participants acted as their own controls and they were randomly assigned to test each product against the reference glucose using a pseudo-random number generator. 15 The trial was conducted by the Oxford Brookes Centre for Nutrition and Health at Oxford Brookes University, United Kingdom. Ethical approval for the study was obtained from the University Research Ethics Committee (UREC) at Oxford Brookes University (UREC Registration No. 140806). All participants gave written informed consent before participation.
Participant recruitment and screening
Recruitment of participants was made through announcements in lectures and posters distributed on notice boards throughout Oxford Brookes University and through personal networks. Sixteen healthy participants (seven male and nine female) were recruited from the staff and students from Oxford Brookes University.
Before recruitment, all potential participants completed a brief health questionnaire and they were excluded from the study if they met any of the following criteria: aged <18 or >60 years, pregnant or lactating, body mass index (BMI) ≥30 kg/m2, fasting blood glucose value >6.1 mmol/L, known food allergy or intolerance, medical condition(s) or medication(s) known to affect glucose regulation or appetite and/or which influence digestion and absorption of nutrients, known history of diabetes mellitus or the use of antihyperglycemic drugs or insulin to treat diabetes and related conditions, major medical or surgical event requiring hospitalization within the preceding 3 months, use of steroids, protease inhibitors, or antipsychotics (all of which have major effects on glucose metabolism and body fat distribution).
In addition, participants were excluded if they were unable to comply with experimental procedures or did not follow GI testing guidelines.
Anthropometric measurements
Anthropometric measurements were made in the fasting state during the first session. Height was recorded to the nearest centimeter using a stadiometer (Seca Ltd., United Kingdom), with participants standing erect with head positioned in the Frankfurt plane and without shoes. Body weight was recorded to the nearest 0.1 kg, with participants wearing light clothing and no shoes. BMI was calculated using the standard formula: weight (kg)/height (m) 2 . Body fat percentage was measured using a body composition analyzer (Tanita BC-418 MA; Tanita UK Ltd.).
Test foods
The Pea Starch LN30 (32.66 g), Glucidex IT19 Maltodextrin (26.32 g), the Pea Starch LN30 powder mix recipe (46.7 g), the Glucidex IT19 Maltodextrin recipe (39.7 g), and the reference food (glucose-monohydrate 27.48 g) were tested in equivalent carbohydrate amounts (25 g). All reference and test samples were mixed and served with 250 mL of water.
Protocol
The protocol used was carried out in accordance with ISO standards. 16 On the day before the test, participants were asked to restrict their intake of alcohol and caffeine-containing drinks and to restrict their participation in intense physical activity (e.g., long periods at the gym, excessive swimming, running, and aerobics). Participants were also told not to eat or drink after 9 pm the night before a test, although water was allowed, in moderation.
The Pea Starch LN30, GlucidexIT19 Maltodextrin and the powder mix samples were tested once in random order on separate days and the reference food was tested three times over the study on separate days, with at least a 1-day gap between measurements to minimize carryover effects. Participants were studied in the morning before 10 am after a 12-h overnight fast. They consumed the reference food/test samples at a comfortable pace, within 15 min and remained sedentary during each session.
Blood glucose measurements
Blood samples were taken at −5 and 0 min before consumption of the reference food/test samples and the baseline value taken as a mean of these two values. The reference food/test samples were consumed immediately after this and further blood samples were taken at 15, 30, 45, 60, 90, 120, 150, and 180 min after starting to eat. Blood was obtained by finger-prick using the Unistik®3 single-use lancing device (Owen Mumford). Before a finger-prick, participants were encouraged to warm their hand to increase blood flow. Fingers were not squeezed to extract blood from the fingertip as this may dilute with plasma. Blood glucose was measured using the HemoCue Glucose 201 DM analyzer (HemoCue® Ltd.), which was calibrated daily using control solution from the manufacturer.
Calculation of GI
The incremental area under the curve (iAUC) for blood glucose response was calculated geometrically by applying the trapezoid rule ignoring the area beneath the baseline. 17 The iAUC for each test sample for each participant was expressed as a percentage of the mean iAUC for the reference food consumed by the same participant:
GI = (iAUC test sample/iAUC reference food) × 100.
The GI value of the test products was calculated as the mean for the whole group.
Gastrointestinal symptoms
The Gastrointestinal Symptoms Questionnaire (GSQ) comprised six items designed to assess well-being and the intensity of gastrointestinal symptoms experienced by participants at the end of each test session. For each question, participants marked their strength of feeling on a 100 mL visual analog scale (VAS). These lines were anchored at the left and right ends with opposing labels, “absent” and “severe,” respectively. The GSQ items were well-being (What is your general feeling of well-being now?), nausea, abdominal cramping, distension, flatulence, and diarrhea. VAS ratings were quantified by measuring in millimeters the distance between the left end of the scale and the marked point.
Statistical analysis
Data are presented as mean, standard deviation (SD), and standard error of the mean (SEM) values. The ISO standards recommend a sample size of 10 participants to determine GI of food samples. A sample size of 14 was shown to have a power of 80% to detect a difference in glycemic response of 19% in a previous study. 18 Therefore, in this study, 16 participants were tested. Data were analyzed using the IBM Statistical Package for the Social Sciences 25 (SPSS, Inc., Chicago, IL, USA).
Before statistical analysis, the normality of the data was tested using the Shapiro-Wilk statistic. A paired t-test or Wilcoxon signed rank test was used to compare the change in blood glucose, well-being, and gastrointestinal symptoms between Pea Starch LN30 versus GlucidexIT19 Maltodextrin and the pea starch recipe versus the maltodextrin recipe. Statistical significance was set at P < .05 for all tests.
Results
In vitro testing by Englyst method
The amount of RDS, SDS, and RS in Pea Starch LN30 were 16%, 30%, and 54%, respectively, whereas GlucidexIT19 Maltodextrin showed higher RDS content (93%) and much lower SDS (1%) and RS (6%) (Table 3). The maltodextrin-based powder mix recipe showed a higher percentage of RDS (72%) compared with the pea starch-based recipe (17% RDS).
Starch Profile of Native Pea Starch LN30, GlucidexIT19 Maltodextrin, Pea Starch-Based Powder Mix Recipe and Maltodextrin-Based Powder Mix Recipe
RDS, rapidly digestible starch; RS, resistant starch; SDS, slow digestible starch.
In vivo GI testing
Participant characteristics
Sixteen participants were recruited of which two participants did not complete the study. One outlier with a GI value outside the range of ±2 SD from the mean GI value was excluded as per the ISO standards. 16 Table 4 presents the physical characteristics of the 13 participants who completed the study.
Anthropometric Characteristics (Mean ± Standard Deviation) of the Study Population (n = 13)
BMI, body mass index.
Glycemic response and GI
Figure 1 illustrates the mean blood glucose levels and mean change in blood glucose for reference glucose, Pea Starch LN30, and GlucidexIT19 Maltodextrin. There was a significant difference (P < .05) in the change in blood glucose between Pea Starch LN30 and GlucidexIT19 Maltodextrin at 15, 30, 45, 90, 120, 150, and 180 min after consumption. The glucose response after Pea Starch LN30 was significantly lower (P < .05) at 15 (−1.3 mmol/L), 30 (−2.5 mmol/L), and 45 min (−1.7 mmol/L) compared with GlucidexIT19 Maltodextrin.
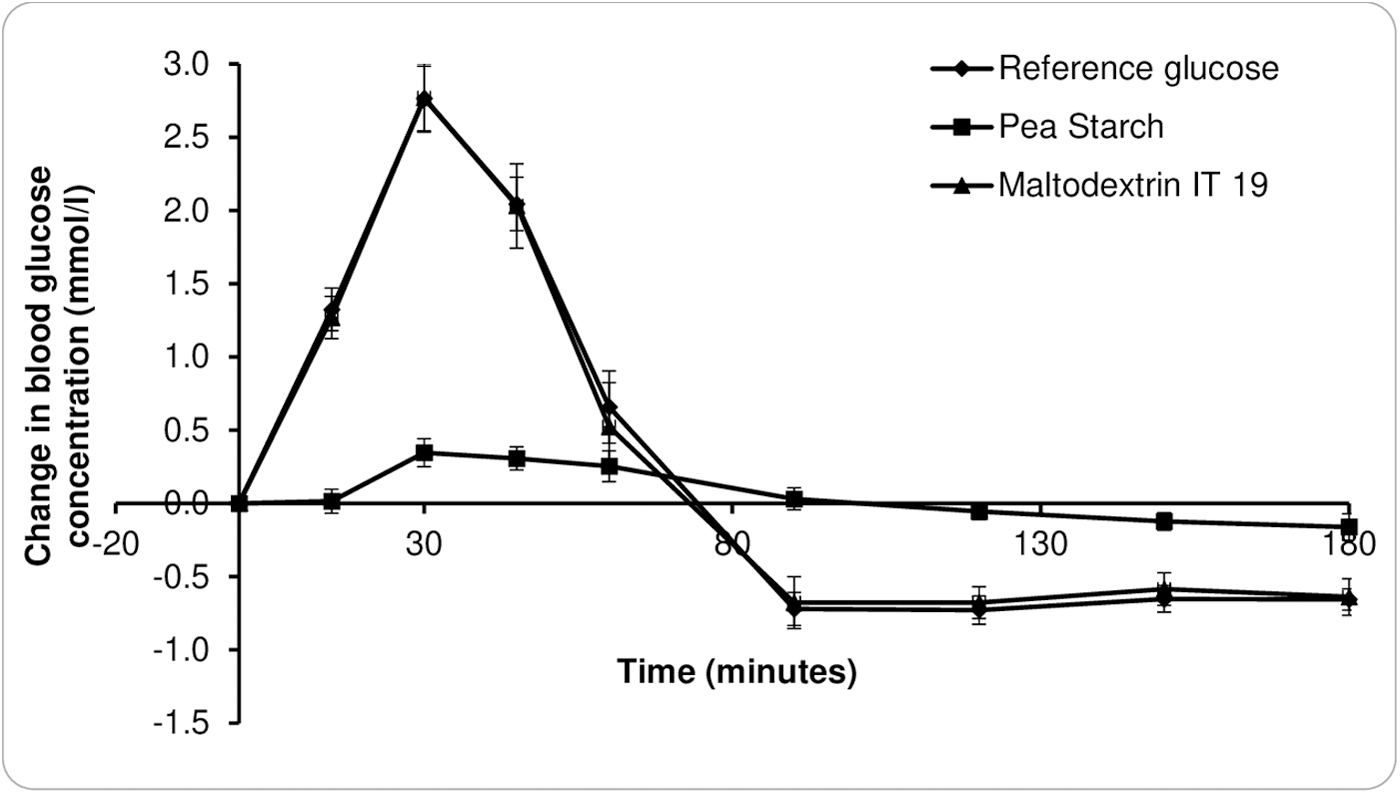
Glycemic response curves for glucose, Pea Starch LN30®, and IT19 Maltodextrin. Data are presented as mean and SEM (n = 13). SEM, standard error of the mean.
There was no difference at 60 min (−0.2 mmol/L); however, the blood glucose levels increased sharply after GlucidexIT19 Maltodextrin consumption and then dropped significantly lower than Pea Starch LN30 below the baseline at 90 (−0.7 mmol/L), 120 (−0.6 mmol/L), 150 (−0.5 mmol/L), and 180 min (−0.4 mmol/L). The actual peak blood glucose for pea starch was 4.9 mmol/L compared with 7.3 mmol/L for maltodextrin showing a reduction of 2.4 mmol/L.
Figure 2 illustrates the mean blood glucose levels and mean change in blood glucose for Pea Starch LN30 recipe and GlucidexIT19 Maltodextrin recipe. The change in blood glucose after consumption of the Pea Starch LN30 recipe and GlucidexIT19 Maltodextrin recipe was significantly different (P < .05) at 15, 30, 45, 90, 120, and 180 min. The glucose response after Pea Starch LN30 recipe was significantly lower (P < .05) at 15 (−1.1 mmol/L), 30 (−1.8 mmol/L), and 45 min (−0.9 mmol/L) compared with GlucidexIT19 Maltodextrin recipe.
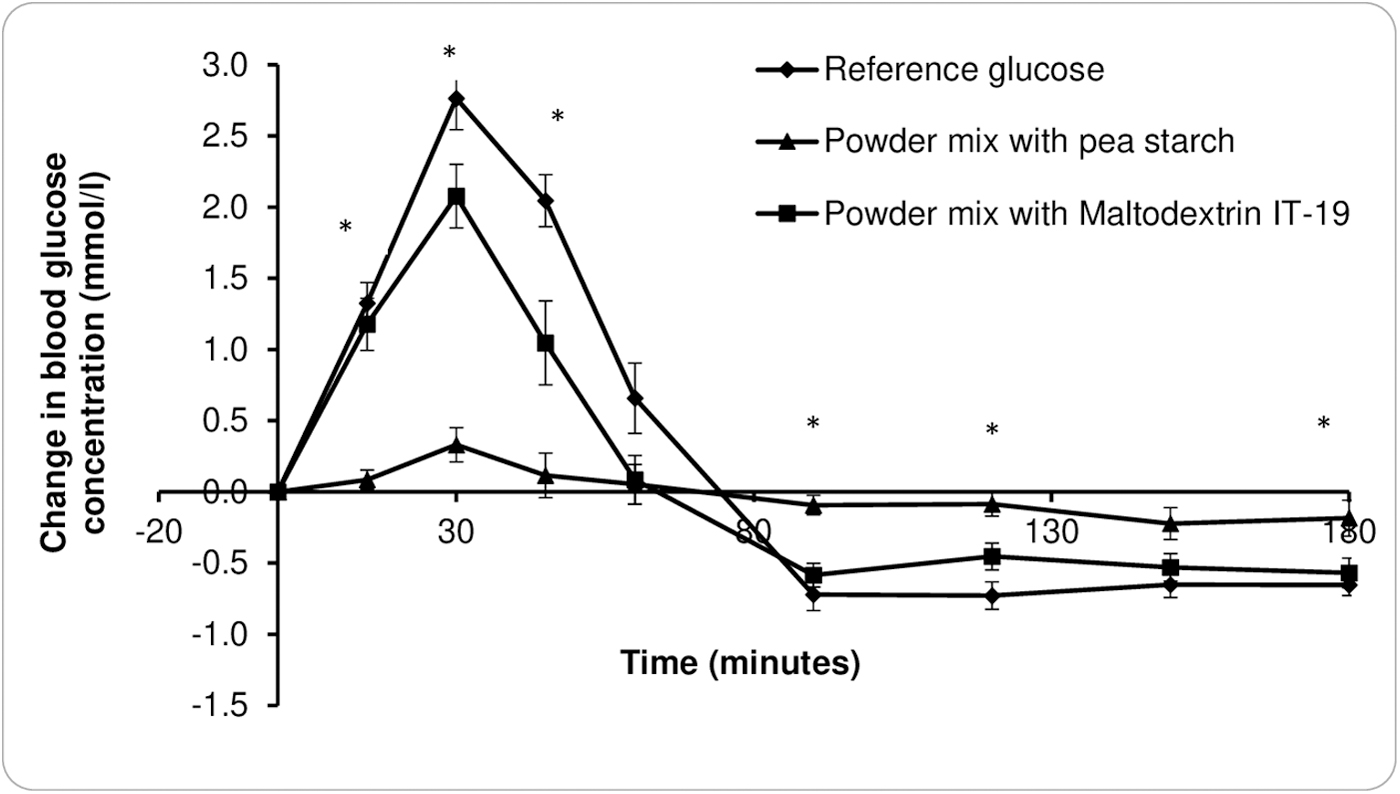
Glycemic response curves for Pea Starch LN30® recipe and Glucidex®IT19 Maltodextrin recipe. Data are presented as mean and SEM (n = 13).
There was no difference at 60 and 150 min (−0.3 mmol/L); however, the blood glucose levels increased sharply after GlucidexIT19 Maltodextrin recipe consumption and then dropped significantly lower than Pea Starch LN30 recipe below the baseline at 90 (−0.5 mmol/L), 120 (−0.4 mmol/L), and 180 min (−0.4 mmol/L). The actual peak blood glucose for pea starch recipe was 5.0 mmol/L compared with 6.6 mmol/L for maltodextrin recipe showing a reduction of 1.6 mmol/L.
The iAUC 180 value (mean ± SEM) for Pea Starch LN30 was significantly lower than the GlucidexIT19 Maltodextrin (24.8 ± 6.4 vs. 106.2 ± 10.4; P = .001). Similarly, the iAUC 180 (mean ± SEM) value for Pea Starch LN30 recipe was significantly lower than the GlucidexIT19 Maltodextrin recipe (21.9 ± 4.1 vs. 69.5 ± 9.2; P = .001). The GI value (mean ± SEM) of Pea Starch LN30 (23 ± 6.6) and the Pea Starch LN30 recipe (18 ± 3.7) were both low. The GlucidexIT19 Maltodextrin had a high GI value (100 ± 8.6) and the GlucidexIT19 Maltodextrin recipe (66 ± 8.1) had a medium GI value.
Gastrointestinal symptoms
Table 5 shows the mean scores for well-being and gastrointestinal symptoms at the end of the test sessions after consumption of Pea Starch LN30, GlucidexIT19 Maltodextrin, Pea Starch LN30 recipe, and GlucidexIT19 Maltodextrin recipe.
Mean (±Standard Deviation) Gastrointestinal Symptoms Questionnaire Scores (mm) After Consumption of Pea Starch LN30, GlucidexIT19 Maltodextrin, Pea Starch LN30 Recipe and GlucidexIT19 Maltodextrin Recipe (n = 13)
There was no significant difference (P > .05) in mean scores for well-being and gastrointestinal symptoms after consumption of Pea Starch LN30 and GlucidexIT19 Maltodextrin or between the two recipes.
Discussion
Since 1980, diabetes has dramatically increased worldwide. 35 million cases were reported in 198519 mostly type 1 diabetes in comparison with 463 million today, 90% being type 2 diabetes. 20 Among all factors evoked by scientific experts, the decrease in energy expenditure and increase in energy input has been described as those having the major impacts. At the same time, the dietary habits changed a lot in Western countries and in Asian countries moving from traditional meal to more processed or even ultraprocessed foods. Those foods rich in fats, sugars, and highly digested starchy ingredients induce a strong impact on the postprandial glycemia.
The scientific work done by Englyst in the 90s has made it possible to predict the speed of digestion of starchy foods and thus the impact on the postmeal glycemia. 7 Three fractions were proposed according to the in vitro starch digestion: the RDS (rapidly digested starch) fraction digested in 20 min, the SDS (slowly digested starch) fraction digested in between 20 and 120 min and the RS fraction that is not digested 2 h after the beginning of the experiment. A special focus on this RS fraction will be made afterward.
The objective of this study was to test if the native pea starch could be used to propose recipes with claims based on slow digestibility and low GI. The research has developed recipes of powder mix for ready to drink beverages that can be consumed as healthy snack alternatives or during sports sessions.
In our experiment we confirmed that raw pea starch has a very low RDS fraction (16%). Potato has been shown to have 6%, corn starch 23%, waxy maize 42%, and wheat starch 43% RDS, respectively (unpublished). This weak digestibility can be explained by the semicrystalline starch structure with concentric layers of amorphous and crystalline regions, the amylose content, and the size of the granules in relation with surface characteristics. All these features confer resistance to amylase enzyme, which delays the glucose release from starch. These positive properties disappear with the cooking of starch, and in cooked starch, digestibility is very high due to the loss of amylase resistance. 10
This study shows that the native pea starch contains 30% SDS and 54% RS according to the in vitro testing by Englyst method. This implies a high dietary fiber content in pea starch as RS is known to act as dietary fiber. However, when determined with the current consensual RS AOAC 2002.02 methodology, 21 the dietary fiber content (represented by type 2 RS) of the native pea starch 22 was determined as 11%. This suggests an overestimation of RS by Englyst method, which may be attributed to the fact that the current EU and CODEX dietary fiber definitions and approved methodologies for dietary fiber determination came after the first publications by Englyst. 7
Therefore, it is recommended to use AOAC protocol to precisely measure the RS fraction. With 11% RS considered as dietary fiber, meaning the starch fraction that is not at all digested in the upper part of the small intestine, the slowly digested fraction of the pea starch can be estimated to be 73% (100—11% RS—16% RDS). This explains the very weak postprandial glycemic response, which might consequently trigger a very weak insulin response.
The glycemic response result reflects the slow digestion feature of native pea starch leading to a very limited increase in blood glucose, with <0.5 mM/L increment. The shape of the curve with a plateau between 30 and 60 min reflects the long-lasting digestion pattern of the native starch in comparison with maltodextrin, which induced a very high excursion of blood glycemia that returns to baseline from 30 min after ingestion. With maltodextrin, there was a hypoglycemic period starting 75 min after ingestion and lasting >90 min, which was not observed with the pea starch.
This hypoglycemic effect of maltodextrin may be due to the long-lasting insulin production associated to its prolonged effects. We assume that pea starch may not promote strong insulin response or even potentially negligible insulin secretion as observed with the shape of the glycemic response curve due to its very low RDS content.
In a study published in 2020, Petropoulou et al. 19 explained that the different glycemic and insulinemic responses observed between two P. sativum lineages were due to their relative amylose content conferring them different digestibility pattern. The lowest glucose availability in the duodenal space was associated to the lowest gastric inhibitory polypeptide incretin release, which may explain the lower insulin levels. According to Pilichiewicz et al. 20 there is a positive correlation in between the duodenal space glucose concentration and the blood insulin, which supports the hypothesis that in our study the insulin excursion might be lower with the pea starch and the pea starch recipe in comparison with high GI test foods.
In this study, the pea starch-based recipe elicited an attenuated glycemic response compared with the maltodextrin-based recipe. This effect may be attributed to the low RDS content and high RS and SDS contents of pea starch identified during in vitro digestion. Previous studies have reported 21 –23 low GI values for foods that contained high SDS contents of 26–28 g/100 g. 22 –24
Food products developed using 25–30 g of a commercial SDS product (a blend of tapioca flour and corn starch) have previously demonstrated a 50% reduction in GI values compared with control products without SDS. 18 In this study, the reduction in GI was more pronounced, potentially due to the presence of RS and higher SDS content of 73% as mentioned earlier. Therefore, the recipe, which included 51% of pea starch consisted of ∼5.6 g/100 g of RS and 37 g/100 g SDS.
Pea starch has reduced digestibility compared with starches in cereals and potatoes due to its intermediate amylose content. Moreover, the starch granules are separated by cell wall structures that reduce access to amylase enzymes. 14 The aforementioned characteristics may have contributed to the low GI value of the pea starch recipe. The digestibility of different pea starch components may change during cooking, thereby leading to an increase in the RDS fraction. 25 However, the recipe used in this study is expected to have retained the low RDS content due to the absence of thermal processing.
The high percentage of SDS associated to the low glycemic profile observed in the healthy individuals are indications that pea starch is digested throughout the small intestine, from duodenum to ileum where brush border enzymes and glucose transporters are located. The glucose efflux from the intestine to liver takes place slowly and the portal glucose concentrations may be much lower than with rapidly digestible and absorbable carbohydrates such as sugar, maltodextrins, and high GI foods. The lower glucose blood influx may limit the insulin secretion and the production of insulin by the pancreatic B cells.
As insulin inhibits fat oxidation especially during exercise, low GI foods allow an increased utilization of fats and preservation of the glycogen stores. Wu and Williams 26 found that during exercise the overall fat oxidation is higher after consuming a low GI bar compared with a high GI one. In this study, a low insulin response was observed. The very low digestibility kinetics of the pea starch attested by the shape of the glucose response seems to be adapted to sportsman and sportswoman during endurance exercise. The slow glucose delivery associated to a low insulin response may be profitable to people in preparation to endurance sessions and high-intensity exercise. 27,28
Nondigestible carbohydrates such as RS are known to cause gastrointestinal discomfort due to gas production after its fermentation in the large intestine. 26 However, in this study, there were no differences in the gastrointestinal symptoms after pea starch product compared with the maltodextrin product. This is in agreement with Seewi et al. who reported that pea starch alone did not cause bloating or flatulence like pea flour that consisted of oligosaccharides and fiber. 28,29
Furthermore, this result supports our earlier assumption on the presence of higher SDS content and lower RS content in pea starch. The gastrointestinal tolerability of pea starch is beneficial for product development to promote consumer acceptance. 30 The SDS fraction is of importance because it indicates the weak postprandial excursion of glucose, which may have long-term beneficial effects due to a weaker insulin response. Finally, the presence of carbohydrates at the end of the small intestine may trigger different neuroendocrine responses that may promote satiety feelings through the gut brain axis. 28
A limitation of the study is that only 25 g available carbohydrate serving sizes were tested for pea starch and pea starch recipe; therefore, the effects cannot be generalized to higher doses of pea starch. Moreover, there may be further changes to the digestibility, glycemic response, and gastrointestinal response after thermal processing of pea starch, which was not explored in this study. Future studies may investigate the incorporation of lower doses of pea starch in different food products aimed at individuals at risk of type 2 diabetes or those looking for ready to drink products. Higher doses of pea starch may not be palatable as a raw ingredient.
In conclusion, this study has demonstrated the presence of high SDS content in pea starch, which reduced postprandial glycemic response compared with maltodextrin, which is a rapidly digested carbohydrate. Irrespective of the high levels of SDS, the pea starch recipe did not induce any negative gastrointestinal symptoms. Pea starch may, therefore, prove to be a beneficial ingredient in developing food products for improving glycemic control without undesirable side effects.
Footnotes
Author Disclosure Statement
C.P., F.D., S.G., and D.W. are employees of Roquette who funded the studies.
Funding Information
This study is supported by Roquette Frères.