
Abstract
Freshman-15 is a phenomenon of first-year university students resulting in weight gain partly due to new cafeteria eating patterns and stress. This study determined if a premeal walnut snack alters planned eating behavior and mealtime nutrient intake during a subsequent buffet-model meal. Healthy university students (n = 36; 18.1 ± 0.5 years; body mass index: 23.6 ± 3.9) received three treatments (90 min premeal) in randomized order on 3 consecutive days: (1) snack of 190 Cal (1 oz) of walnuts (WS), (2) snack of 190 Cal of gummy candy (GS), or (3) no snack (NS; control) before a standard cafeteria dinner (1760 Cal). Visual analog scale (VAS) surveys were administered before and after dinner, and caloric intake was determined. Premeal VAS desire to eat was lower after WS and GS than NS, whereas the sense of hunger and sense of fullness were higher after WS and GS compared with NS. Postmeal VAS was not different between treatments. Mealtime calories, total fat, saturated fat, cholesterol, protein, sodium, fiber, and sugar consumed after WS were significantly less than NS. Total fat and sodium consumed after GS did not significantly differ from NS. Mealtime total fat, sodium, and fiber for WS were significantly less than GC, and a trend was observed for total calories. Differences in calorie intake were not observed between treatments when snack calories were included as part of the mealtime caloric intake. These findings could be helpful for promoting WS and to a lesser degree GS for increased satiety before meals possibly leading to reduced food intake during dinner by university students.
INTRODUCTION
Weight management is problematic for many university students in the United States. Those who attend college at a university tend to gain more weight than those who do not. While this phenomenon is called the “Freshman 15,” referring to a weight gain of 15 lbs, the typical weight gain within the first year is generally between 1.1 and 3.4 kg (2.4–7.5 lbs). 1 –4 Absolute weight, body mass index (BMI), percent body fat, fat mass, and waist circumference all tend to increase more rapidly with college freshman students relative to sophomores. 2 Anxiety about developing a pattern of weight gain that continues not just through the university years, but after graduation, is also important regarding social perceptions and future health risks (e.g., anorexia) related to present and future weight gain. 5
Typical American university cafeteria-style meals are provided ad libitum, with all-you-can-eat style food item selection, which can lead to the tendency for overeating and unwanted weight gain. In 2014, 68% of dining halls on university campuses provided an all-you-can-eat option for buffet-style meals. 6 Up to 20% of weight gain can be attributed to university cafeteria-style meals and consumption of junk food, with personal snack choices leading to an additional 20% of weight gain. 3 It is well known that improved dietary quality is predictive of reductions in weight gain during the transition from adolescence to adulthood. 7
It is widely accepted that nuts are nutrient and energy dense, and when consumed as a snack, they decrease the desire to eat and energy intake at a subsequent meal. 8 Specifically walnut consumption by elderly, middle aged, and overweight persons is known to be associated with improvements in weight management, blood lipid profiles, risk of heart disease, and cognitive function. 9 –13 These prior studies 9 –13 focused on older individuals whose BMI could be linked to eating habits and weight gain established in their late teens and early 20s. 7 Young individuals and adults could benefit from greater nut consumption but have a per capita nut intake of 5.77 pounds/year and 5.63 pounds/year, respectively, most of which is represented by peanuts. 14 This is surprisingly low given the weight maintenance concerns in this same demographic, potential weight improvements observed in older individuals, and that the United State Department of Agriculture Dietary Guidelines promote a dietary pattern that includes 5 oz of nuts, seeds, or soy each week. 15
Little is known about how nuts eaten as a snack, walnuts specifically, could affect eating intention or caloric intake of healthy freshman university students at a subsequent meal. The present study of young university students examined the effect of premeal walnut ingestion before exposure to a hypercaloric meal with standardized food items, and how this snack could alter eating intent and mealtime food ingestion habits. The meal in the present study modeled a university food service buffet-style meal where students select more calories than they intended to ingest because this is the eating model commonly encountered by these same students.
METHODS
Subjects
Following approval by the Winona State University Institutional Review Board (887840–1), subjects were recruited using on campus advertising. Subject requirements included being a healthy nonsmoking, university student between the ages of 18 and 22 years. Study exclusions were nut allergies, use of medications for control of blood lipids or blood glucose, diagnosed eating disorders, medications for inflammation/arthritis (i.e., ibuprofen or corticosteroids), use of drugs/alcohol for 12 h before the study or during the 3 days of the study, and treatment for liver disease, cancer, or heart disease within 6 months before the study. Respondents attended a prestudy meeting to evaluate study exclusions after which informed consent was obtained, height and weight measured, and prestudy blood glucose was determined to help subjects become comfortable with blood glucose measurement (finger prick) and to screen for preexisting diabetes. A total of 50 subjects participated in the screening session and those chosen to participate received monetary compensation for each day of participation. The study and participant flow is described in Figure 1.
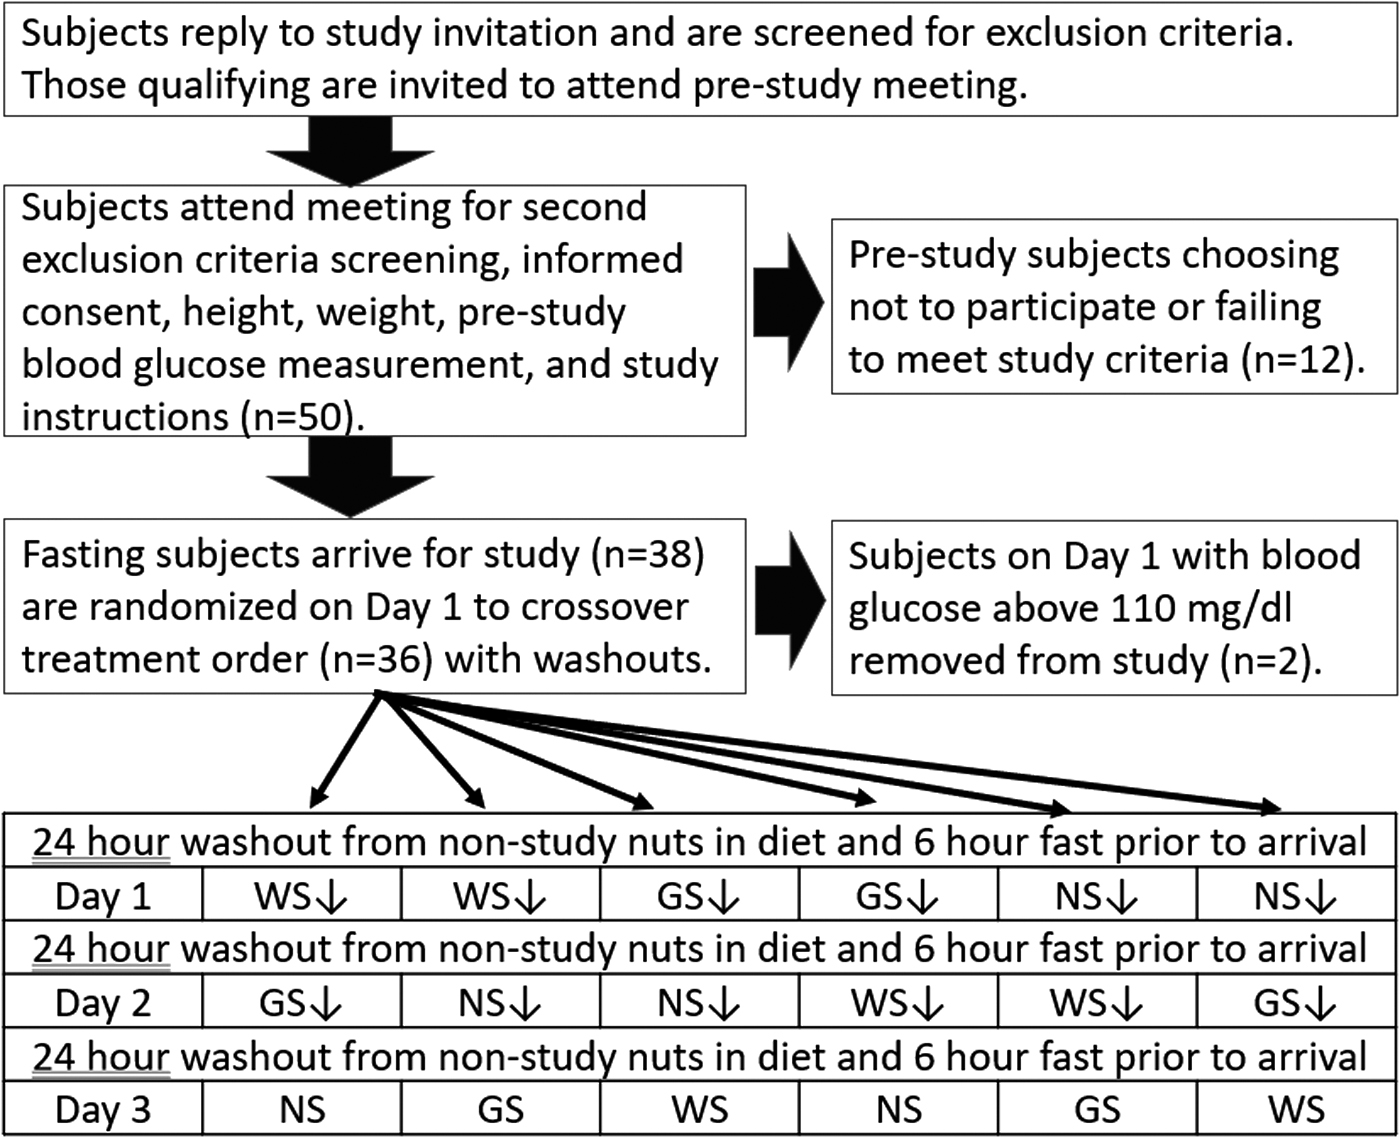
Study and participant flow.
Premeal snack treatments
Upon reporting to the investigators between 16:00 and 17:00 for the study, a blood glucose test on each day to validate subject compliance with a 6-h prestudy fast and subjects agreed to not ingest nuts for 24 h before arrival or between study visits. A prestudy blood glucose greater than 110 mg/dL was interpreted as failure to fast or presence of diabetes and study exclusion. Subjects received premeal interventions while sitting quietly in three separate rooms on a consecutive Tuesday, Wednesday, and Thursday (September 19, 20, and 21, 2017). Each subject received each of the three treatments in randomized order for the 3 consecutive days of the study in a randomized, single crossover design with a 24 h washout between each treatment: (1) walnut snack (WS; 190 Cal; 29 g), (2) gummy candy snack (GS; 190 Cal; 42 g), or (3) no snack (NS; control; 0 Cal). The three treatments were administered 90 min before presentation with a standardized hypercaloric meal on a beige (35 × 45 cm) meal tray (Table 1) with ingestion starting at times between 17:00 and 18:30 on each day of participation (evening meal). The standardized presentation modeled a buffet-style meal in a college cafeteria where subjects would be provided with more food (seven items) and calories (1760) than they would intend to ingest. The 90-min premeal timing of the snack was chosen to represent a time when students of this demographic would have their blood glucose return to near normal following a glycemic challenge. 16
Meal Items and Nutrient Content of Standardized Hypercaloric Buffet-Model Meal (1760 Cal) Provided to Participants on Three Consecutive Evenings 90 Min After Snack
The WS consisted of a single serving (1 oz; 29 g) of shelled English walnuts (Juglans regia) pieces containing 18 g total fat, 1.5 g saturated fat, 13 g polyunsaturated fat, 2.5 g monounsaturated fat, 4 g total carbohydrates, 1 g total sugars, 2 g fiber, 4 g protein, and 190 Cal provided by the California Walnut Commission. The isocaloric GS (Market Pantry, Target Inc., Minneapolis, MN, USA) contained 42 g total carbohydrate, 23 g total sugars, and 3 g protein. Gummy candy was chosen as the control snack because students readily eat them, mastication effort (chewing) is required before swallowing, and the two snacks (WS and GS) had a similar protein content. Food serving volume can affect satiety, hunger, and gastric responses, and the physical volume of WS (31.7 ± 0.6 mL) and GS (29.4 ± 1.0 mL) was within 7% of being isovolumetric (by water displacement).
Subjects were required to ingest the complete snack within 5 min of presentation and provided with a 50 mL cup of water to swallow with the snack; subjects in the control group consumed the same 50 mL cup of water with no snack. Each of the three treatment rooms were divided by a curtain into two equal halves. Subjects ate their snack and waited on one side of the room and were escorted to the other side for meal ingestion to minimize the effect that the sight or smell of food could have on food ingestion at mealtime.
Visual analog scale analysis
Assessments for hunger, desire to eat, fullness, and eating intent in next 30 min were measured using a visual analog scale (VAS) to determine if premeal snack choice could influence intended meal ingestion habits (Fig. 2). The VAS survey was administered 5 min before ingestion and 5 min after meal ingestion on each study day. Subjects placed an “X” on a 1–10 rating scale, with 1 representing low/very little and 10 denoting high/quite a bit regarding their feeling toward each item. Surveys were scored by the investigators in treatment blind manner following study completion.
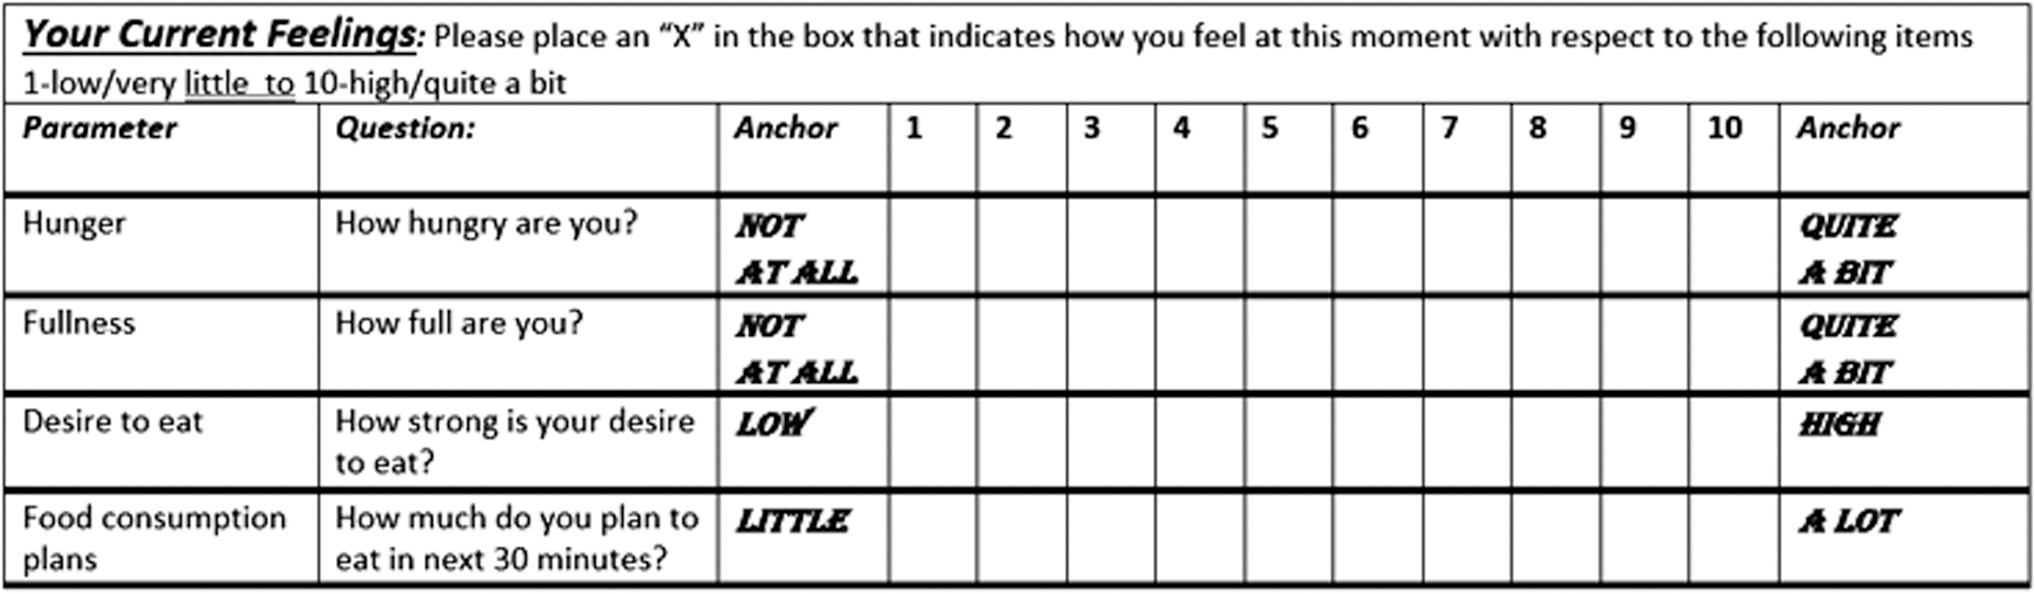
VAS eating intent survey administered to subjects 5 min before presentation of a hypercaloric meal and 5 min after meal completion. VAS, visual analog scale.
Analysis of meal ingestion habits
Subjects were escorted from one to the other side of a room divider 90 min after snack ingestion and VAS completion, where their meal was presented on a tray. Subjects were given 15 min to consume their standard meal to maintain uniformity with respect to meal duration across subjects and study day. After meal completion, their tray was removed and a postmeal VAS survey was completed within 5 min. A digital image of the postmeal tray with items in uniform positioning was collected at a 25° angle and 0.5 m distance for analysis of nutrient intake at a later time.
One week after study completion, the collected postingestion meal tray images were projected on a 2.5 × 1.5 m screen in treatment blind manner. The four investigators were given 4 min to estimate the percent of each meal item that was consumed from each tray with no collaborative or discussion among the investigators before value assignment and investigators remained blinded with respect to treatment assignment. The average of these four values was considered the amount of each item ingested. Calorie and nutrient content of each item were provided for the study by the campus food service provider (Chartwells Higher Education North America, Charlotte, NC, USA), and these values were used to determine the nutrient intake (Table 1). Chartwells did not include a breakdown of mono- and polyunsaturated fat content for these meal items. For example, if the subject ingested 75% of their Sierra Mist fountain soda (150 Cal in the 357 mL serving provided), they ingested 112.5 Cal.
A separate and similar validation trial was approved by the Winona State University Human Subjects Committee (1639980–1) and conducted to determine the accuracy of the visual estimates. Food trays were prepared as described previously (except for the use of 125.5 g of pepperoni pizza, not 245 g) and similarly presented to a separate group of nine female subjects; no suitable male subjects could be recruited. Food tray digital images were collected 10 min after meal completion, images were projected for 60 s, and percent leftover for each item was similarly estimated 30 min following meal completion. The gram weight of each food tray item was determined within 60 min of meal completion.
Statistical analysis
Data are expressed as least squares means and standard error. Analysis of variance was performed, with a protected F-test (P < .05) being the threshold for further statistical analysis. For each response variable, a model including subject, day effect, and treatment effects was fit to the data (BMI, sex, and age were also included as covariates). Tukey's honest significant difference test method was used for post hoc multiple comparisons whenever the day or treatment effect was significant. Paired t-tests were used to test for pre-to-post differences in the VAS outcomes for each treatment group separately. Differences were considered significant when P < .05. Intraclass correlation coefficients (ICC) were used to compare the estimates of food ingestion made visually from projected food tray images, with the weight of food leftover (grams). ICC values above 0.75 were considered good, and values above 0.90 are considered an excellent suggestion of agreement between measures. 17
RESULTS
There were 38 subjects enrolled in the study. On the first study day, two male subjects had blood glucose values above 110 mg/dL on arrival and were removed from further participation for presumed failure to fast or undiagnosed diabetes. The remaining 36 subjects (33 female and 3 male) completing the study were 18.1 ± 0.5 years of age, 167 ± 8 cm, 66.1 ± 12.7 kg, and had a BMI of 23.6 ± 3.9.
Effect of snack treatments on cognitive factors that are predictive of appetite and how much food would be consumed during the subsequent standardized hypercaloric meal is shown in Table 2. VAS scores for premeal perception of sense of fullness were highest following WS and lowest following NS, with WS (P < .001) and GS (P < .001) being significantly greater than when NS was consumed (Fig. 3). Premeal VAS for sense of hunger was significantly lower for WS (P = .019) and GS (P = .015) than NS. Premeal VAS for desire to eat was significantly lower for WS (P = .010) and GS (P = .011) than NS. The VAS for perception of eating intent in next 30 min was not affected by treatments. Postmeal sense of hunger, desire to eat, and eating intent in next 30 min decreased significantly following all three treatments (P < .001). Postmeal sense of fullness increased significantly relative to premeal following all three treatments (P < .001). There were no longer significant differences in postmeal VAS for sense of fullness, sense of hunger, desire to eat, or eating intent in next 30 min between WS, GS, and NS treatments (Table 2).
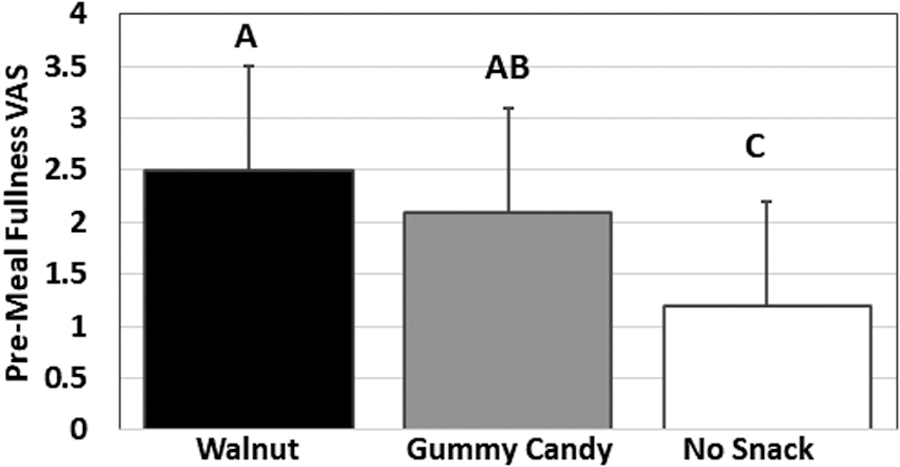
Ingestion of a walnut snack (190 Cal) and an isocaloric snack of gummy candy 90 min before presentation of a 1760 Cal meal increased the sense of premeal fullness relative to when no premeal snack was ingested. Data are expressed as LSM ± SE. Different superscript letters indicate significance within time for treatment item (P < .05). LSM, least squares means; SE, standard error.
Effect of a Premeal Snack of Walnuts (190 Cal), Isocaloric Gummy Candy, or No Snack (Control) on Factors Predictive of Appetite Quantified Using a Visual Analog Scale from 1-Low to 10-High
Data are expressed as LSM ± SE. Different superscript letters indicate significance within time for treatment item, and superscript # indicates significance between pre- and postmeal survey times (P < .05).
LSM, least squares means; SE, standard error; VAS, visual analog scale.
The hypercaloric standardized meal presented in this study modeled a university food service buffet-style meal and subjects ingested 59% of total calories in the 1760 Cal meal across all three treatments of this randomized, single crossover design with no subject ingesting the entire meal. Mealtime caloric consumption was lowest following premeal consumption of WS, which was significantly less than following NS (P = .008; Fig. 4 and Table 3), and the difference between WS and GS trended toward significance (P = .053). However, when the caloric value of the snack was included as part of the meal total calories, statistical significance for a treatment effect between treatments for total calories was not observed (P = .101).
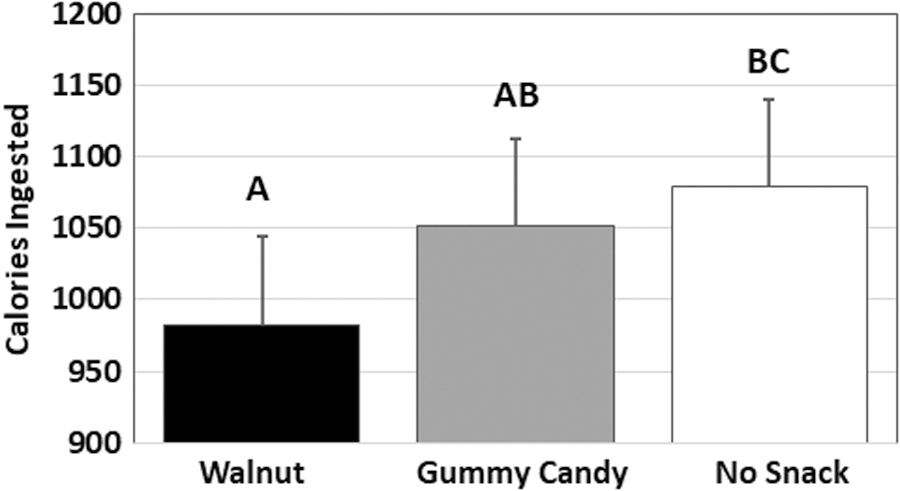
Ingestion of a walnut (190 Cal) snack 90 min before mealtime reduced total mealtime caloric intake from a 1760 Cal meal relative to no premeal snack. Data are expressed as LSM ± SE. Different superscript letters indicate significance within time for treatment item (P < .05).
Effect of a Premeal Snack of Walnuts (1 oz; 190 Cal) Isocaloric Gummy Candy, or No Snack (Control) on Subsequent Nutrient Intake Following a Standardized Meal Containing a Total of 1760 Cal
Data are expressed as LSM ± SE. Different superscript letters indicate significance within time for treatment item (P < .05).
Effects of the premeal snack on the nutrient density of the subsequent meal were measured (Table 3). Premeal WS ingestion led to a meal containing significantly less total fat than observed following GS (P = .020) or when NS (P = .006) was received before the meal. Mealtime saturated fat intake following WS was significantly less than NS (P = .013). Mealtime cholesterol intake following WS was significantly less than NS (P = .014). Mealtime protein intake following WS was significantly less than NS (P = .014). Mealtime sodium intake following WS was significantly less than GS (P = .037) and NS (P = .015); there was no significant difference between GS and NS. Mealtime fiber intake following WS was significantly less than both GS (P = .008) and NS (P = .019). Premeal snack had no significant effect on mealtime intake of sugar or total carbohydrates.
The statistical model used in this 3-day study allowed analysis of Type 3 tests for fixed effects. Sex was identified as a significant source of variation (P < .05) for intake of calories, total fat, sodium, fiber, and premeal VAS hunger and desire to eat. BMI was identified as a significant source of variation (P < .05) for cholesterol, sodium, protein, and premeal VAS fullness. Day of treatment and meal ingestion (Tuesday, Wednesday, or Thursday) was a significant source of variation (P < .05) for total fat, sodium, and fiber.
A separate validation trial was completed with an additional nine female subjects (19 years; 66.7 ± 2.4 kg; 22.9 ± 0.9 BMI) to compare the accuracy of the visual food intake method (percent leftover) with actual intake measured with a digital scale (grams). ICC for food intake using a visual projection and a subsequent visual inspection of the food tray was high with all items and methods demonstrating a correlation coefficient of 0.862 or higher (Table 4).
Intraclass Correlation Coefficient for Percent of Item Leftover Following Visual Projection of Food Tray Digital Image on a Screen or Visually Observation Estimates of Actual Food Tray with Weight
ICC, intraclass correlation coefficient; VO, visually observation; VP, visual projection.
DISCUSSION
In the present study, subjects ingested isocaloric WS and GS, or NS in randomized order on 3 consecutive days 90 min before the presentation of a standardized meal. The premeal VAS for fullness was increased, while hunger and desire to eat were diminished relative to when no premeal snack was ingested, but postmeal VAS differences were no longer significant. The present study is, to our knowledge, the only study of nut ingestion to examine premeal VAS after nut ingestion with a narrow age demographic that matches college freshman, a population also known to experience a narrow window of weight gain.
Several prior investigators have examined how chronic ingestion of nuts alters dietary intent, but their study models, population ages, BMI, and preexisting diseases differ greatly from those of the present investigation. For example, including 48 gof walnuts in a breakfast increased VAS values for fullness and satiety before a subsequent lunch, although caloric intake at the lunch was not reported; however, their study of persons with metabolic syndrome, a BMI (37.0 ± 1.4), and age (59.0 ± 2.0) makes direct comparisons to the present study difficult. 18 Ingestion of whole walnuts relative to walnut butter led to improved increases in fullness and decreased hunger VAS values 15 and 30 min after ingestion by 25 ± 8 years of age subjects 19 ; however, their study was not designed to look at the effect of nuts on food intake following ingestion. In an acute study of 28.4 ± 2.9-year-old subjects with a BMI of 23.1 ± 0.9, the ingestion of 23 g peanuts before a small bagel and juice meal (460 Cal), as with walnuts, they observed that peanuts increased satiety 60 min after ingestion relative to baseline, but differences between treatments were not observed 30 min after the snack had been observed. 20 A study of 48.4 ± 1.0-year-old subjects with a BMI of 22.7 ± 0.3 demonstrated that, similar to the present study, mid-morning almond consumption reduces hunger and increases fullness within 15 min of ingestion, an effect maintained for 90 min until a mid-day meal was consumed, and reduced calorie intake at lunch. 21
Unlike the present acute study where significant postmeal appetite measures were not observed, 24 weeks of mixed tree nut consumption as part of a hypocaloric diet overweight persons aged 30–68 years lead to an increase in postmeal satiety that was associated with weight loss. 22 Peanut-dependent changes in appetite ratings were not observed in the 19-week study of 33 ± 9-year-old study population. 23 When presented with a cold buffet 180 min after a premeal snack of peanuts, 61 ± 6-year-old obese (BMI 31 ± 3) subjects had no snack-dependent differences for hunger and satiety. 24
In the present study with snack calories excluded mealtime total following WS was significantly lower than NS, and mealtime caloric differences between WS and GS trended toward significance (P = .053). Fat intake after WS was reduced relative to both GS and NS (42 ± 3, 46 ± 3, and 47 ± 3 g, respectively). While WS was associated with a reduction in mealtime protein intake, the protein content of the WS (4 g) was nearly equivalent to the reduction in the mealtime protein intake after WS relative to when NS was ingested before the meal (37 ± 3 g vs. 42 ± 3 g). This apparent effect may represent nutrient displacement associated with the higher fat and protein content of the premeal WS.
Walnut ingestion has been associated with nutritional displacement in prior long-term feeding studies of 65.7 ± 6.1-year-old men at 75 g/day, 25 53- to 56-year-old type-2 diabetics ingesting 56 g/day, 26 and 69.6 ± 4.1-year-old men and women ingesting 43 g/day. 27 Peanut ingestion 180 min before a buffet-modeled meal by 61 year old obese (BMI 31 ± 3) subjects had a mealtime displacement that also led to a nut-dependent reduction in total fat. 24 One can speculate about similarities and dissimilarities between our study population and the older population studies describe in these prior studies; however, firm comparisons would be difficult to make. To the best of our knowledge, there are no studies of acute mealtime nutrient displacement following a single nut snack among healthy university aged subjects following a buffet, which represents the condition under which many young university students in the United States eat their meals and which may contribute to the weight control issues loosely termed the Freshman-15.
It is noteworthy that if the caloric content of the snack was included, the treatment effect on total calorie intake was no longer significant (P = .101), nor was significance between treatments observed for the other nutrients analyzed, although including the calories from the snack as part of the meal may not be appropriate. Young people do not consume their meals in a food-service condition over a 105 min period (90 min premeal +15 min for meal ingestion), and snacks are generally consumed to delay the need for a later meal. In this regard, WS and to a lesser degree GS may be useful for promoting mealtime displacement; however, future studies will be needed to confirm the trend suggesting that WS may be better than GS for reducing mealtime caloric intake when snack calories are included.
The gold standard for a feeding study is to weigh each food portion item before and after meal ingestion. In the present study, a digital photo collected in a standard condition was used to measure food intake at a later time. While more complicated remote food photography methods have been used, 28 the present study used a simple standardized visual estimate method that required less than 10 s to make food-tray photographs and a later 60 s period for food intake quantification on a later week for each food tray. This method was validated by the investigators in a separate pilot trial with the use of weight of actual leftovers (grams) and estimates made using digital images of the meal trays projected having an average interclass correlation values greater than 0.9. In addition, this digital image method meant that the investigators did not have to adjust for weight loss due to dehydration as would occur if meal portions were weighed hours after study completion.
Limitations
The review by Blundell et al. 29 highlighted many of the considerations that can affect an appetite study, and walnuts are known to contain fewer bioavailable calories than expected. 30 Dietary standardization while subjects were at home was not attempted before or between the 3 consecutive study days (Tuesday, Wednesday, and Thursday), although a prestudy blood glucose of under 110 mg/dL was used to validate that subjects had probably not eaten for 6 h before the study. Verification of dietary compliance while subjects are at home is difficult and prestudy diet standardization has not shown to significantly affect VAS responses. 31
A GS is not a snack that most dieticians would suggest; however, it is a snack that young people commonly consume, perhaps more than walnuts. The WS and GS snacks were chosen to be isocaloric and approximately isovolumetric (cm3); however, mastication effort as a factor in satiety and hunger could have affected the responses of subjects to WS and GS. Mastication effort of almond ingestion is known to affect sensations of hunger and fullness, as well as lipid bioavailability, 32 and mastication is also known to affect walnut lipid bioavailability. 19 In the present study, subjects were not instructed to masticate in any specific manner but simply instructed to consume both snacks and the 50 mL water wash within 5 min. A more regulated mastication protocol might also have given the subjects cues identifying investigator bias for WS and the purpose of this experiment. However, future studies may wish to consider the use of isocaloric snack pretzels, which would better replicate the mastication force associated with whole nut ingestion as suggested, 33 but at the possible cost of isovolumetric snack sizes.
Another limitation to this study design was that subjects knew the identity of the different treatments that they ingested on each of the 3 days; this could have created bias with respect to their VAS and eating responses following WS and GS ingestion. The investigators attempted to control for this by not indicating to any subjects at any time what the study hypothesis might be, and by using a randomized crossover design for assigning treatment order to each subject. Furthermore, subjects in each treatment (WS, GS, and NS) were isolated in three different rooms, and each room was divided into a premeal waiting area and a meal-eating area to limit visual or olfactory influences on subject meal and VAS responses.
University freshman are at risk of overeating at their school cafeteria buffet and experiencing unwanted weight gain. Snacks have the potential to alter caloric intake at dinner, thereby improving weight management in young people. Snacks can have very little nutritional density such as a gummy candy or they can be a nutrient dense item, such as walnuts, which have a low glycemic index and are rich in polyunsaturated fats and protein. This study of young university students used VAS to determine that a walnut snack 90 min before meal time and to a lesser degree gummy candy can reduce the perception of how much food they want to eat at a subsequent meal. Walnut ingestion also lead to a reduction in total ingested calories total fat and sodium relative to when no snack was ingested, and mealtime caloric intake between the gummy snack and no snack was not significantly different. These findings could be helpful for promoting walnuts as a healthy and nutrient dense snack among young adults to increase satiety before meals with the possibility of reducing food intake during dinner.
Footnotes
AUTHORS' CONTRIBUTIONS
The authors' contributions were as follows: T.W. conceived the study, and contribution authors, L.S.D.V., M.E.L.C., E.M.G., M.J.W., M.D.A., and G.I.S., contributed to design, recruitment, data analysis, and writing associated with the primary walnut trial. M.T.L. was responsible for recruitment and design of the validation trial, with assistance from L.S.D.V. and G.I.S. T.L.H. performed prestudy power analysis estimates and study statistical analysis. T.W. was the primary author of the article, and all authors read and approved the final article.
ACKNOWLEDGMENTS
The authors thank Randy Shadle, Executive Chef of Chartwells Winona (Chartwells Higher Education North America, Charlotte, NC, USA) for preparation of the standardized meals. The authors also acknowledge the assistance of Taylor Hobbs and Rachel Frericks with meal presentation.
AUTHOR DISCLOSURE STATEMENT
No competing financial interests exist.
FUNDING INFORMATION
This study was supported by the California Walnut Commission who provided an unrestricted grant and walnuts for this study, but they had no role in the design of this study or preparation of this article. The WSU Office of Academic Affairs provided travel grant to support data analysis.