
Abstract
Ingeo polylactides are versatile biopolymers made from annually renewable resources and produced since 2001 by NatureWorks at what is now a 150,000 t/y facility in Blair, NE. NatureWorks published ecoprofile data for Ingeo production in 2003, 2007, and 2010. All the ecoprofiles were calculated using the Boustead Model, which has also been used by the European trade group PlasticsEurope (Brussels) since the early 1990s. Since 2011, PlasticsEurope has been updating the ecoprofiles for major fossil-based polymers using different life cycle assessment (LCA) consultants and updated databases. To ensure consistency and ease of comparison, NatureWorks has just updated the Ingeo ecoprofile it published in 2010 using the GaBi (version 6.3) LCA software and the latest available databases. This paper provides a description of the Ingeo production system, the 2014 Ingeo ecoprofile, and the calculation and evaluation of different environmental indicators. The results for primary, nonrenewable energy and greenhouse gas emissions are compared with the latest available data for a selection of fossil-based polymers produced in Europe and the US. This work also discusses topics such as the value proposition of biobased materials, land use for Ingeo production, land-use change, and water use, and also provides remarks about the interpretation of some life cycle impact assessment indicators.
Introduction
Society has slowly begun to realize over the last few decades that it needs to put more effort into sustainable development from an economic(demand for food, feed, energy, and materials), social (need to boost employment and economic development), and environmental (greater emphasis on protection and renewable resources) standpoint. Action is needed to mitigate global climate change and become less dependent on fossil resources. To this end, national and international authorities, non-governmental organizations, and corporations are increasingly recognizing the need to move to a more biobased economy. Rapid technology innovation is enabling this process and making it possible to convert all kinds of biomass into useful materials and products. Bioplastics are recognized as one of the main building blocks in the new bioeconomy.
Ingeo biopolymers, developed by NatureWorks LLC, are biobased polylactide polymers produced in the US and 100% derived from locally abundant, renewable resources. They are used in a wide range of applications, including food service ware; films and sheets; rigid, thermoformed packaging; fibers and nonwovens; three-dimensional printing; and durable products. The intermediate, Ingeo lactide, is used in polymer additives, adhesives, coatings, printing toners, lactates, and surfactants. Ingeo biopolymers are also referred to as polylactic acid (PLA) or poly (2-hydroxy propionic acid). They are produced at NatureWorks' 150,000-t/y manufacturing facility in Blair, NE.
In 2003, NatureWorks published the first cradle-(corn production)-to-polymer factory-to-exit gate life cycle inventory data, also often referred to as an ecoprofile, for Ingeo polylactide production. 1 That paper also gave an introduction to Ingeo production technology, applications, and the life cycle assessment tool as applied to Ingeo. The 2003 data were based on a proposed 140,000-t/y plant design. In 2007, NatureWorks published an updated ecoprofile based on actual data collected from the production facilities, and newer data for the upstream and supporting processes. 2 The 2007 paper also gave a more accurate description of the Ingeo manufacturing system and life cycle assessment (LCA) calculation procedure. It also included NatureWorks's first report on the use of renewable energy certificates based on wind power and the resulting ecoprofile impact. These data, however, are no longer applicable since renewable energy certificates are no longer in use.
In 2010, NatureWorks published its latest ecoprofile. 3 This publication was based on a package of technology improvements, especially advances in lactic acid production made since 1998 as part of a collaboration between NatureWorks and Cargill (Minnetonka, MN). This new lactic acid production technology was implemented in December 2008 and resulted in a reduced environmental footprint. The 2010 publication provided the ecoprofile for Ingeo produced starting in 2009. 3 It also provided a description of the 2009 Ingeo production system and compared the energy requirements and greenhouse gas (GHG) emissions with previous and future Ingeo production systems. The paper also benchmarked the results for energy requirements and GHG emissions with data for a selection of fossil-based polymers.
The data provided in the underlying 2014 report are specific to the corn feedstock currently in use by NatureWorks, and the data are only valid for Ingeo and not for polylactide production in general. The ecoprofile data for polylactides produced elsewhere will be different due to the use of different feedstocks (i.e., sugarcane, sugar beets) and local production practices; different logistics; different technologies for processing sugars for fermentation; different fermentation and polymerization technologies; and different data for electricity and fuels used at all stages. For these reasons, the specific nomenclature “Ingeo” is used in this paper to clearly delineate wherever NatureWorks' polylactide biopolymer is being referenced.
Since the beginning of the 1990s all ecoprofiles published by PlasticsEurope were calculated by Boustead Consulting (West Sussex, UK). In order to make direct comparisons with fossil-based polymers, NatureWorks worked with the same consultancy and used the same methodology, databases, and data lay-out to generate the Ingeo polylactide ecoprofiles. In 2011, PlasticsEurope decided to update the ecoprofiles for the fossil-based polymers using different LCA consultants—Institute for Energy and Environmental Research (IFEU; Heidelberg, Germany) for polyethylene terephthalate; PE International (Leinfelden-Echterdingen, Germany) for polystyrene and polycarbonate; and PriceWaterhouseCooper (London) for polyamides. Thus, NatureWorks began working with PE International to update the Ingeo ecoprofile using PE International's LCA software GaBi (version 6.3) to ensure that meaningful comparisons could be made with the new PlasticsEurope data.
Up-to-date life cycle inventory data are needed by research institutes, universities, retailers, brand owners, and authorities to provide better insights into the environmental performance of the products they use and to investigate and make meaningful comparisons between products. The objective of this paper is to provide detailed ecoprofile data for Ingeo biopolymers of sufficient robustness, integrity, and quality so that LCA practitioners and stakeholders can confidently use the data in their own LCA studies. It must be noted, however, that the production and use of Ingeo biopolymers and products made from Ingeo biopolymers are still in their infancy compared with traditional petroleum-based polymers and products. Therefore, there is significant potential for further reduction in the environmental footprint of Ingeo biopolymers and products made from them over their complete life cycle. This paper reports on the life cycle performance/impacts of the 2014 Ingeo polylactide manufacturing system from cradle-to-polymer factory-exit gate for a 150,000-t production facility.
Switching manufacturing processes (and products) from fossil-based carbon feedstock (oil, gas, coal) to biobased carbon feedstock provides an opportunity for a zero material carbon footprint. 4 Figure 1 illustrates the major flows in the global carbon cycle. In the atmosphere, carbon is present primarily as carbon dioxide (CO2). CO2 in the atmosphere is fixed as biomass during photosynthesis; this process has been going on for hundreds of millions of years and led to the vast resources of oil, gas, and coal that our society relies on at present. Since the beginning of the industrial revolution, these resources have been used at an increasing rate to produce materials, chemicals, and fuels. As a result, much of the carbon stored millions of years ago is now being released into the atmosphere in a very short period of time, geologically speaking. The result is that there is a net translocation of vast quantities of carbon from the earth into the atmosphere, leading to the above-mentioned increase in CO2 levels, which recently passed 400 ppm and continue to rise. 5 The increasing level of CO2 and other GHGs such as methane and nitrous oxide trap more of the sun's heat, thereby raising the average temperature of the atmosphere—including the land and oceans—and leading to global climate change. This process will dramatically affect life on this planet.
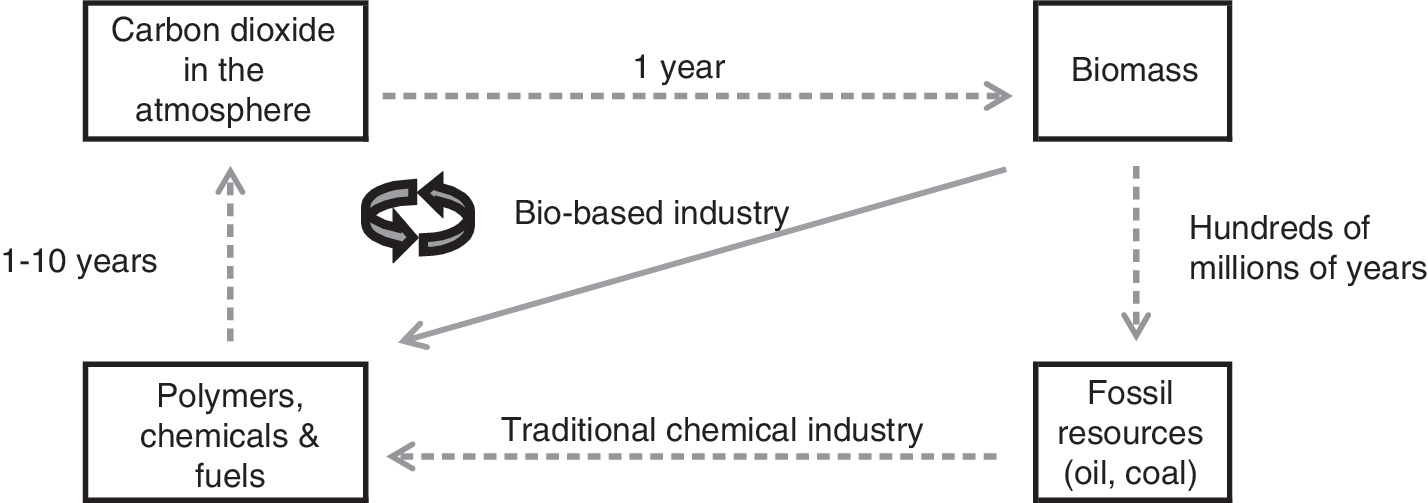
Global carbon cycles. The fossil carbon cycle versus the biological carbon cycle.
The use of fossil resources can, from a carbon point of view, be considered as a simple, linear process. The biobased industry offers an alternative and more sustainable route in terms of material carbon, with biobased resources utilized in a more circular process. The carbon harnessed during photosynthesis is used to produce biomaterials and, depending on the application, is released back into the atmosphere within a period of 1–10 years. Each year, plants once again harness this CO2 to produce biomass, closing the material carbon loop. The key value proposition of biobased materials, like Ingeo biopolymers, is their intrinsic zero material carbon footprint, assuming that after use the carbon in the polymer flows back to the atmosphere by composting or incineration. In other words, the fundamental intrinsic material carbon footprint value proposition for PLA is the CO2 removal from the environment and incorporation into the polymer molecule in harmony with nature's biological carbon cycles. Specifically, the value for PLA is 1.83 kg of CO2/kg PLA. Plastics made from fossil resources cannot be credited with any CO2 removal. 6 The net flux of material carbon for a fossil- and a bio-based product into the atmosphere is illustrated in Figure 2. The figure assumes that both materials are incinerated at the end of their useful life. With each fossil-based item used, the material carbon released to the atmosphere increases by an amount equivalent to the quantity of fossil carbon present in the product, whereas the material carbon released in the case of the biobased product remains zero, since the biobased carbon is again taken up from the atmosphere for the next product cycle. Recycling of fossil-based materials has been considered a long-term solution, but from a material carbon point of view it is just a minimal delay in the process of translocating the fossil carbon from the earth into the atmosphere.
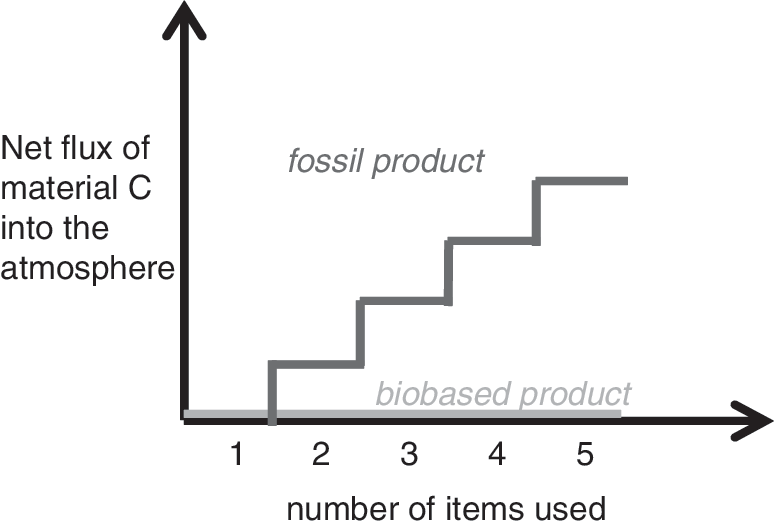
The net flux of material carbon into the atmosphere for fossil- and bio-based products.
Materials and Methods
The ecoprofile data for Ingeo biopolymer production starts with the extraction of raw materials from the earth and ends at the polymer factory exit gate, the stage where the polymer resins are ready for dispatch to the converter/end-user. Ecoprofiles are intended to be used as the cradle-to-gate building blocks for life cycle inventories, which contain the basic data to perform LCAs. All the primary inputs and outputs of all Blair operations are exactly the same as in the 2010 publication, while all the upstream data (e.g., electricity and fertilizer production) are now taken from the GaBi6.3 databases. The final model was built in close cooperation with PE International. In 2014, after finalization of the GaBi modeling work, Kupfer reviewed the model and selected datasets. 7 This report contains new ecoprofile data. The reference flow referred to in this study is 1 kg Ingeo biopolymer, at the polymer factory exit gate of NatureWorks' Blair facility. The study was conducted according to the requirements of ISO14040 and 14044.
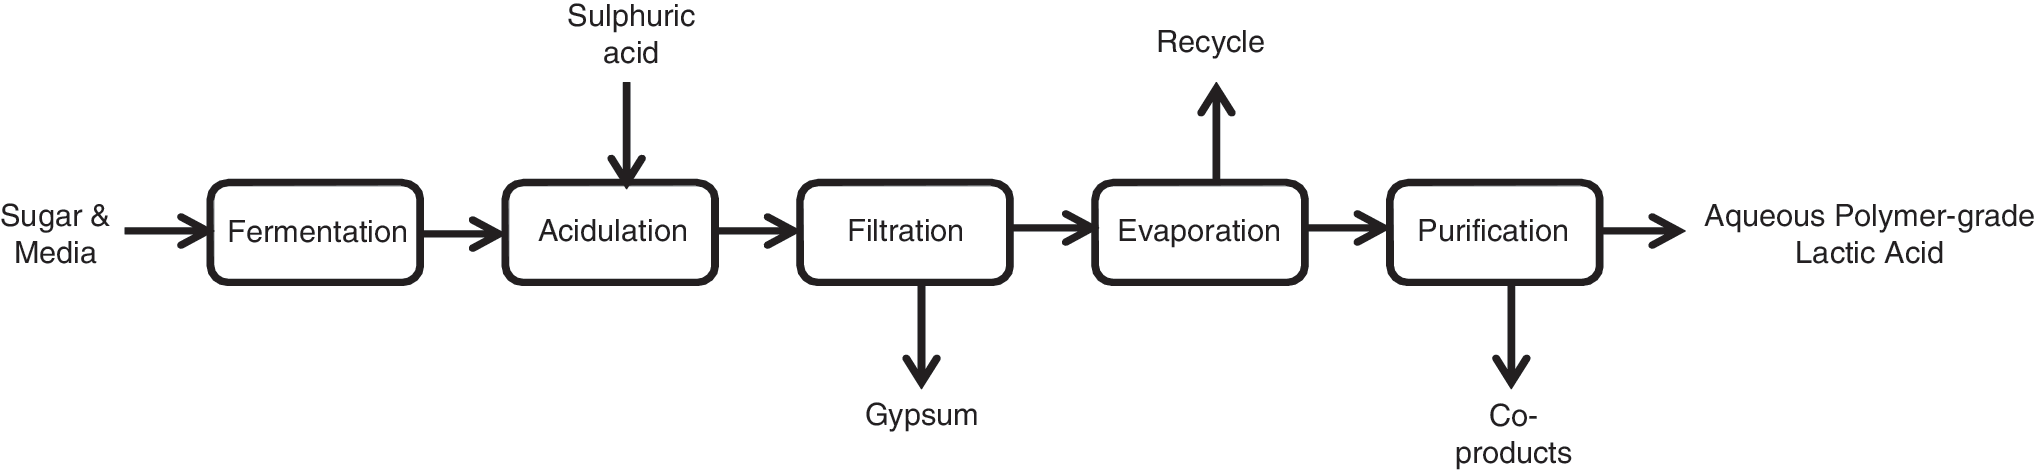
The simplified process flow diagram for the production of Ingeo is given in Figure 3. The production system is divided into five steps: corn production and transport of corn to the corn wet mill; corn processing and the conversion of the corn starch into dextrose; conversion of dextrose into lactic acid; conversion of lactic acid into lactide; and polymerization of lactide into Ingeo polymer pellets. The primary inputs to these five steps are listed on the right and left sides of the flow diagram. In the final ecoprofile all primary inputs are traced back to the extraction of the raw materials from the earth. All the processes included in the calculation of the Ingeo ecoprofile are given within the black lined box in Figure 3. The box surrounding all of the processes represents the system boundary; the ecoprofile is the inventory of all the flows (inputs and outputs) passing this system boundary, including the raw materials from the earth, CO2, water, and the emissions to air, water, and soil. Here only aggregated data are provided to protect the proprietary information of Cargill and NatureWorks.
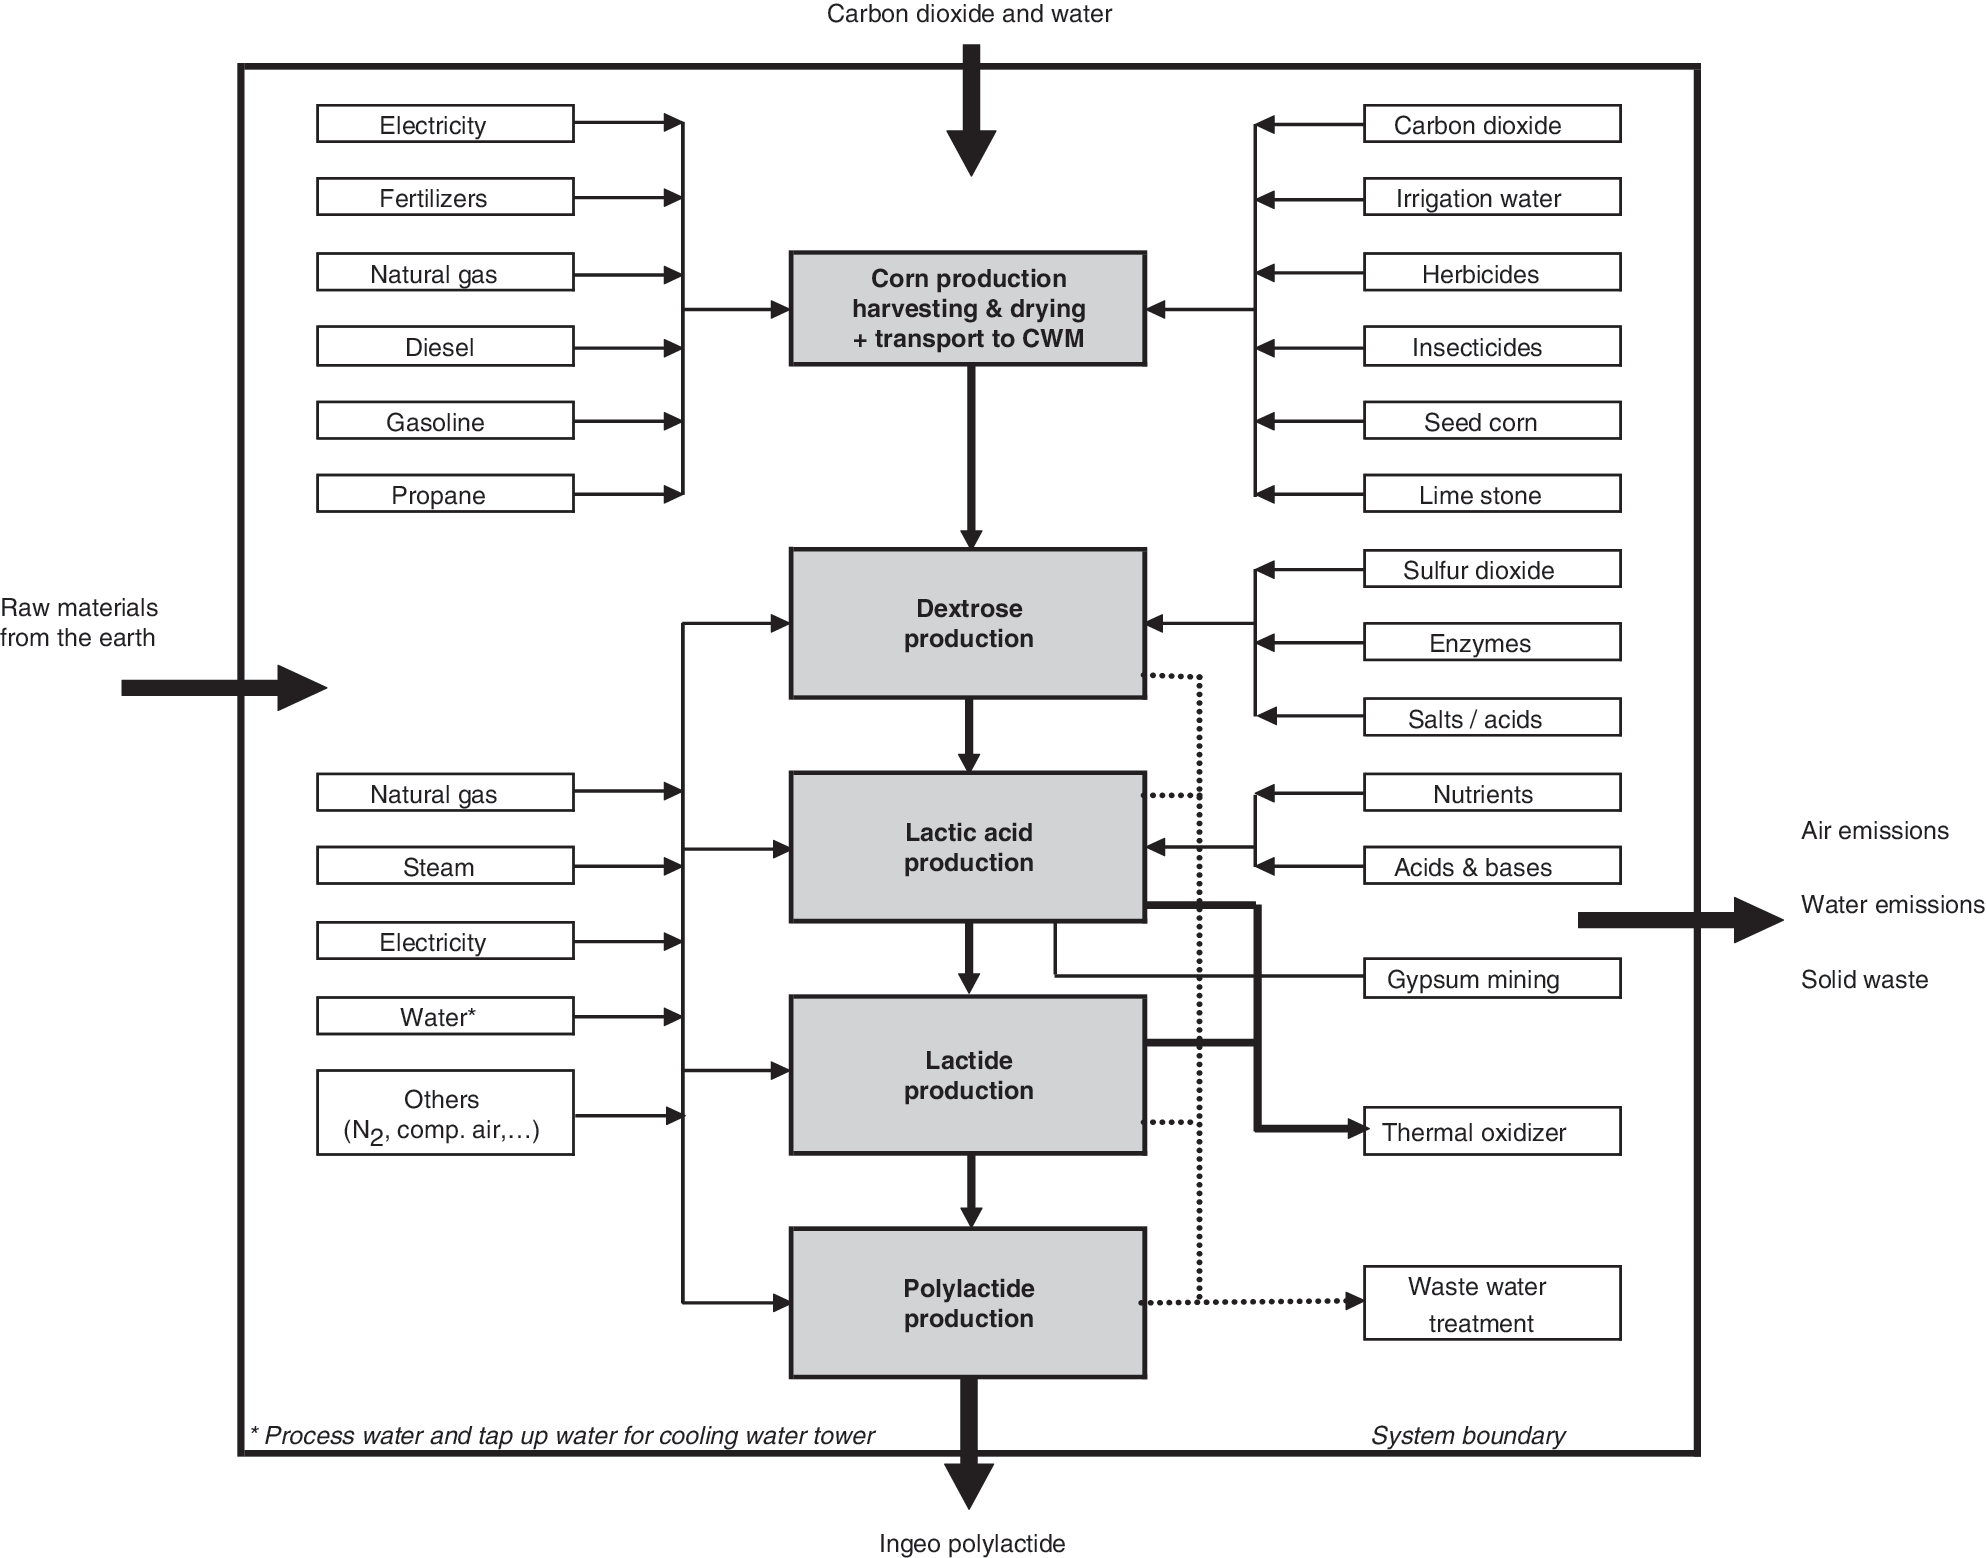
Flow diagram for the manufacture of Ingeo polylactide biopolymers.
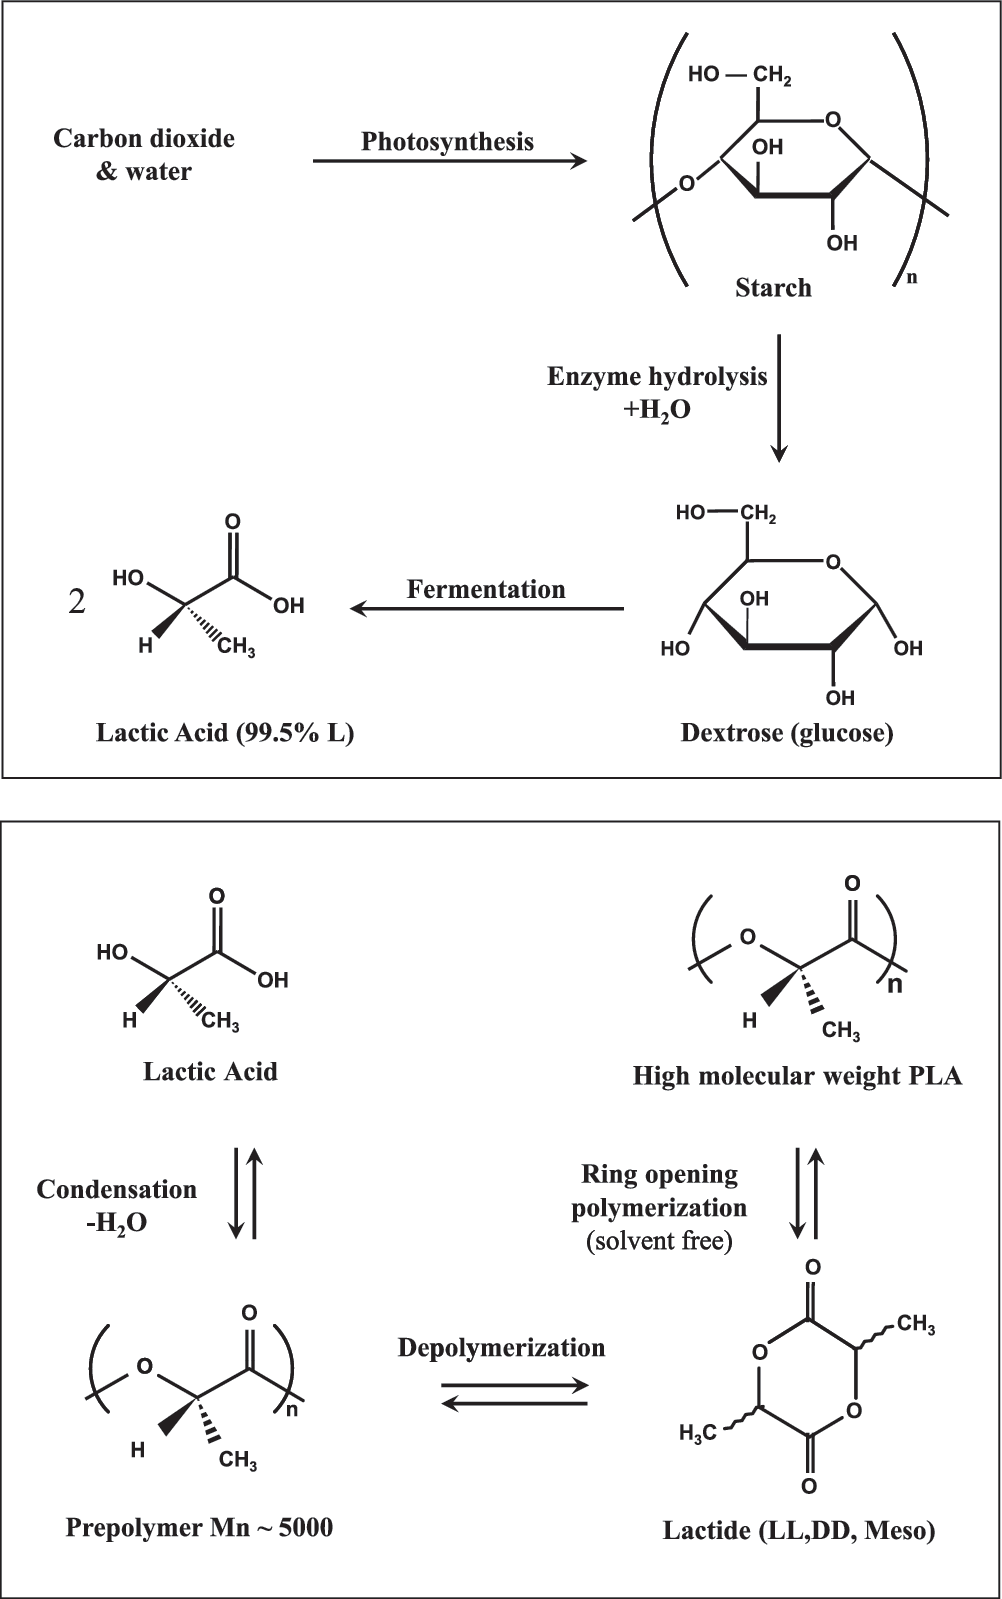
The life cycle of Ingeo starts with corn production; all free energy consumed by the corn plant comes from solar energy captured by photosynthesis. The basic stoichiometric equation for photosynthesis is:
In this equation, (CH2O)n represents simple sugars that are the basic building blocks for all the substances present in the corn plant, such as starch, sugar, and cellulose. Therefore, all the carbon, hydrogen, and oxygen found in the starch molecule and the final Ingeo polymer originates from water and CO2. The data include all the relevant inputs for corn production, including production of corn seed, fertilizers, lime stone, electricity, and fuels (natural gas, diesel, propane, and gasoline) used on the farm; the atmospheric CO2 used through photosynthesis; the irrigation water applied to the corn field; and the production of the herbicides and insecticides used to protect the corn. On the output side, emissions including dinitrogen oxide, nitrogen oxides, nitrates, and phosphates are taken into account. The production of the farm equipment (tractors and harvest combines) employed was investigated, but their contributions are negligible.
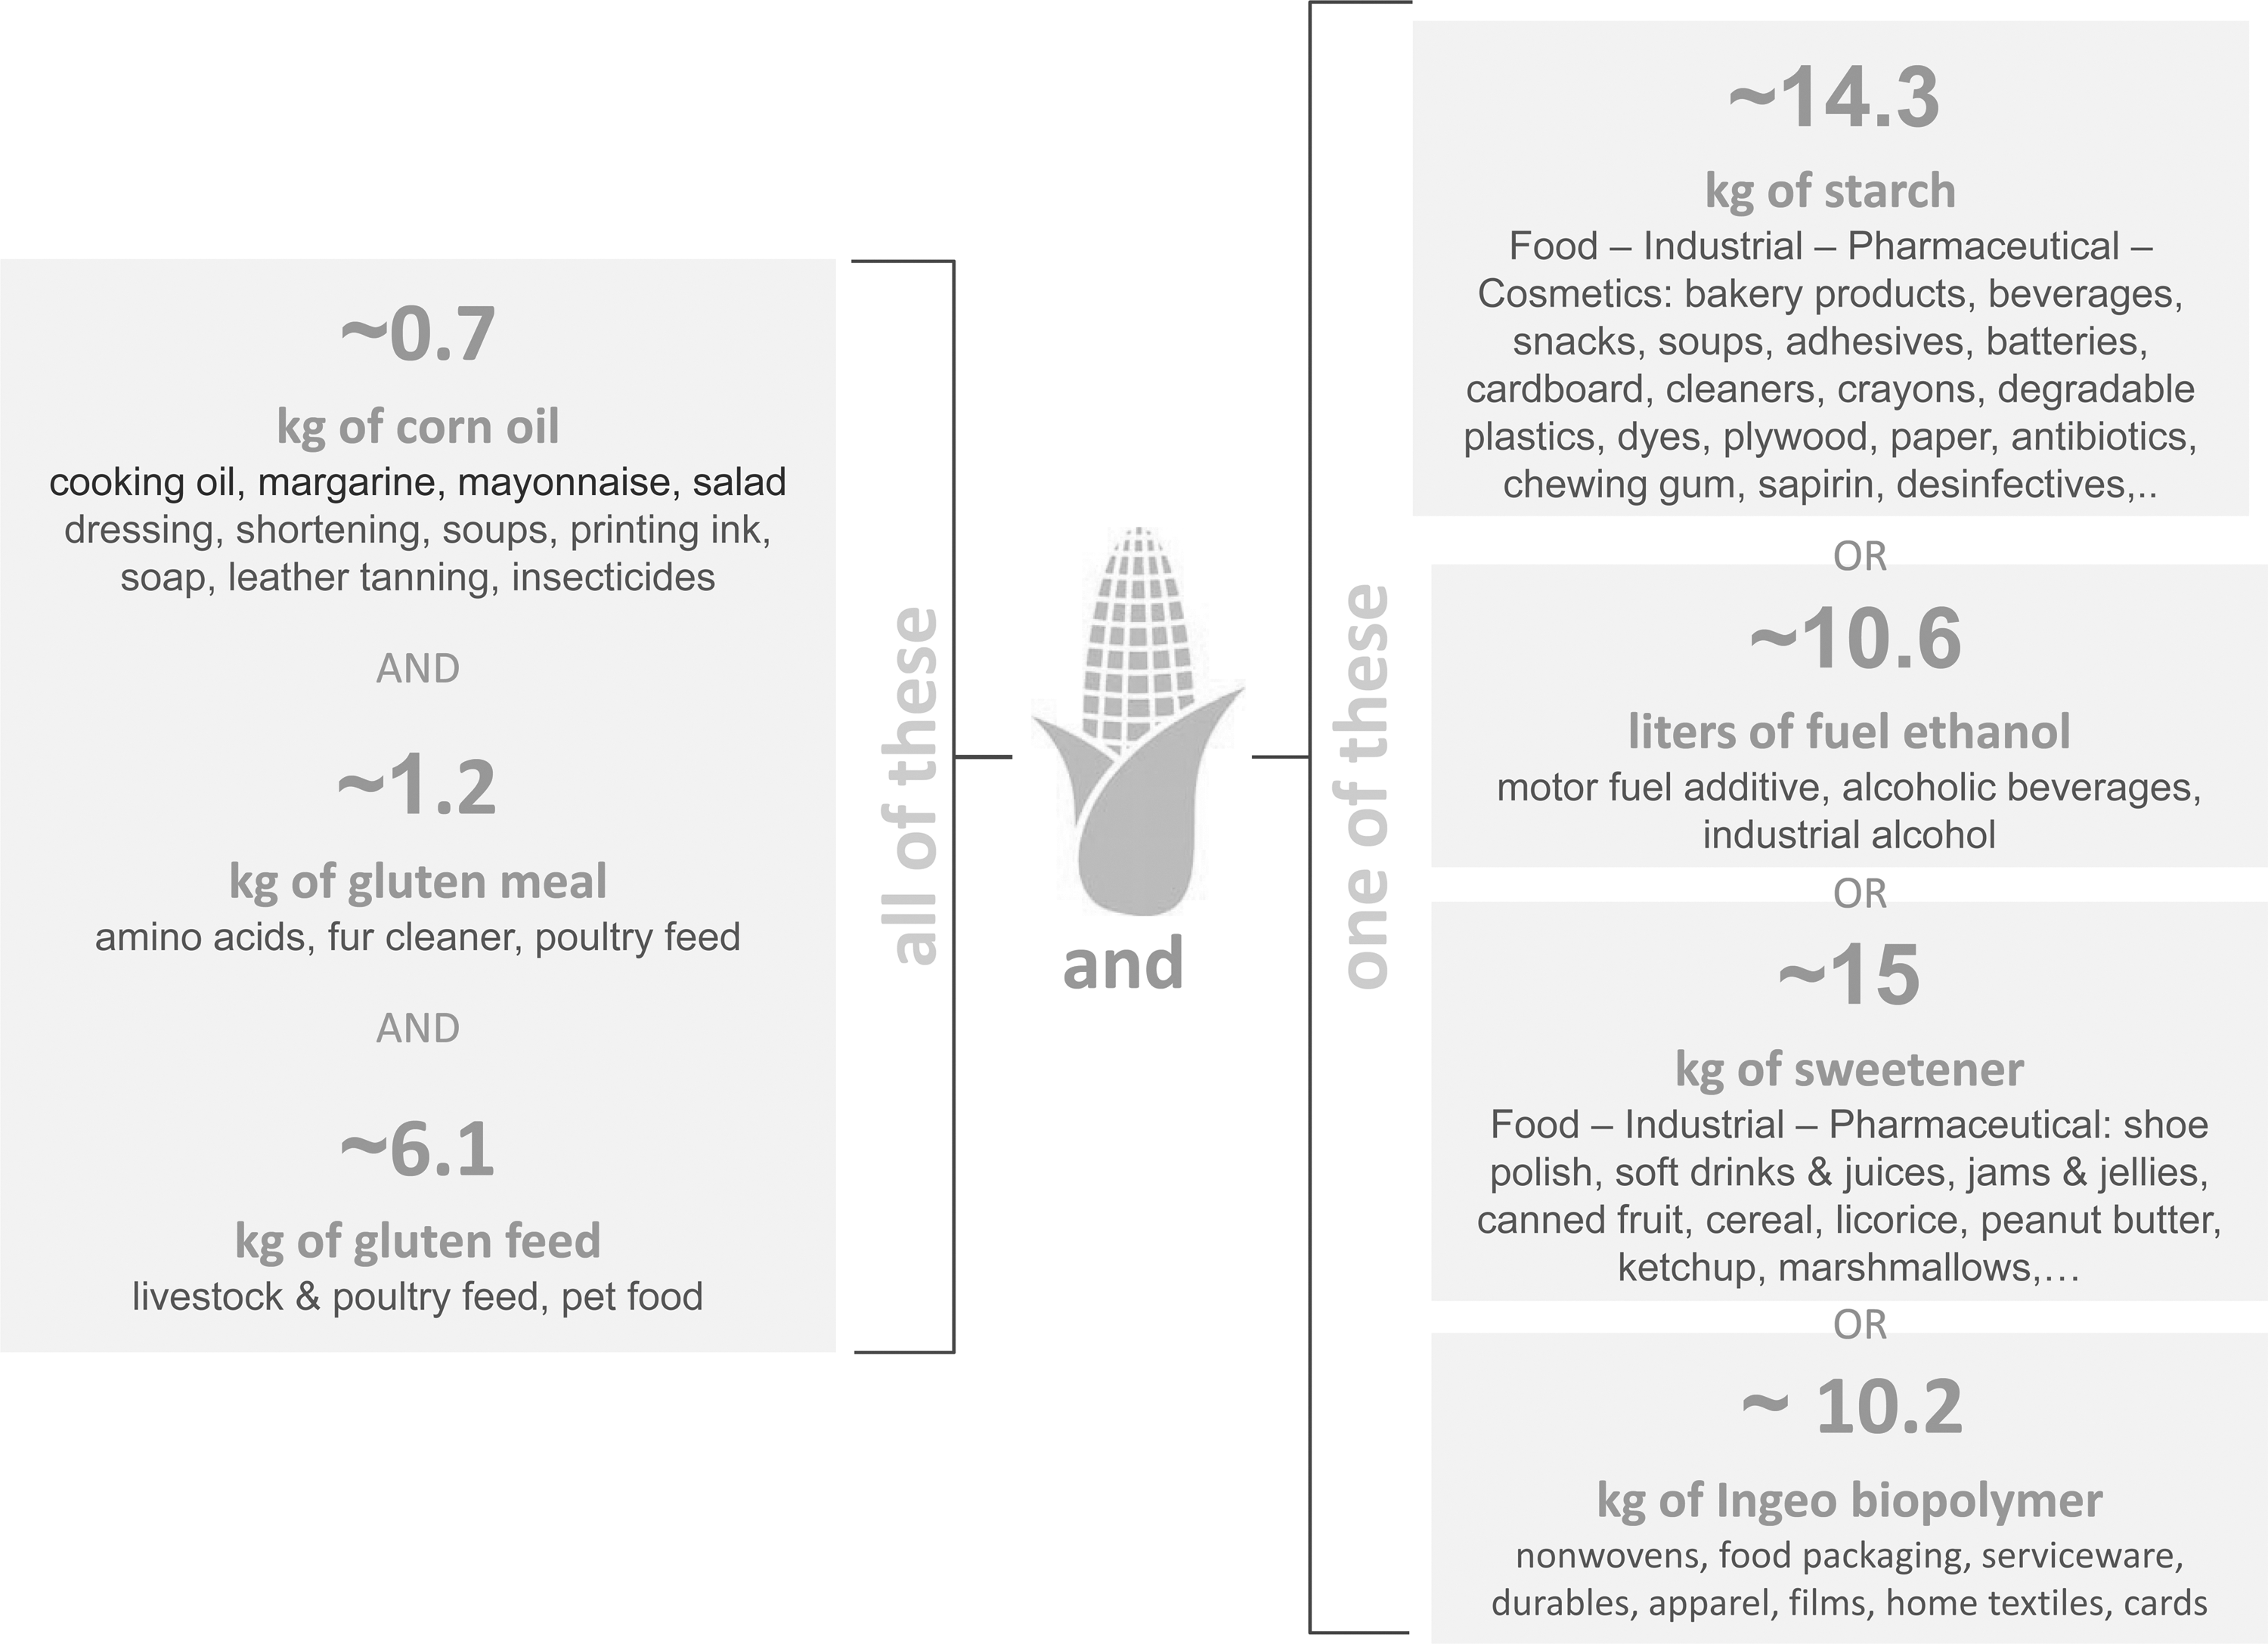
The average life cycle data on corn production were collected from corn producers in the 26 counties of Nebraska and Iowa that supply corn to the corn wet mill. These counties are situated on the borderline of Nebraska and Iowa. 8 NatureWorks uses Yellow Dent #2 industrial corn. This variety is distinct from the the variety that produces considerably smaller volumes of sweet corn used directly as human food. Figure 4 illustrates the products that can be made out of a bushel of Yellow Dent corn (24.5 kg); it is a very versatile raw material used in a wide range of food, animal feed, material, and fuel products. 9
The uses of Yellow Dent #2 industrial corn.
The production of corn is primarily about food and feed and materials. The production of 1 kg Ingeo uses the starch fraction of 2.67 kg corn (15% moisture) or the starch from 400,500 t of corn if running the Ingeo production plant at full capacity. This represents the starch from 0.11% of total 2014 US corn production, which was 361 million t, and 0.04% of world corn production, which was 988 million t in 2014. 9 The corn oil, gluten feed, and gluten meal markets for that 0.11% and 0.04% would remain unaffected and available for other products. For Ingeo production, only the starch fraction of the corn kernel is used, which is about 57% by weight (15% moisture level). 10
After harvest, the corn is transported to the corn wet mill (CWM), where it is split into its components (proteins, fats, fibers, starch, ash, and water), and a part of the starch is hydrolyzed to dextrose using enzymes. The dextrose solution is transported by pipeline to a lactic acid fermentation process, which is colocated at the biorefinery site. The other products of the modeled CWM are corn gluten feed, corn gluten meal, heavy steep water, and corn germ. To allocate all the inputs and outputs to these products, the CWM production process was divided as much as possible, resulting in the identification of 11 sub-processes. For each sub-process, allocation was based on the dry mass of the final and/or intermediate products. The data include all relevant inputs for dextrose production such as the production and delivery of natural gas, electricity, and steam, as well as the production of potable and cooling water, compressed air, chemicals (sulfur dioxide and calcium hydroxide), and enzymes. 10
The CWM, as used in Blair, is an example of a modern, zero-waste biorefinery in which 100% of the feedstock is converted into a portfolio of food, feed, and industrial products. This makes it possible to coproduce food, feed, and materials at the lowest costs possible. The CWM as well as the lactic acid, lactide, and polymer plants are all situated at Cargill's Blair site. Thus, up to the polymer resin, the only significant transportation step is the relatively short distance from the field to the CWM. This is significantly different than fossil-based polymers, for which the carbon source—crude oil—is often transported over long distances to the refineries. Data for a modern CWM representative of the Cargill CWM that supplies NatureWorks were compiled and used for the dextrose-production step. 10
Lactic acid is produced by fermentation of the dextrose sugar. The process, illustrated in Figure 5, combines dextrose and other media, adds a microbial inoculum, and produces crude lactic acid. Prior to December 2008, the pH was controlled to near neutral by the addition of calcium hydroxide. The calcium lactide was then acidified by adding sulfuric acid, resulting in the formation of lactic acid and the precipitation of calcium sulphate (gypsum). This process resulted in near stoichiometric usage of lime and sulfuric acid, relative to the lactic acid produced, and subsequent production of gypsum. The gypsum was removed by filtration, and the lactic acid was concentrated by evaporation. In December 2008, new fermentation technology allowed for operation at significantly lower pH, significantly reducing the use of calcium hydroxide and sulfuric acid, and resulting in significantly lower quantities of gypsum. 11 –13 The small quantities of gypsum produced at current conditions are used as soil conditioners and thus replace mined gypsum. A credit is given for the gypsum mining avoided, but the impact of that is small compared to the total numbers. The process introduced in 2008 also requires less energy.
Lactic acid production process.
After final purification, the lactic acid enters the lactide/Ingeo manufacturing process. Ingeo is prepared through the polymerization of lactide to make polylactide polymer. The process, illustrated in Figure 6, is a continuous process. In the first step, water is removed in a continuous condensation reaction of aqueous lactic acid to produce low molecular weight oligomers, or prepolymer. Next, the prepolymer is catalytically converted into the cyclic dimer lactide and vaporized. The lactide mixture is then purified by distillation and melt crystallization. Finally, high molecular weight Ingeo is produced using ring-opening lactide polymerization. Impurities are removed in the distillation step, and the meso lactide is separated. Afterwards the meso fraction is combined with the NatureWorks' lactide formation and polylactide polymerization process. Steps to Ingeo production. • Steam is produced in natural gas fired steam boilers located at the Cargill site. Make-up potable water is included in the inventory as is electricity use by the steam boilers. • The inventory distinguishes two types of water: irrigation water used for corn production and process water used as a transportation medium, reaction medium, for steam production, and as make-up water to compensate cooling tower losses. • The Ingeo production process chain is equipped with two thermal oxidizers that convert potential organic process emissions into CO2 and water. The natural gas consumption of the thermal oxidizers and its emissions are taken into account as well. • Dextrose and lactic acid manufacturing are water-based processes; some of the water is recycled internally and some is drained (after purification in a waste-water treatment facility, to the surface water/river). Electricity consumption and onsite process emissions (to air and water) are included in the inventory.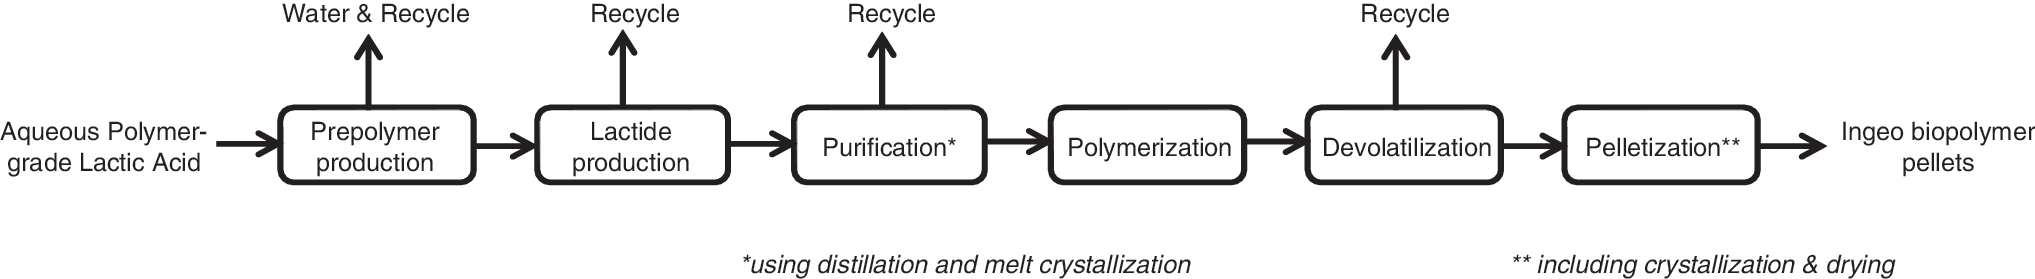
Results and Discussion
The ecoprofile for Ingeo biopolymer starts with corn production and ends at the polymer factory exit gate. The detailed ecoprofile data for 1 kg of Ingeo can be downloaded from the NatureWorks website. 15
GHG Emissions
One of the key global life cycle indicators used in LCA is the Global Warming Potential (GWP). The GWP of Ingeo was calculated using the life cycle impact assessment classification and characterization factors according to CML2001 (latest update April 2013) as provided in the GaBi6.3 LCA tool (December 2014). The results are shown in Figure 8. The total net cradle-to-factory gate GWP is 0.62 kg CO2 eq/kg Ingeo. Figure 8 gives the contributions of the various process steps in the Ingeo production chain. This reporting is in line with the accounting guidelines for biogenic carbon in biobased materials outlined in The European Commission's lead market initiative, the GHG Protocol Initiative, and ISO 14067. 16 The biggest contributor is lactic acid production followed by lactide, dextrose, corn, and polymer production.
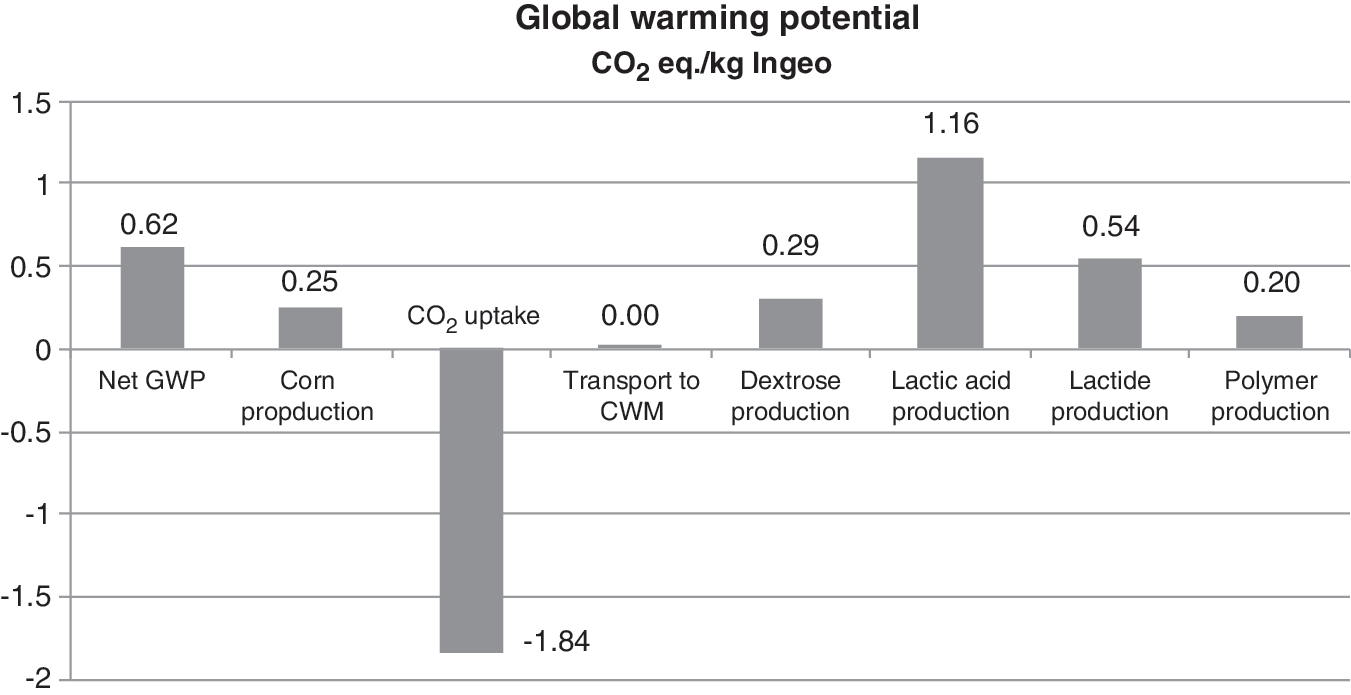
Net GWP for the total Ingeo production system and the GWP per individual production step.
The GHG emissions related to corn production are the emissions related to the production of the operating supplies (e.g., corn seed, fertilizers, lime, pesticides, electricity, and fuels), the emissions related to the use of the fuels (e.g., diesel, gasoline, propane, and natural gas combustion), and the emissions related to the use of fertilizers (e.g., nitrous oxide). The −1.83 kg CO2/kg Ingeo is the net CO2 uptake from the atmosphere and harnessed in the backbone of the polymer—and the key advantage of using renewable resources. The CO2 uptake was calculated using the biomaterial storage approach. 16 Since the carbon content of PLA is 0.5 kg/kg PLA, the net carbon dioxide uptake should be 0.5/12×44=1.83 kg CO2 (where 12 is the molecular weight of C, and 44 is the molecular weight of CO2). Since transportation distances from the corn field to the CWM are relatively short, the contribution to the net GWP is minimal. The GHG emissions of the four major production steps are mainly caused by the production and use of fuels (primarily natural gas in steam boilers and other heating equipment) as well as the production of the electricity required.
Non Renewable Primary Energy Use
Another key global life cycle indicator in LCA is the use of primary energy from nonrenewable resources (PENNR), such as oil, gas, coal, and uranium. PENNR can be expressed by using the gross calorific value, also called higher heating values (HHV), or by using the net calorific value, or lower heating value (LHV). Making a clear choice and using one or the other consistently throughout the study is key in LCA. In the detailed ecoprofile data, the energy inputs are given in LHV. 15 The corresponding HHVs are provided in Table 1. Aggregating renewable and nonrenewable energy values into one cumulative value is meaningless, despite the fact that the units are the same. Of the solar energy (25.34 MJ/kg Ingeo) in the calculation, 98.7% represents the solar energy used to produce the corn. This value is based on an energy content (i.e., the heat of combustion) of corn of 16.3 MJ/kg (15% moisture). The other renewable energy entries are mostly linked to electricity production using these renewable resources. As Figure 9 shows, the choice is significant. An important objective of many companies is reducing the PENNR value and thereby automatically reducing the emissions related to production and use (combustion).
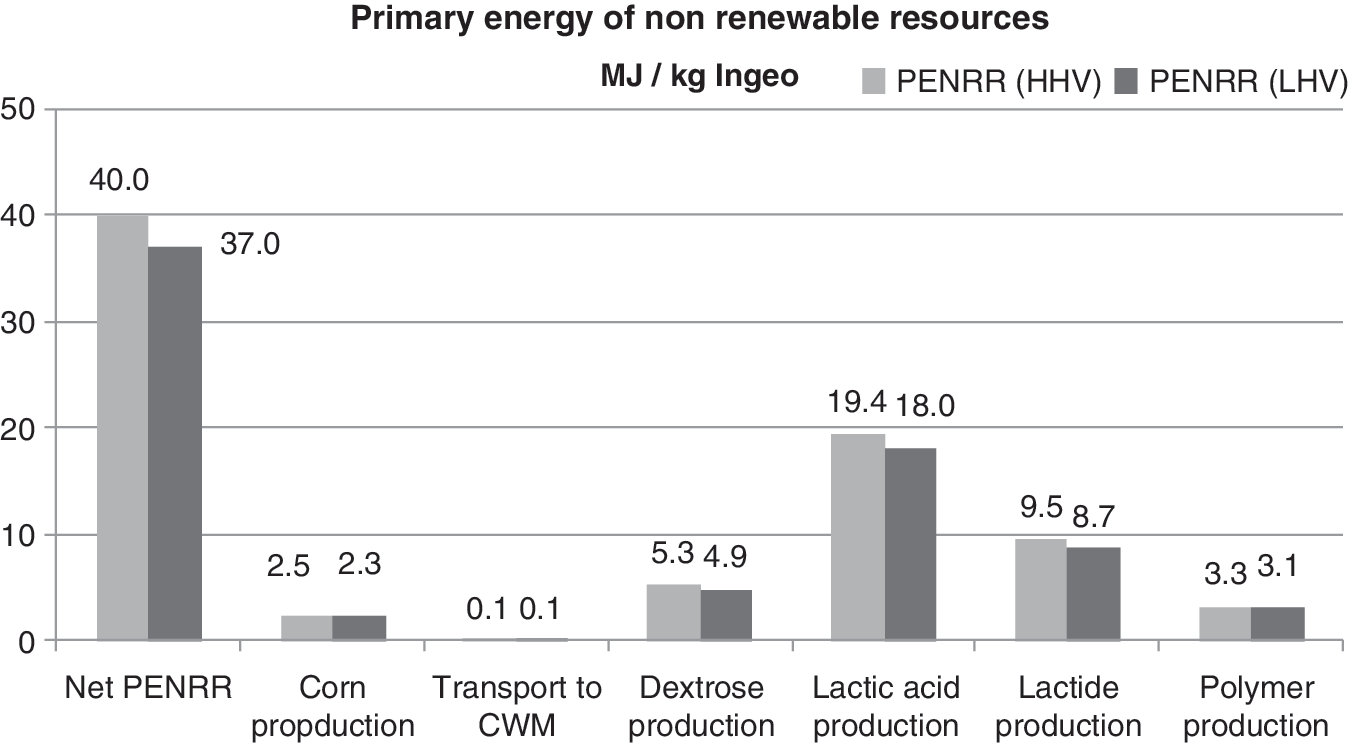
Primary energy from nonrenewable resources for the total Ingeo production system and per production step.
Higher and Lower Heating Values of Primary Energy Inputs
Land Use for Ingeo Production
A range of land use numbers for PLA production exist in the literature. Land use depends on the crop (e.g., corn, sugar beets, sugarcane); the average local/regional yields; the existence of coproducts; the allocation procedure used (e.g., in a CWM); the percentage of sugar or starch in the crop; and, of course, the efficiencies of processing the crop, the starch/sugar conversion, the fermentation and polymerization, converting the original starch or sugar into the final polylactide polymer. In the case of Ingeo, the gross corn use is about 2.67 kg corn (15% moisture)/kg Ingeo. However, 100% of the corn is not used for Ingeo production, only the starch fraction. The percentage of starch in the corn is 57.2%, so the net corn use is 2.67×0.572=1.572 kg corn (15% moisture)/kg Ingeo. 10 The remaining part of the corn (the oil, the gluten, the fibers, etc.)—and thus the land use associated with them—is allocated to the other CWM products (such as corn oil, corn gluten feed, and corn gluten meal). Using an average corn yield over the last 10 years for Nebraska and Iowa of 163 bu/acre, the corn yield becomes: 163×56×0.4536/4048=1.028 kg corn (15% moisture)/m2 (weight of 1 bu is 56 lbs; 1 lb is 0.4536 kg; 4,048 m2/acre). From this it can be concluded that about 1.572/1,028=1.53 m2 land is needed to produce 1 kg Ingeo. Running the Ingeo production plant at full capacity (150,000 t) would mean a net land use of 22,950 hectare. According to Carus and European Bioplastics (Berlin), the available global agricultural area is about 5 billion hectares. 17,18 At full production, Ingeo would need 0.00046% of this land. In 2008, much of this land was in use as pasture ground (71%) or crop land to produce food (5.2%), feed (20.6%), materials (2%), and bioenergy (1.1%). According to Carus, 570 million hectares of free agricultural area were still available in 2006. 17 A corn-based Ingeo production chain of 150,000 t would need only 0.004% of this free agricultural area. However, the global additional demand on land use by 2020 for food, residential area, and biofuels was estimated at 210 million hectares, leaving 360 million hectares free. A corn-based Ingeo production chain of 150,000 t would need only 0.0064% of this land. Even if 10 such plants were built, the impact on land use would remain relatively small.
An extreme case in which all plastics annually produced on the globe were able to be replaced with suitably performing biobased variants was also considered. Today the world produces about 300 million t of plastics. Assuming that their replacement via a biobased route were technologically possible, and that the replacement materials (to a first approximation) had the same land use/kg as PLA, then for these 300 million t only 0.9% of the 5 billion hectares of agricultural land available would be required.
Land Use Change
Land use change or direct land use change is the intentional transition from the original use of land (e.g., forest or grass) to the cultivation of biomass. The land use change effects, from grass land to agricultural land, are not taken into account in the ecoprofile calculations since the land in East Nebraska and West Iowa has been in use for more than 100 years.Modern or current land use change effects, as a result of changes in tillage practices and taking land out of production (e.g., along river sides), can also have a positive effect on climate change by storing carbon in the soil and new vegetation.The positive effects of changing tillage practices were calculated to be a net GHG emissions reduction of 0.1 kg CO2 eq/kg Ingeo. 8 In order to keep a conservative approach, however, it was decided to leave this calculation out of the ecoprofile because of its uncertainty and relatively minor impact.
Other Indicators
A wide range of methods are used for Life Cycle Impact Assessments, with an even wider range of indicators. This study implemented commonly used CML 2001 life cycle impact assessment classification and characterization factors. CML2001 factors were updated in April 2013 and are provided in GaBi version 6.3. The results of the indicators used in the CML2001 method are provided in Table 2.
Values for Life Cycle Impact Assessment Indicators
Water Use
Water availability and usage is of increasing concern in modern society, and therefore water use has become of interest to many stakeholders. In GaBi6.3, total fresh water consumption is dominated by the inclusion of water used by hydropower installations. This hinders a clear insight into the real water flows of the Ingeo production system. Also, rain water quantities, which are very small, are included in the overall GaBi6.3 balance. To obtain a more accurate insight on water flows, both hydropower installations and rainwater are excluded. The overall balance is shown in Figure 10. The first column provides the irrigation water consumption (a total of 20.92 kg/kg Ingeo), of which 4% is taken from the river and 96% is groundwater. What flows back to the river and the groundwater layers is unknown. Hardly any irrigation is used in West Iowa, but some is used in East Nebraska. Irrigation will fluctuate over time, so the calculation is a weighted average representing the draw area for the Blair facility. During corn production there is some river and groundwater use; both are related to upstream processes. In fact, all processes show a minor amount of groundwater use, which is related to electricity, fuel, and material production. No groundwater is used at the Blair facility; all water used comes from the nearby Missouri river. The total intake of river water in the CWM is 12.59 kg/kg Ingeo. A big part flows back, after purification, into the same river; the difference is evaporated or remains with the product in the fermentation facility. The same is true for the fermentation, lactide, and polymer plants. The light blue water is taken from the river, the dark blue water flows back into the river, and the difference is evaporated or recycled internally with product. The total numbers are given at the bottom of the figure. The net water use is given at the far right of Figure 10: 13.22 kg river water (of which 0.84 kg is used in irrigation) and 21.78 kg of groundwater (of which 20.08 kg is used in irrigation). The groundwater not used for irrigation (21.78-20.08=1.7 kg/kg Ingeo) enters the Ingeo production system with the electricity, fuels, and materials used. Of the net river water use, 84% takes place on the Blair side, while 9% is coming into the system with the electricity, fuels, and materials used somewhere in the Ingeo production-related facilities on the Blair side. The remaining 7% is used as irrigation water.
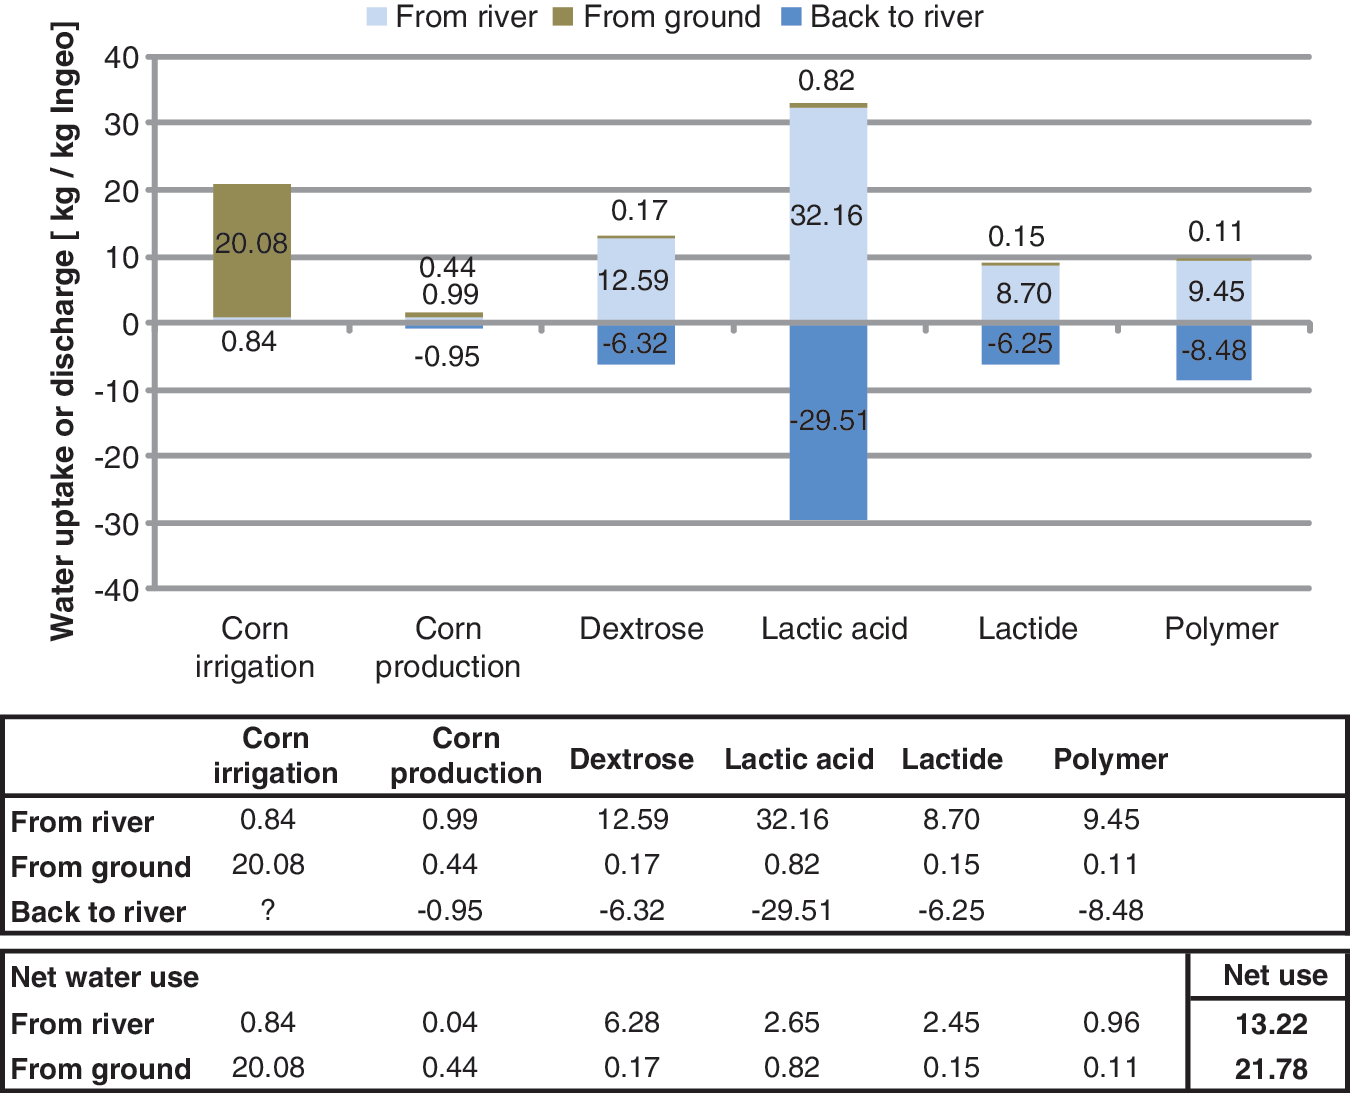
Water-use balance in the Ingeo biopolymer production system.
Benchmarking Using Life Cycle Impacts Assessment Indicators
Scientists generally agree that comparisons of life cycle assessments should always take a full cradle-to-grave perspective, but full LCAs are often limited in their use, i.e., they only compare product A with product B in location X; are valid for period Y; and/or are coupled to a specific end-of-life route. Furthermore, while the results can be valuable, LCA's are typically expensive and time-consuming, and their results often become quickly obsolete when the input conditions and scenarios on which they are founded change. Thus, some simplification is often necessary. Benchmarking on a polymer-pellet basis can be an effective simplification method and give a relatively good first impression of how polymers perform in a certain application if the following are true: • The polymer weights in the studied applications are quite similar (this is often the case, for example, in packaging studies of relatively simple items such as cups, bottles, and containers) • The contributions to impact categories are dominated by polymer-pellet production (this is also often the case in LCAs of plastic packaging) • The energy requirements for converting the polymer into the product are relatively small or relatively similar • The use phase is similar (which is often the case) • The same recycling or end-or-life routes are employed
In the Life Cycle Assessment phase the inventory data are aggregated into a series of impact categories that provide absolute or potential contributions, such as global warming, nonrenewable and renewable energy use, water use, photochemical oxidant creation, acidification, eutrophication, human toxicity, and ecotoxicity. Preconditions for meaningful comparisons in LCA include the following: • Use of the same level of detail in the life cycle inventory data-collection process (especially toxicity-related indicators are very sensitive to this) • Use of the same LCA methodology (e.g., allocation rules, cut-off rules, boundaries) • Use of the same database for upstream inventory data (e.g., for electricity production) • Use of the same life cycle impact assessment methodology, indicators, and characterization factors (+version)
Broadly, environmental impact categories can be divided into three groups:
Group 1: Indicators of global relevance, generally of high reliability and accuracy
Primary energy from nonrenewable resources and global warming are two global indicators; the primary energy is an absolute value and global warming is a potential. Both are of high importance and normally have the highest reliability since the underlying data are usually reported in a relatively accurate way.
Group 2: Indicators of local/regional relevance
Other indicators such as photochemical ozone creation, eutrophication, water use, and acidification are more regional or local indicators; they are indicators of potential regional impact and should be interpreted accordingly. As an example, in terms of the local environmental impact of a process requiring water, there is a big difference depending on whether the process is located in a high drought area or in an area with a large surplus of water. Clearly, water is an example of a local indicator that must be taken in a local context. In current LCA methodology, the local context is often not taken into account, since the calculation models and the required databases are not available. Generally, these indicators are of medium accuracy compared to group 1 indicators.
Group 3: Indicators of local/regional relevance with low accuracy
Indicators like eco- and human toxicity are local indicators showing potential impacts, with medium to high importance, but typically have low to very low accuracy. They are also highly dependent on the level of detail of the life cycle inventory data collected. Often the completeness and reliability of the data are so low that the data are not used by LCA practitioners. One of the reasons that toxicity indicators are usually considered of very low accuracy is that the databases used seldom account equally for all relevant inputs and outputs in the polymer production process. And, ironically, processes for the production of newer biobased materials are often more comprehensively quantified in this regard than are legacy systems for fossil-based materials. Contributions not measured, quantified, or captured in a database could include emissions related to accidents or production practices, such as Deepwater Horizon or the poor oil production practices in the Nigeria delta, respectively. Further, as “easy oil” has largely already been tapped, new oil and gas exploration comes with higher energy use and higher environmental risks (deep sea drilling, oil from tar sands, drilling in the arctic, and oil mining in Nigeria). For all these reasons, if decisions hinge critically on indicators such as these, a deeper analysis–such as in a typical LCA—is recommended. One alternate, non-LCA methodology that might be considered is the use of wholly third-party evaluations such as that conducted by the Cradle-to-Cradle Product Innovation Institute (San Francisco, CA), which includes an explicit evaluation of health and human safety.
European Plastic Production Data
Figure 11 provides the primary energy of nonrenewable resources in MJ (HHV)/kg polymer for a selection of polymers produced in Europe and Ingeo produced in the US. Figure 12 shows the GHG emissions expressed as the GWP in CO2 eq/kg polymer. These are net GWP values from cradle-to-polymer factory-to-exit gate. For Ingeo, the uptake of CO2 from the atmosphere is included, since this takes place during corn production. 19 Since the beginning of the 1990s, PlasticsEurope has published ecoprofile data for fossil-based plastics. 19 These were always calculated using the Boustead Model. The latest values are shown in Figures 11 and 12; the data for the various polymers are directly comparable since they were calculated using the same methodology, the same LCA tool, and the same database for upstream data (i.e., for feedstocks such as oil and gas production, and energy such as electricity generation). Since 2011, PlasticsEurope has been updating these ecoprofiles using different LCA consultants, different LCA tools, and different databases for upstream processes—and electricity is one of the most influential factors, as summarized in Table 3. The PlasticsEurope eco-profile program is coordinated by DEKRA Industrial (Stuttgart, Germany) and the methodology is described in Eco-profiles and Environmental Declarations, Version 2.0. 19 Figures 11 and 12 include the data points for the updated ecoprofiles. New data are not available yet for some of the polymers, as indicated by NA (not available). In this situation, it is less clear how comparable the data sets for the different polymers are currently, since different datasets—Data for Environmental Analysis and Management (DEAM), PlasticsEurope, ecoinvent, GaBi4 and 5, and IFEU—were used for inputs such as feedstock (oil and gas) and electricity production. PlasticsEurope is only publishing industry average data for its polymers. In the case of Ingeo (Table 3), with PE International as the consultant, the market share covered is 100%, GaBi6.3 data were used for upstream data, and the data were published in 2014. However, only for Ingeo are the data company- and location-specific, providing implicitly the highest level of transparency.
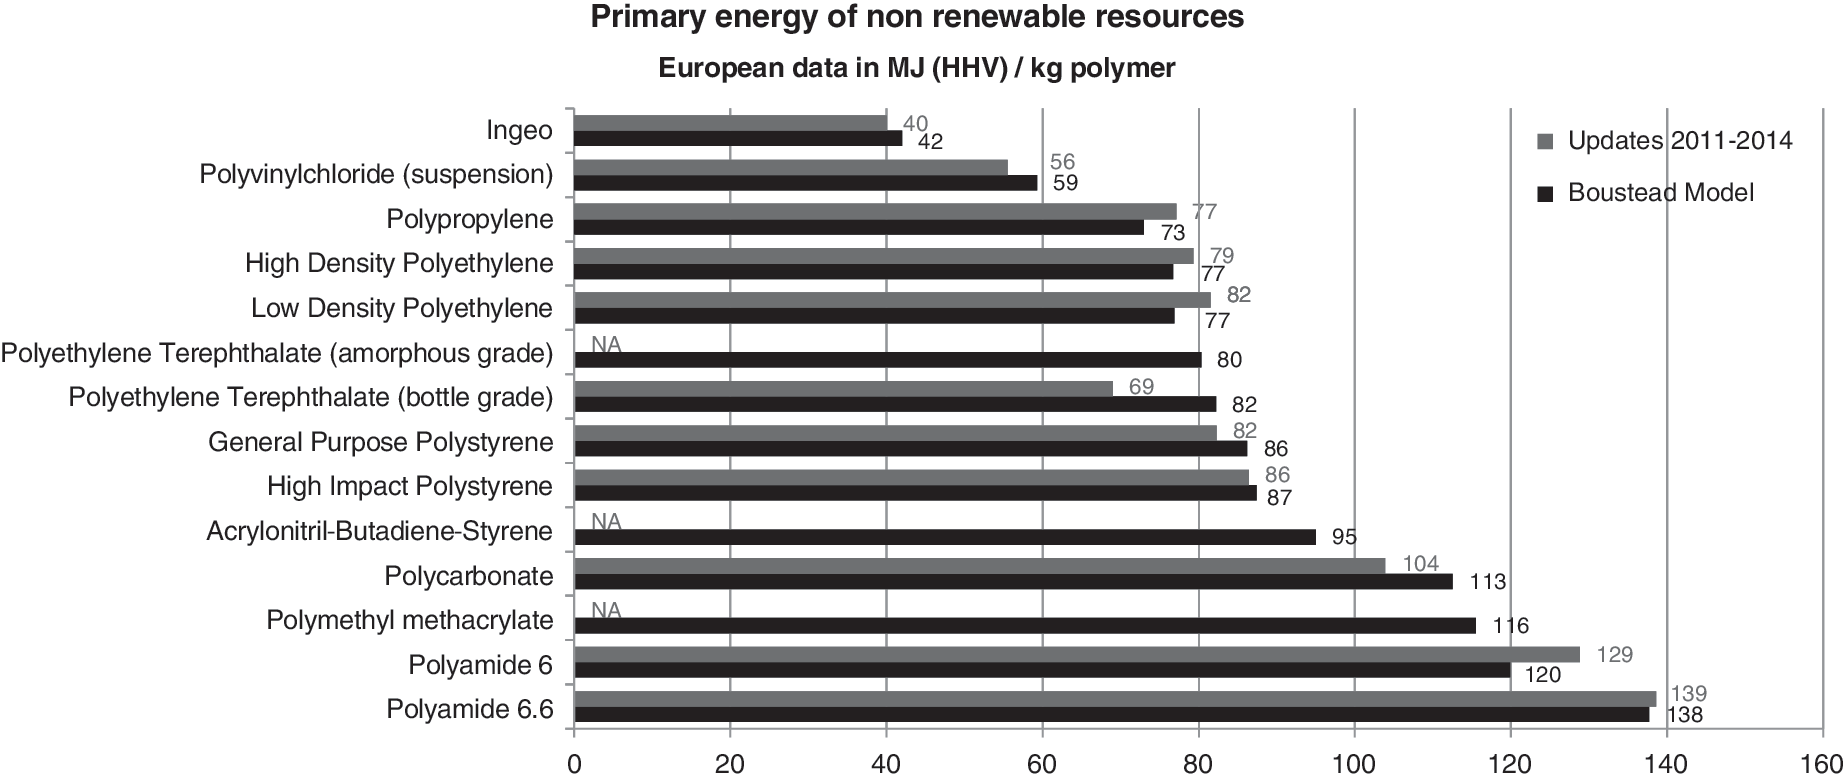
European data; primary energy of nonrenewable resources (MJ/kg polymer, using HHV). Fossil-based polymer data from PlasticsEurope.
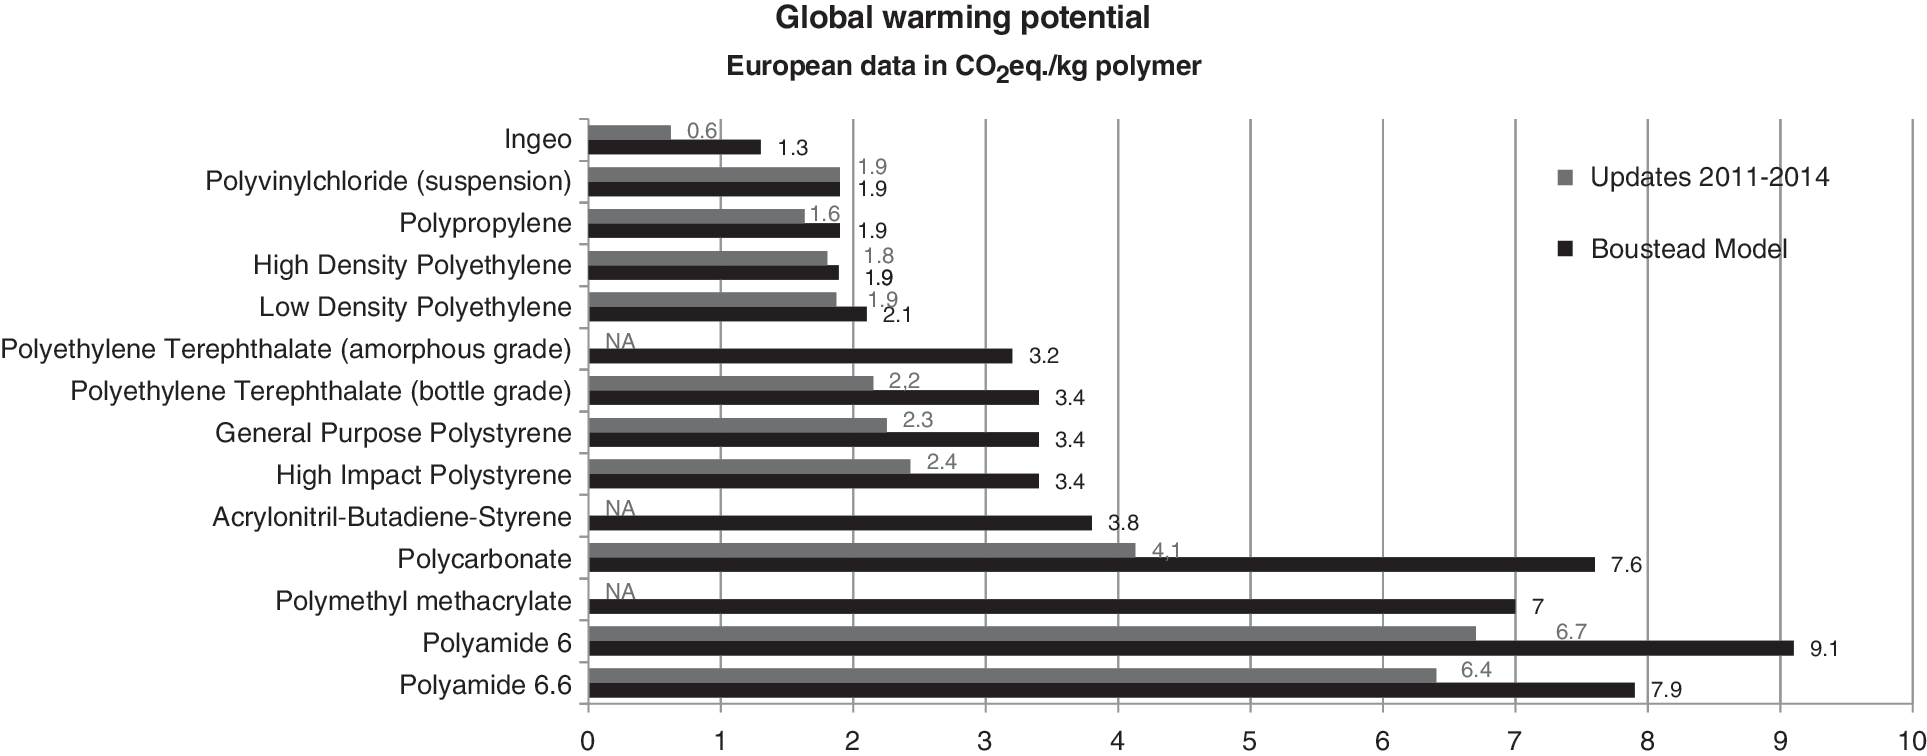
European data; GWP (kg CO2 eq/kg polymer). Fossil-based polymer data from PlasticsEurope.
PlasticsEurope Fossil-Based Polymer Ecoprofile Data
Study performed by IFEU, using the Boustead methodology.
United States Plastic Production Data
In the US, ecoprofile data were published in 2011 by Franklin Associates (Prairie Village, KS) for the American Plastics Council. 20 Figure 13 gives the latest available data for the primary energy of non-renewable resources in MJ (HHV) / kg polymer for a selection of polymers produced in the US. Figure 14 provides the global warming potential expressed as CO2 eq/ kg polymer for those polymers. These are net GWP values from cradle-to-polymer factory-to-exit gate. For Ingeo, the uptake of CO2 from the atmosphere is included, since this takes place during corn production, a process within the system boundary. The US data, as summarized in Table 4, are much older, represent a relatively low market share, and are thus less representative of the polymers currently on the US market compared to the European data.
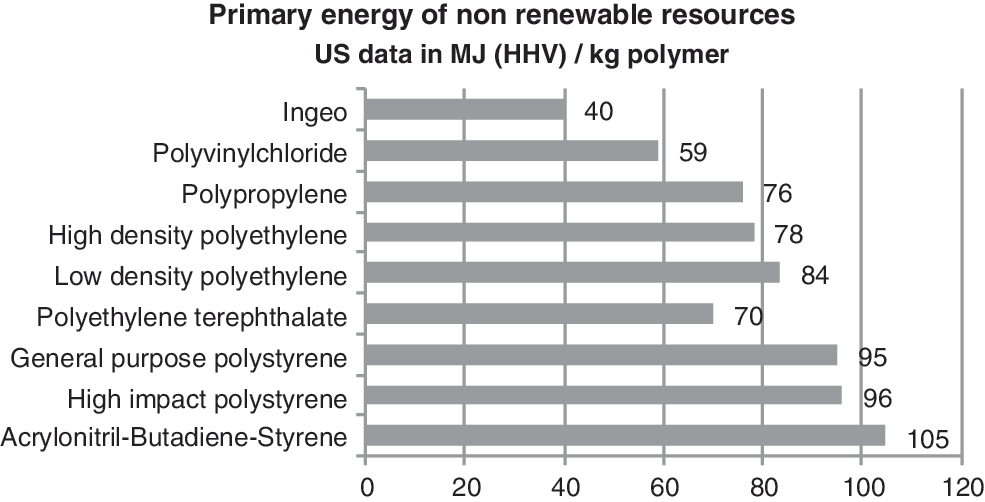
US data; primary energy of nonrenewable resources—Cradle-to-polymer factory-gate. Fossil-based polymer data from Franklin Associates.
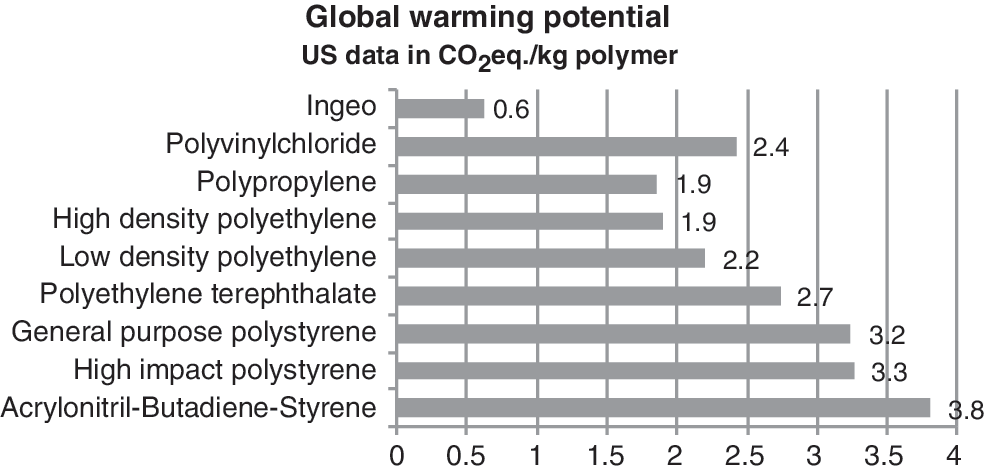
US data; GWP—Cradle-to-polymer factory-gate. Fossil-based polymer data from Franklin Associates.
US Fossil-Based Polymer Ecoprofile Data
European and Us Water Consumption Data
Another important indicator is water consumption. The Franklin study, which provides data for the US, does not provide water consumption data, so a comparison is not possible. 20 Figure 15 provides water consumption data (per 2007) for the European fossil-based polymers as calculated by the Boustead methodology. Despite the fact that these numbers are no longer in use, they appear reasonable and are comparable because they were calculated using the same methodology. For the European data, the 2011–2014 PlasticEurope ecoprofile reports were screened for water consumption. The results are listed in Table 5. It is clear that for the new European data, different approaches were used for calculating and reporting water consumption. Due to these differences, it is not possible to make reliable comparisons.
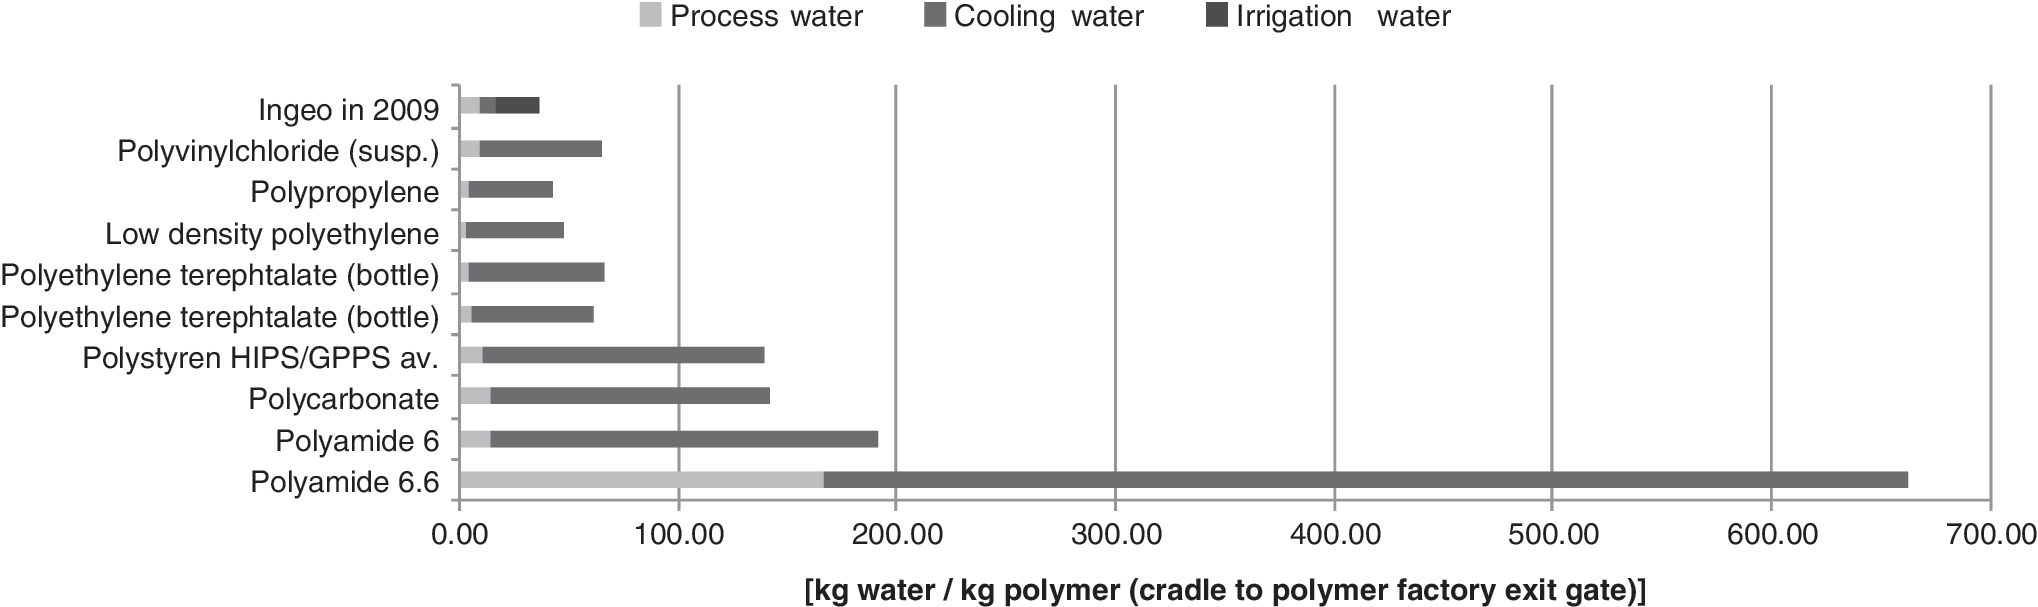
Water consumption data for fossil-based polymer (2007, according to Boustead methodology, data from PlasticsEurope).
PlasticsEurope Data on Water Consumption for Fossil-Based Polymers (Cradle-to-Polymer Factory-Gate, 2011–2014) [kg/kg polymer]
Data not available.
Includes detailed overview of water sources and destinations.
Study performed by IFEU, using the Boustead methodology.
Conclusions
This report provides a detailed description of the different steps in the Ingeo production chain and how the final ecoprofile data were calculated. The basic Ingeo ecoprofile data can be downloaded from the NatureWorks website. Based on these inventory data, a series of life cycle impact assessment indicators were calculated. Finally, the indicators GWP and primary non renewable energy and water use were benchmarked against data published by PlasticsEurope and the American Plastic Council. Benchmarking of water use was impossible because of the lack of data (American Plastic Council) or the inconsistent reporting of data (PlasticsEurope). Benchmarking of other indicators such as acidification and eutrophication should only be done with utmost care, because of the differences in LCA methodologies and the use of different basic life cycle inventory data (e.g. for electricity production).
Ingeo production improvement does not stop here. Undoubtedly the current facilities in Blair will be further improved over the years to come. NatureWorks is also in the process of engineering a second facility outside the US with a focus on Southeast Asia. Independent of its second facility, NatureWorks is also investing in broadening its portfolio of feedstocks. Feedstock diversification supports NatureWorks' goal of utilizing the most abundant, available, and appropriate sources of carbon to produce Ingeo for the local geographic region it serves. This work includes studying the technical and economic feasibility of converting cellulosic-based feedstock (agricultural or industrial waste, wood, or dedicated crops) into sugars suitable for fermentation into lactic acid, as well as direct conversion of suitable carbon sources. As an example of the latter, in 2013 NatureWorks established a joint development agreement with Calysta Energy (Menlo Park, CA) for fermenting methane directly into lactic acid. If successful, direct methane conversion technology could provide an alternative to the current reliance on agricultural feedstocks, greatly simplifying the number of steps and operations needed to convert carbon into performance plastics. This all points to the continuing need for ecoprofile calculations as a means of accurately understanding the impact of supply-chain configuration and looks forward to a future in which an industry average for multiple producers of new polymer systems such as PLA makes sense.
Footnotes
Acknowledgment
The authors wish to thank Katya Druzhinina of PE International for helping us build the Ingeo ecoprofile model in Gabi6.3 and Thilo Kupfer for his critical review.
Author Disclosure Statement
No competing financial interests exist.